Article

Practical Design Method of Yielding Steel Dampers in Concrete Cable-Stayed Bridges

1
State Key Laboratory for Disaster Reduction in Civil Engineering, Tongji University, Shanghai 200092, China
2
China Three Gorges Project Development Co., Ltd., Chengdu 610000, China
*
Author to whom correspondence should be addressed.
Appl. Sci. 2019, 9(14), 2857; https://doi.org/10.3390/app9142857
Submission received: 29 April 2019 / Revised: 12 July 2019 / Accepted: 15 July 2019 / Published: 17 July 2019
(This article belongs to the Special Issue Bridge Dynamics)

Abstract

:

Featured Application

A time efficient method for determining the initial yielding strength of the yielding steel damper applied in cable stayed bridges is proposed.

Abstract

Restrained transversal tower/pier–girder connections of cable-stayed bridges may lead to high seismic demands for tower columns when subject to earthquake excitations; however, free transversal tower/pier–girder connections may cause large relative displacement. Using an energy dissipation system can effectively control the bending moment of tower columns and the relative tower/pier-girder displacement simultaneously, but repeated time history analyses are needed to determine reasonable design parameters, such as yield strength. In order to improve design efficiency, a practical design method is demanded. Therefore, the influence of yielding strength at different locations is studied by using comprehensive and parametric time history analyses at first. The results indicate that yielding steel dampers can significantly reduce the bending moment at tower columns and the relative pier–girder displacement due to the system switch mechanism during the vibration. Meanwhile, the yielding steel damper shows its general effect on reducing relative displacement between all piers/tower columns and the main girder as well, with only a localized effect on controlling seismic induced forces. Furthermore, a practical design method is proposed for engineering practices to determine key parameters of the yielding steel damper.

1. Introduction

Cable-stayed bridges with a floating system (i.e., there is no connection between the tower column and main girder) are naturally seismically isolated structures in the longitudinal direction; hence, velocity-related viscous fluid dampers (VFDs) are commonly installed to restrain the longitudinal displacement during strong earthquake vibration and to release the temperature stress under service load. In the transversal direction, however, traditional tower–girder connections that restrain the movement of the girder by using a transversally fixed but longitudinally free friction plate bearing are commonly designed to meet the requirement of service load, such as wind and vehicles, in China. Therefore, such structural measures may lead to a higher seismic demand on the tower columns and the substructure under transversal intensive ground motions. According to the performance objectives that most current seismic design codes have specified [1,2,3], one solution is to increase the reinforcement ratio of tower columns by a great amount in addition to meeting its static loading demand, which causes engineering inefficiency as well as a rising seismic demand for the substructure, such as the pile foundation. The other is to adopt an energy dissipation system to reduce the seismic demands on the main structure [4,5,6,7].
Over the past decades, many researchers have studied the energy dissipation system and the vibration control of cable-stayed bridges under earthquake excitations, which includes passive control [5,6,7,8,9,10,11,12,13,14,15], active control [8,9,14] and semi-active control [7,8,9,10,16,17,18]. As we all know, passive control does not need external energy. In comparison, active control requires external energy; on the basis of structural response and feedback, the optimal control would be achieved by the optimal control algorithm, and then the control force would be imposed on the controlled structure relying on external energy. It is therefore difficult to ensure that a large amount of external energy can be provided during an earthquake if active control is applied to the structure. Instead, passive control may be a reasonable option.
In engineering practice, the elastomeric bearings and VFDs are usually used alone or simultaneously to control the force and displacement responses, and their effectiveness has already been verified in the transversal direction. However, considering that the cable-stayed bridge may experience large displacement in a longitudinal direction under strong earthquakes, the VFD, though proven to be effective, is difficult to use in the transversal direction [19]. The yielding steel damper (YSD) is another kind of dissipation device, which has the advantages of a lower cost, reliable hysteretic characteristic and a higher initial stiffness that can meet the demand of service load. It has various shapes that can adapt to different structure forms and thus has gained increasing application in recent years, not only in building structures but also in bridge structures [20,21,22,23,24,25]. Generally, a YSD’s specific form can be classified as E shape [26,27], C shape [28,29], X shape [30,31], triangle shape [19,20,21] and pipe shape [24,25] etc. Some new types of YSD have also been developed in recent years [22,23,24,25,32], and their effectiveness in reducing the seismic demands of several types of bridges has also been studied [19,21,26,30,31,33,34]. In particular, the application of YSDs in cable-stayed bridges are investigated [19,20,21,28,35], and one of them has also been verified through the shake table test [19,28].
However, the seismic design of YSDs installed in the transverse direction of cable-stayed bridges requires a time-consuming time history analysis. Additionally, the effect of their design parameters (such as the initial yielding strength of YSD) on the seismic reduction of bridges has not been well studied. Additionally, there exists a conflict between reducing seismically induced displacement and seismically induced force simultaneously for cable stayed bridges [12,13,26] when the energy dissipation system is adopted.
This paper aims to obtain a simple and practical method to design YSDs based on the influence of their yielding strength (Fy) on the seismic responses of the bridge at different locations longitudinally (auxiliary pier, transition pier and tower column). Primarily, a finite element (FE) model should be established based on a real cable-stayed bridge in China. Furthermore, it is necessary to verify the FE model by comparing with the results of shake table test. Then, the FE model would be used to carry out a comprehensive parametric analysis to investigate the influence of Fy on the seismic responses of the bridge. The theoretically appropriate YSD design would be achieved according to a complicated multivariate function analysis or a simplified single variable function analysis in terms of different designed objectives. In order to develop a practical design method, the YSD working mechanism on the cable-stayed bridge is further investigated, and finally a method is proposed to quickly determine the yield strength of YSDs based on the investigation in this paper.

2. The Analytical Model and Input Ground Motions

2.1. FE Modelling of the Cable-Stayed Bridge

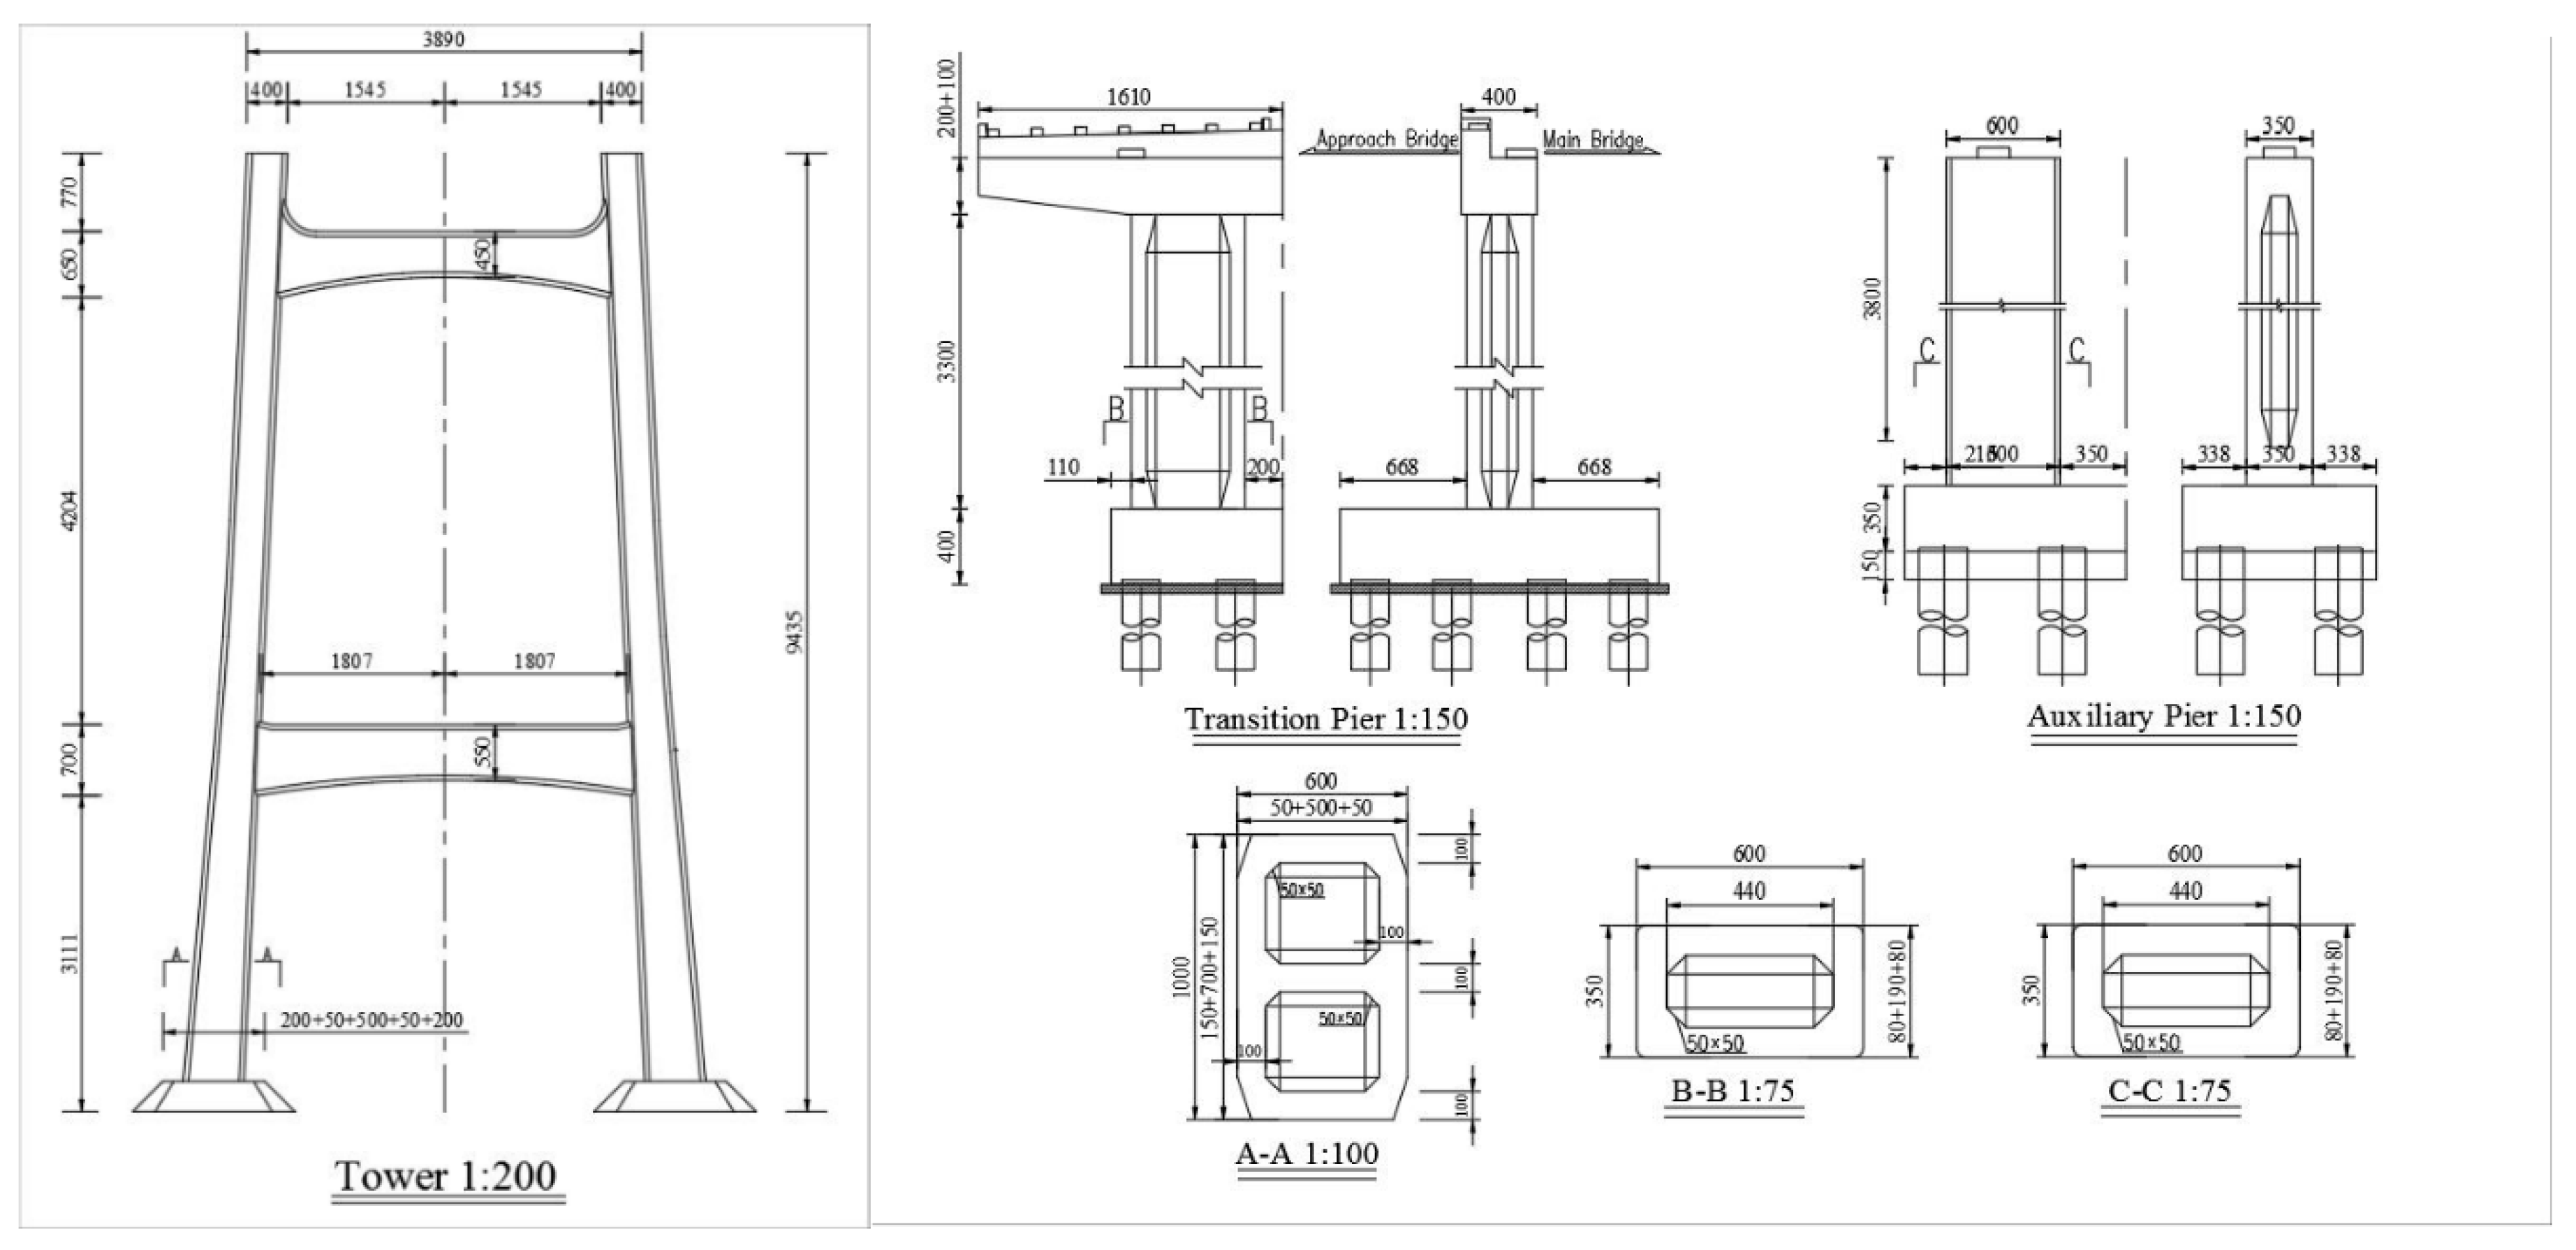
The bridge has two H-shaped reinforced concrete towers with a height of 93 m, and the total span is 640 m with a main span of 380 m and two side spans of 70 m and 60 m, respectively. The elevation of the bridge is shown in Figure 1. The dimension and section of the tower/pier are shown in Figure 2. The major materials and their characteristics are listed in Table 1.
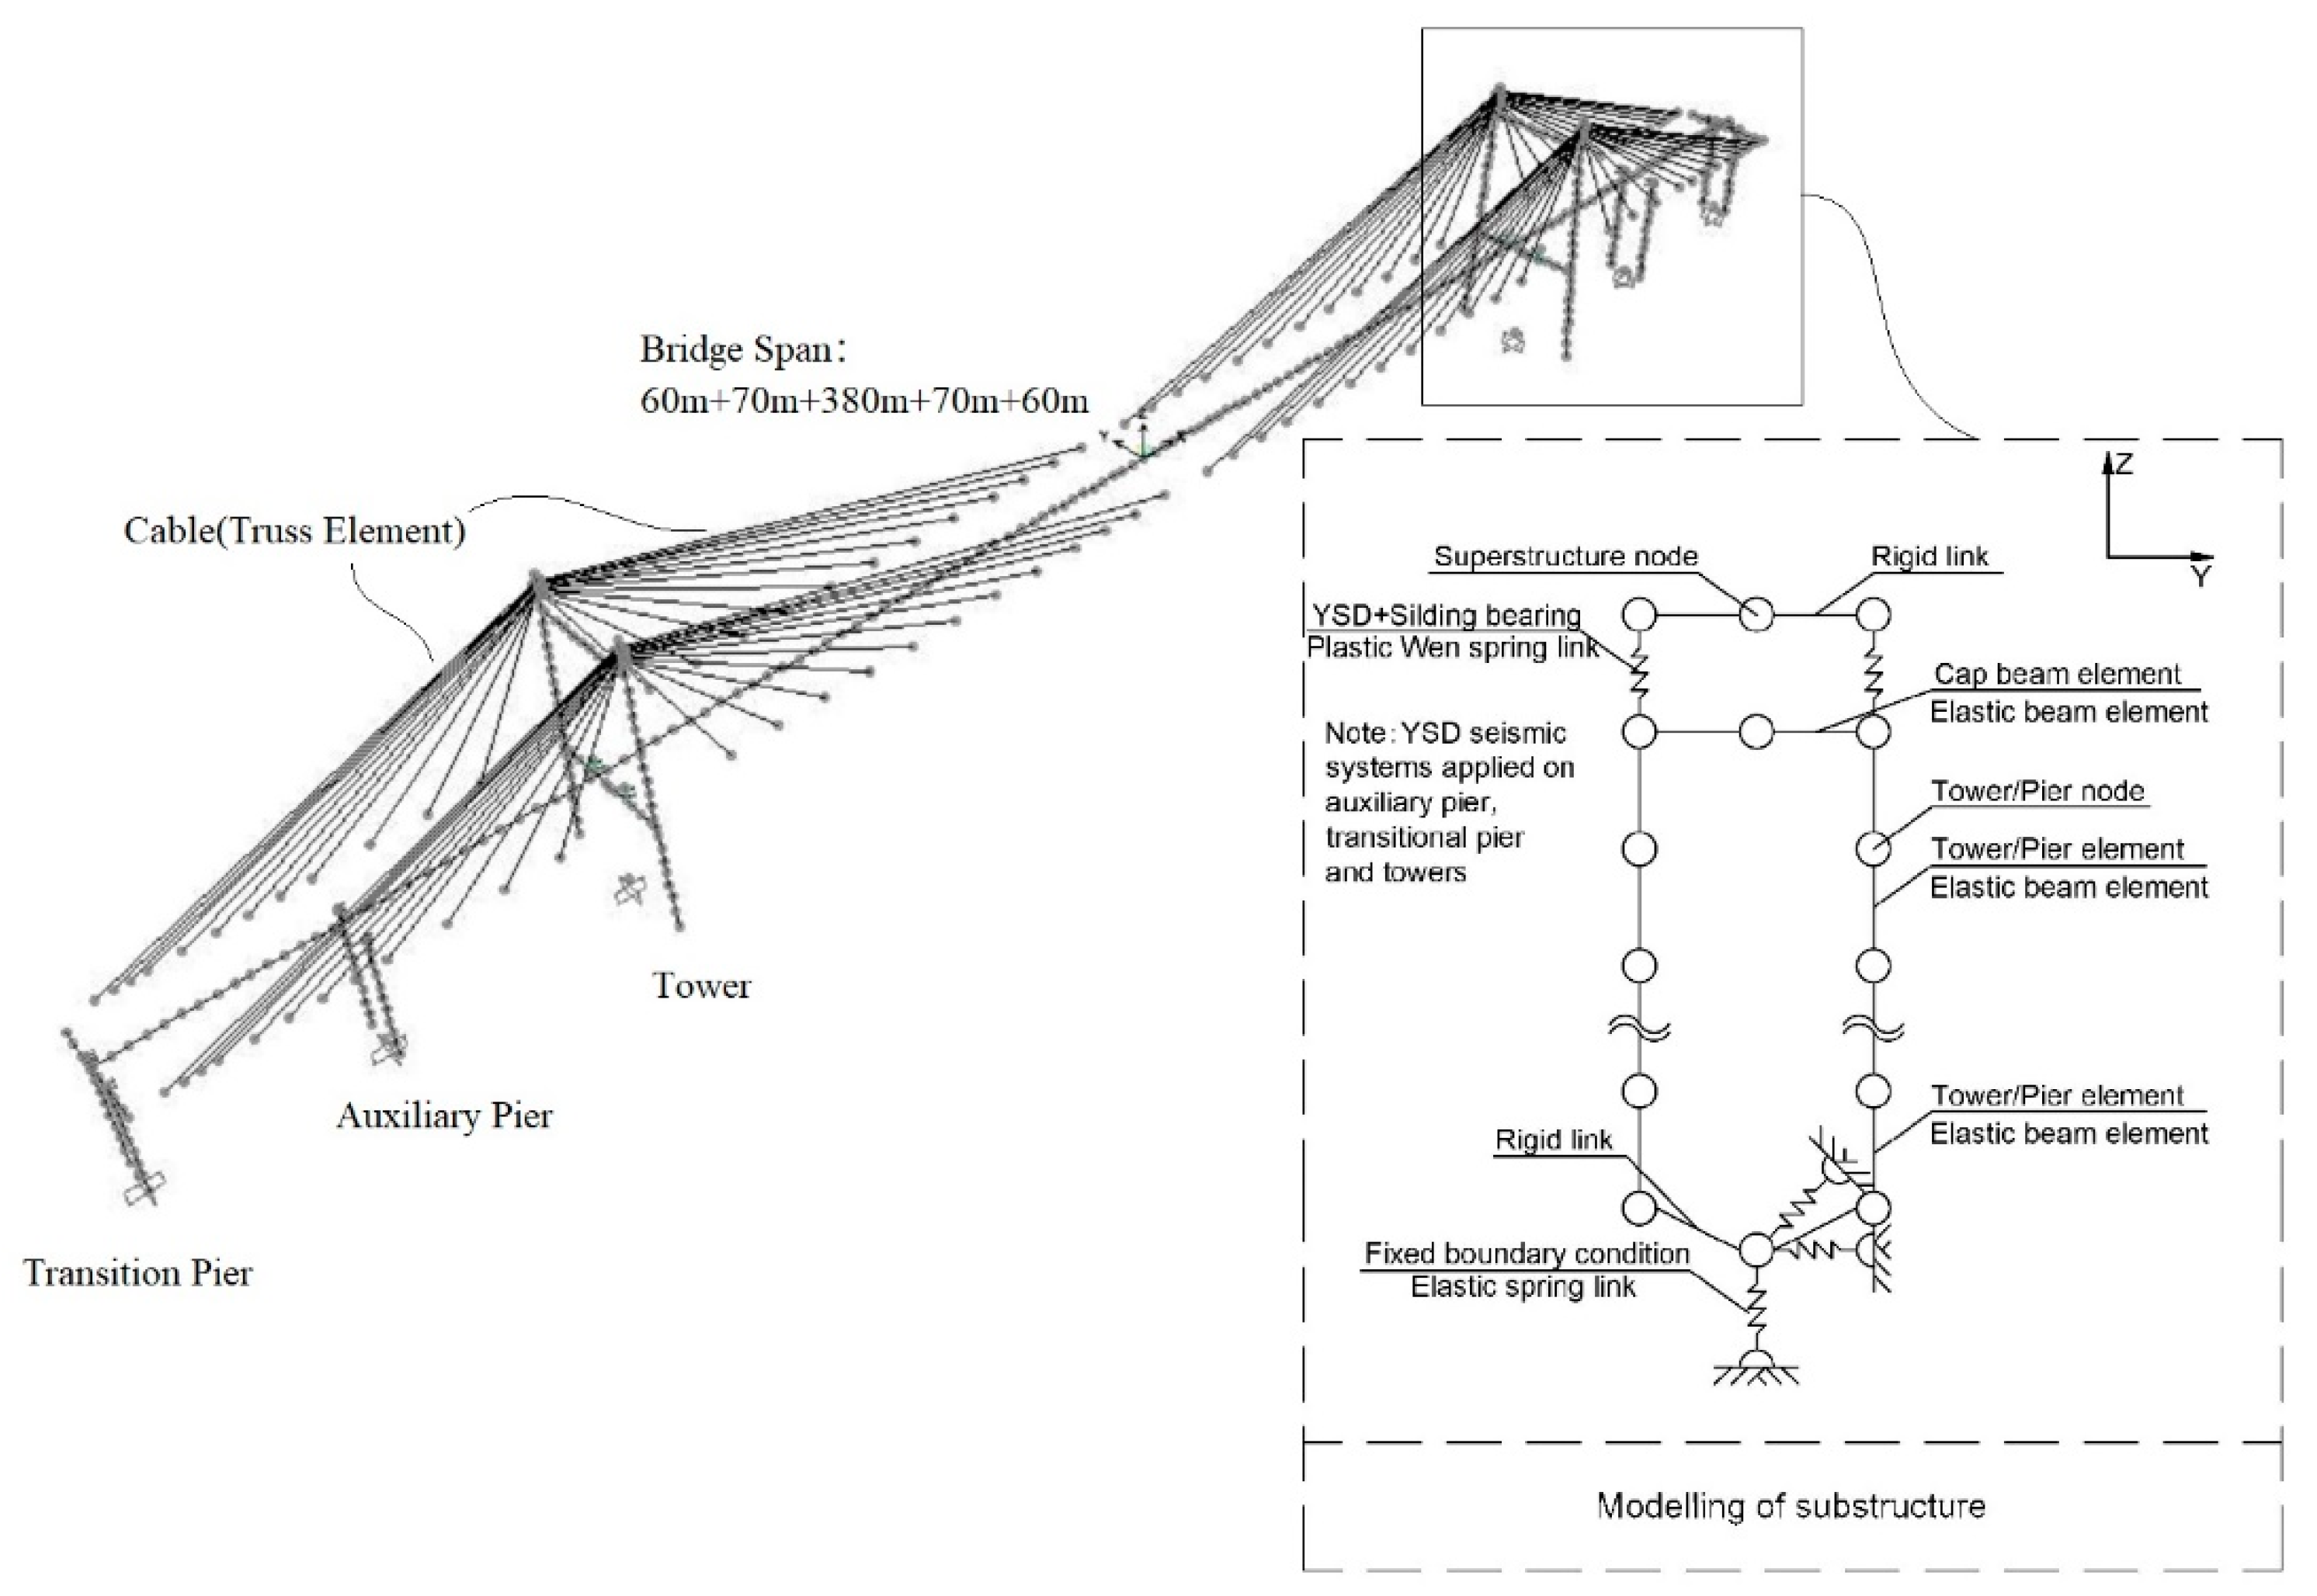
A three-dimensional FE model had been developed in a Structural Analysis Program 2000 version 19.0.0 (SAP2000 v 19.0.0) [36,37]. The simulation of a cable-stayed bridge consists of four parts, namely the girder, the tower/pier, the cable and the boundary conditions. Generally, the girder is equipped with a closed box section with large free torsional stiffness, and a single girder model could be adopted considering the axial stiffness, bending stiffness, torsional stiffness, distributed mass and mass moment of inertia concentrated on the central axis. In addition, the girder would be elastic even under occasionally occurring earthquakes. Simultaneously, the tower/pier is also elastic due to the energy dissipation system. Therefore, the girder and tower/pier could be modeled by an elastic frame element which includes the effects of biaxial bending, torsion, axial deformation, and biaxial shear deformations [38]. Obviously, cables should be simulated by a truss element, and the modulus of elasticity modified by the Ernst formula [39], considering the mechanical properties and the sag effect. For boundary conditions, since only the overall response of the structure is considered rather than the pile–soil effect, the node constraint of SAP2000 can be directly used to simulate the boundary conditions; specifically, both the tower bottom and pier bottom are fixed.
In order to simulate a double-cable-stayed bridge, a rigid arm can be used to connect the girder and the cable; thus, a spine model should be adopted. In the longitudinal and transverse directions, the connections between the girder and the tower/pier are shown in Table 2. The FE model of SAP 2000 in this paper is shown in Figure 3. The girder, tower and pier are divided into around 4-m sections as a unit, and the model has a total of 607 nodes and 447 units.
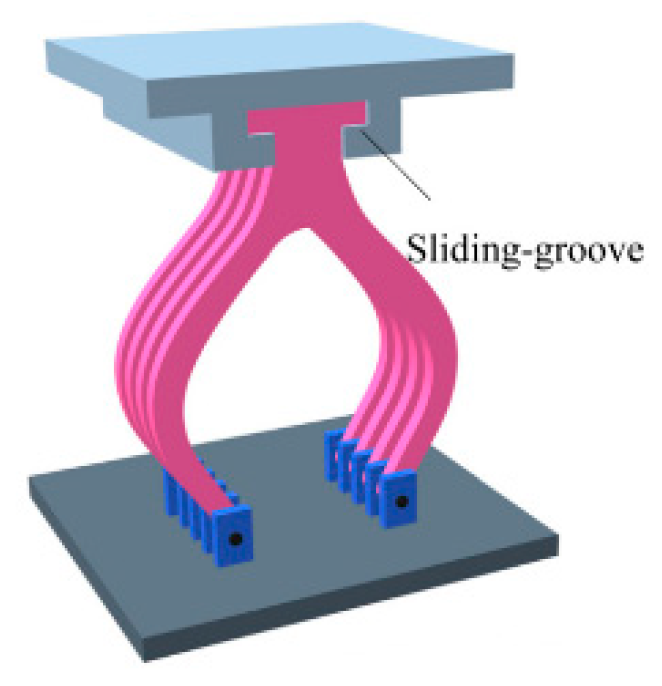
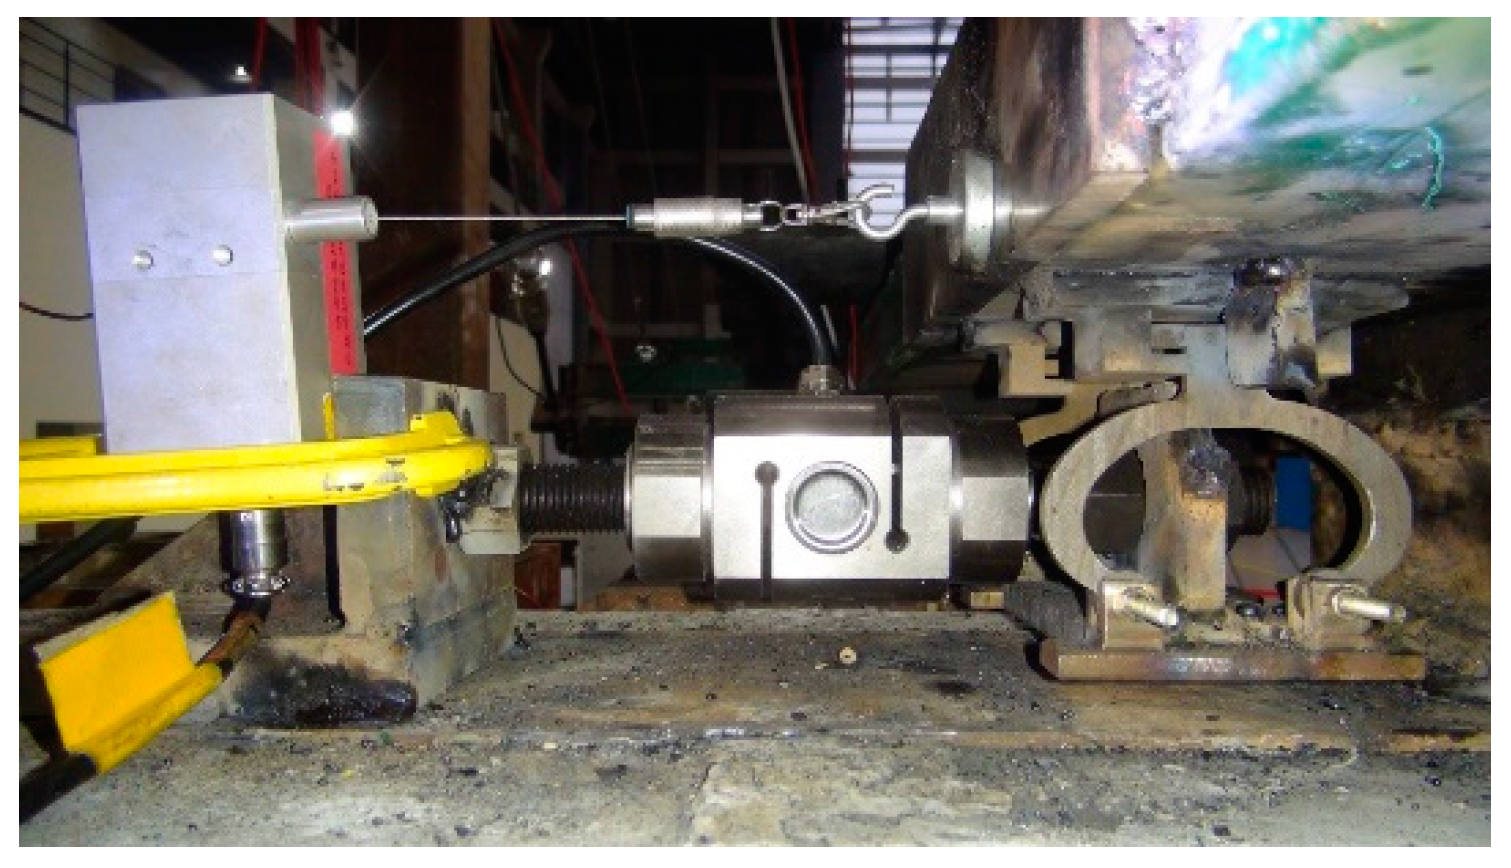
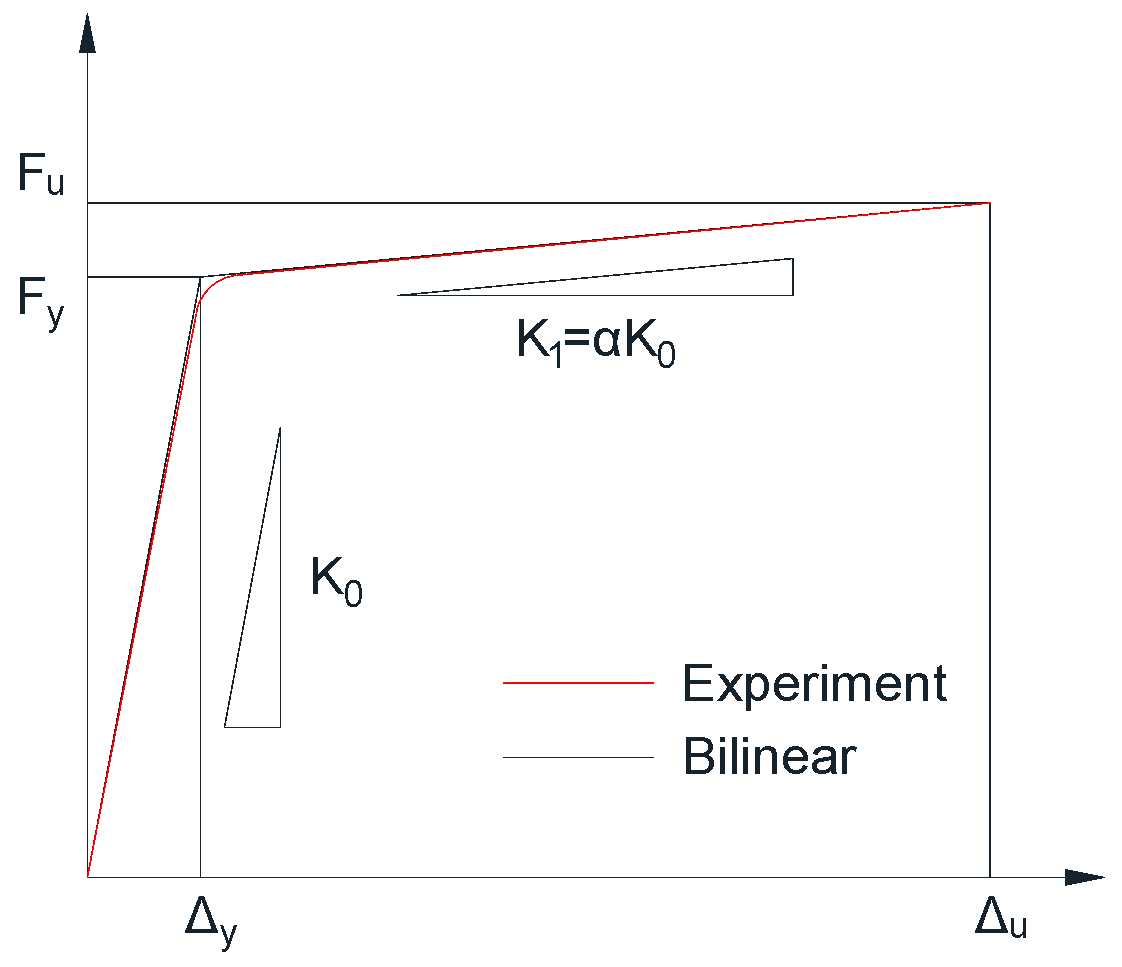
It is necessary to note that ordinary constraints and steel dampers are simulated in different ways. An elastic link element with large stiffness would be employed when the girder is fixed in the transverse direction at the tower locations. By contrast, the simulation of steel damper is relatively complex. As shown in Figure 4, the YSD is connected at the bottom of the deck through the sliding groove to accommodate the deck movement longitudinally. The YSDs are arranged symmetrically on the two sides of the bridge, and their connections at longitudinal locations on the bridge are shown in Figure 4 and Figure 5. The YSD is designed according to the design criterion for steel dampers [29,40,41]. For the wind load and normal traffic loads, the YSD remains elastic and provides enough transverse stiffness. During the earthquake, the YSD starts to deform and dissipate seismic energy inelastically, thus protecting the tower columns and piers. Oh et al. [42] and Domaneschi et al. [7] performed the cyclic tests of the YSD, showing that it has stable hysteretic behavior, and the hysteretic curve is assumed as the bilinear response (Figure 6), regardless of the specific form [19,20,21,24,25,26,30,32]. Therefore, the YSD is simulated by Plastic Wen units in SAP2000, which are bilinear constitutive models. There are four parameters in damper design, namely the yielding strength Fy, yielding displacement Δy, the ratio of post-yielding stiffness to pre-yielding stiffness and ultimate deformation Δu, while the ultimate strength Fu is not an independent parameter. Normally, the Δy is set to 10 mm and the ratio of post-yielding stiffness to pre-yielding stiffness is set as 0.6% (less than 5% depending on the different shapes of products), which can provide good hysteretic performance according to related studies [19,20,21,24,25,26,30,32]. Therefore, Fy is the key parameter which needs to be determined in this bilinear model. It is notable that the ultimate deformation Δu reaches a certain amount in a fabricated YSD product; however, the maximum deformation of the bilinear model is assumed to be unlimited in the analysis so that the influence of Fy on the relative displacement between the super- and sub-structures can be observed.
In addition, it is more accurate to use complex a FE model such as shell elements or fiber elements to better consider the dynamic mechanical behavior of the girder instead of a simplified spine model. However, according to some recent studies [4,28], acceptable dynamic behavior and corresponding seismic responses can be obtained, and we use this model to carry out our comprehensive parametric study of the proper yielding strength of the applied steel dampers for time efficiency.

2.2. FE Model Validation

Additionally, a shake table test of the bridge model with a scale factor of 1/20 was conducted [27]. Before the parameter analysis of the yield strength of the YSD, it is necessary to prove the correctness of the model without YSDs; therefore, the numerical results were compared with the shaking table test results.
As is well known, whether a dynamic analysis or static analysis of cable-stayed bridges is conducted, nonlinear geometric effects must be taken into consideration, including the cable-sag effect, P-Δ effect, and large displacement effect [43]. The gravity-nonlinear static analysis should be conducted before dynamic analysis, because there would be large tension forces in the cables due to dead load, which would prevent the cables from becoming slack under seismic loads and influence the structural stiffness. Nonlinear direct integration with the Newmark iterative method [44] has been employed in nonlinear time-history analysis. Two key parameters for this method, gamma and beta, are 0.5 and 0.25, respectively. In addition, Rayleigh damping [44] has been adopted to consider the structural damping, and the mass proportional coefficient and stiffness proportional coefficient are 0.082 and 0.0084, respectively.
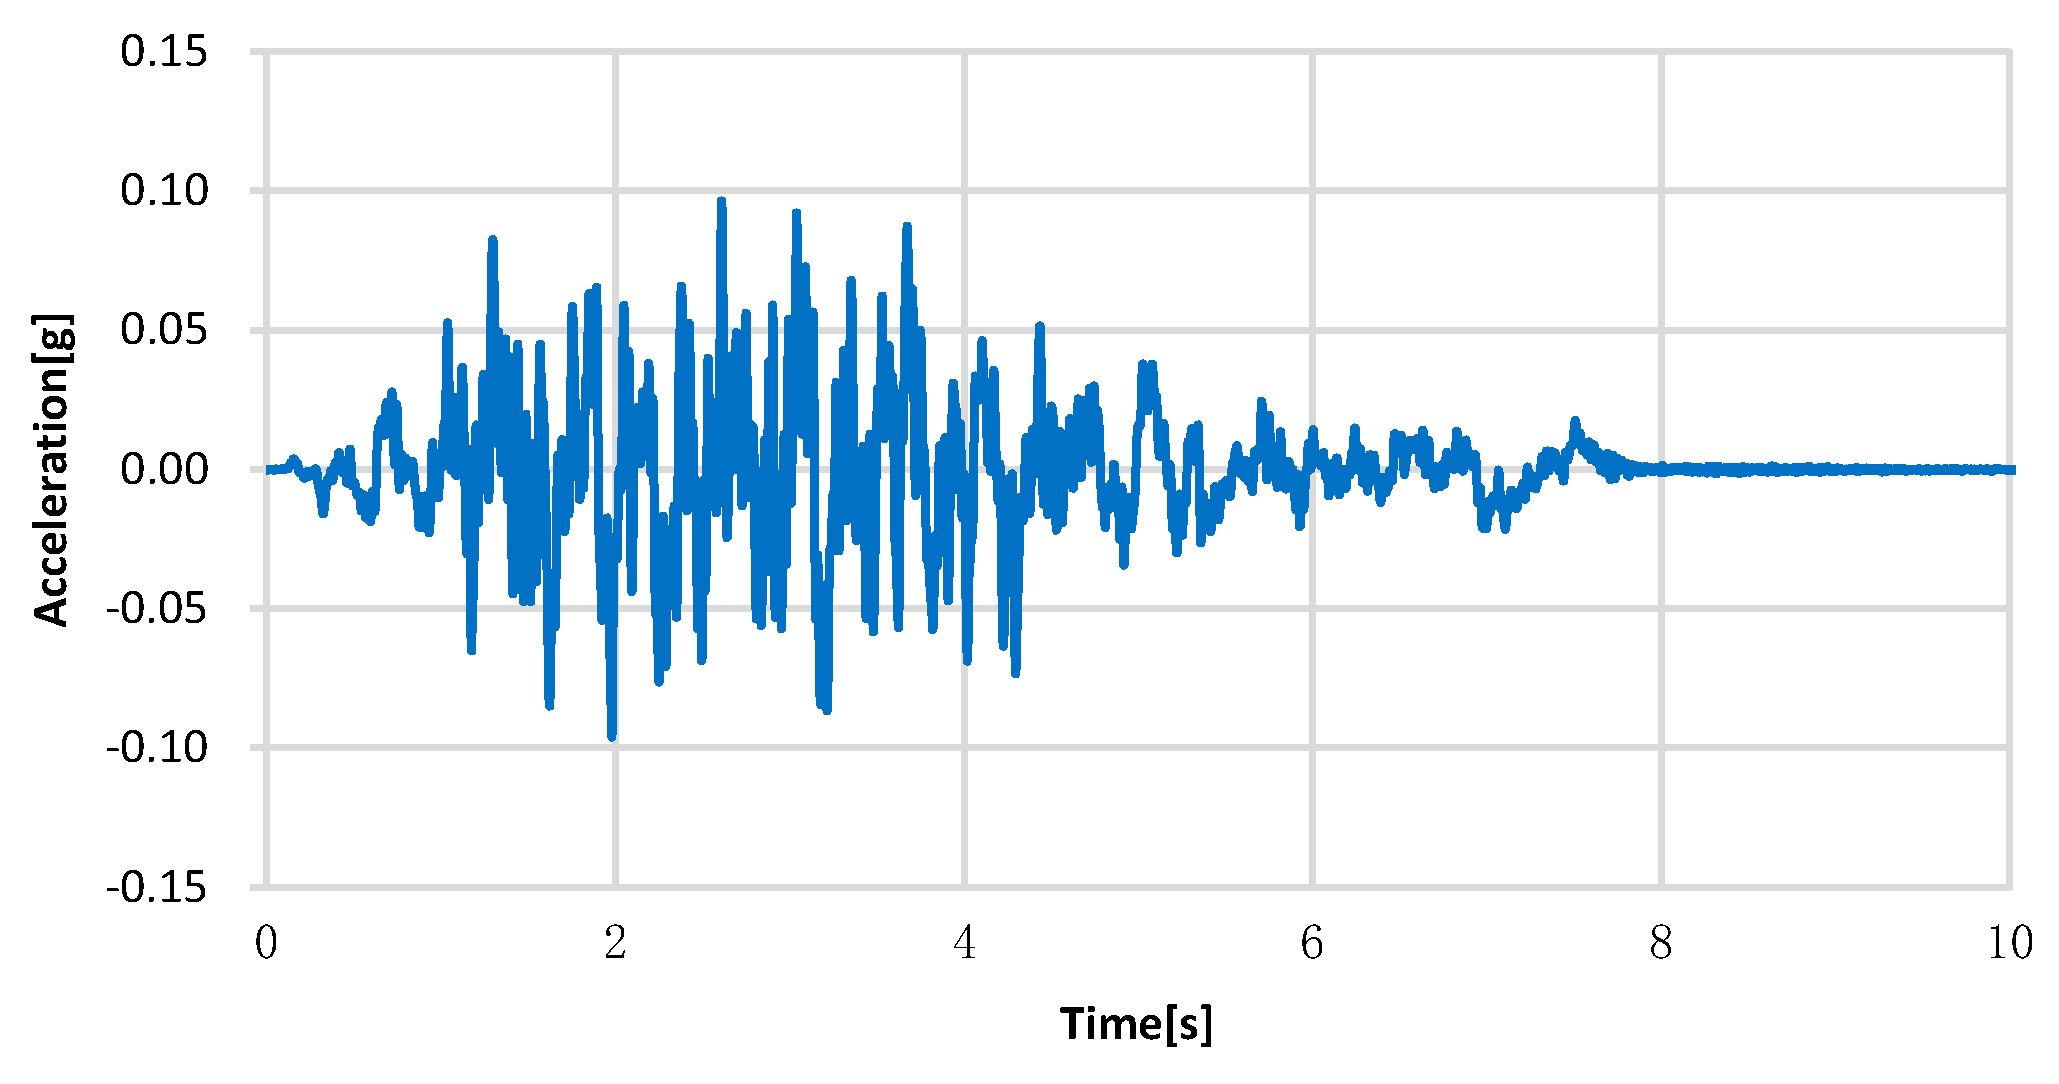
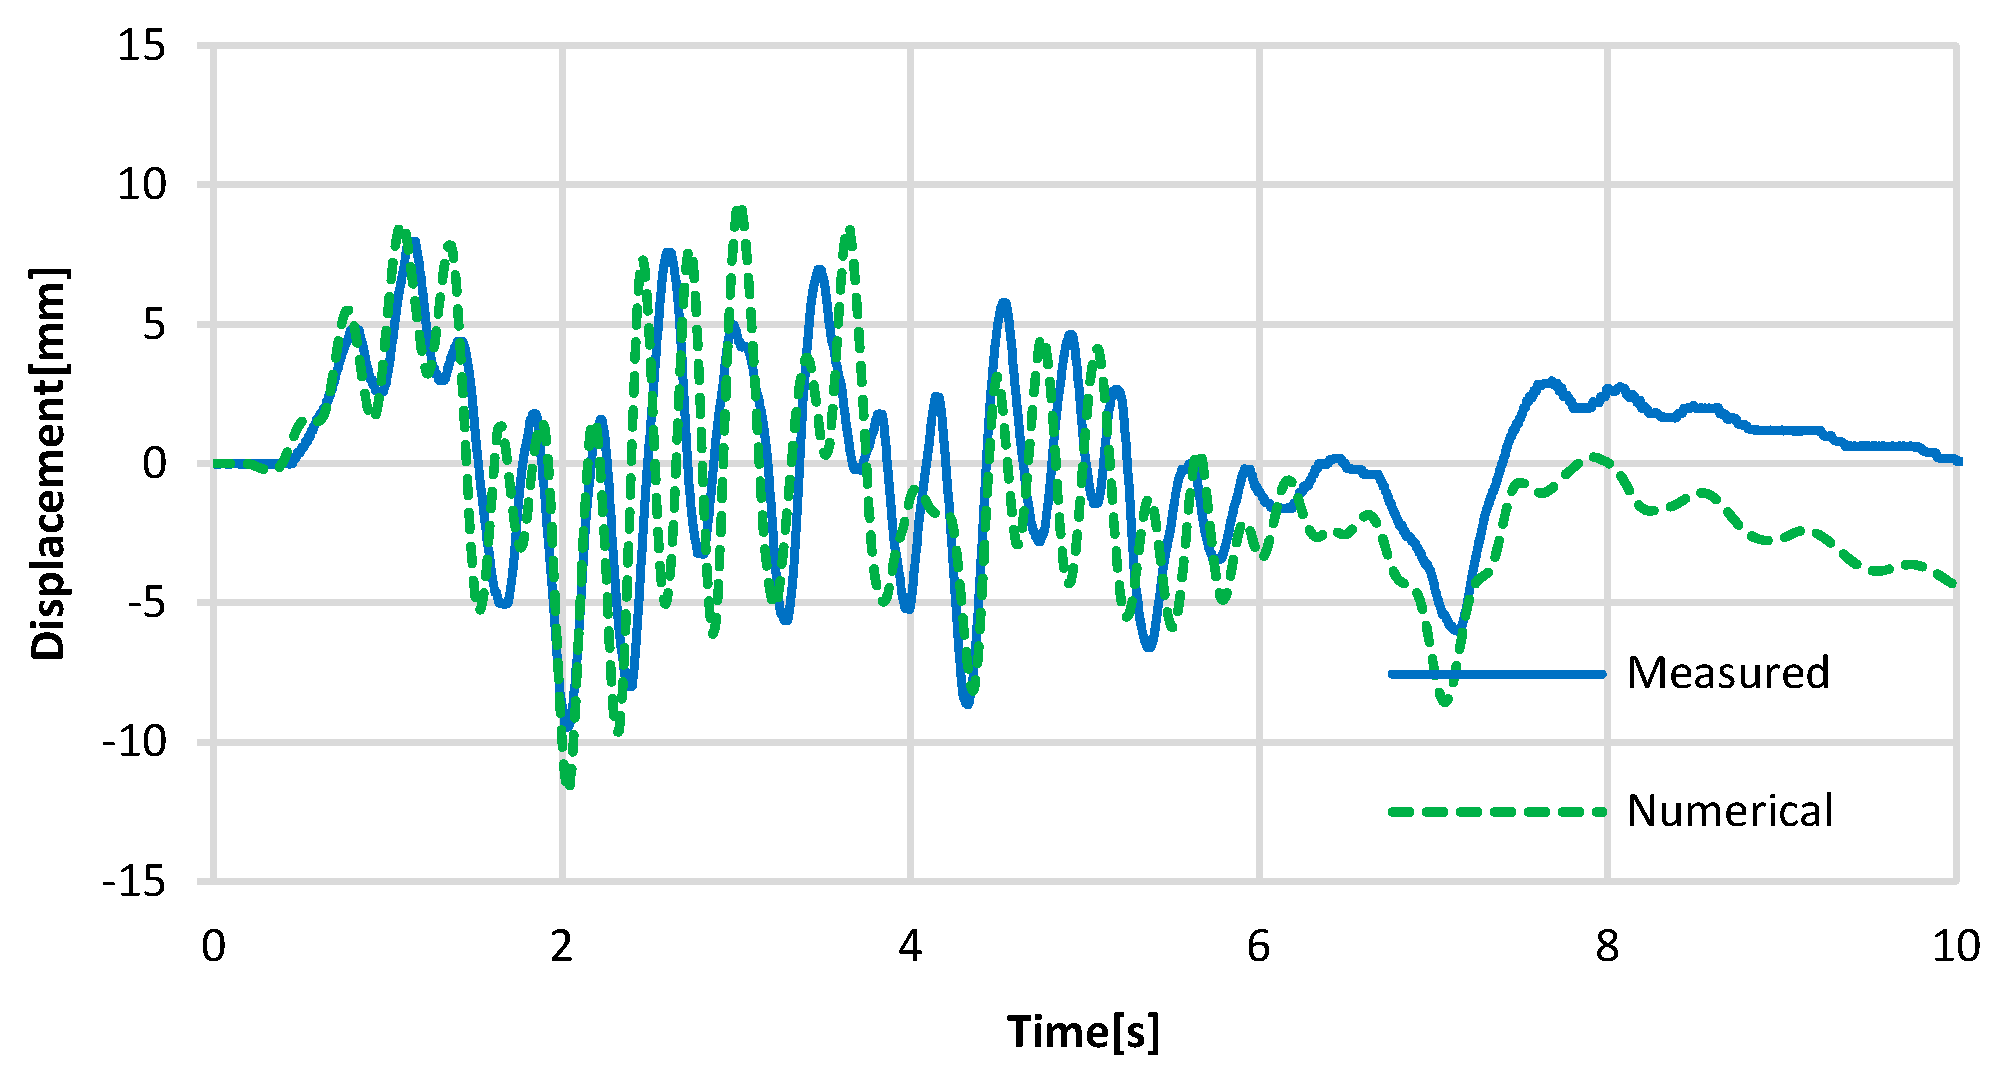
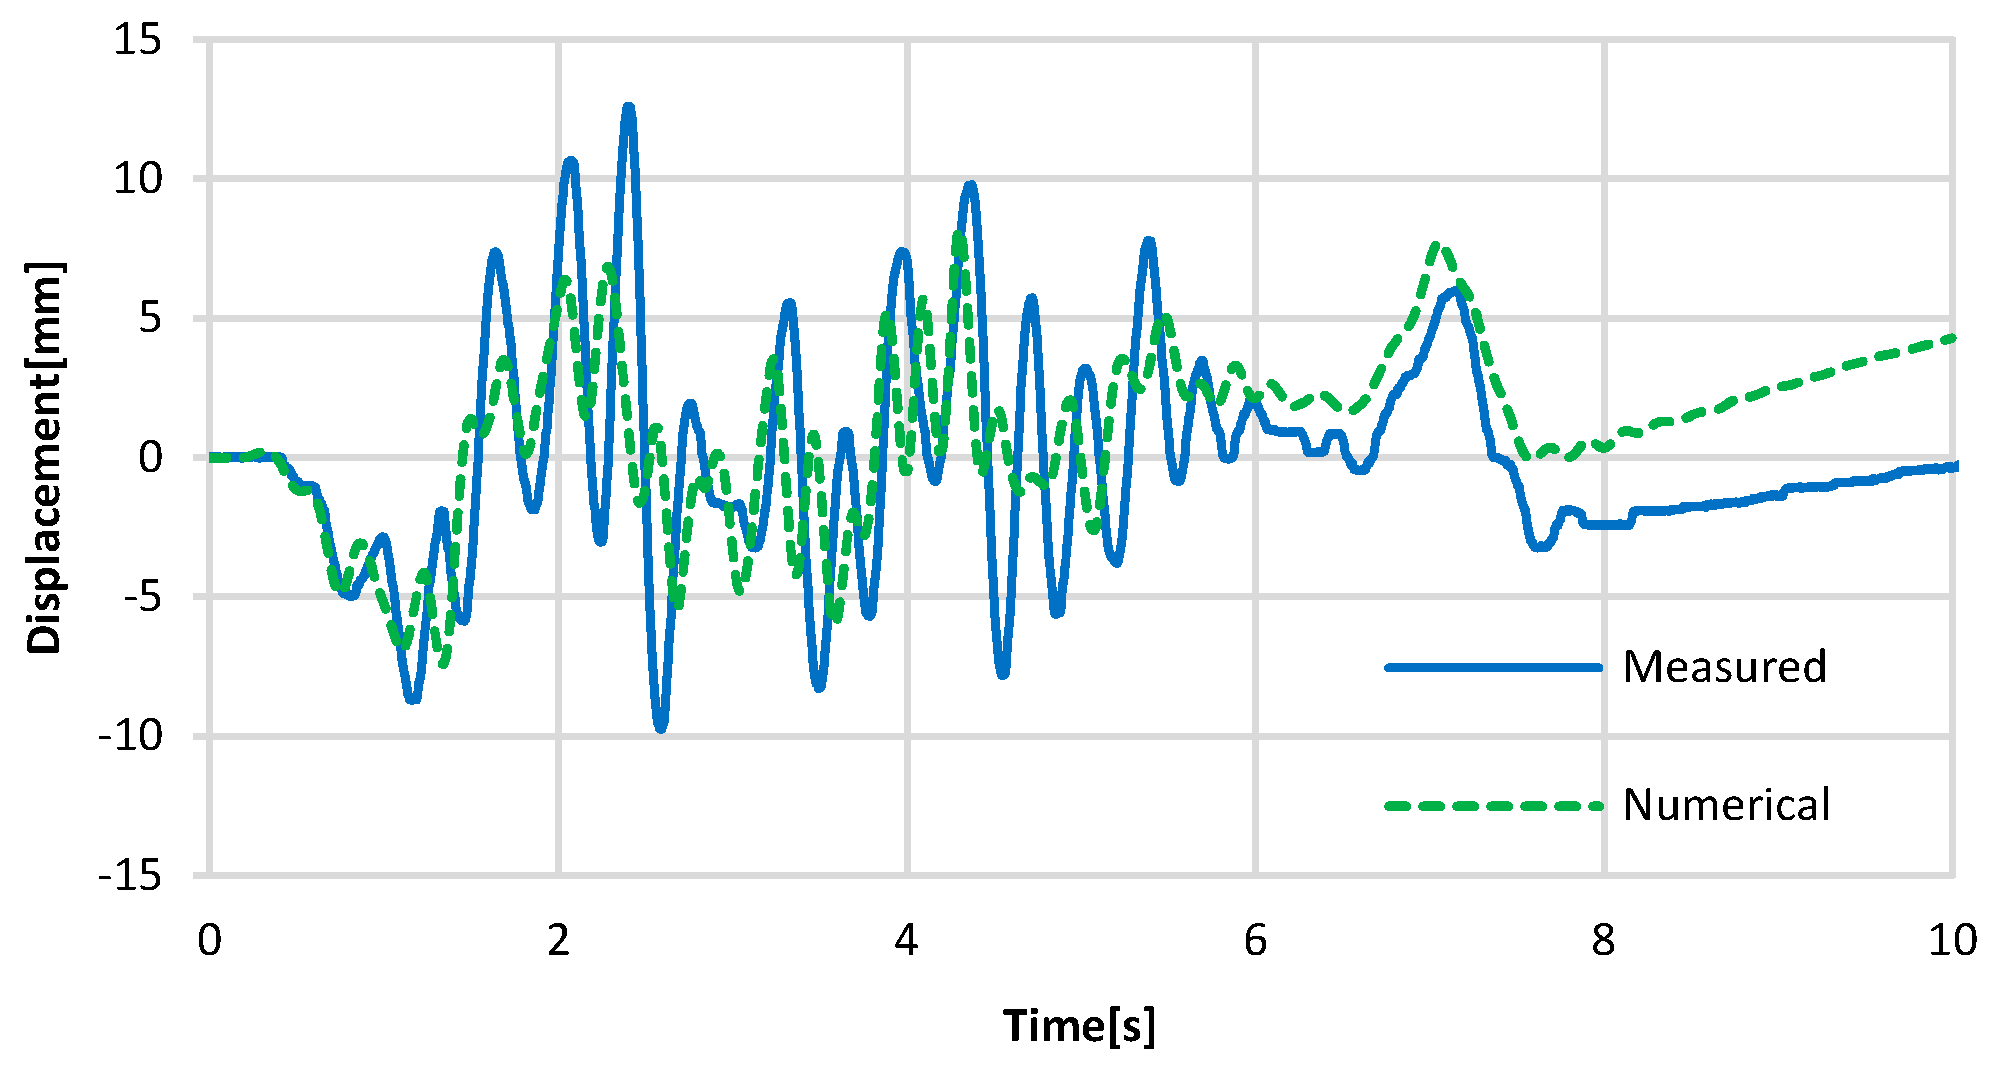
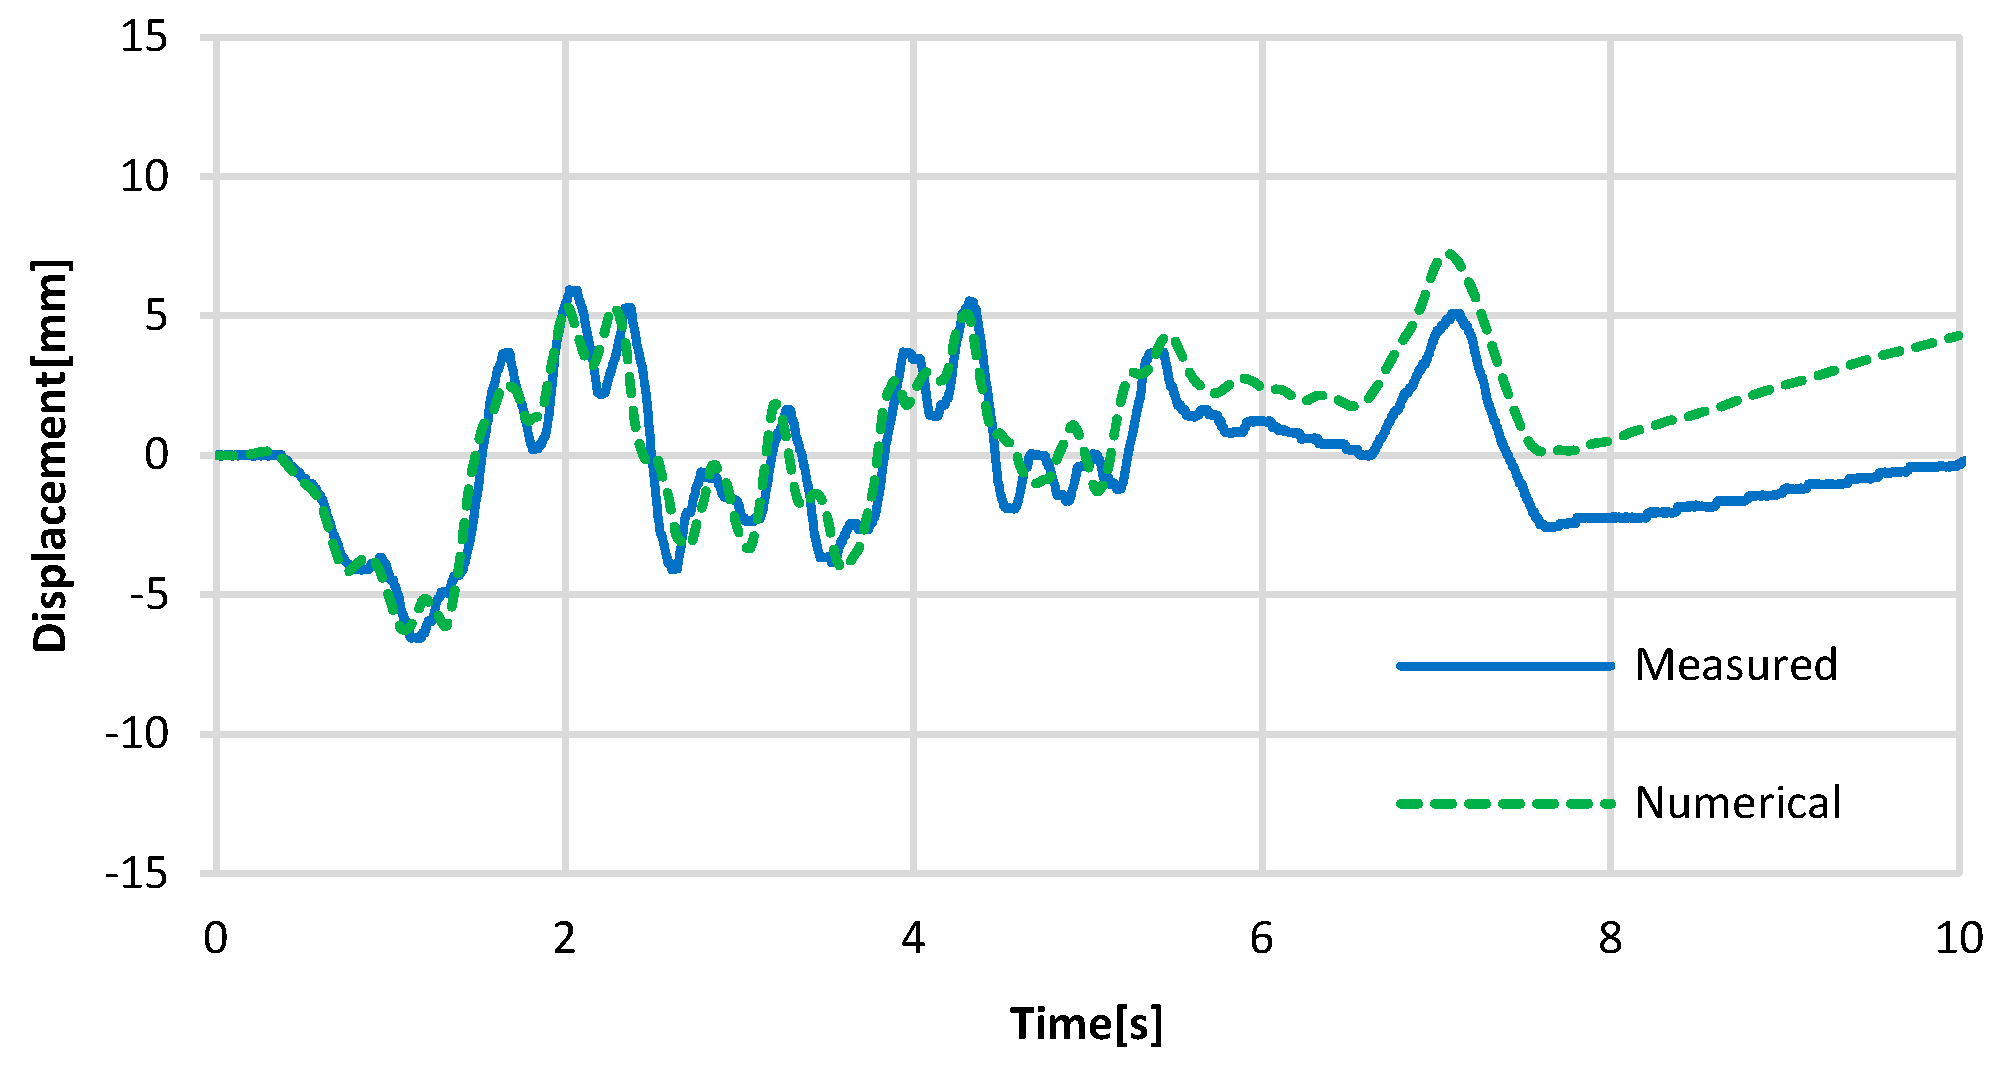
Figure 7 shows the seismic time history used in the numerical calculation and shaking table test, while Figure 8, Figure 9 and Figure 10 show the displacement response time history of key location of the bridge. Obviously, they coincide with each other, but there is a large deviation in the range of 8 s~10 s, which is probably due to the strong nonlinear effect caused by the structural damage, making it difficult for the numerical calculation to be accurate. Generally, this shake-table test verified the correctness of the FE model.

2.3. Input Ground Motions

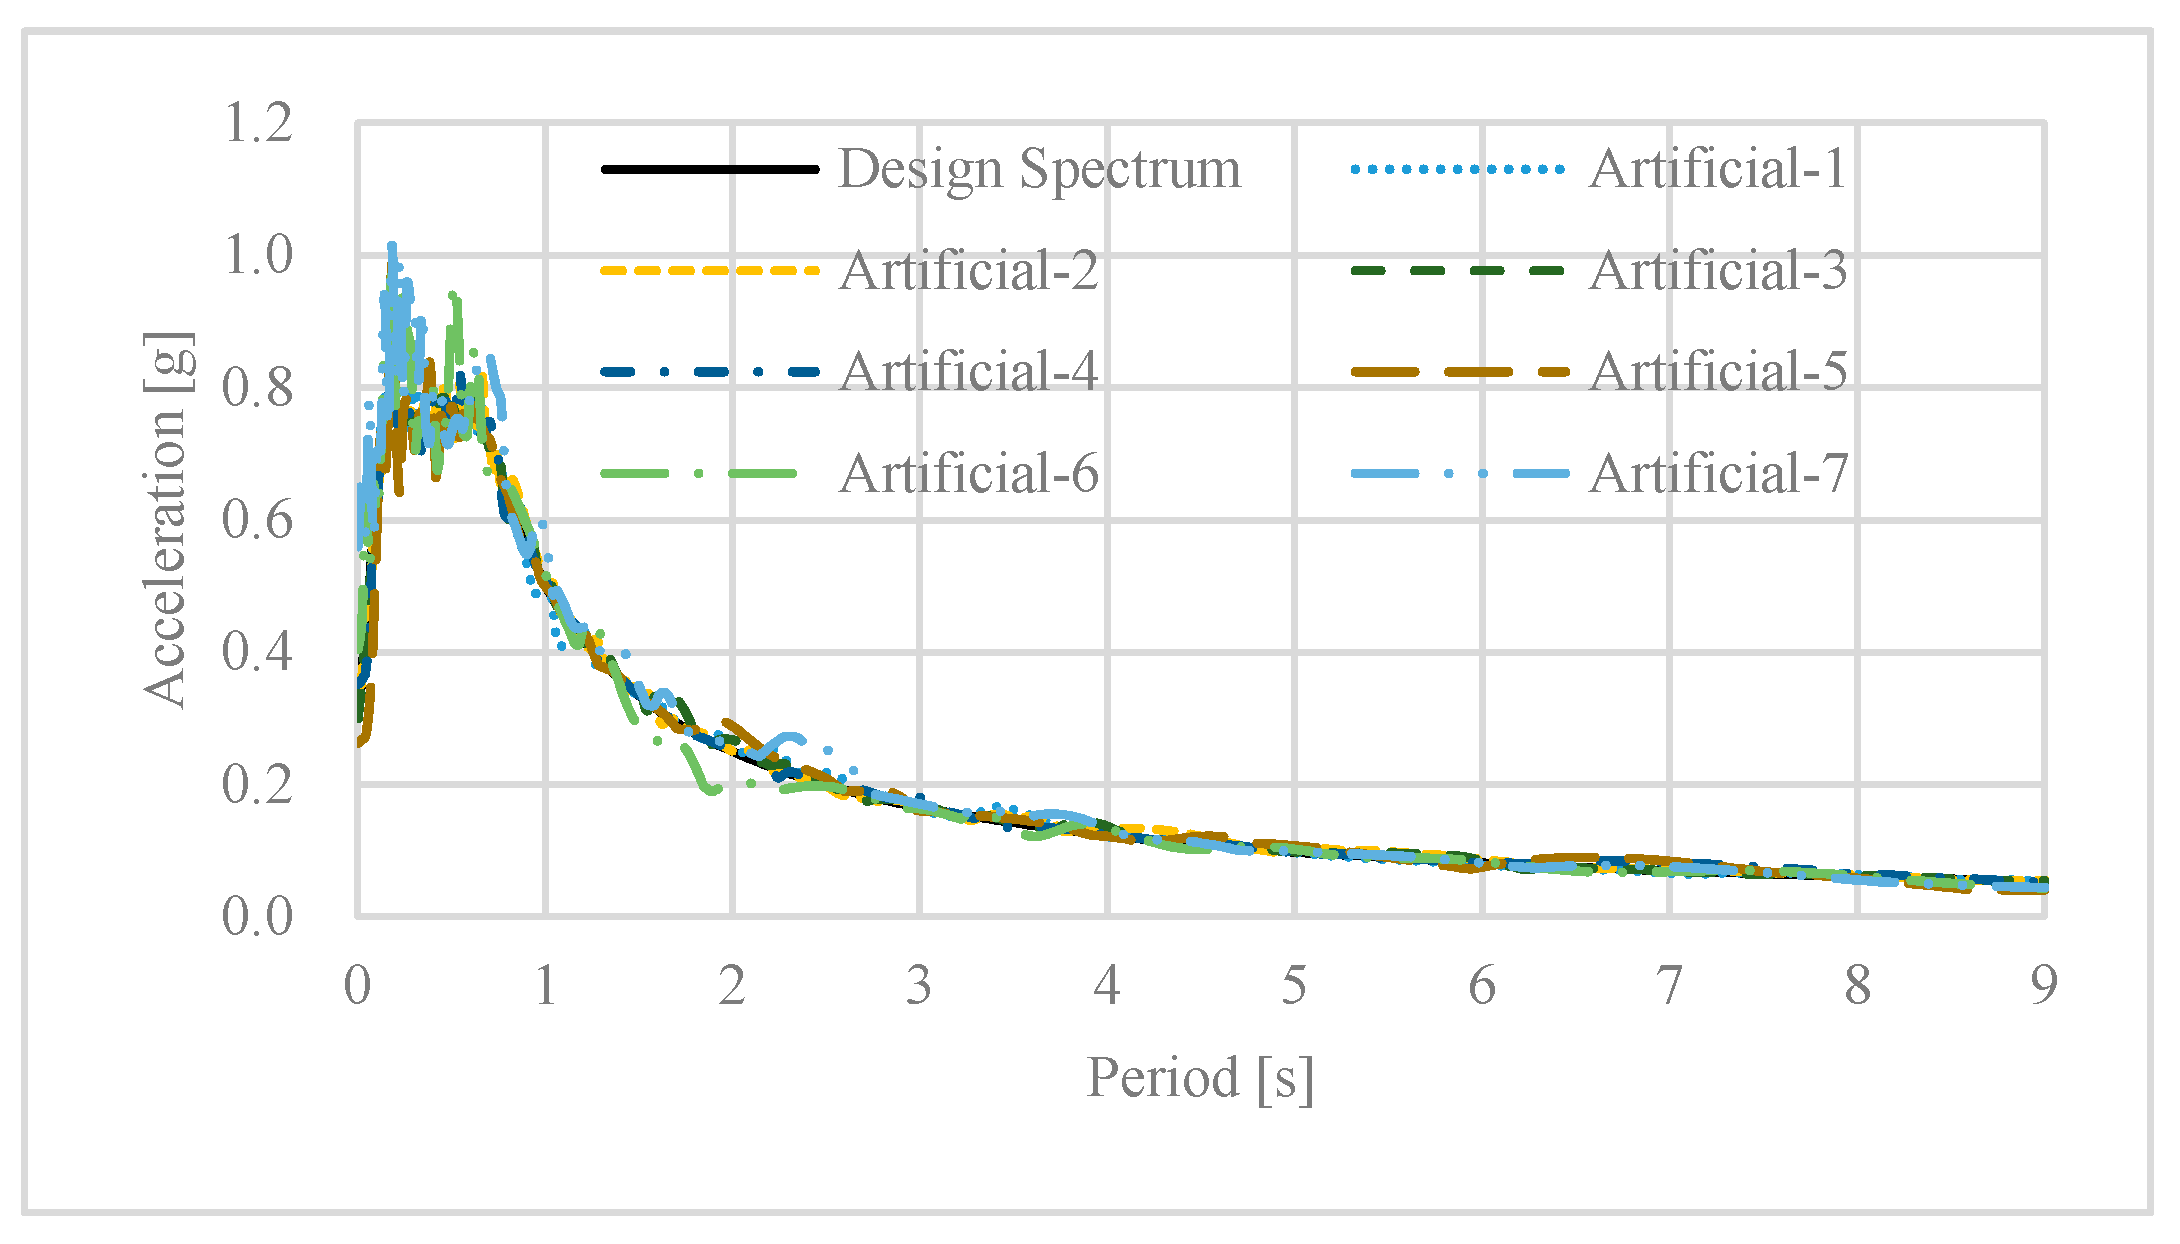
The peak ground acceleration (PGA) of the design level ground motions is 0.3 g according to the site earthquake risk assessment, and seven artificial ground motions are produced from the design spectrum specified in bridge seismic codes, as the input. Figure 11 shows the acceleration response spectra with a 5% damping ratio. The following study uses the averaged result of the seven artificial ground motions.

3. The Influence of the Fy of YSD

In order to select the Fy of YSD at different locations—the YSD yielding strength installed at the auxiliary pier (Fya), the transition pier (Fyp) and the tower (Fyt)—it is necessary to determine the effect of all these parameters, resulting in the structural response as a ternary function; it is therefore necessary to carry out a detailed three-variable function analysis.

3.1. Determining the Scope of Analysis

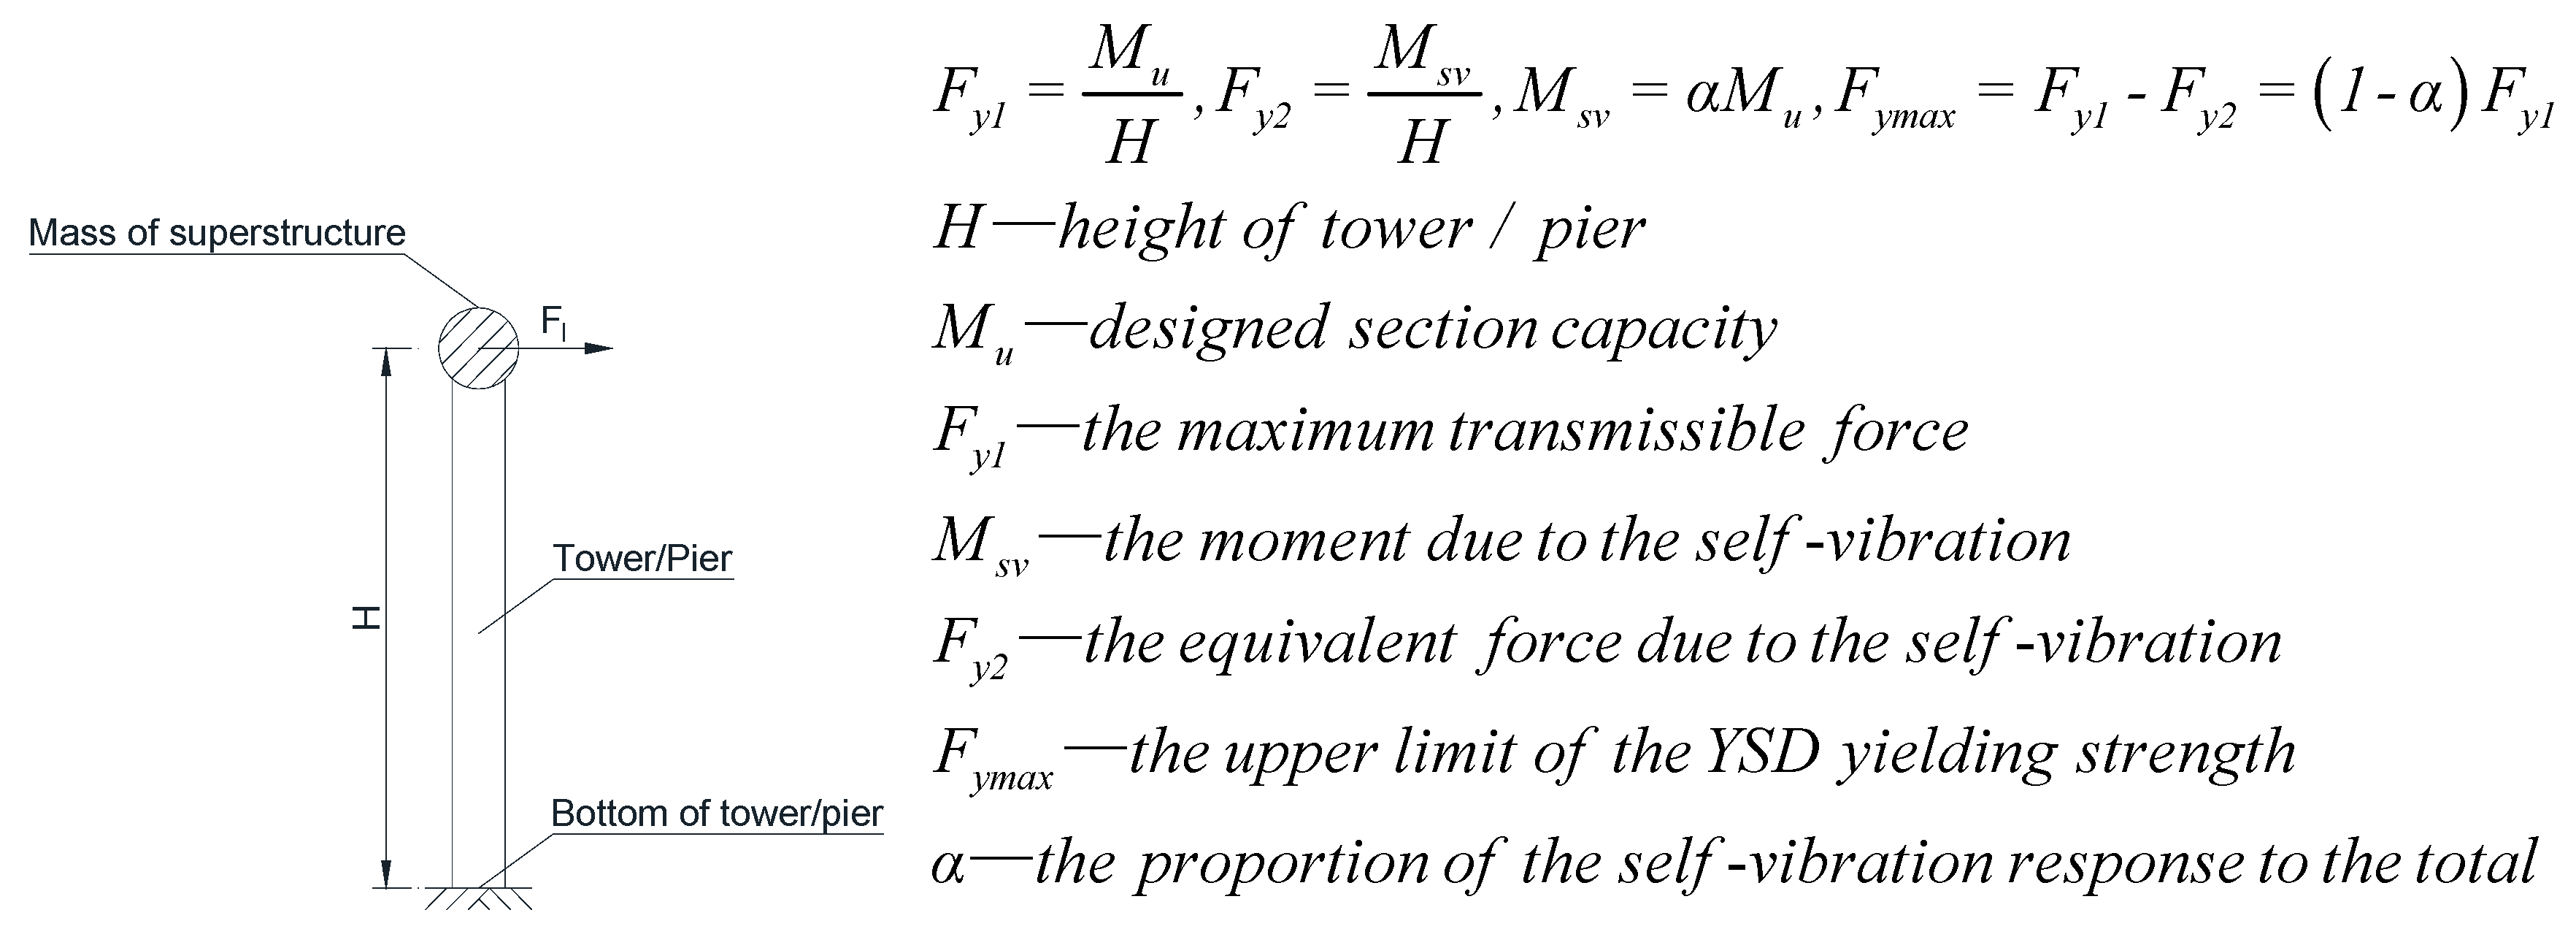
The range of Fy should be considered firstly when a multivariate function is used. In fact, the seismically induced force of the substructure includes two parts: one is transmitted by the inertial force of the girder, and the other is generated by the self-vibration. Therefore, as shown by the above formula, the value of Fy should be determined according to the designed section capacity (Mu) and self-vibration (Msv) as well.
Taking the bridge prototype in this paper as an example (Figure 12), on the one hand, the Mut is around 500,000 kN·m, and Mup (or Mua) is around 300,000 kN·m, while the H is around 40 m. Therefore, Fy1t could be 12,500 kN at maximum, and Fy1p (or Fy1a) could be 7500 kN at maximum. On the other hand, α is around 0.3, which can be verified in the chart of subsequent calculation. Therefore, the upper limits of the YSD yielding strength Fymax set at the auxiliary pier, the transition pier and the tower are 5000 kN, 5000 kN, and 9000 kN, respectively.
In addition, the lower limits of Fya, Fyp and Fyt are 0 kN, 0 kN and 1000 kN, respectively, because the girder–pier can be free but the girder–tower must be restrained to meet the service load function. Thus, 441 cases in total are analyzed in order to find the most appropriate design value of Fy at each location; i.e., Fya varies from 0 kN to 5000 kN, Fyp varies from 0 kN to 5000 kN and Fyt varies from 1000 kN to 9000 kN with an interval of 1000 kN, respectively.

3.2. Multivariate Function Analysis

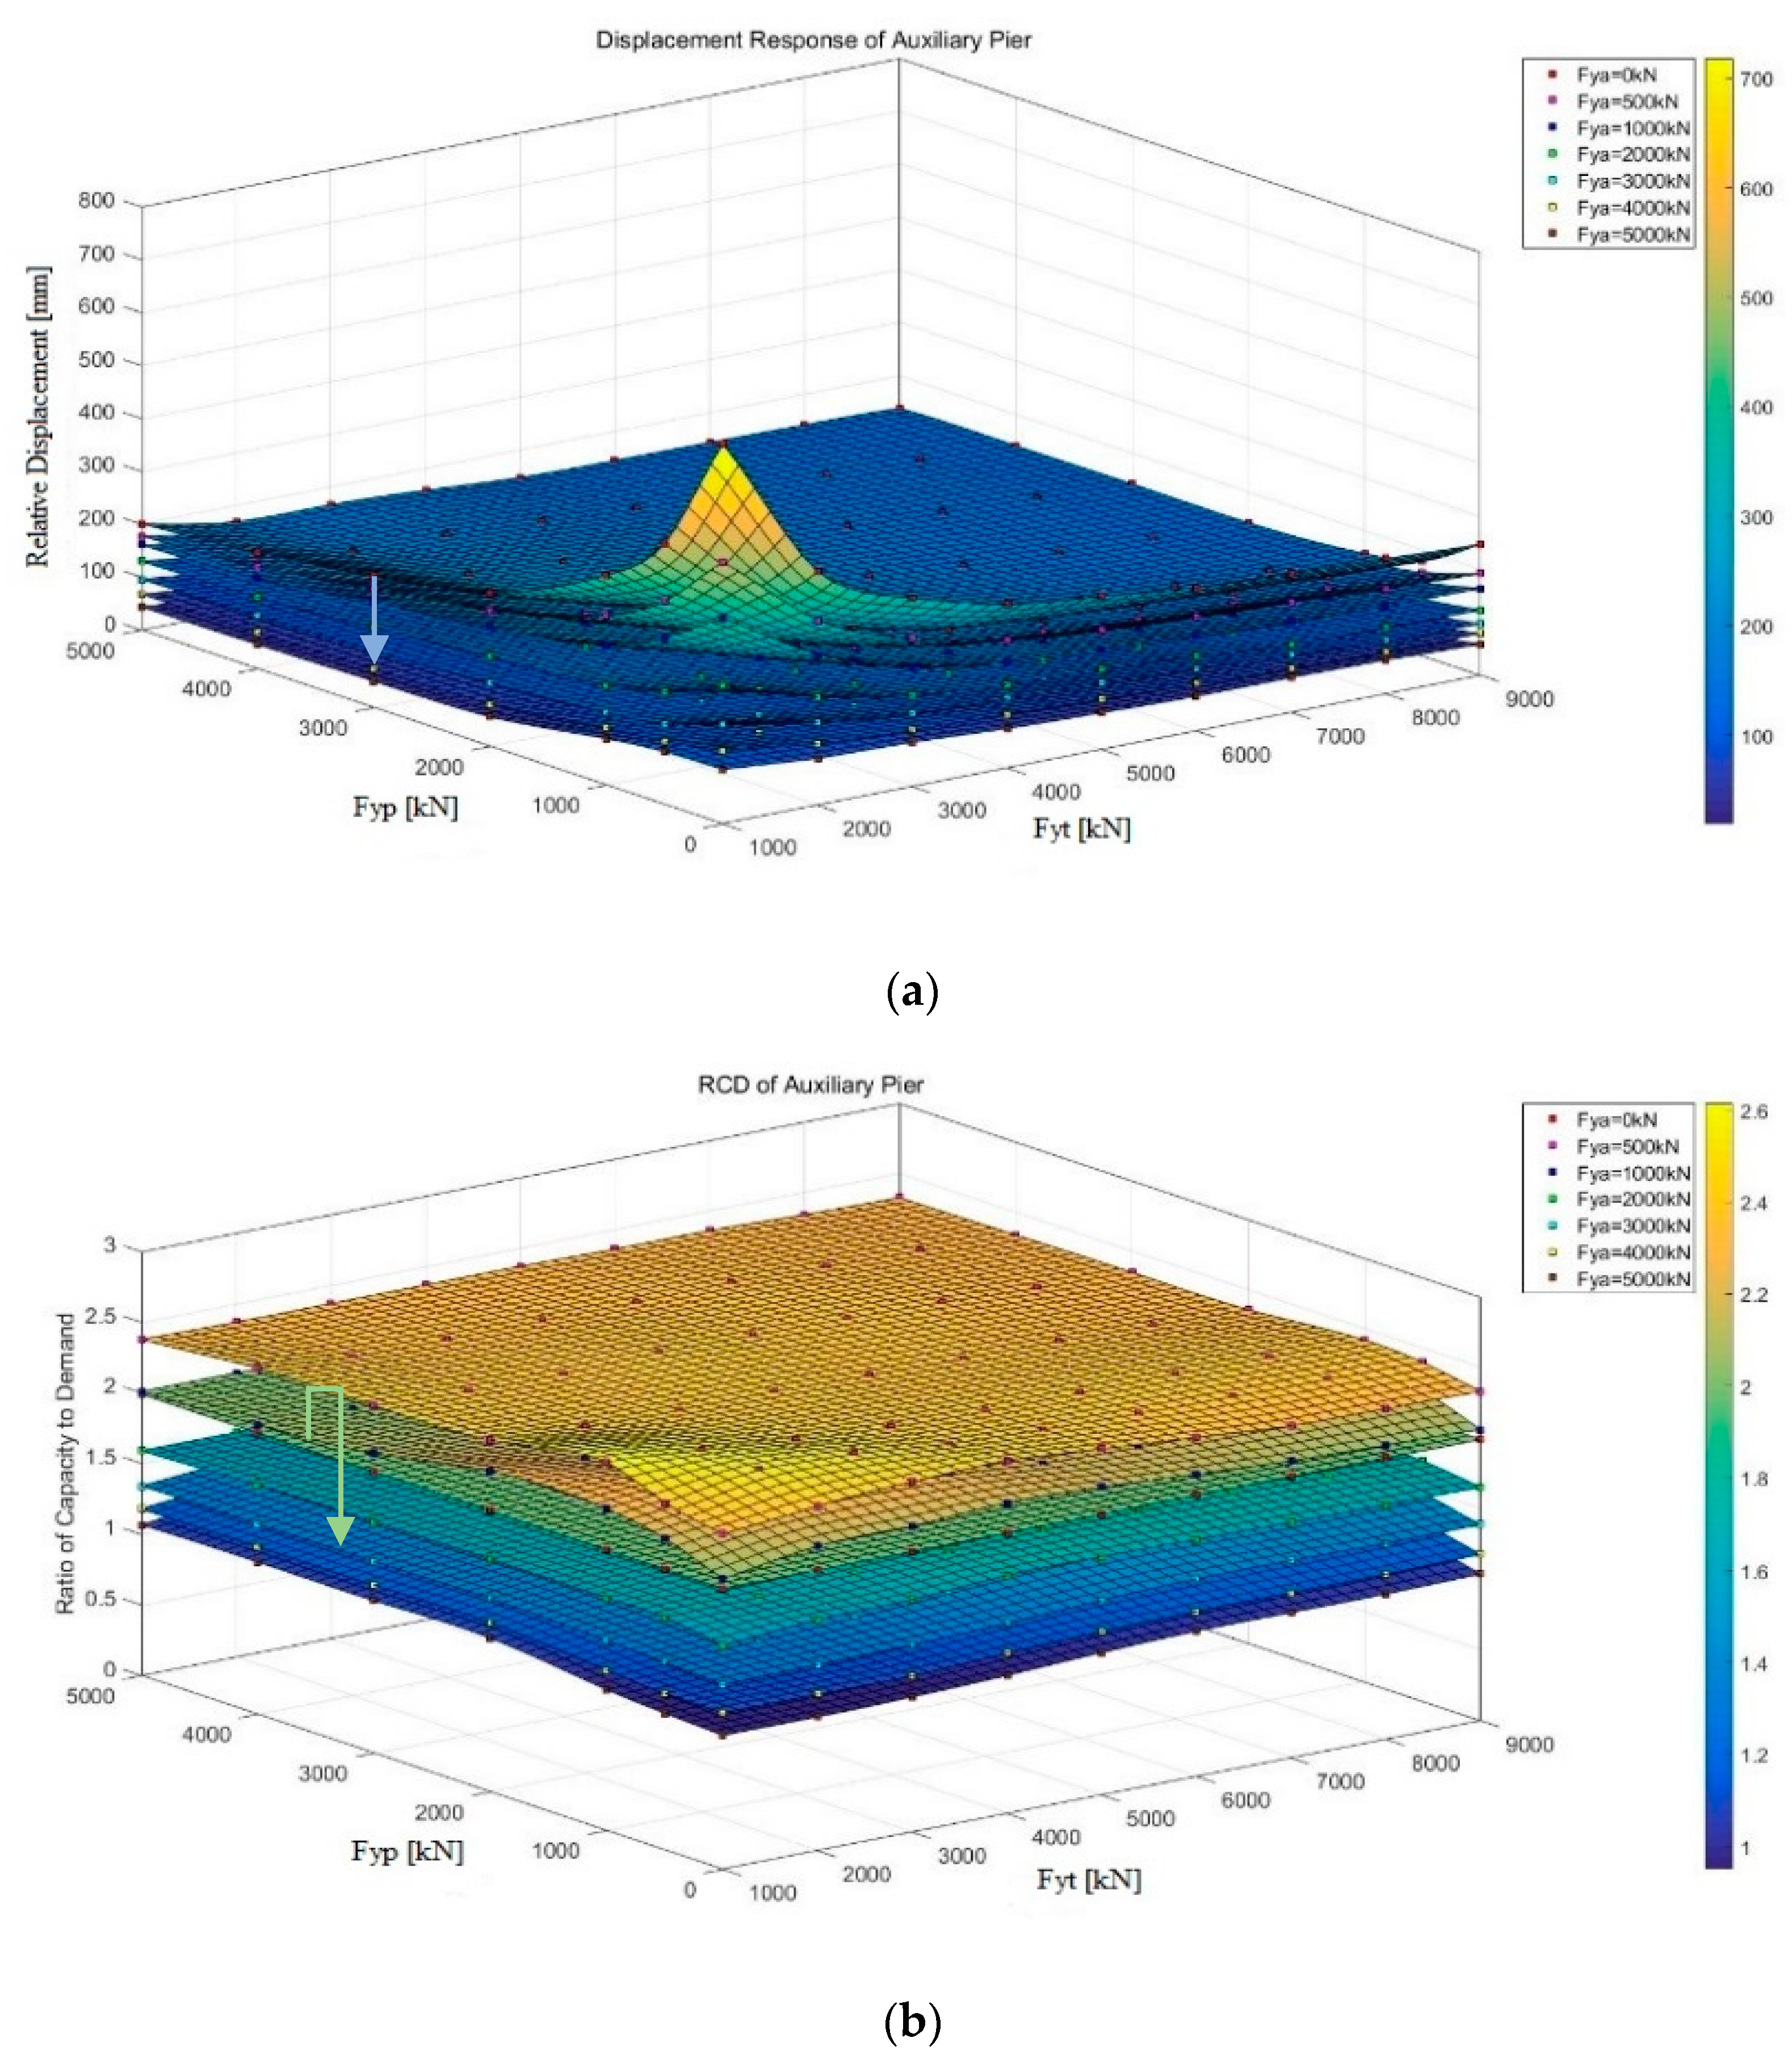
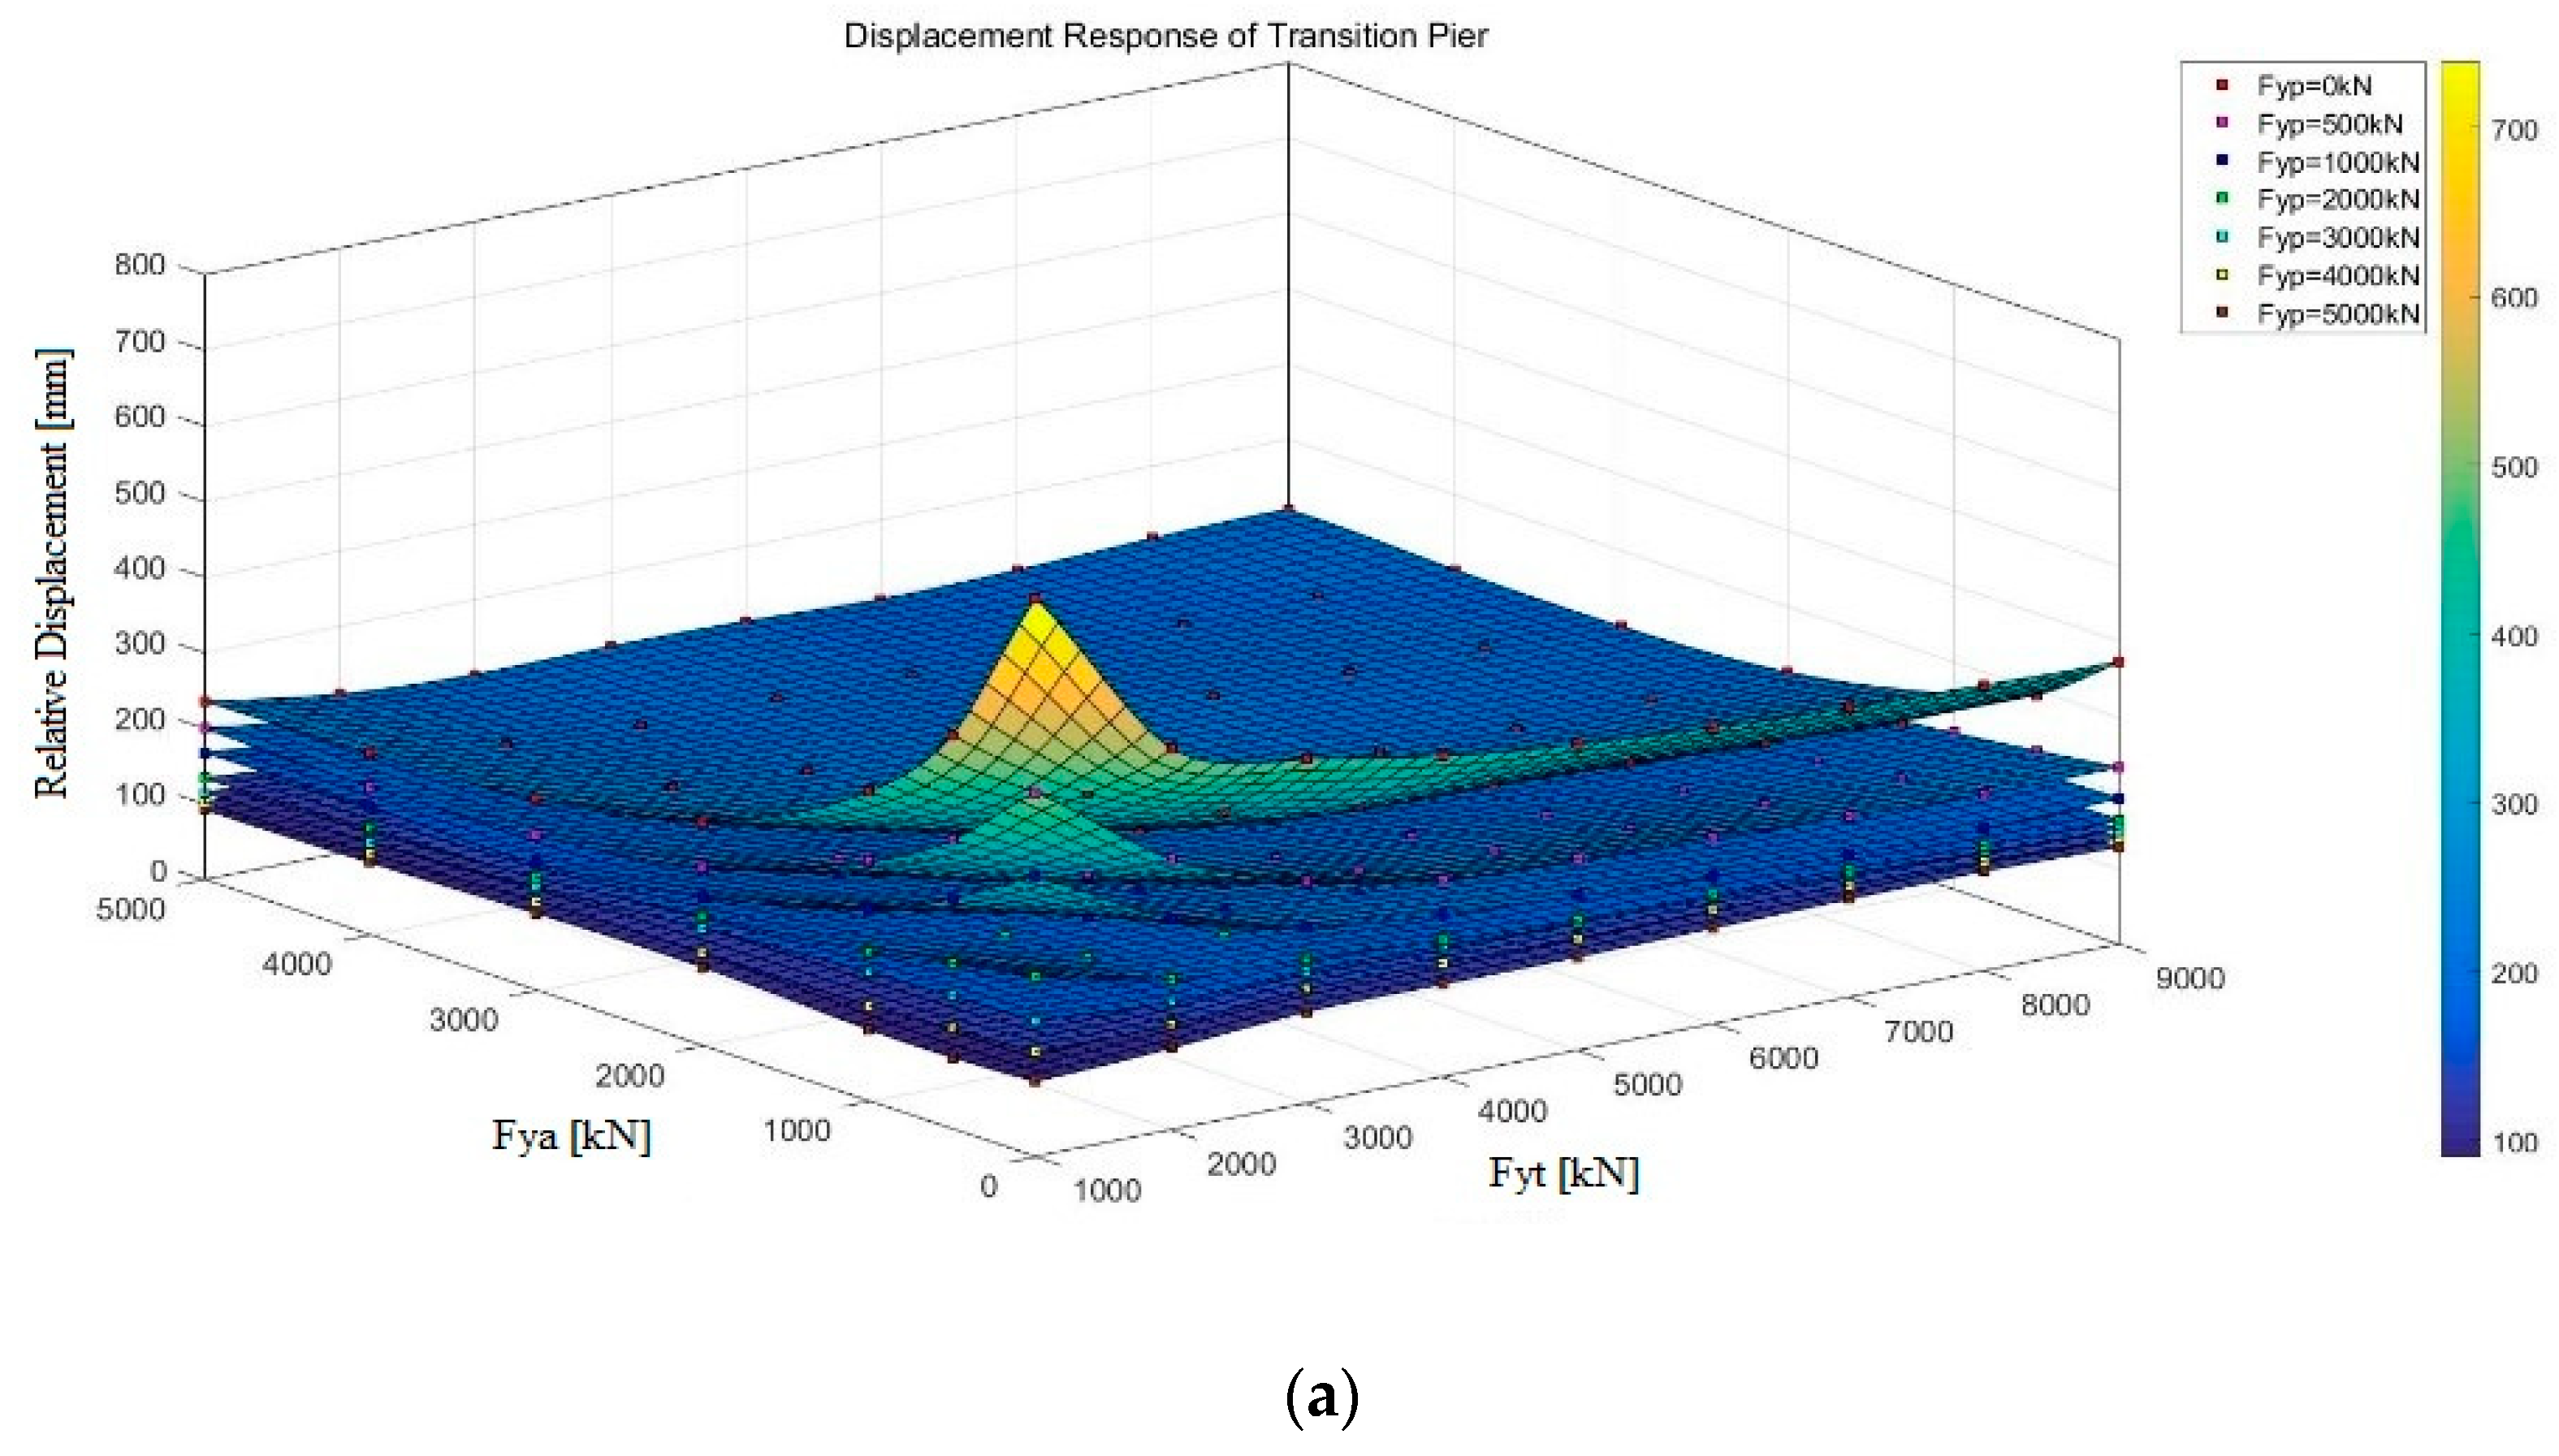
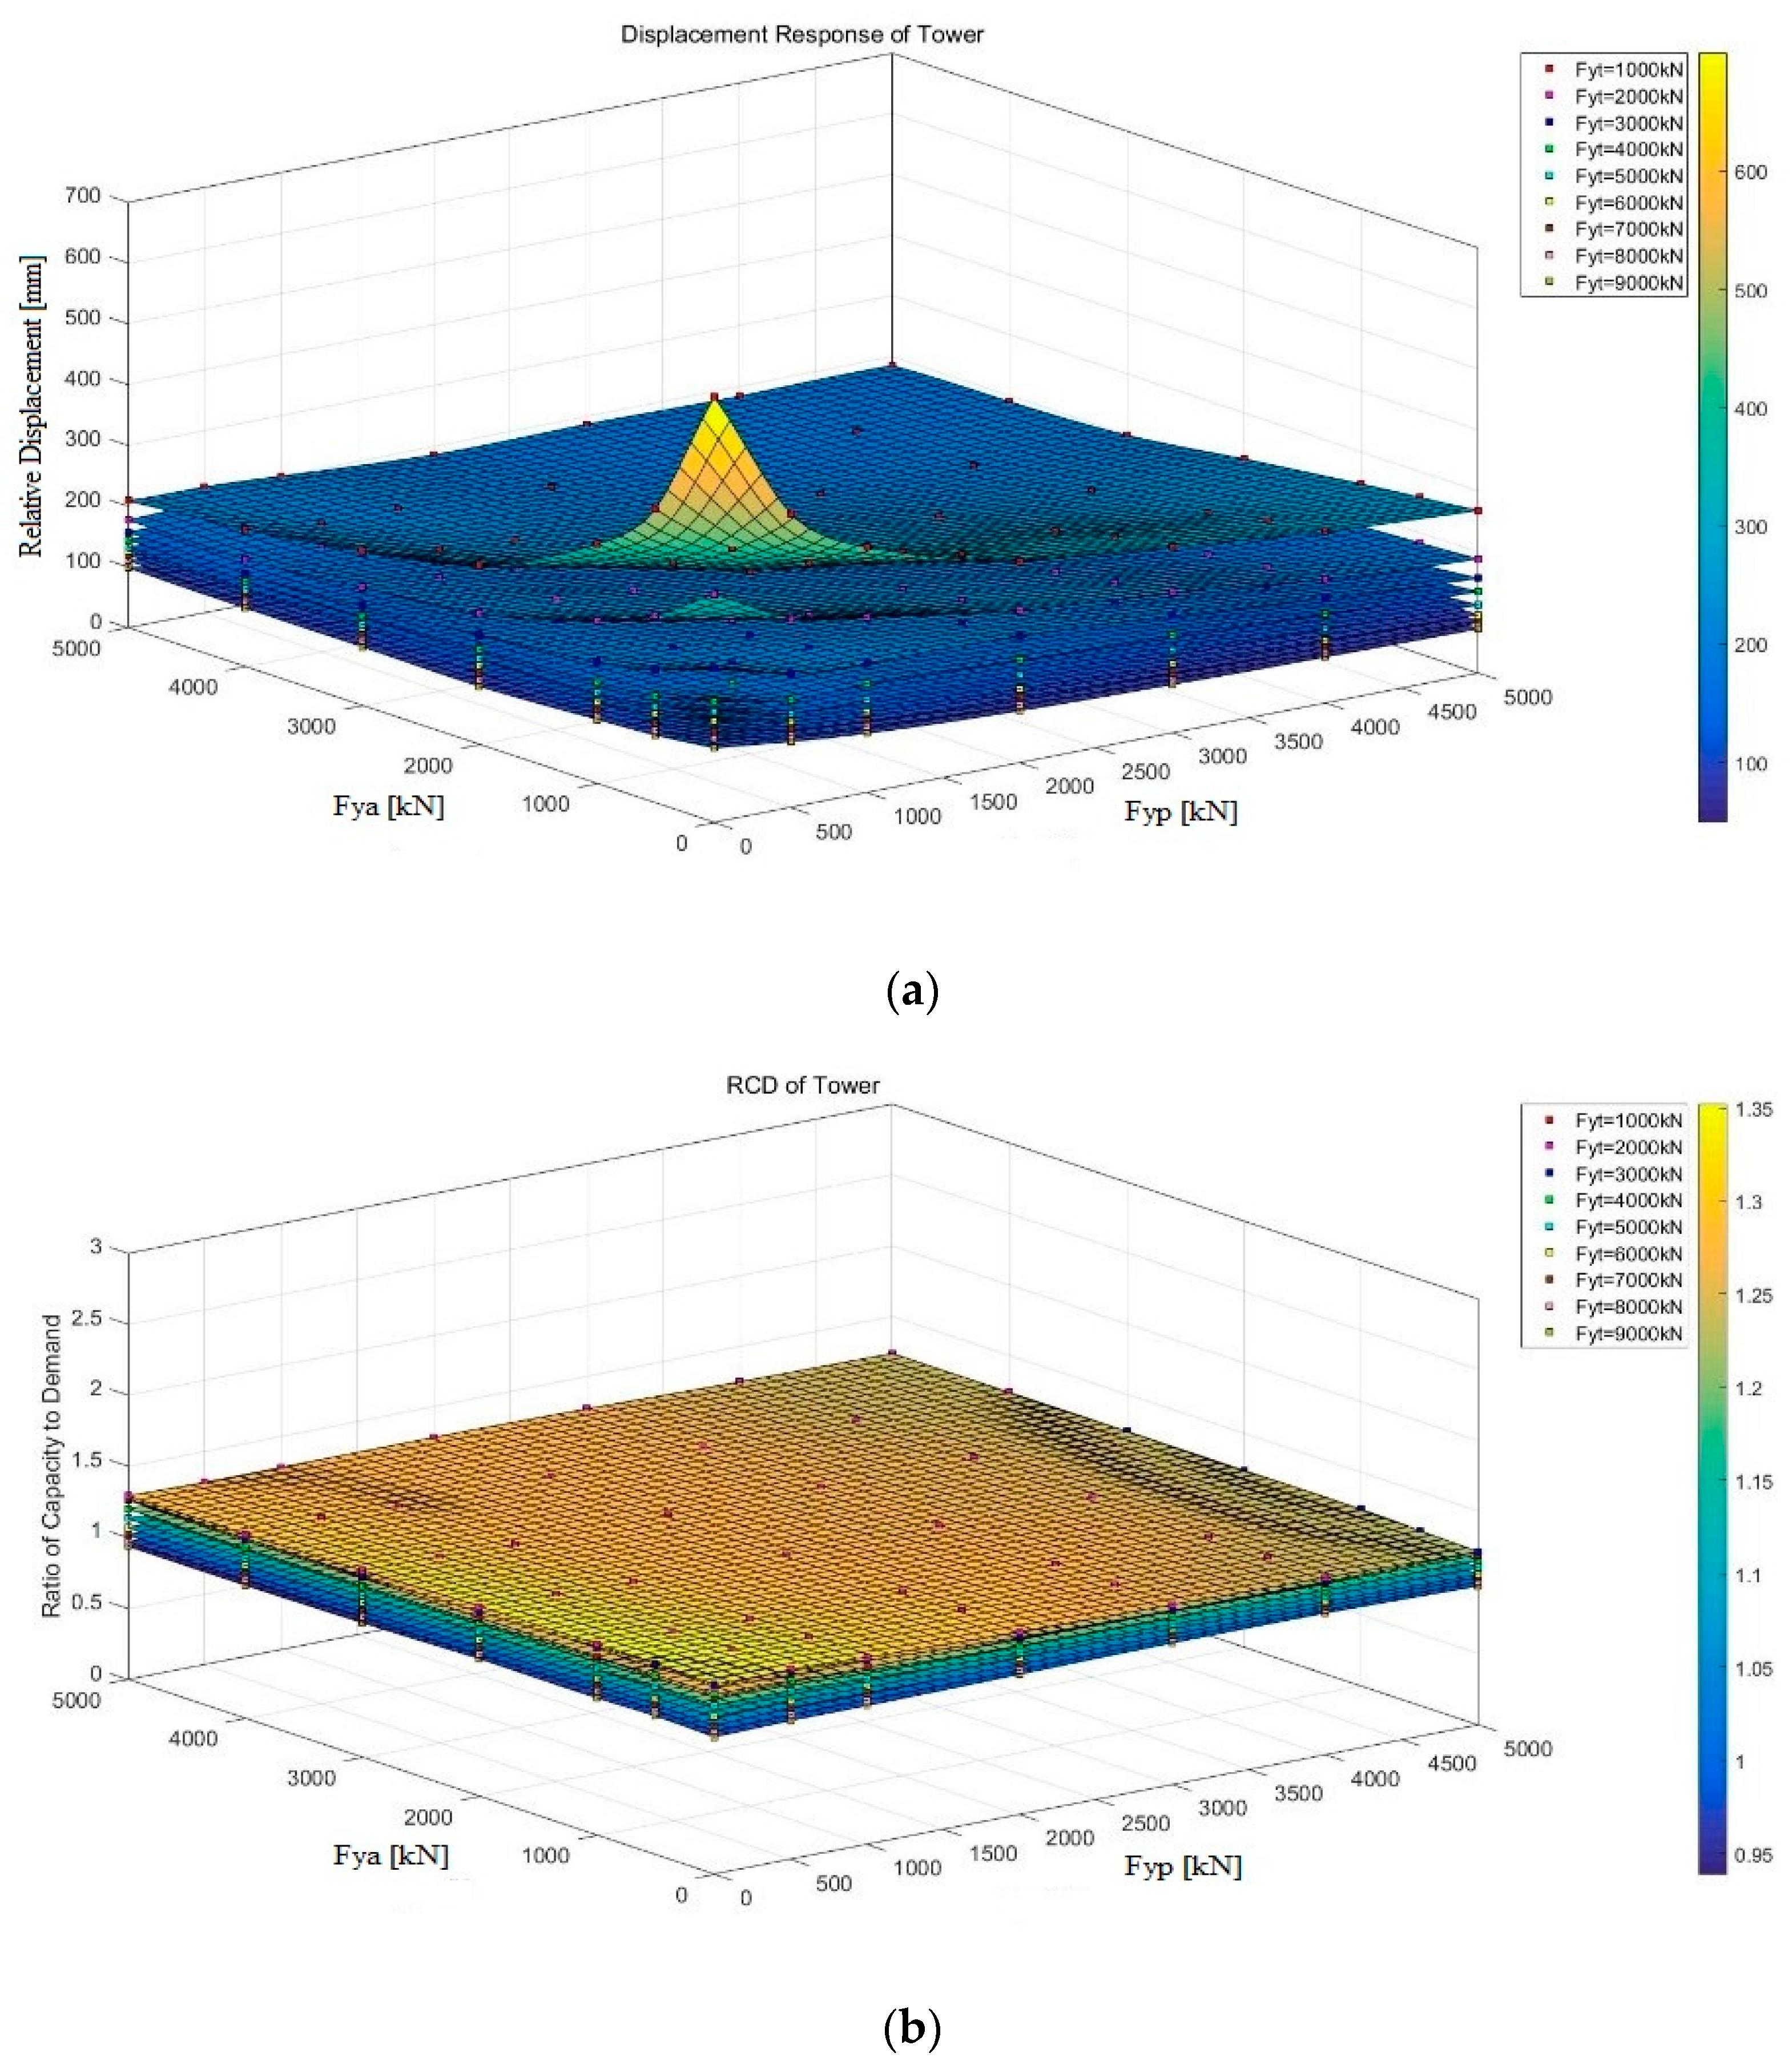
Figure 13a, Figure 14a and Figure 15a show the effect of the yielding strength Fy on the relative displacement (RD) of the auxiliary pier, the transition pier and the bridge tower with the increase of other two yielding strengths, which share the same characteristics. On one hand, there are distinct layers between the RD surfaces at each location, indicating that the RD decreases rapidly to a stable small value with the increase of the yielding strength of the YSD at its own location. On the other hand, each surface is a subduction surface, which indicates that the yielding strengths of the YSDs at the other two locations have a significant impact on the RD only when their values are small. Therefore, in order to use steel dampers efficiently, the yielding strength of YSDs at each location should not be too large.
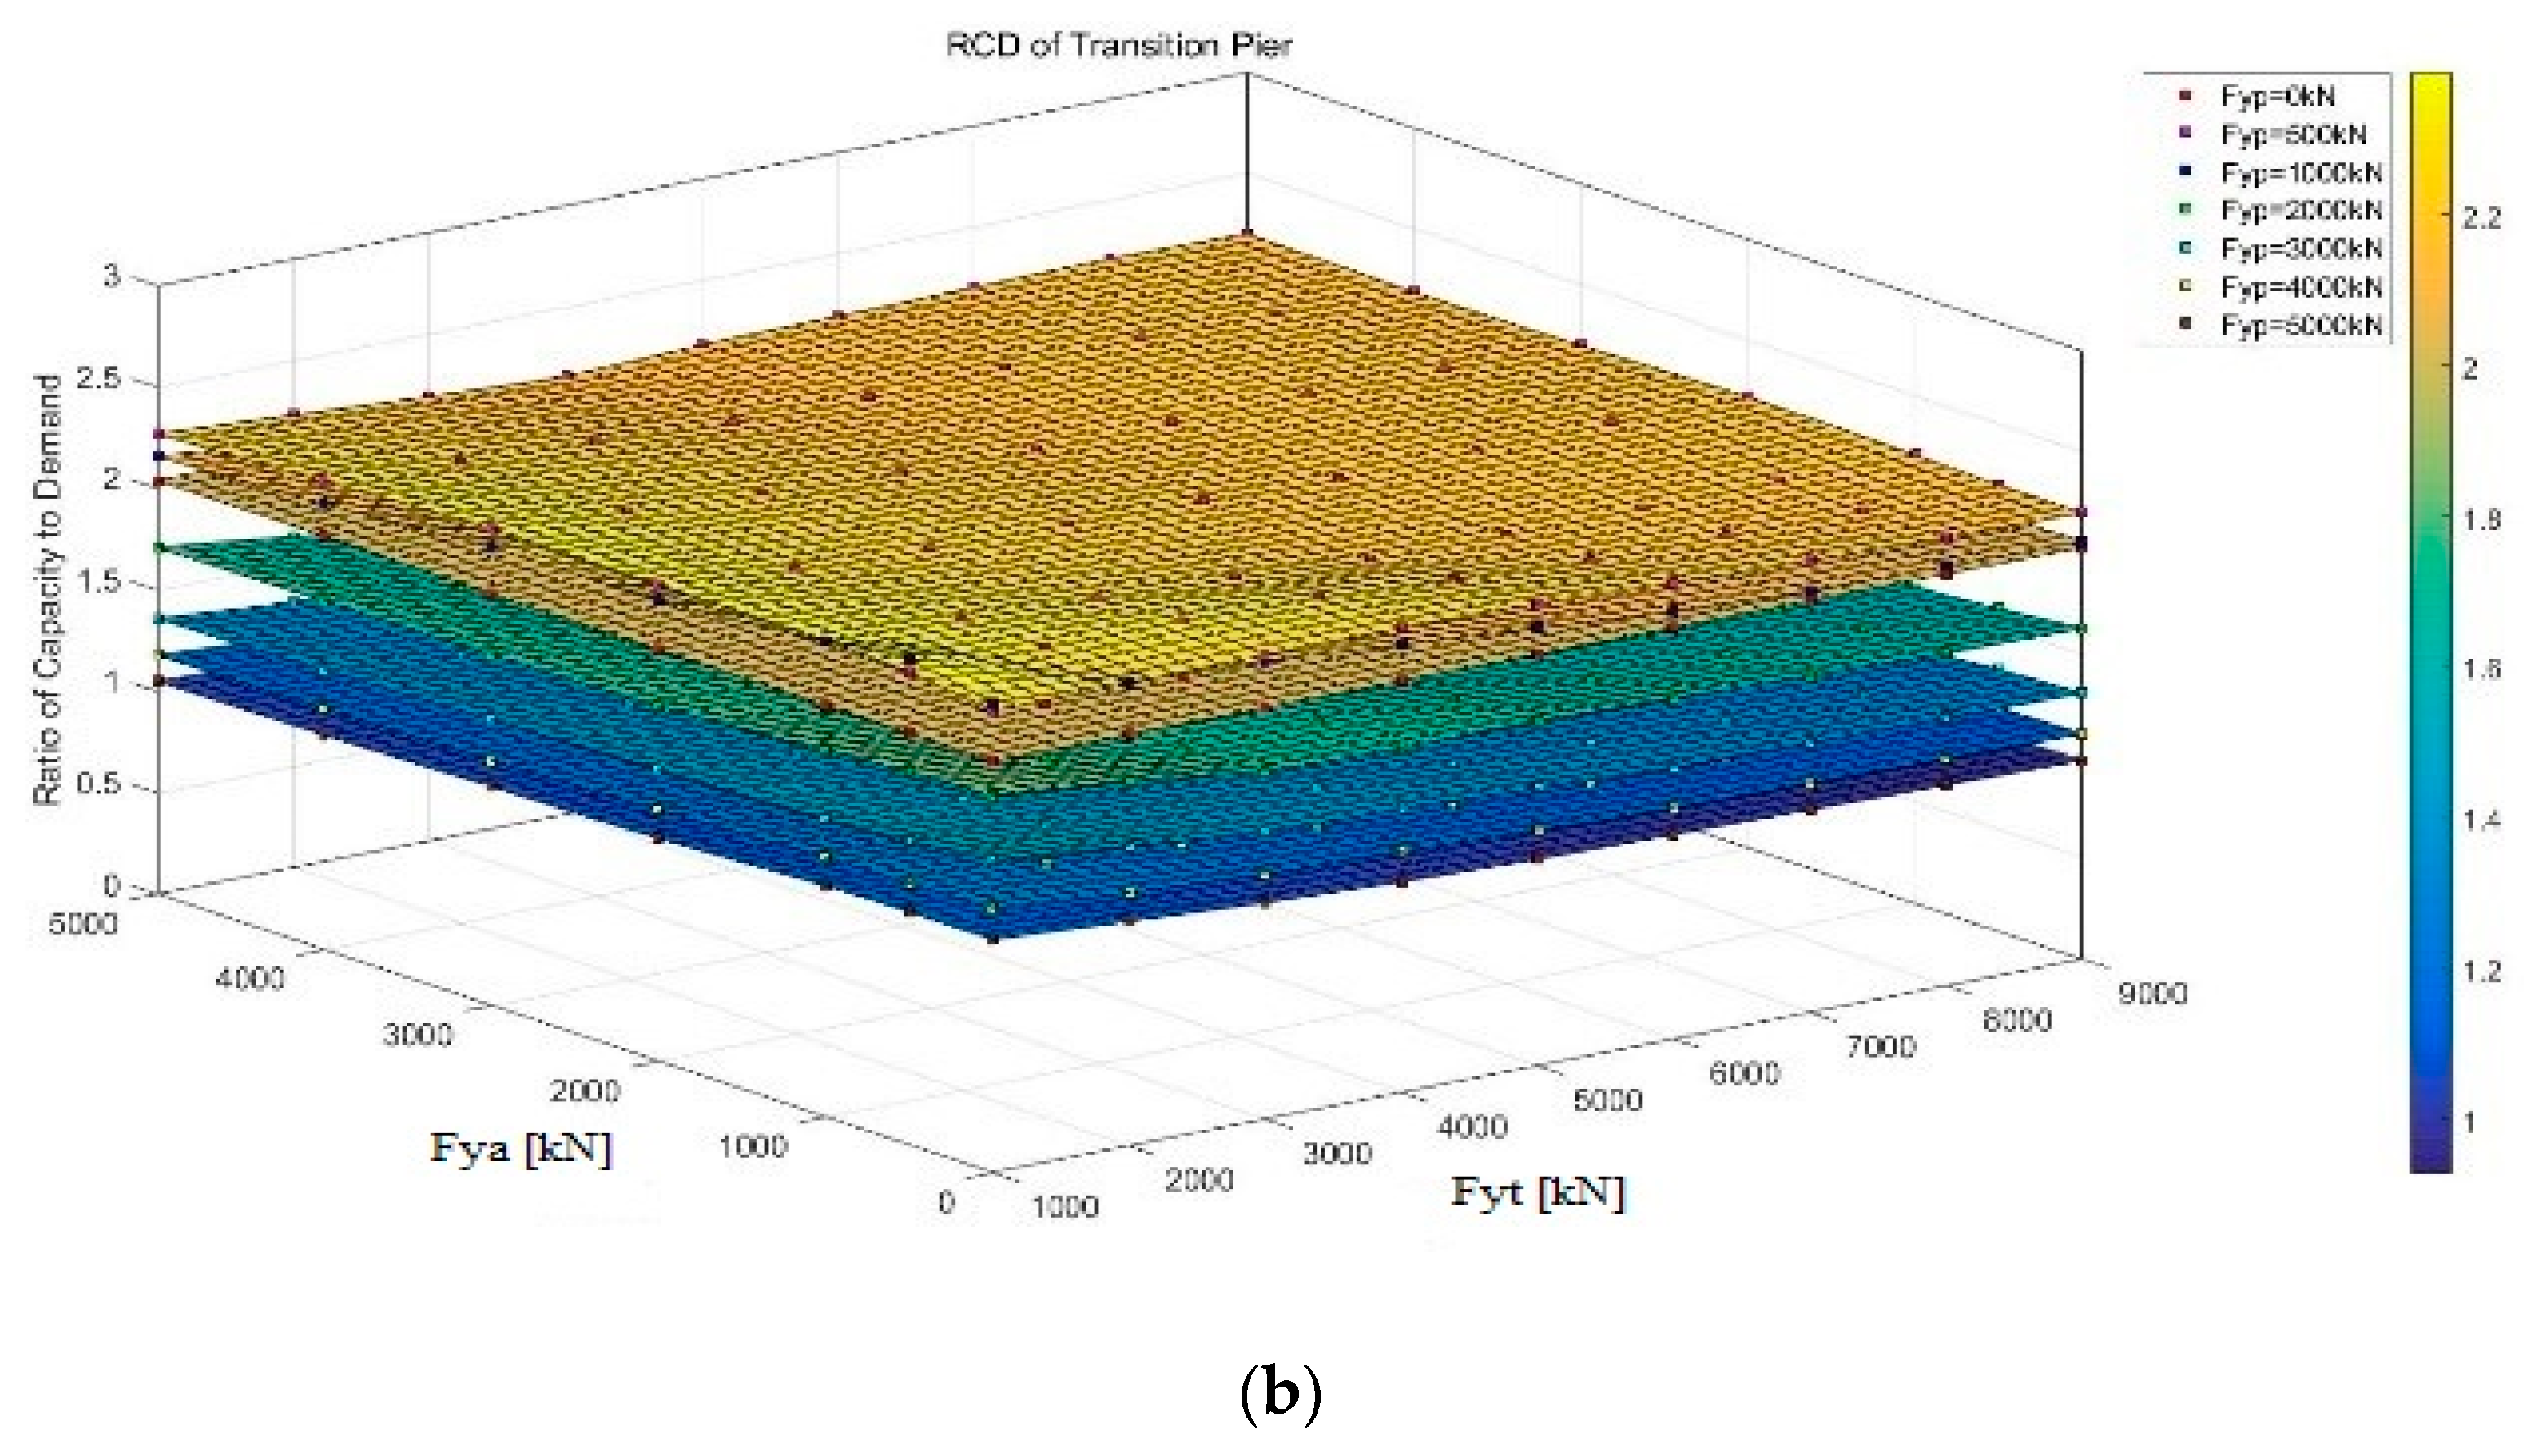
It can be seen from Figure 13b, Figure 14b and Figure 15b that there are obvious layers between the ratio of capacity to demand (RCD) surfaces, and each RCD surface is an approximate horizontal plane, which means that the RCD at each location is only affected by the yielding strength of the YSD at its own location but not by the yielding strength of YSDs at the other two locations. Therefore, the yielding strength of YSDs at each location can be decided independently according to this observation.
As for RCD, there is a common feature at each location: it increases at first and then decreases with the increasing yielding strength of YSD at its own location. The reason for this is the coupling effect of the installation of YSDs, which restrains the self-vibration of piers and produces the inertial force of the main girder. The former effect is significant when the yielding strength is relatively small, while the latter will become dominant with the increase of yielding strength.
Based on the above analysis, two designed objectives—i.e., the RCD is large and uniform or the RD is small and uniform—are set to determine the YSD yielding strength at each location.
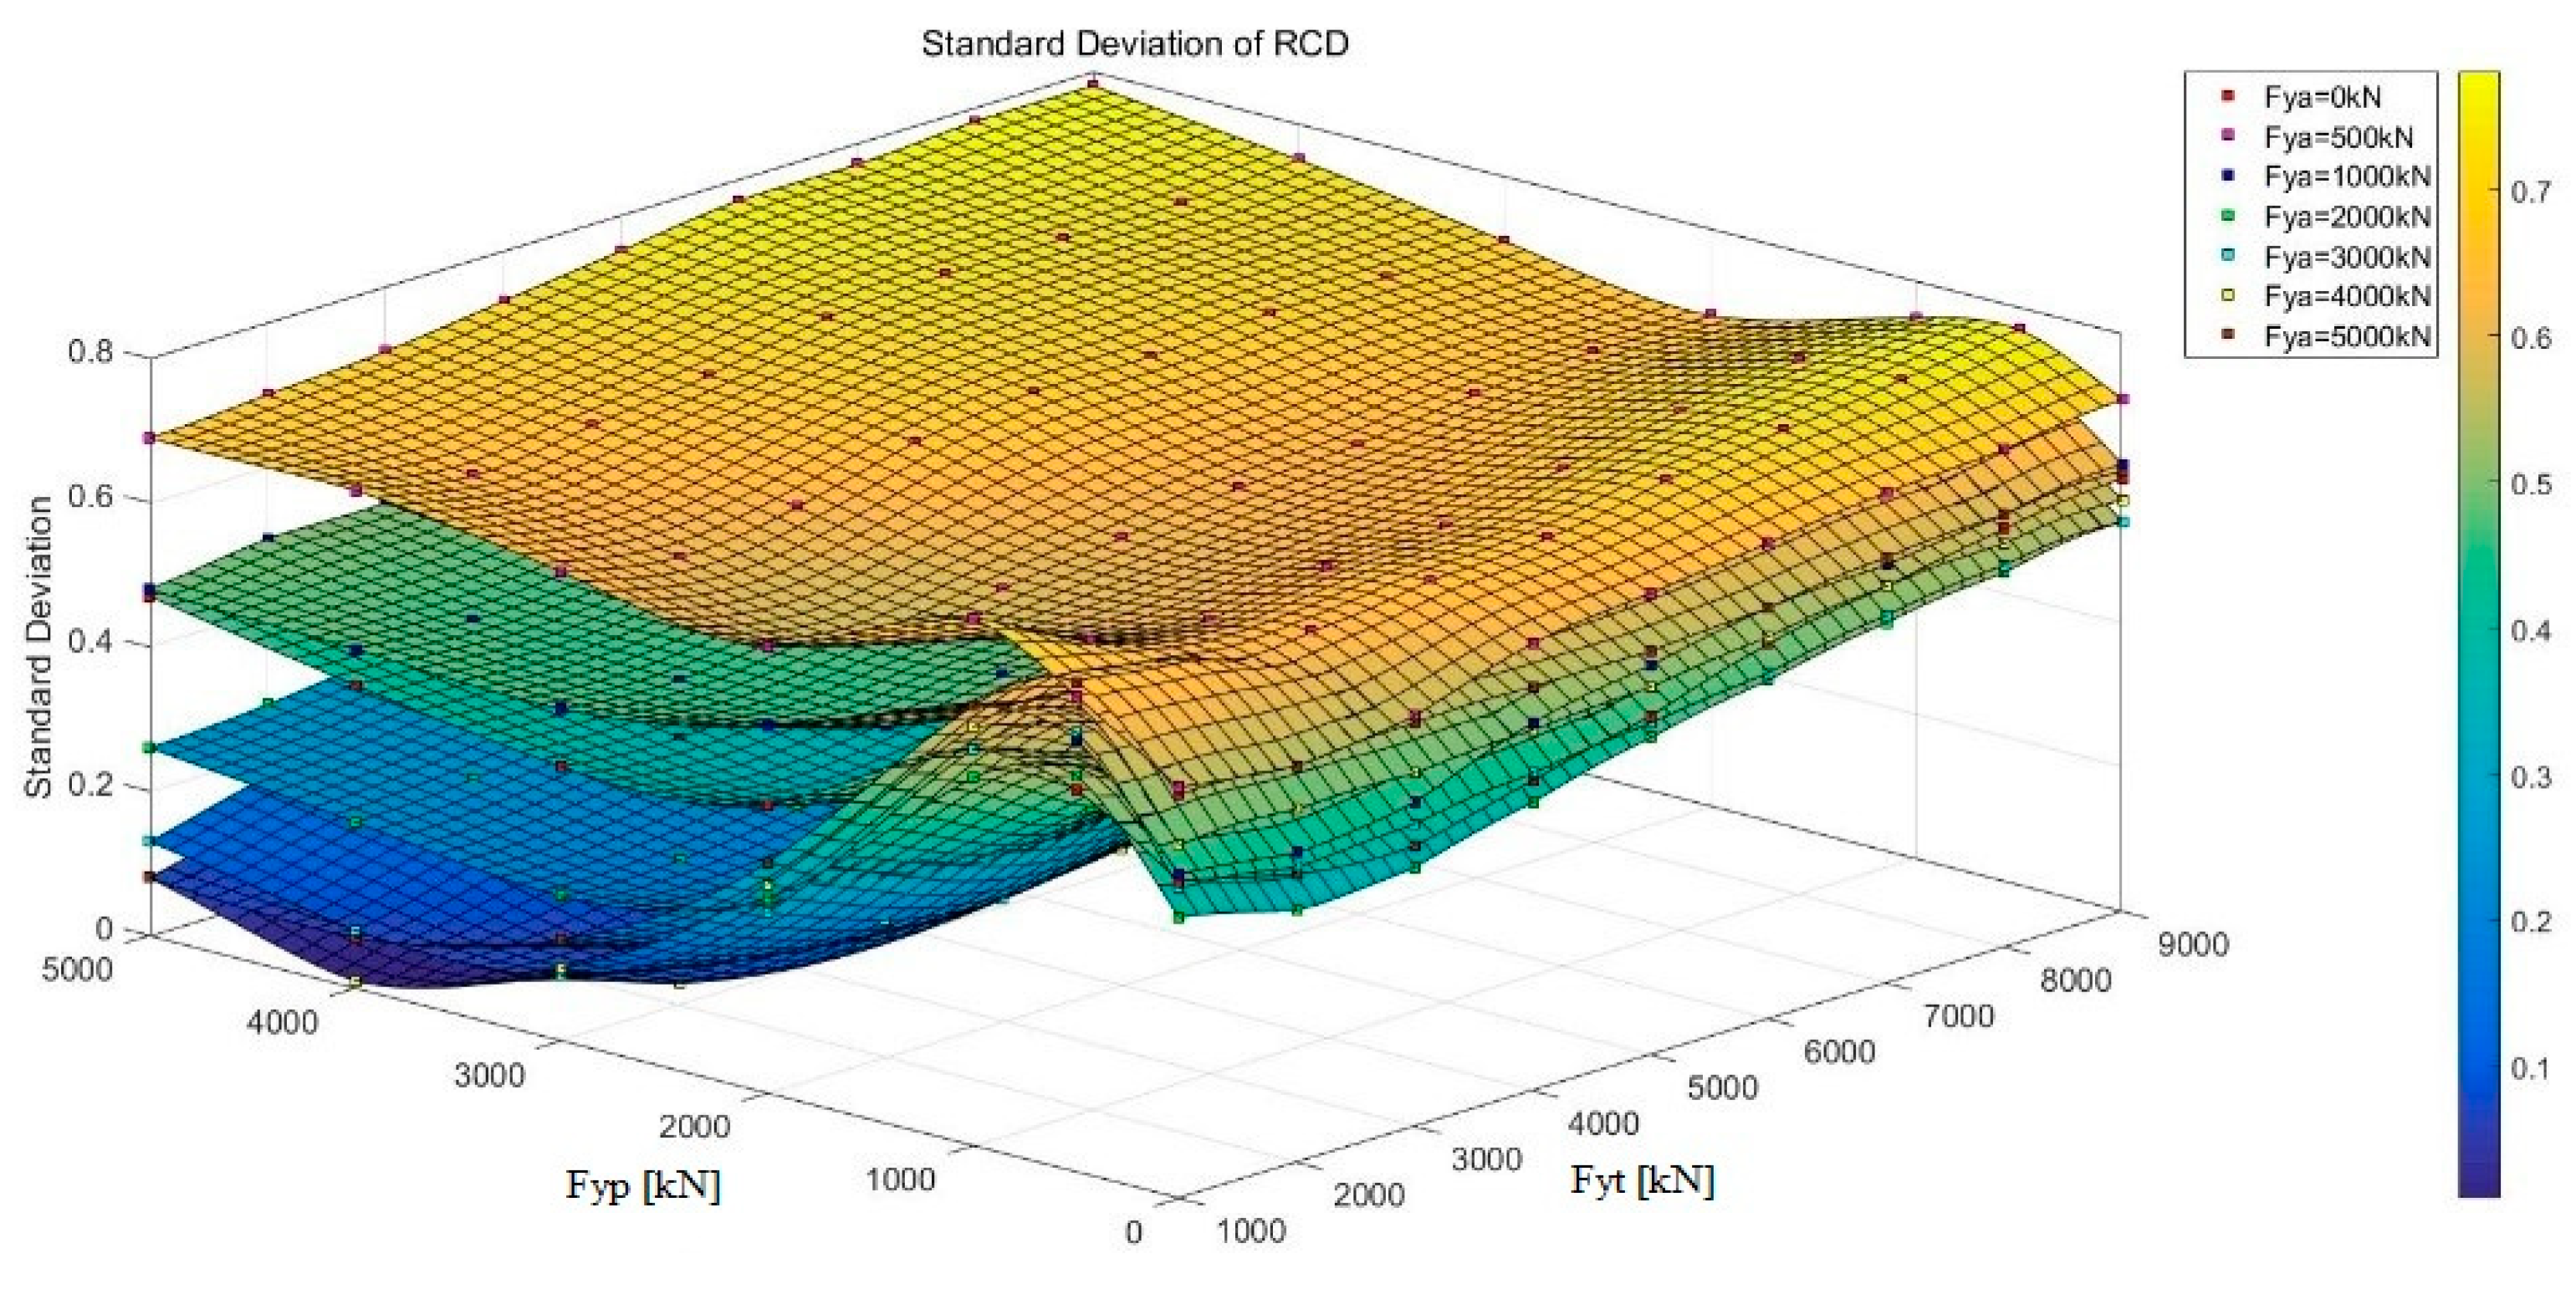
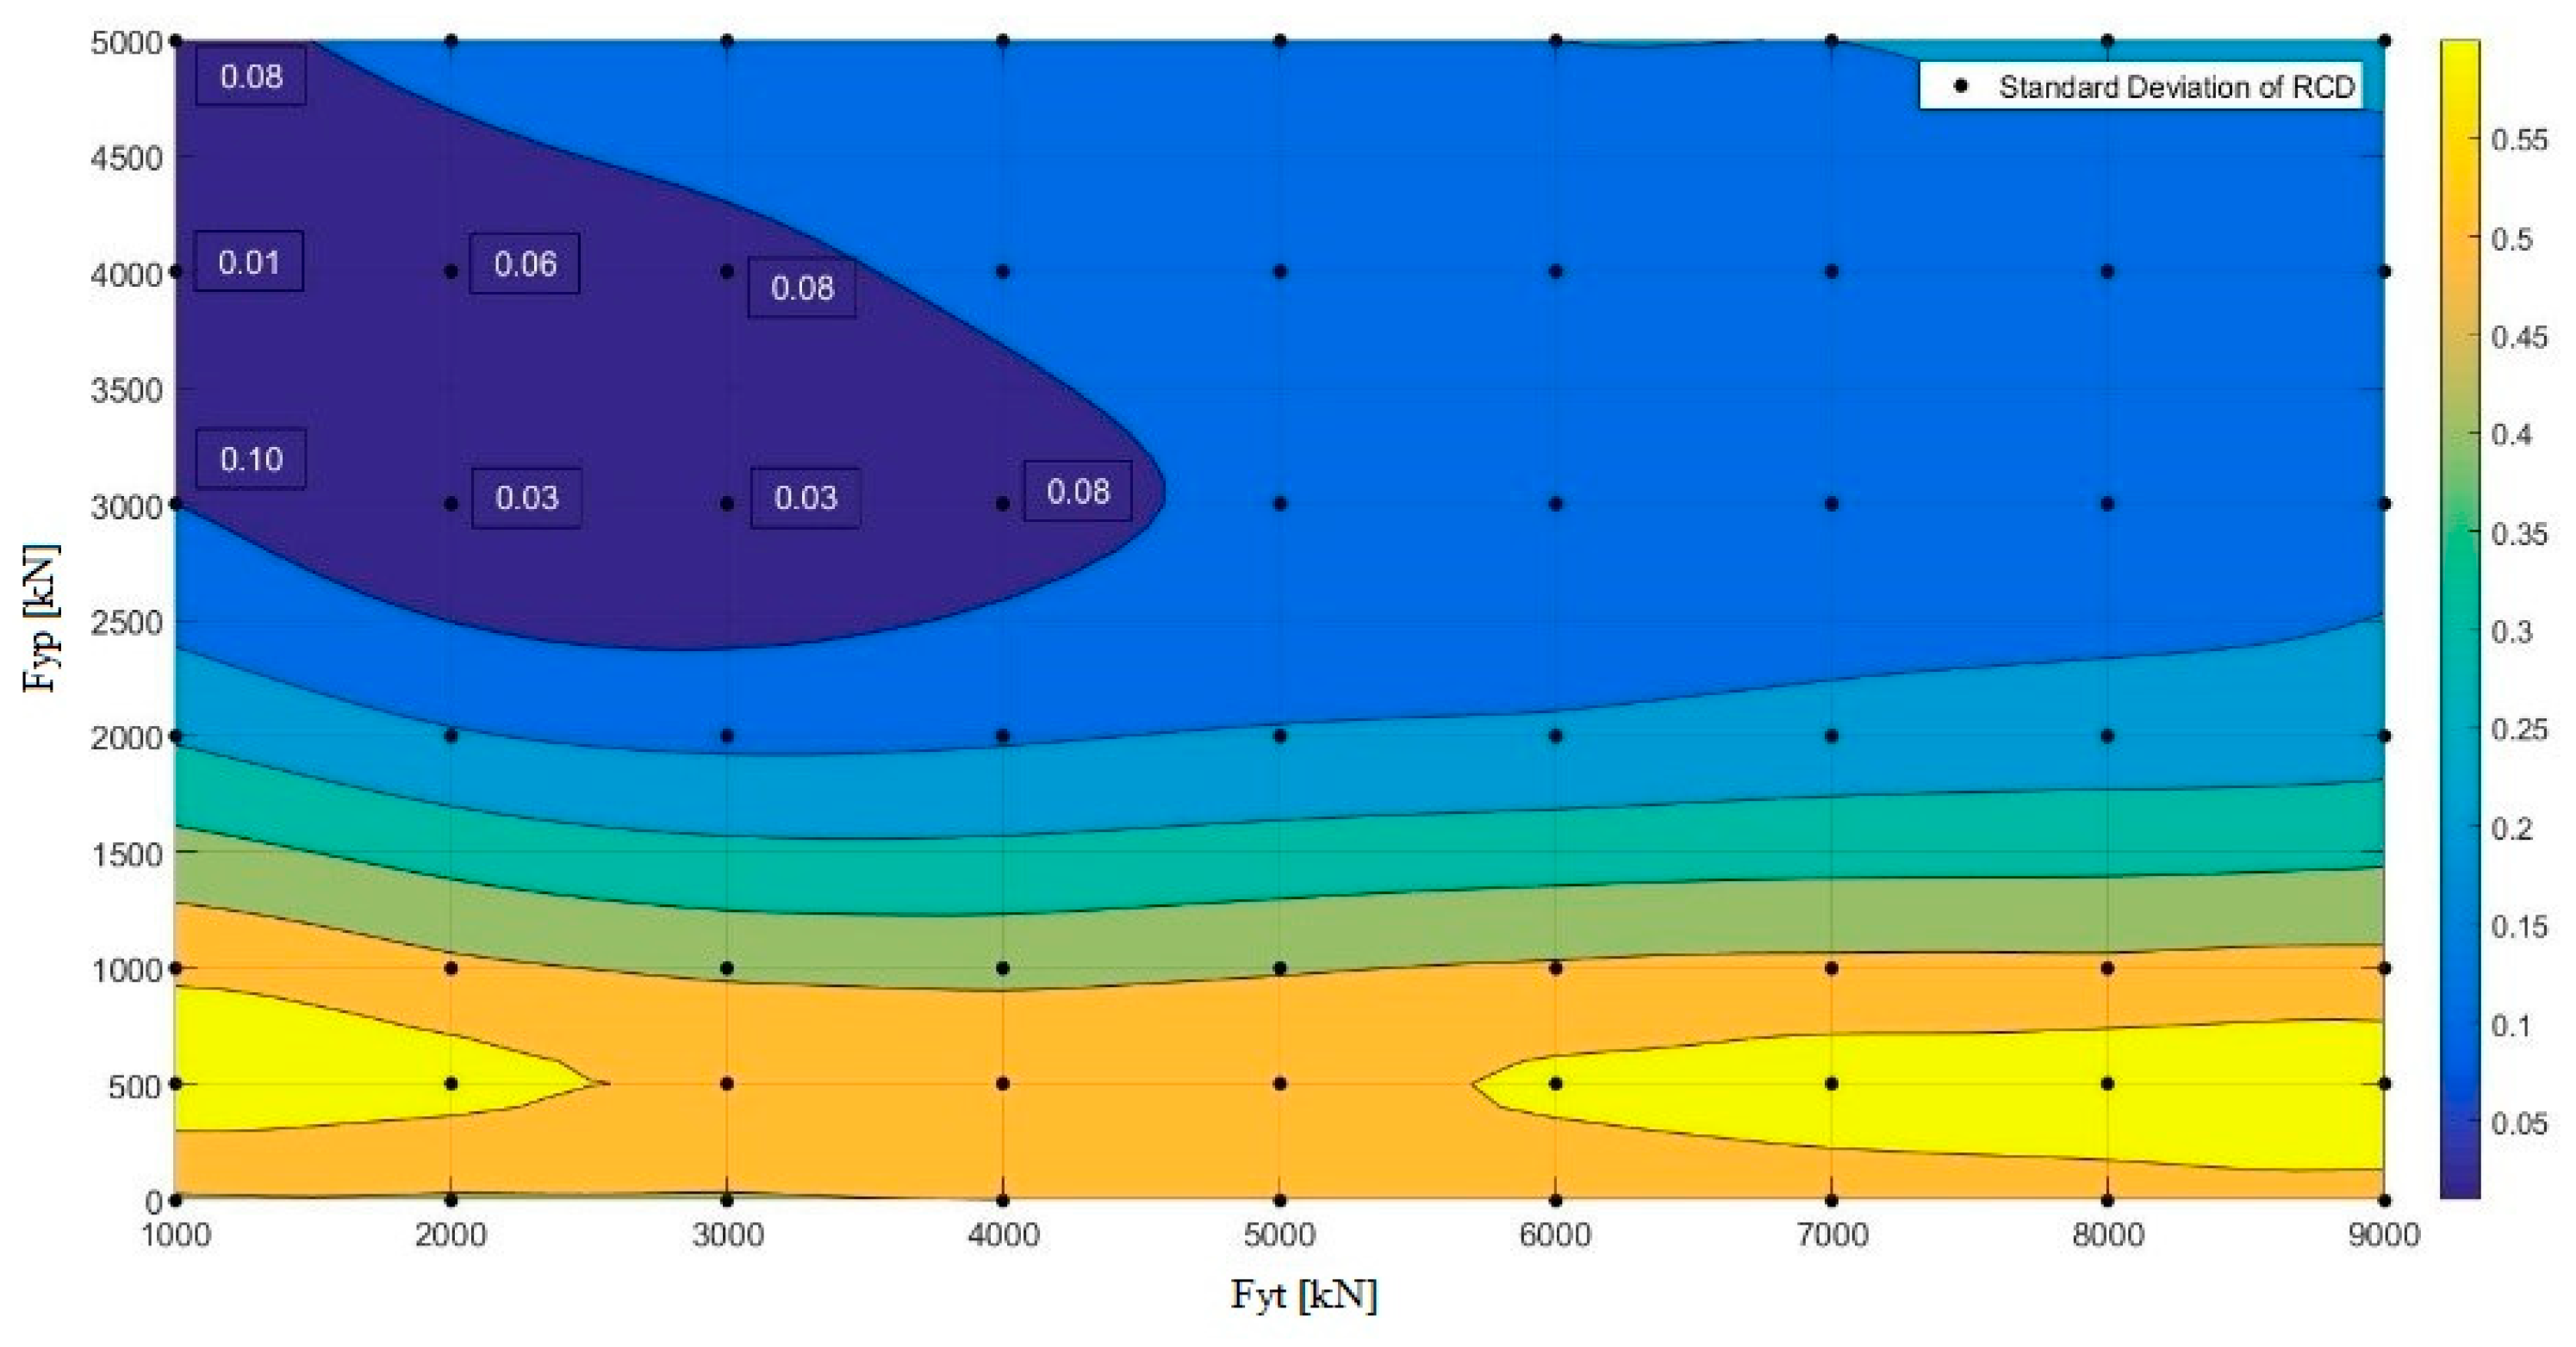
To achieve the two designed objectives above, the standard deviations of the RCD at different locations need to be calculated. As shown in Figure 16 and Figure 17, the minimum of standard deviation is obtained when Fya = 4000 kN, Fyp = 4000 kN and Fyt = 1000 kN (layout 1 in Table 3).
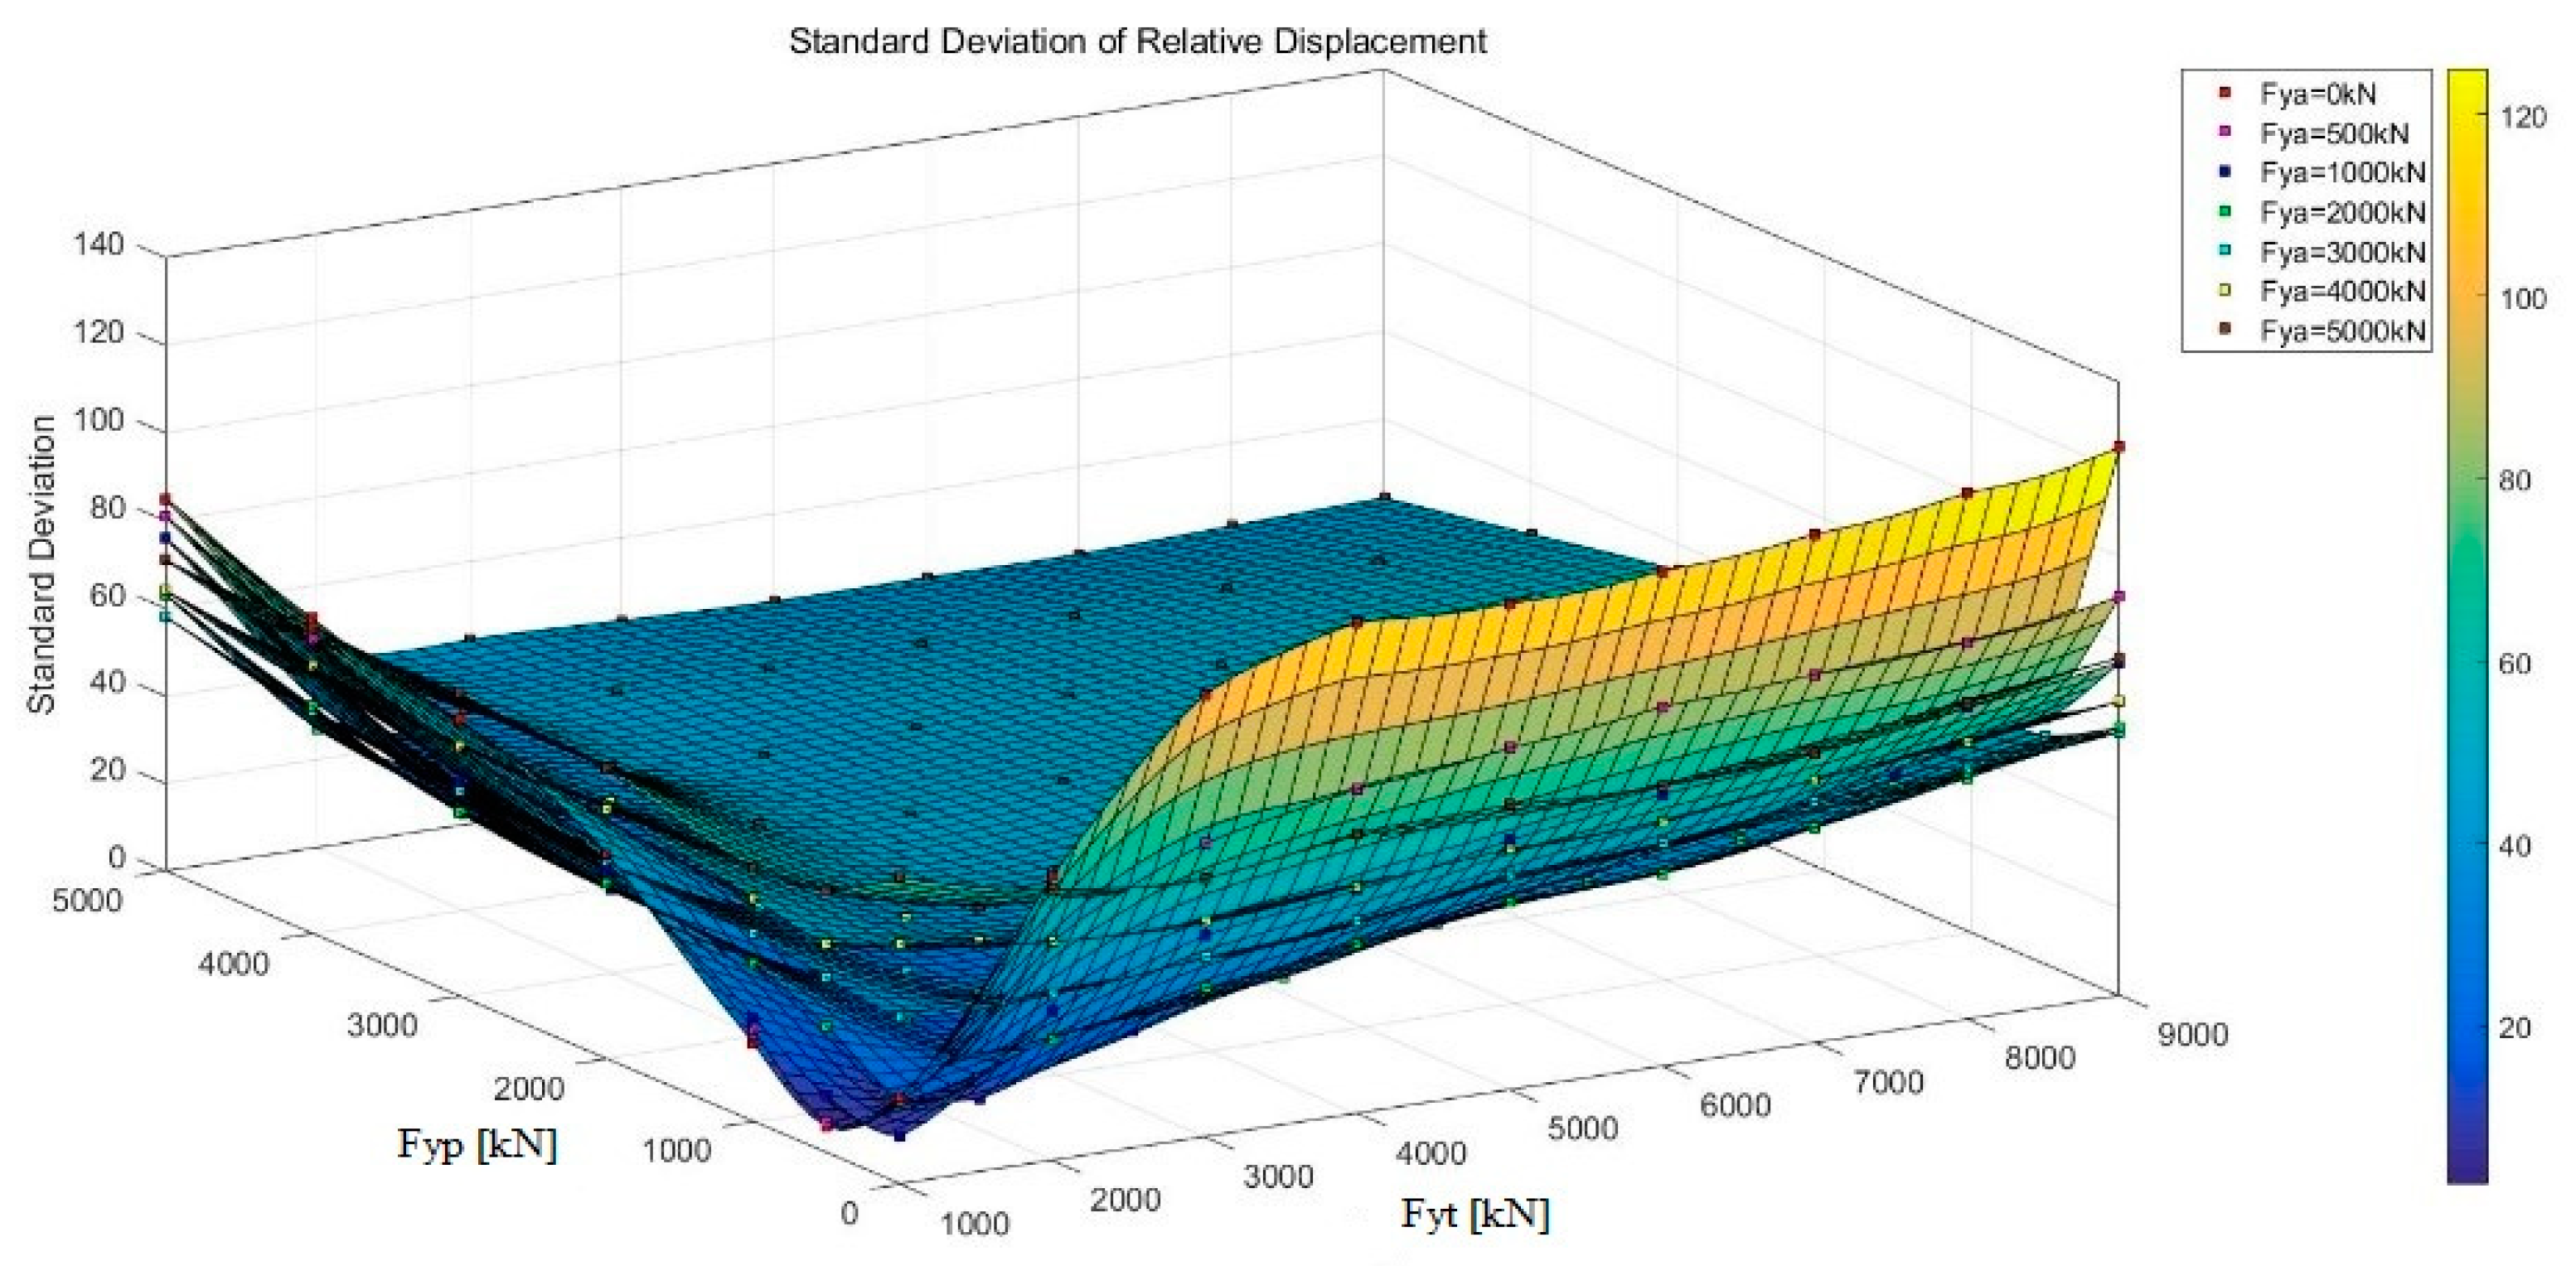
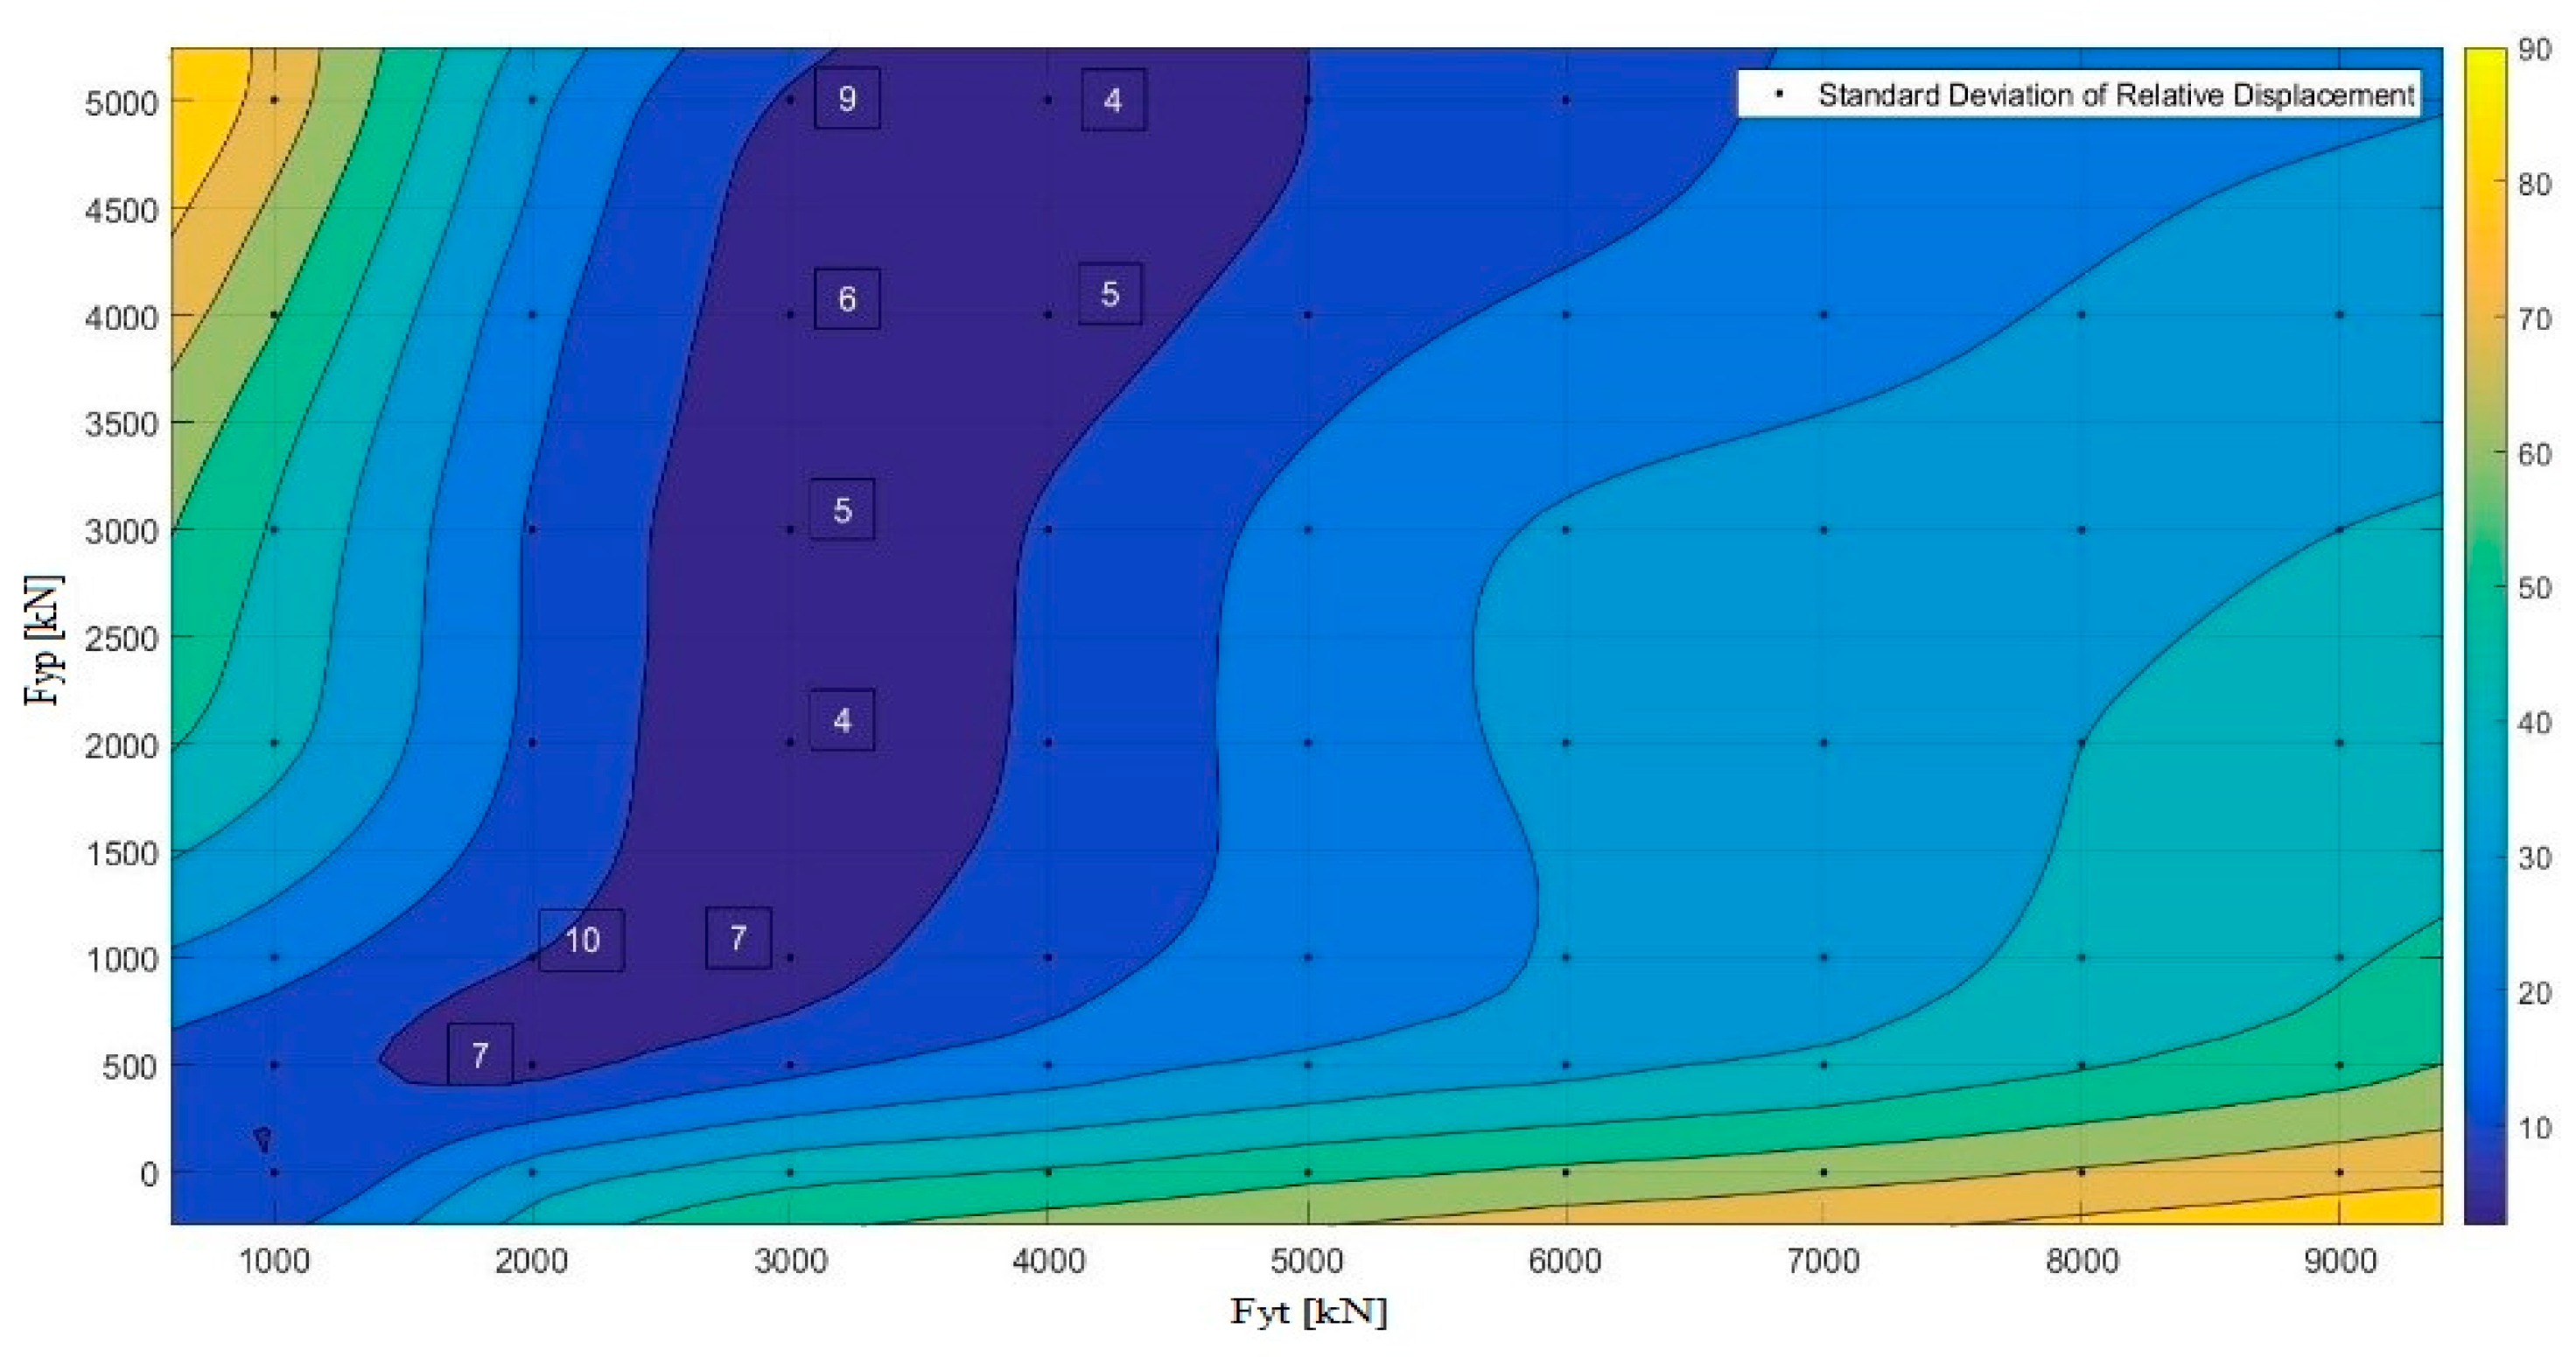
In the same way, as shown in Figure 18 and Figure 19, the minimum of the standard deviation of RD is obtained when Fya = 1000 kN, Fyp = 2000 kN and Fyt = 3000 kN or Fya = 1000 kN, Fyp = 5000 kN and Fyt = 4000 kN. Recalling Figure 13, Figure 14 and Figure 15, the RD of the latter is smaller, so Fya = 1000 kN, Fyp = 5000 kN and Fyt = 4000 kN is preferable (layout 2 in Table 3).

3.3. Single Variable Function Analysis

As shown above, although we can achieve the designed layout of the bridge system by carrying out a comprehensive parametric analysis, it is time-consuming. Considering the result that the RD at each location decreases with the increase of the yielding strengths at any location, but the RCD is only influenced by the yielding strength of its own location, we can make the analysis easier by only using a one-variable function; that is, two of the variables (Fyt and Fyp or Fyt and Fya or Fyp and Fya) can remain unchanged to study the influence of the other variable (Fyt or Fyp or Fya) on the structure’s seismic response. Consequently, three series of cases are analyzed: (1) Fya varies from 0 kN to 5000 kN, while Fyt and Fyp remain constant; (2) Fyp varies from 0 kN to 5000 kN, while Fya and Fyt remain constant; and (3) Fyt varies from 1000 kN to 9000 kN, while Fya and Fyp remain constant. In fact, it is required that the others should remain when analyzing the influence of yielding strength of the specified location. For illustration purposes, 2000 kN was set.
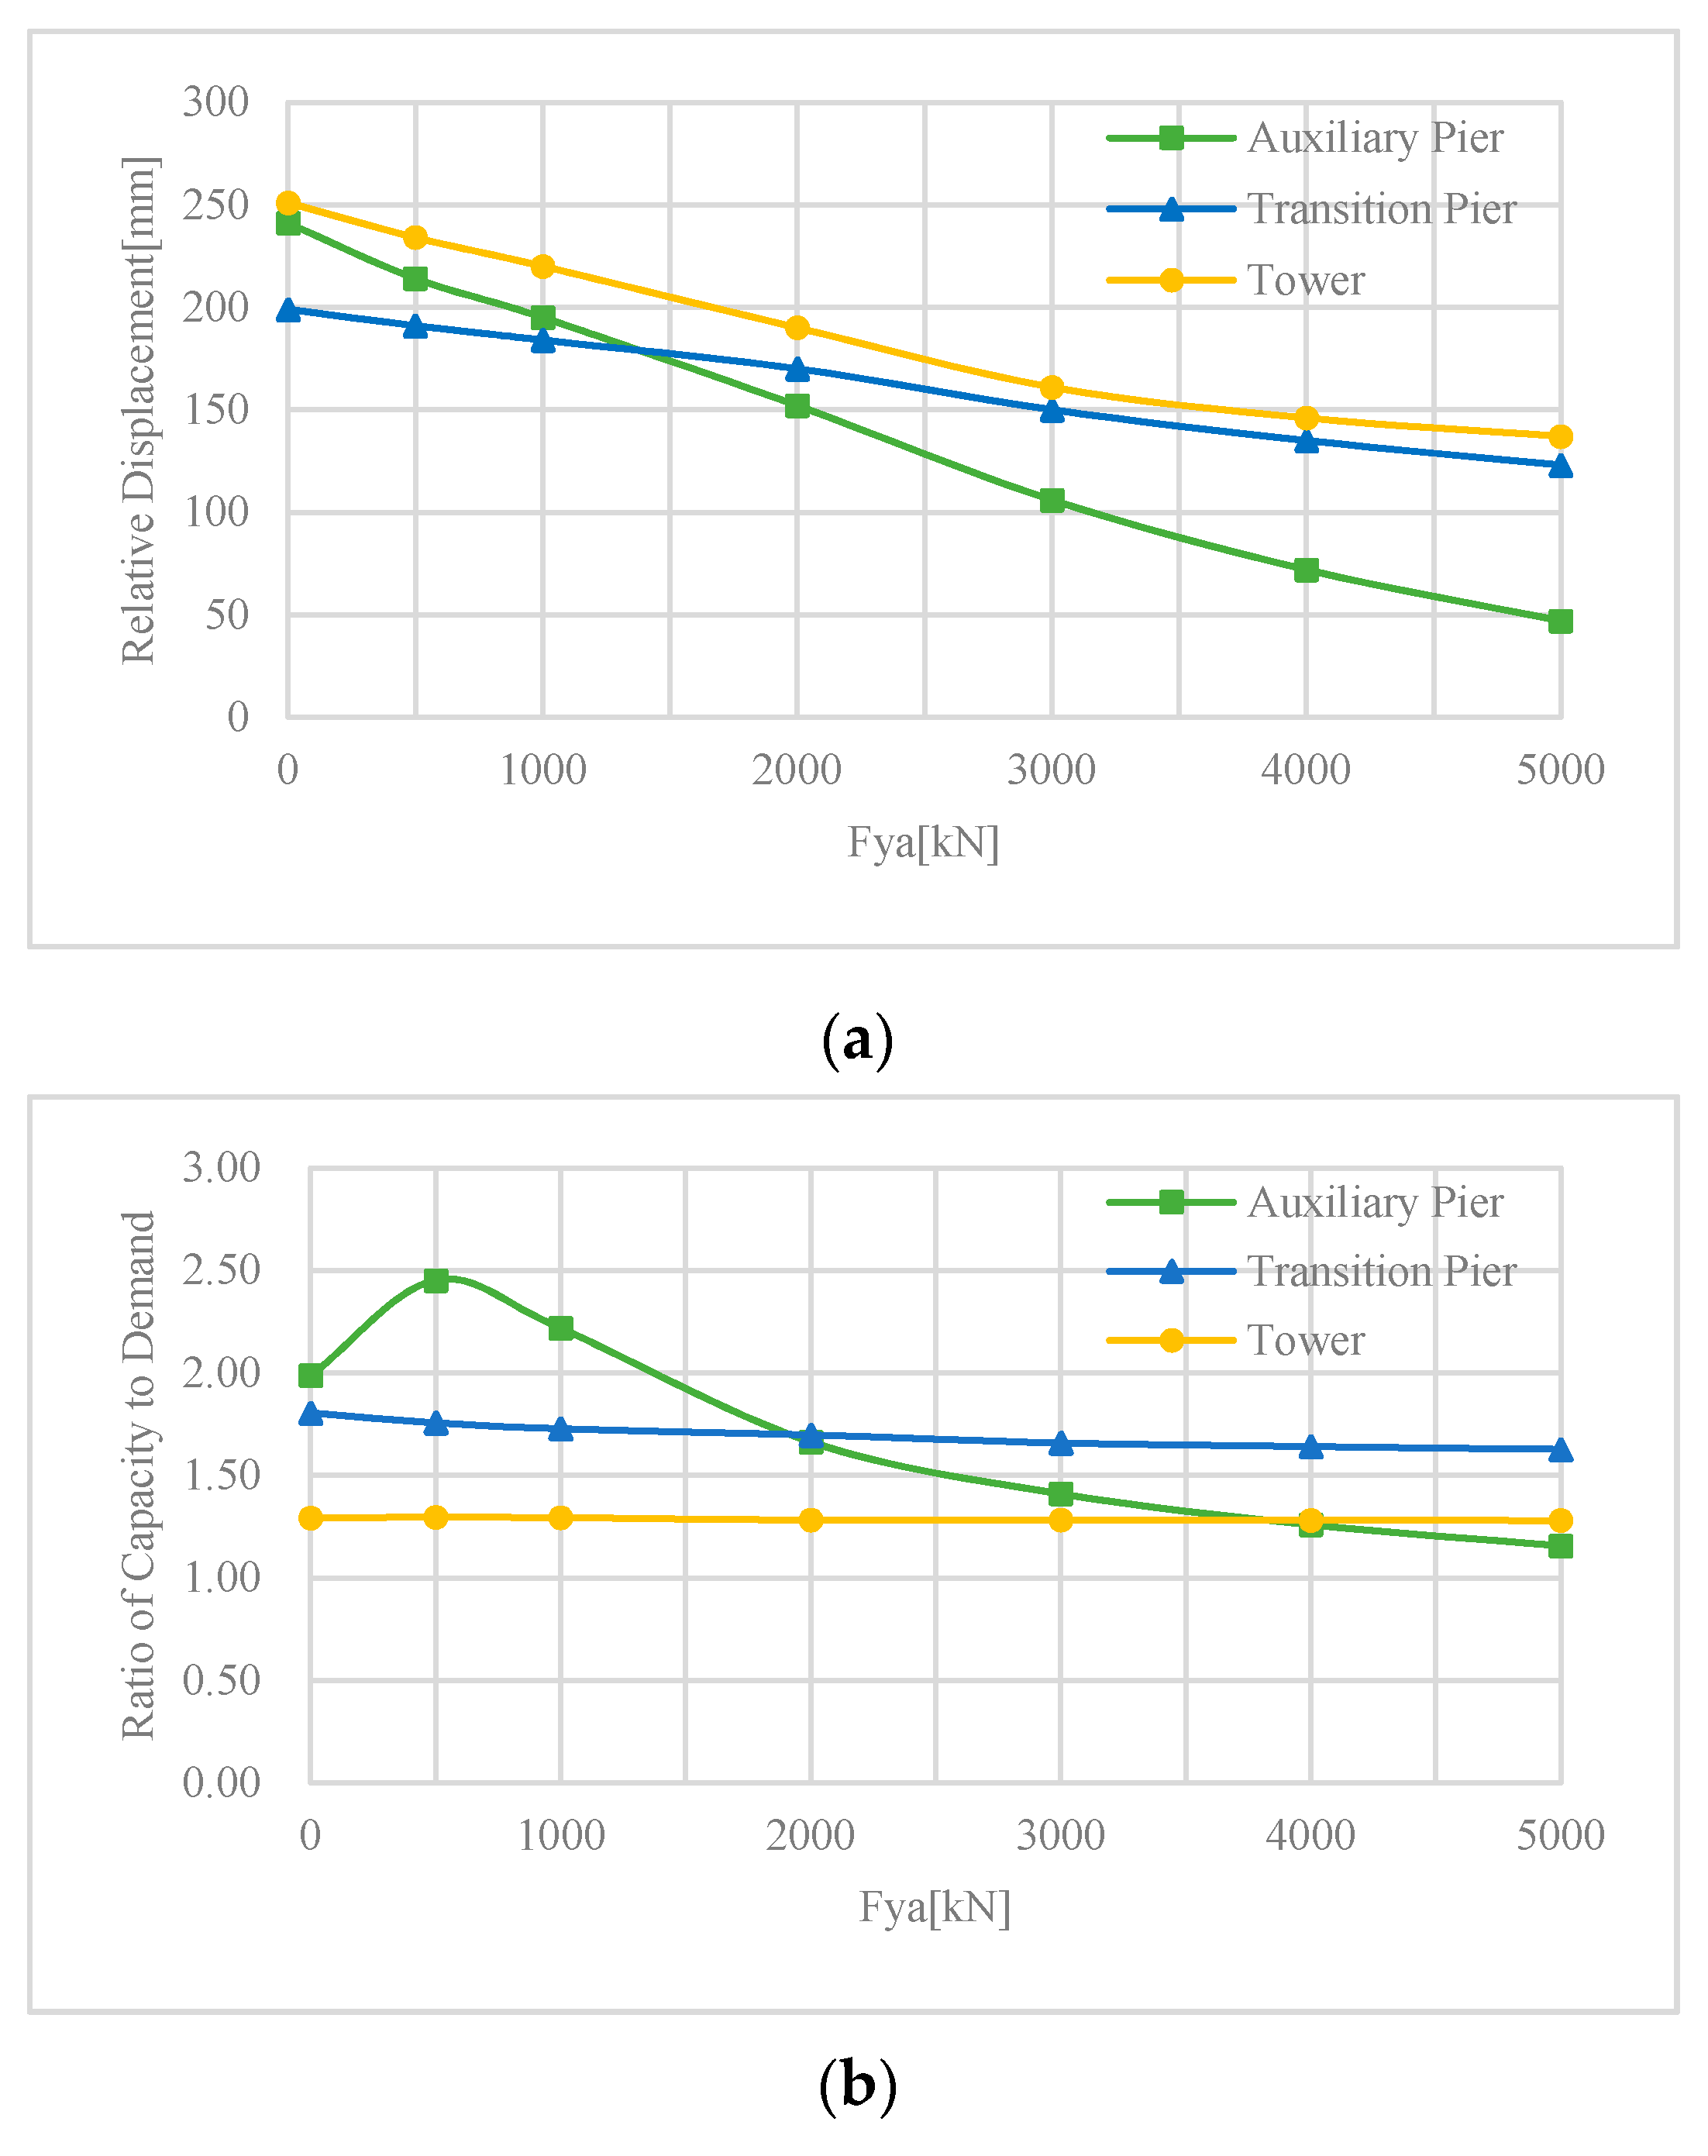
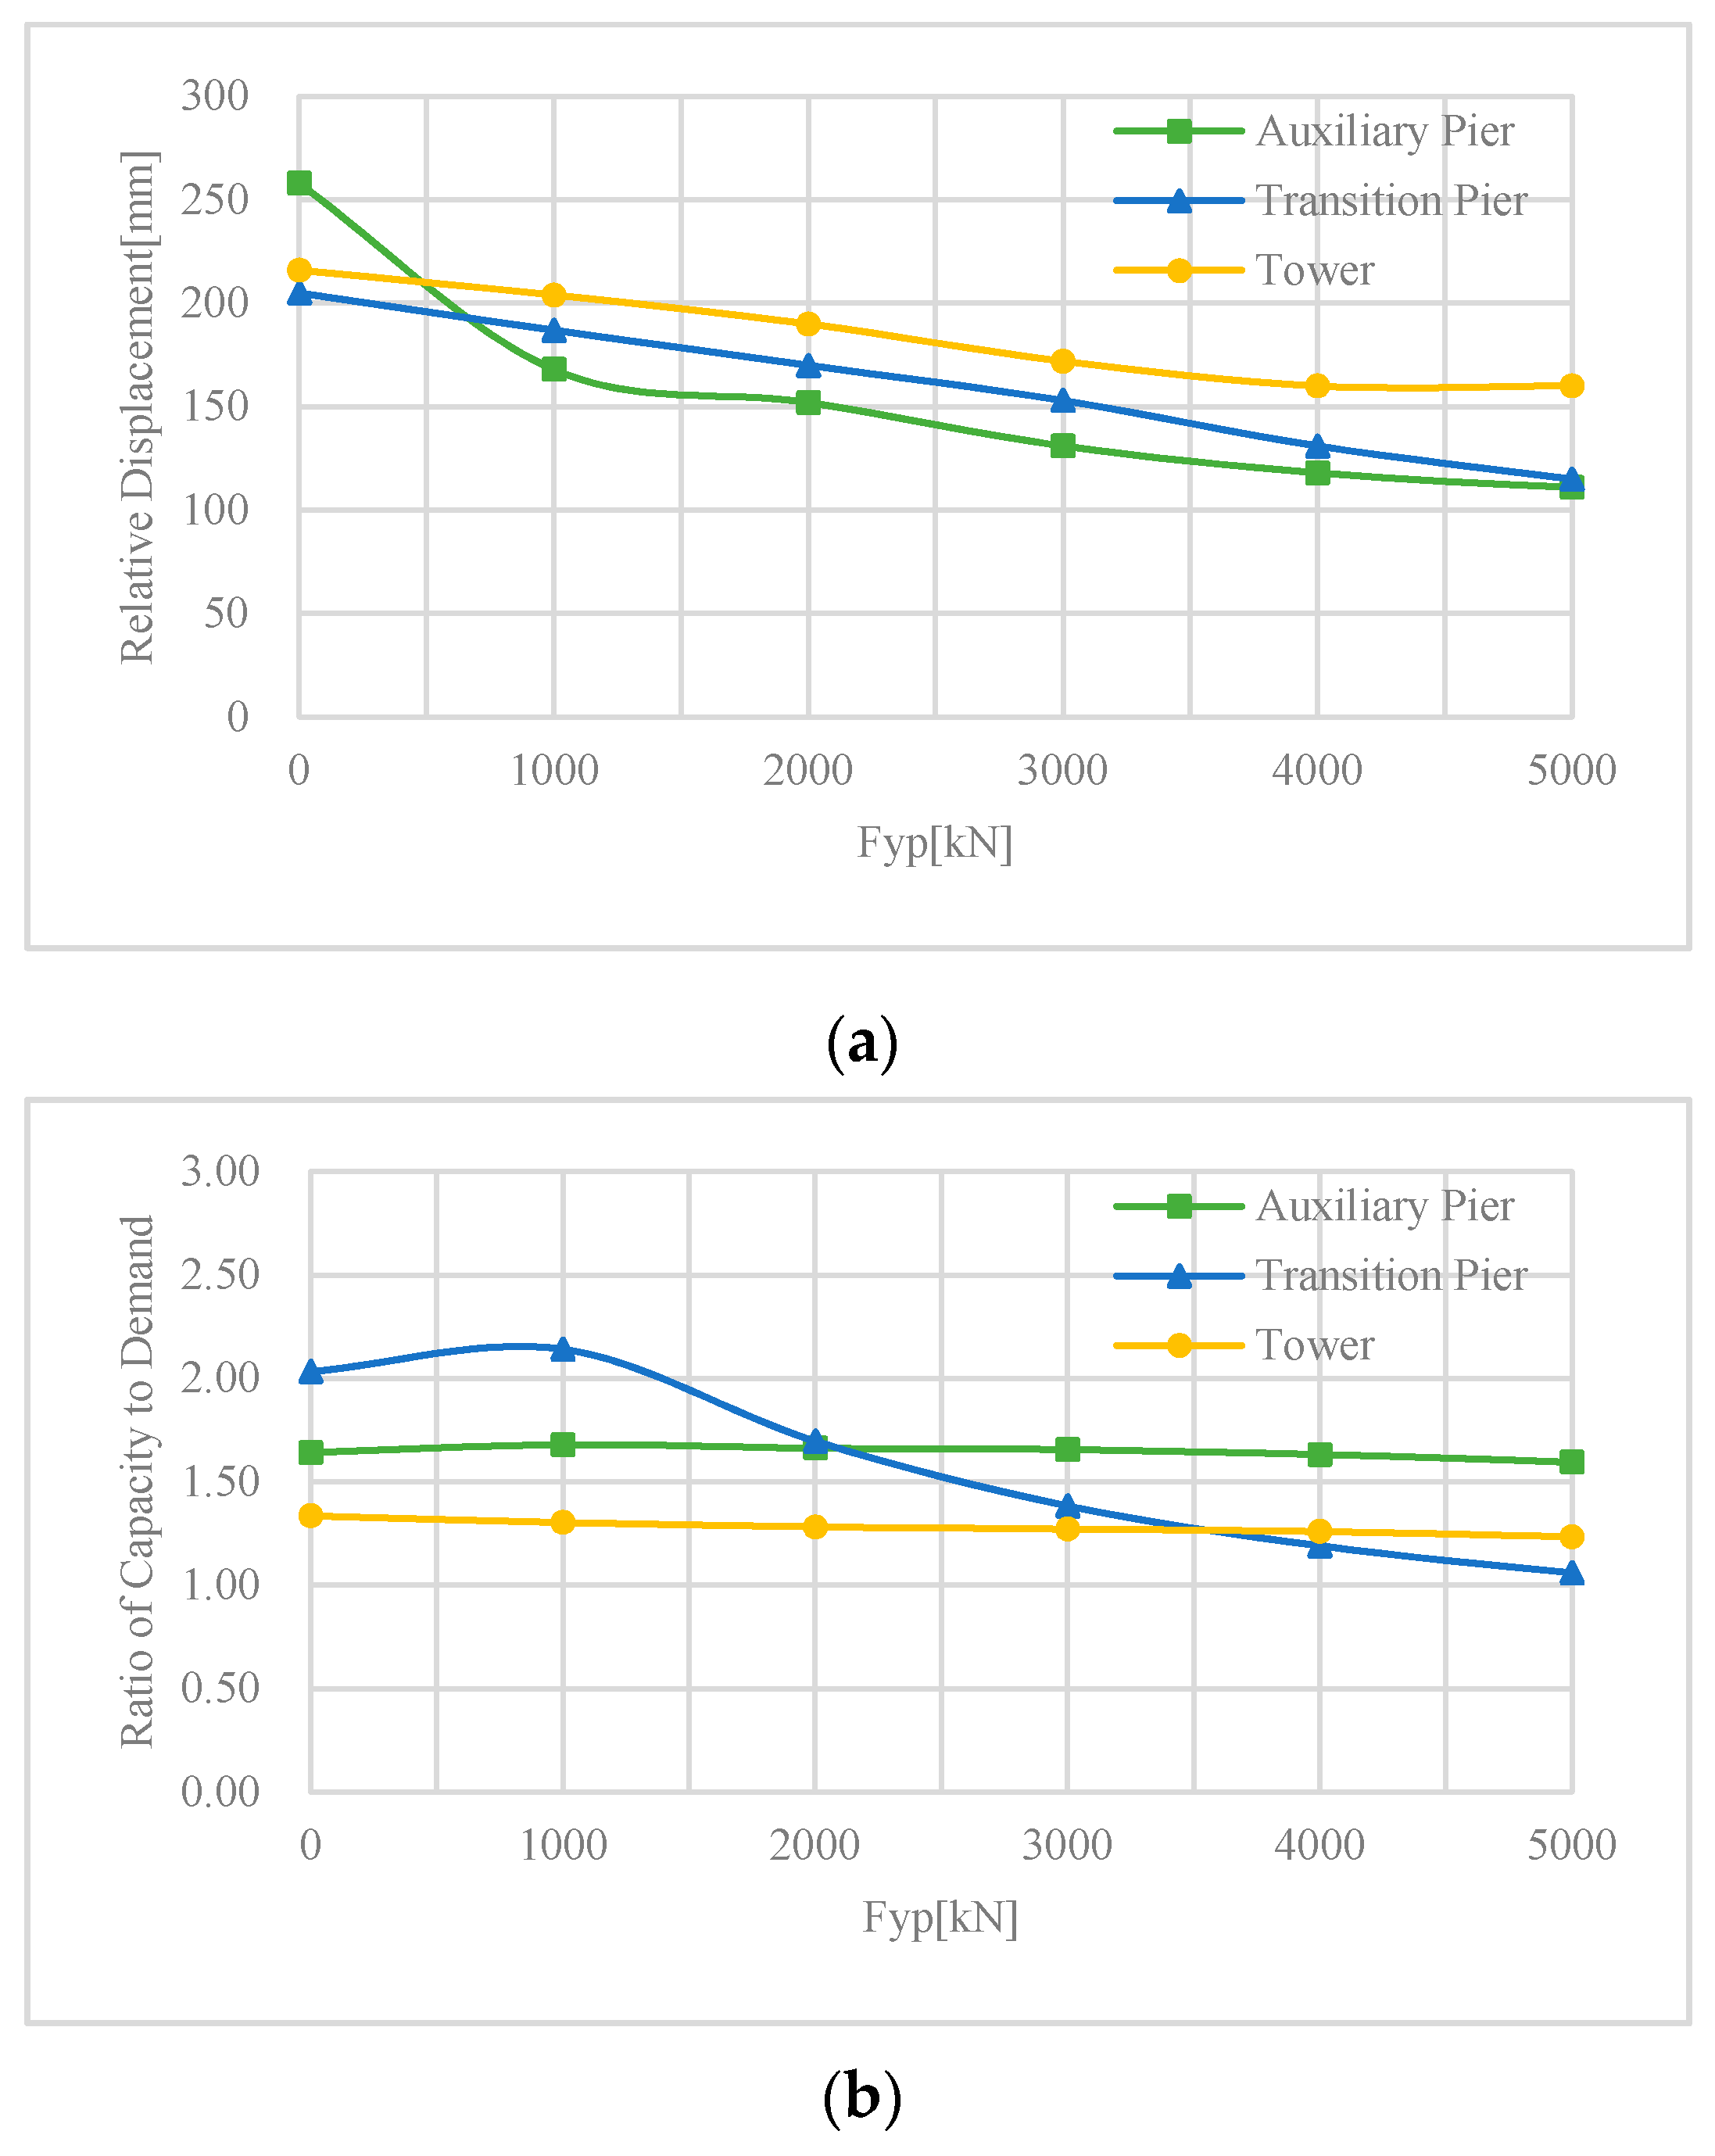
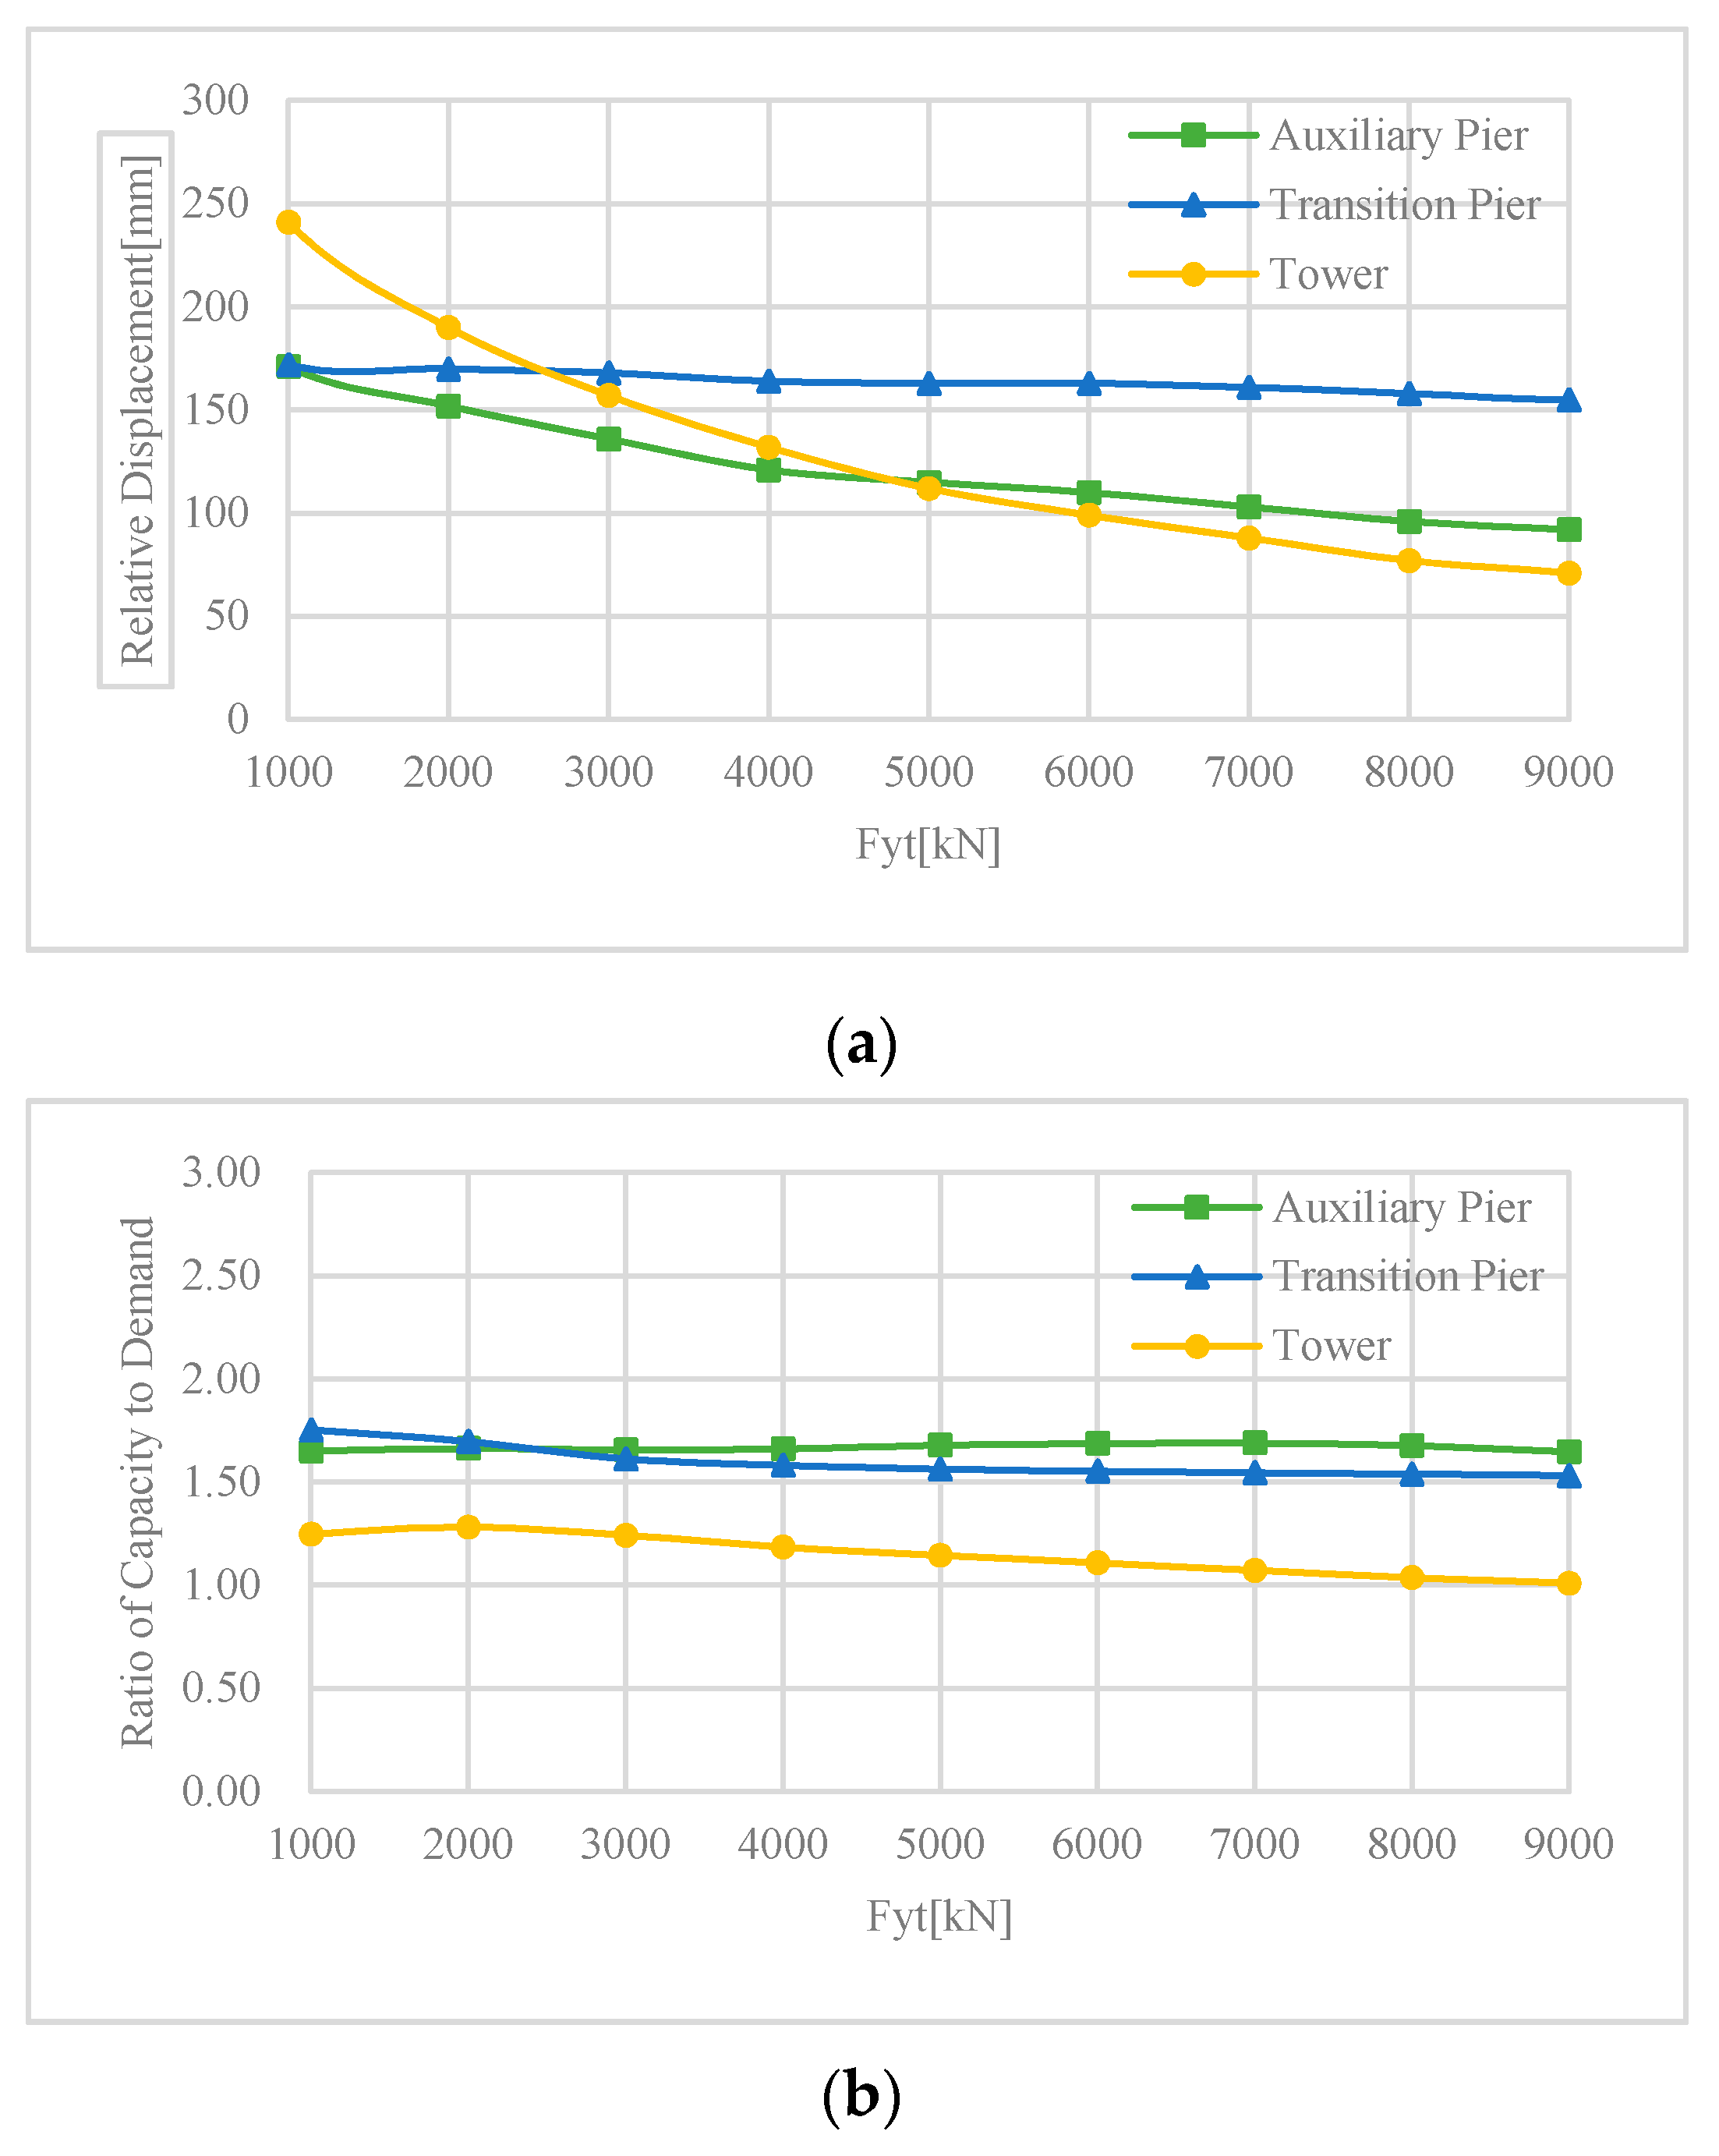
It can be seen from Figure 20a, Figure 21a and Figure 22a that when the yielding strength is relatively small, with the increase of Fy, the girder–pier/column RD at the auxiliary pier, transition pier and tower column decrease significantly. However, when the yielding strength is relatively large, the Fy only affects the displacement at its own location without a significant change at the other two locations. As shown in Figure 20b, Figure 21b and Figure 22b, with the increase of Fy, there is a significant fluctuation of the RCD curve at its own location, but the RCD curves at the other two locations are approximately flat. In addition, the RCD curve at each location increases first and then decreases, indicating that a peak must exist. Obviously, this result is consistent with that of the multivariate function analysis but much more concise. In addition, according to Figure 20b, Figure 21b and Figure 22b, the following Table 4 can be obtained to verify the correctness of the proportion of the above natural vibration response.
As a matter of fact, the overall shear force transferred to the column end consists of two parts: one is from the inertial force developed by the girder and the other is from the self-vibration of the column itself. In order to determine the scope of parameter analysis, it is necessary to determine the proportion that the self-vibration response would take. Figure 16, Figure 17 and Figure 18 can be obtained after the possible range of this proportion is determined, and one of the cases is taken as an example to illustrate that this self-vibration ratio is indeed around 0.3.
It can be approximated that the increase of Fy generally constrains the RDs of piers or towers, and only has a significant impact on its own location compared to the other two. Therefore, it can be considered that the selection of Fya, Fyp and Fyt is independent and not coupled.
According to Figure 20b, Figure 21b and Figure 22b, the tower has the minimal RCD curve compared with other piers; to achieve one of the designed objectives as mentioned in multivariable analysis (large and uniform RCDs), Fyt should be set to its peak value of 2000 kN as shown in Figure 22b. Then, on the grounds of the intersection of the RCD curves of the auxiliary pier and of the tower in Figure 20b, Fya should be 4000 kN, and Fyp should be approximately 4000 kN. Therefore, Fya = 4000 kN, Fyp = 4000 kN and Fyt = 2000 kN (layout 3 in Table 3) is one of the reasonable solutions obtained through single variable function analysis.
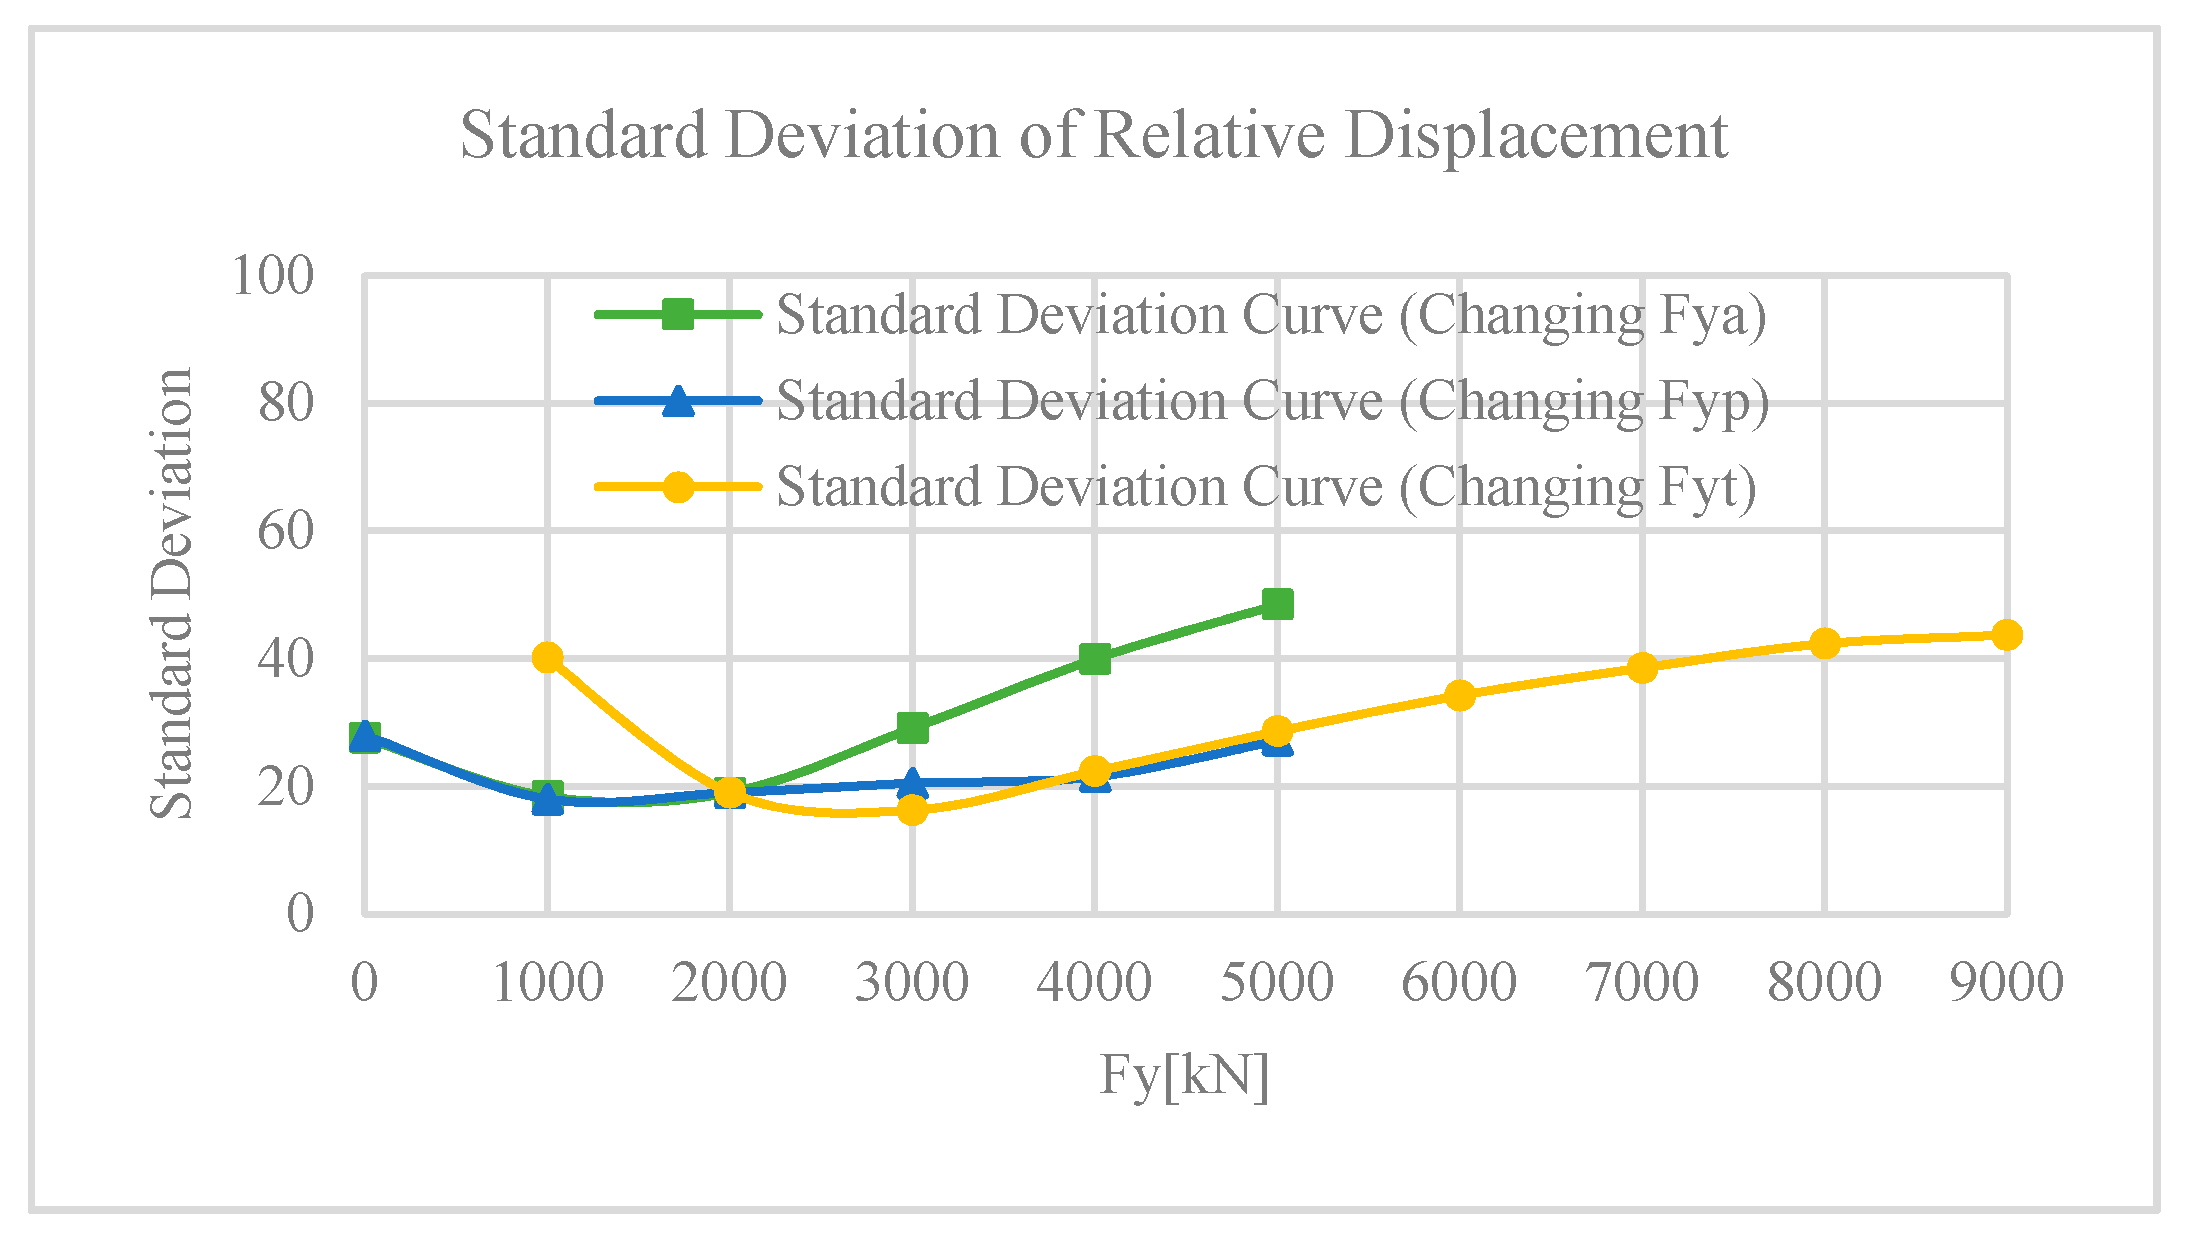
In terms of Figure 20a, Figure 21a and Figure 22a, it is difficult to obtain a set of reasonable yielding strengths directly. Therefore, it is necessary to draw the standard deviation curve varying with each yielding strength and assume that the three curves are independent of each other. As shown in Figure 23, the reasonable range of Fya, Fyp and Fyt is 1000 kN~2000 kN, 1000 kN~4000 kN and 2000 kN~4000 kN, respectively. In order to achieve the other designed objective (i.e., a small and uniform RD), the yielding strengths should be as large as possible; therefore, Fya = 1000 kN, Fyp = 4000 kN and Fyt = 4000 kN is the other reasonable solution (layout 4 in Table 3).

3.4. Comparison of the Designed Results

Based on the above analysis, we can obtain four designed layouts as shown in Table 3 accordingly. We can observe that the designed result is different according to different designed objectives. Comparing the results of the two analysis methods, it is obvious that the results are quite similar; the one-variable analysis results only differ slightly from those of the multi-variable function analysis. The reason is that one-variable analysis cannot fully consider the influence of three yielding strengths on structural response and assumes that the three variables are independent from each other. Therefore, they are not exactly the same but generally consistent. However, as seen in Table 3, it is easy to determine that using YSDs can effectively improve the bridge’s seismic performance at key locations overall, irrespective of which designed objective is used.
It is obvious that the designed layouts 2 and 4 can obtain a better seismic performance overall if other factors, such as tower top drift and girder displacement, are included. It is worth noting that the comparable large RCD at the auxiliary pier from layouts 2 and 4 is almost the same as that of the bridge system without YSDs, which indicates the seismic design capacity of the auxiliary pier can essentially be decreased for cost efficiency.

4. Dynamic Vibration of Bridge Systems with and without YSDs

As mentioned above, Table 3 shows the averaged maximum response comparison of the two bridge systems with and without YSDs. Firstly, the RCD of the tower column significantly jumps to around 1.2 from 0.59, which means that the internal force of the tower column is significantly reduced and thus meets seismic performance after using the YSDs. Secondly, the RDs were reduced by 59%~75% and 35%~77% at the transition pier and auxiliary pier, respectively. Meanwhile, the yielding strength of each YSD can be designed, making the RCD large and uniform or the RD small and uniform.
This phenomenon can be explained by the system switch during the vibration, which is caused by the yielding of YSDs when the peak acceleration of the ground motion occurs. By investigating the first two dominant transversal modes of the two systems (Table 5), it can be seen that there are three main characteristics of the system switch: (1) the lateral deformation of the girder becomes uniform, which avoids the extremely large lateral drift in the mid-span and girder’s two ends; (2) the uncoupled girder–tower deformation, which reduces the inertia force transmitted from the deck, and consequently decreases the bending moment of tower below the deck and the tower top drift; and (3) the delay of the period of post-yielding dominant transversal mode (transversal swing) until around 7.41s, resulting away from the predominant periods (3–4 s) of the ground motion, which restrains the girder displacement after yielding. Therefore, this dynamic behavior also shows why a better seismic performance will be achieved when we adopt the designed result based on the designed objective RD.

5. Equal Yielding Strength Analysis

According to the above analysis, designing by using one-variable analysis is relatively simple, but the yielding strengths of the YSDs at each location are often unequal, which means various specifications of YSDs are needed. Meanwhile, the system switch actually demonstrates the effectiveness of the YSDs is according to the delay of the period of the post-yielding dominant transversal mode, which restrains the girder displacement after yielding. Therefore, an equal yielding strength, which means Fya = Fyp = Fyt may be reasonable for engineering practice. Additionally, the calculated cases were greatly reduced from 441 to 5.
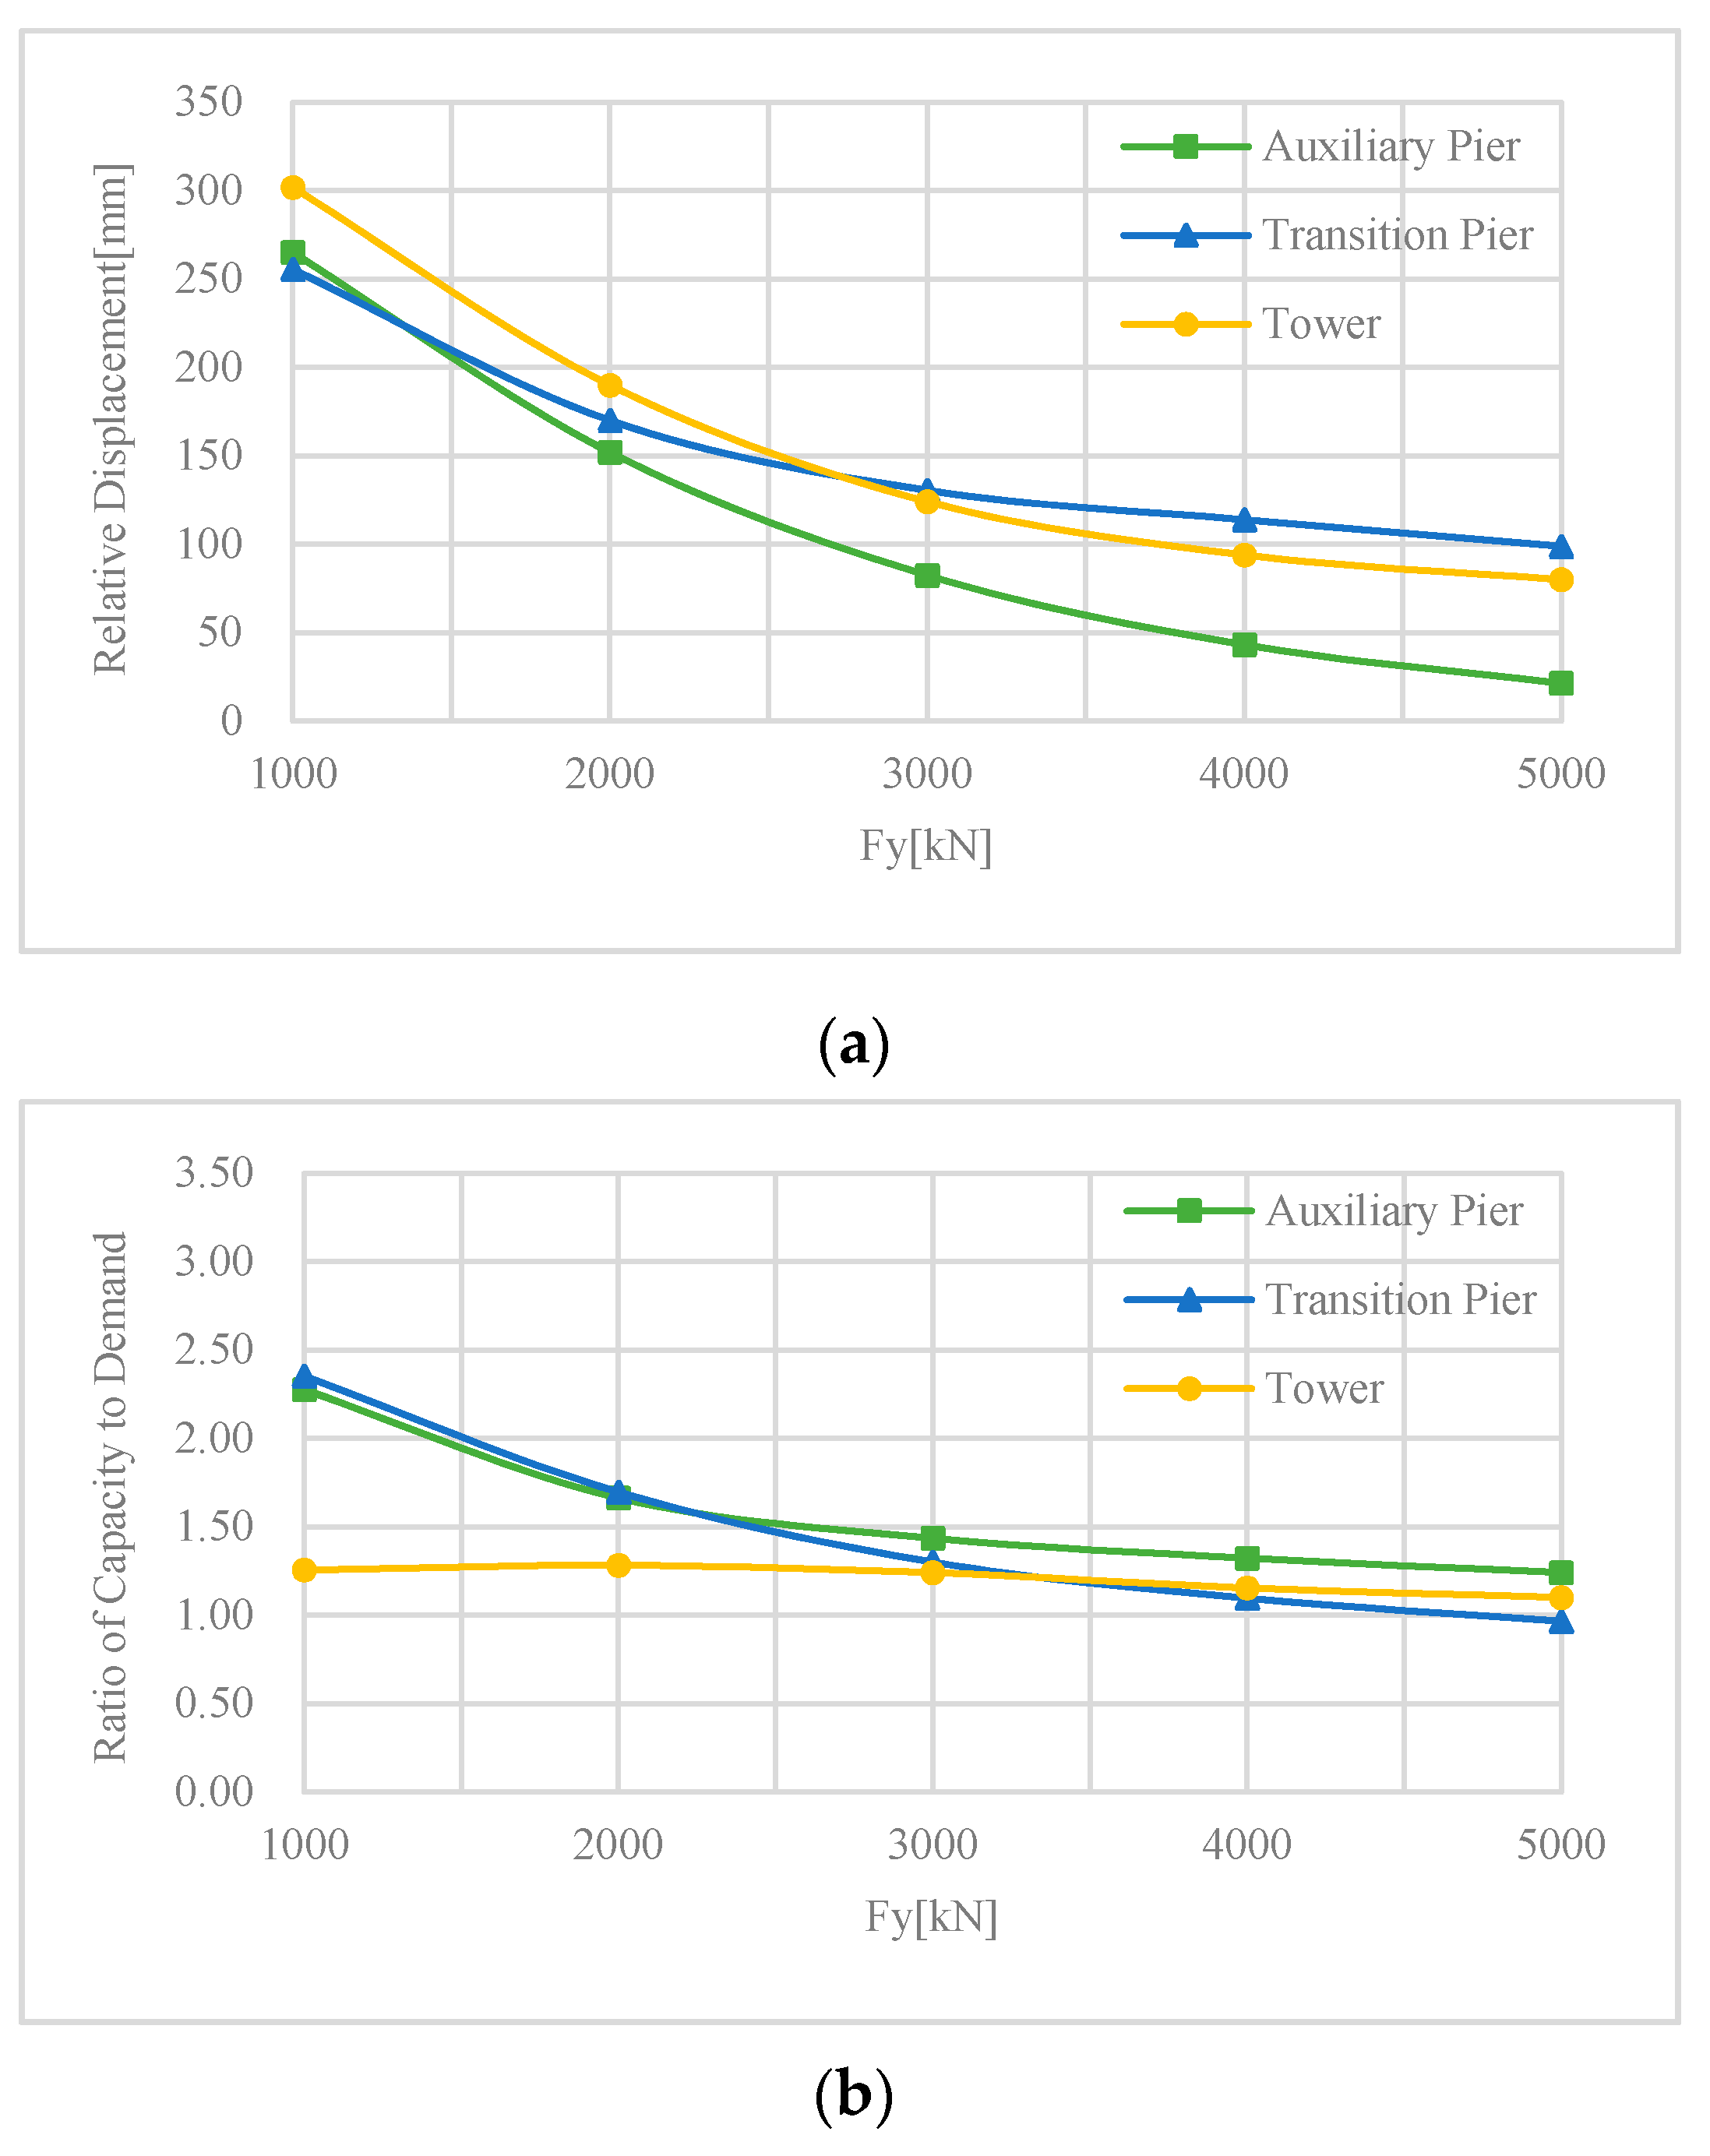
Figure 24 and Table 6 show that the RCD can be large and uniform when the yielding strength is 3000 kN, and the RD can be small and uniform when the yielding strength is 2000 kN.
Compared with Table 3, the equal yielding strength can also achieve a significant effect in terms of reducing the seismic responses of the bridge in terms of RCD or RD. RD values are reduced by 59% and 35% at the transition pier and auxiliary pier for layout 6, respectively, whereas they are reduced by 68% and 44% for layout 4. Meanwhile, the RCD of the tower column increases to around 1.25 from 0.59 for both layouts 5 and 6, which agrees well with the results of the layouts 1 and 3 by comprehensive multi-variable and one-variable analysis in Table 3. Remembering layout 3 in Table 3, Fyt = 2000 kN is also the designed result by single-variable analysis in terms of RCD at the tower–girder location, and so layout 6 is preferable.
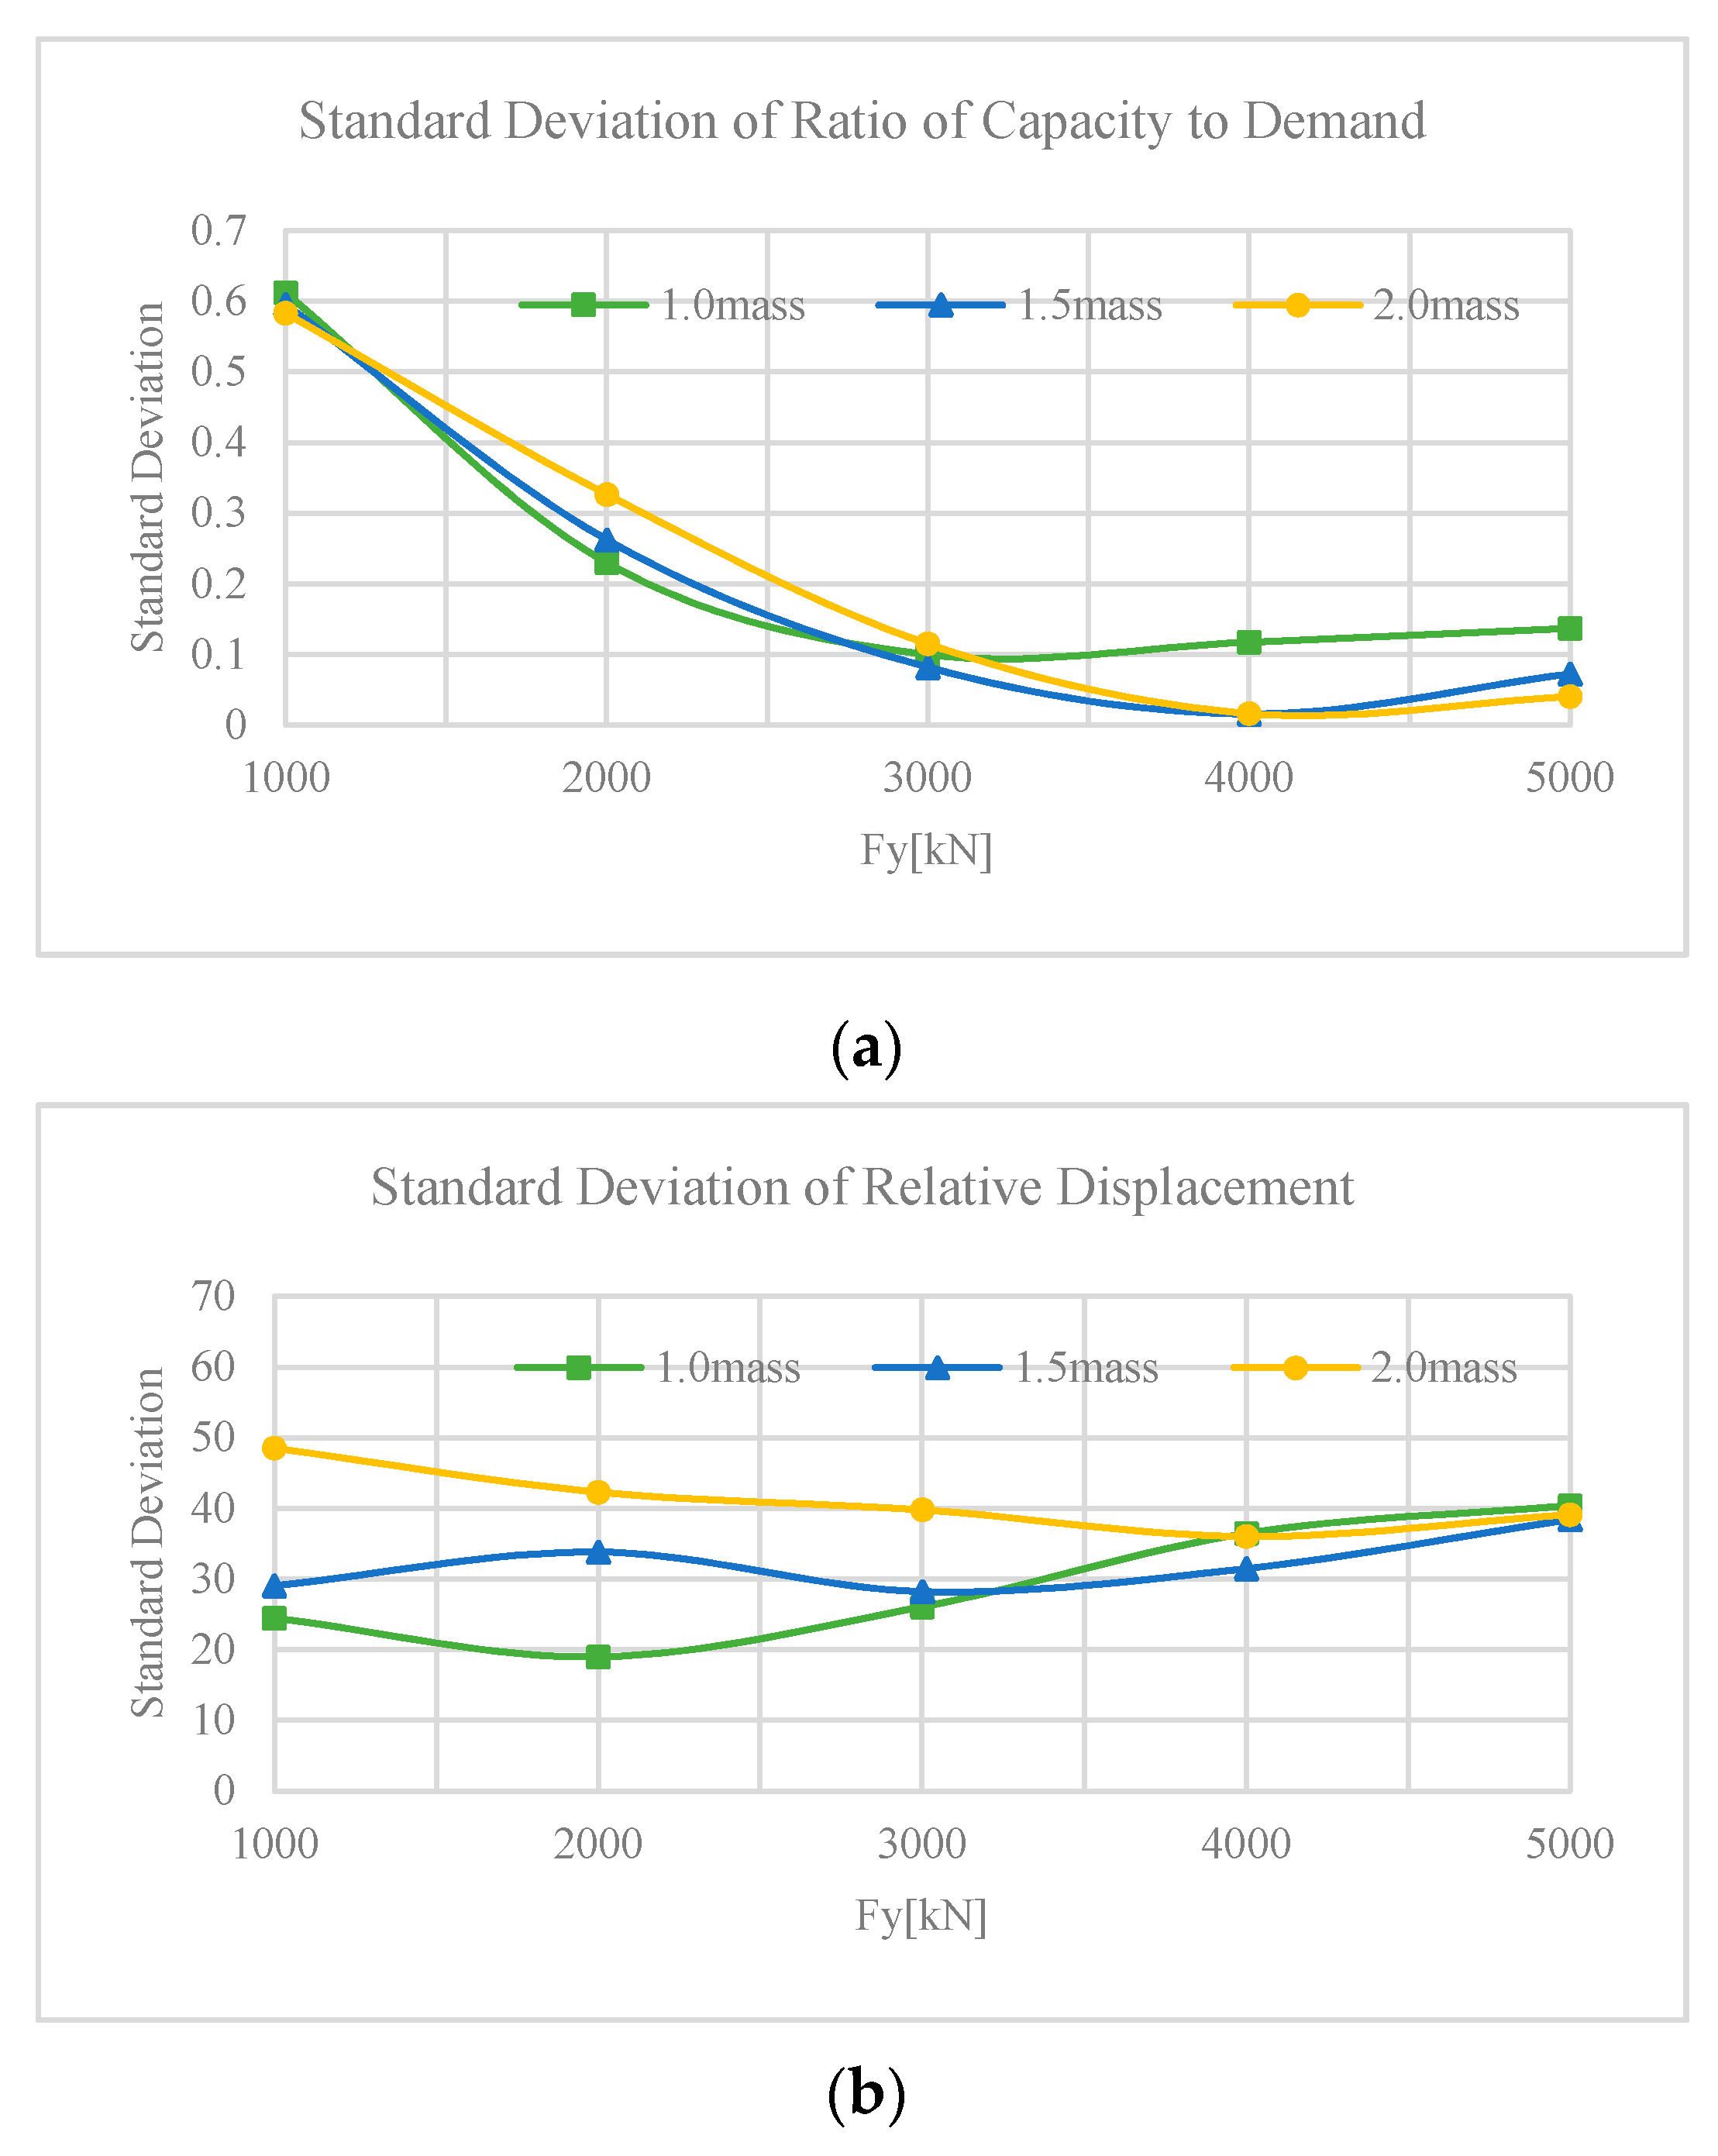
In fact, the yielding strength of YSDs is closely related to the mass of the superstructure, so the approximate yielding strength can be quickly determined according to the mass of the superstructure. The results (Figure 25 and Table 7) show that there is an approximately constant ratio relationship between the total yielding strength of YSDs and the weight of the superstructure, at around 10%.
Therefore, in the preliminary analysis, the yielding strength of YSD can be determined by the weight of the superstructure, and the RCD is large and uniform or the RD is small and uniform. At this time, the calculated cases were greatly reduced from 5 to 1, which greatly improves the efficiency of bridge design.
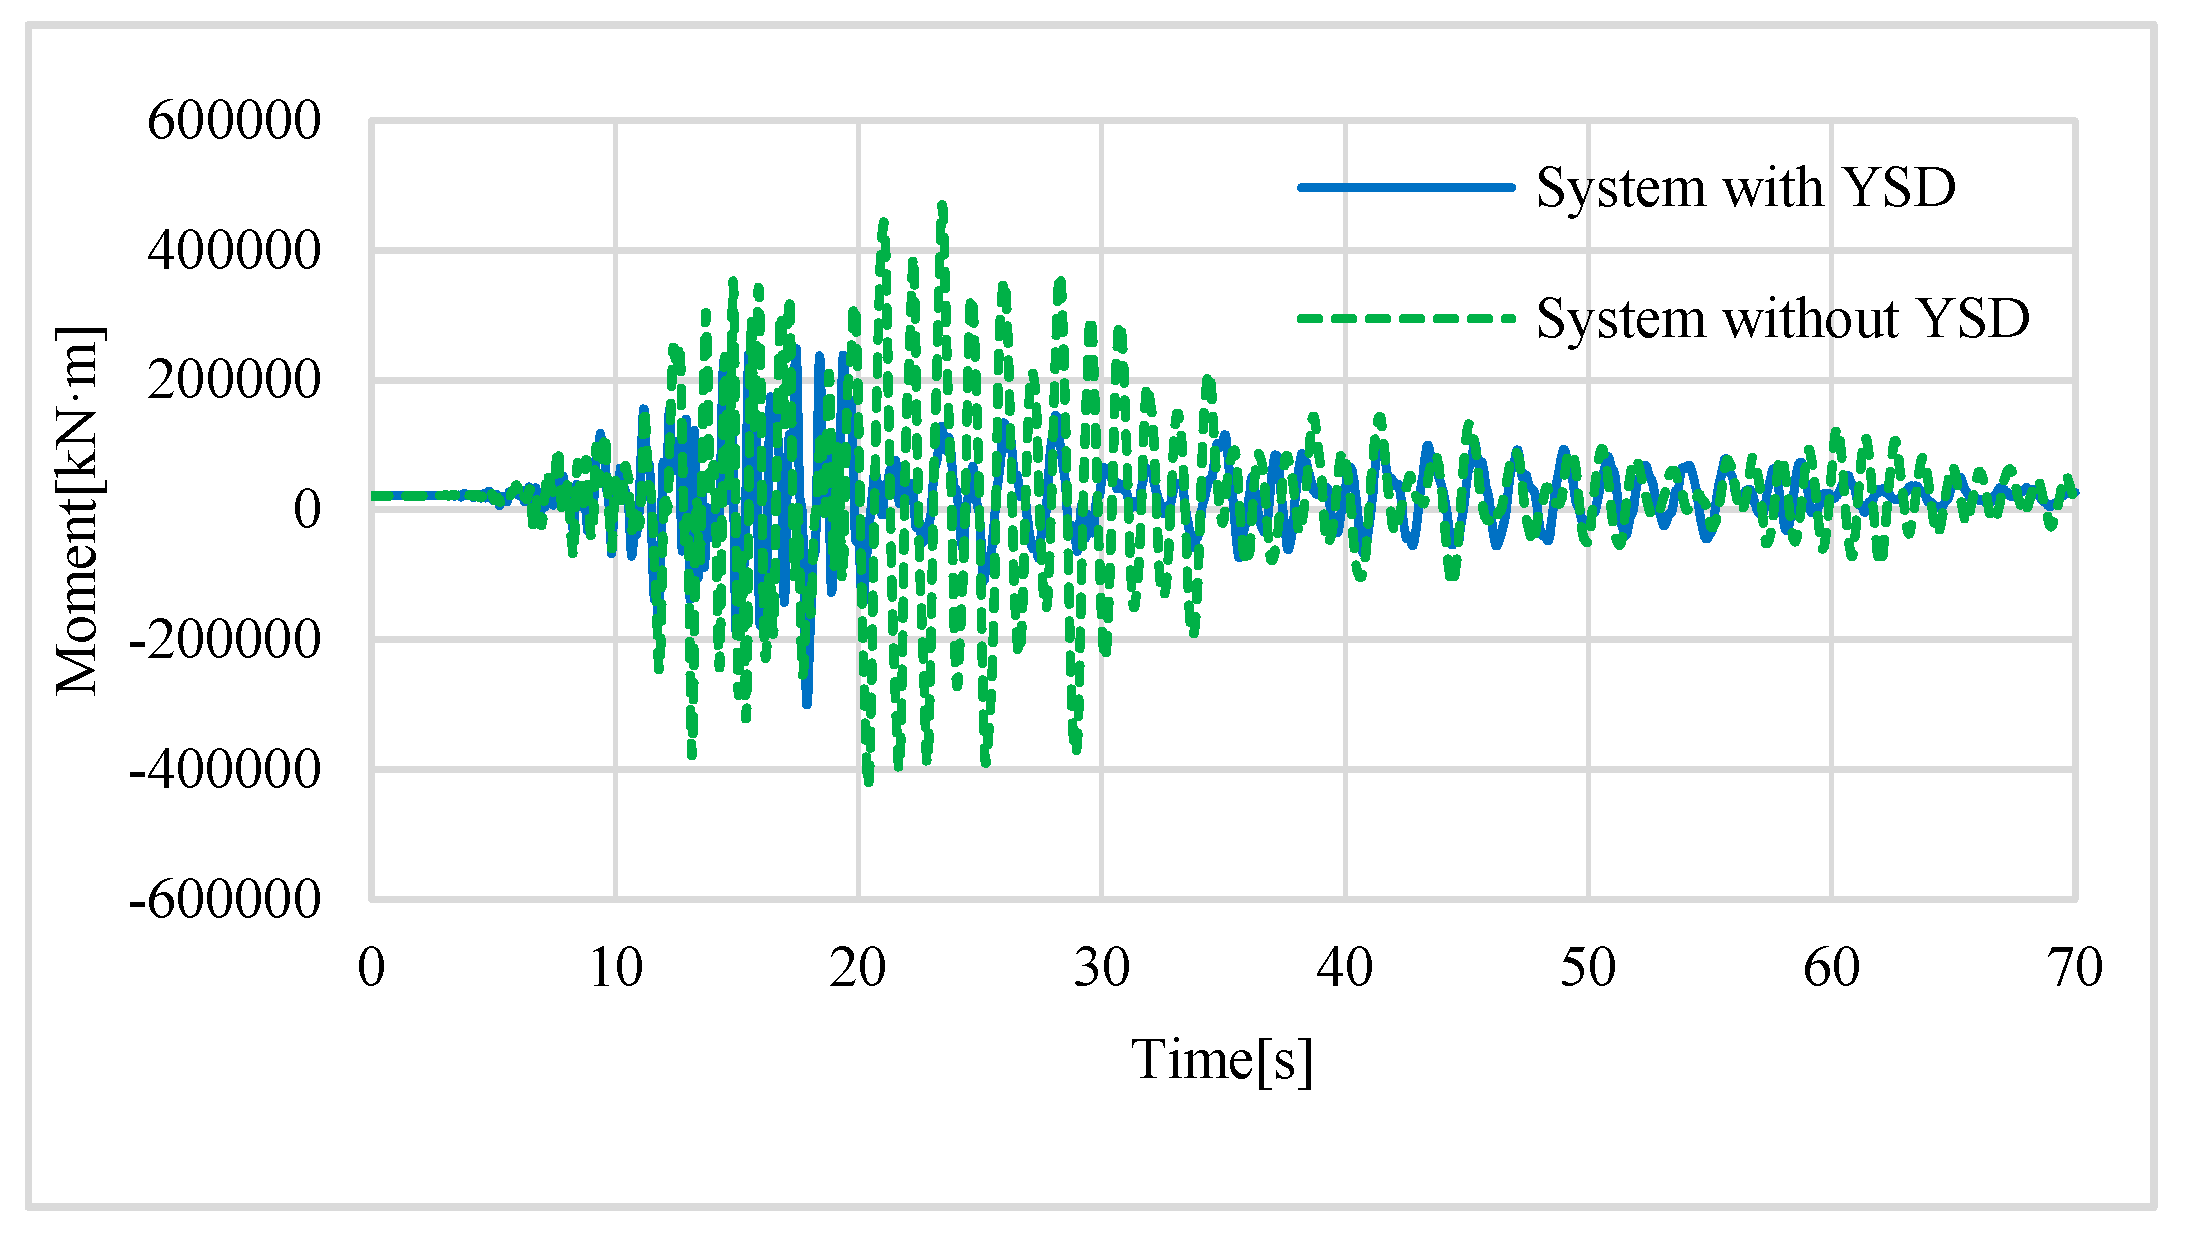
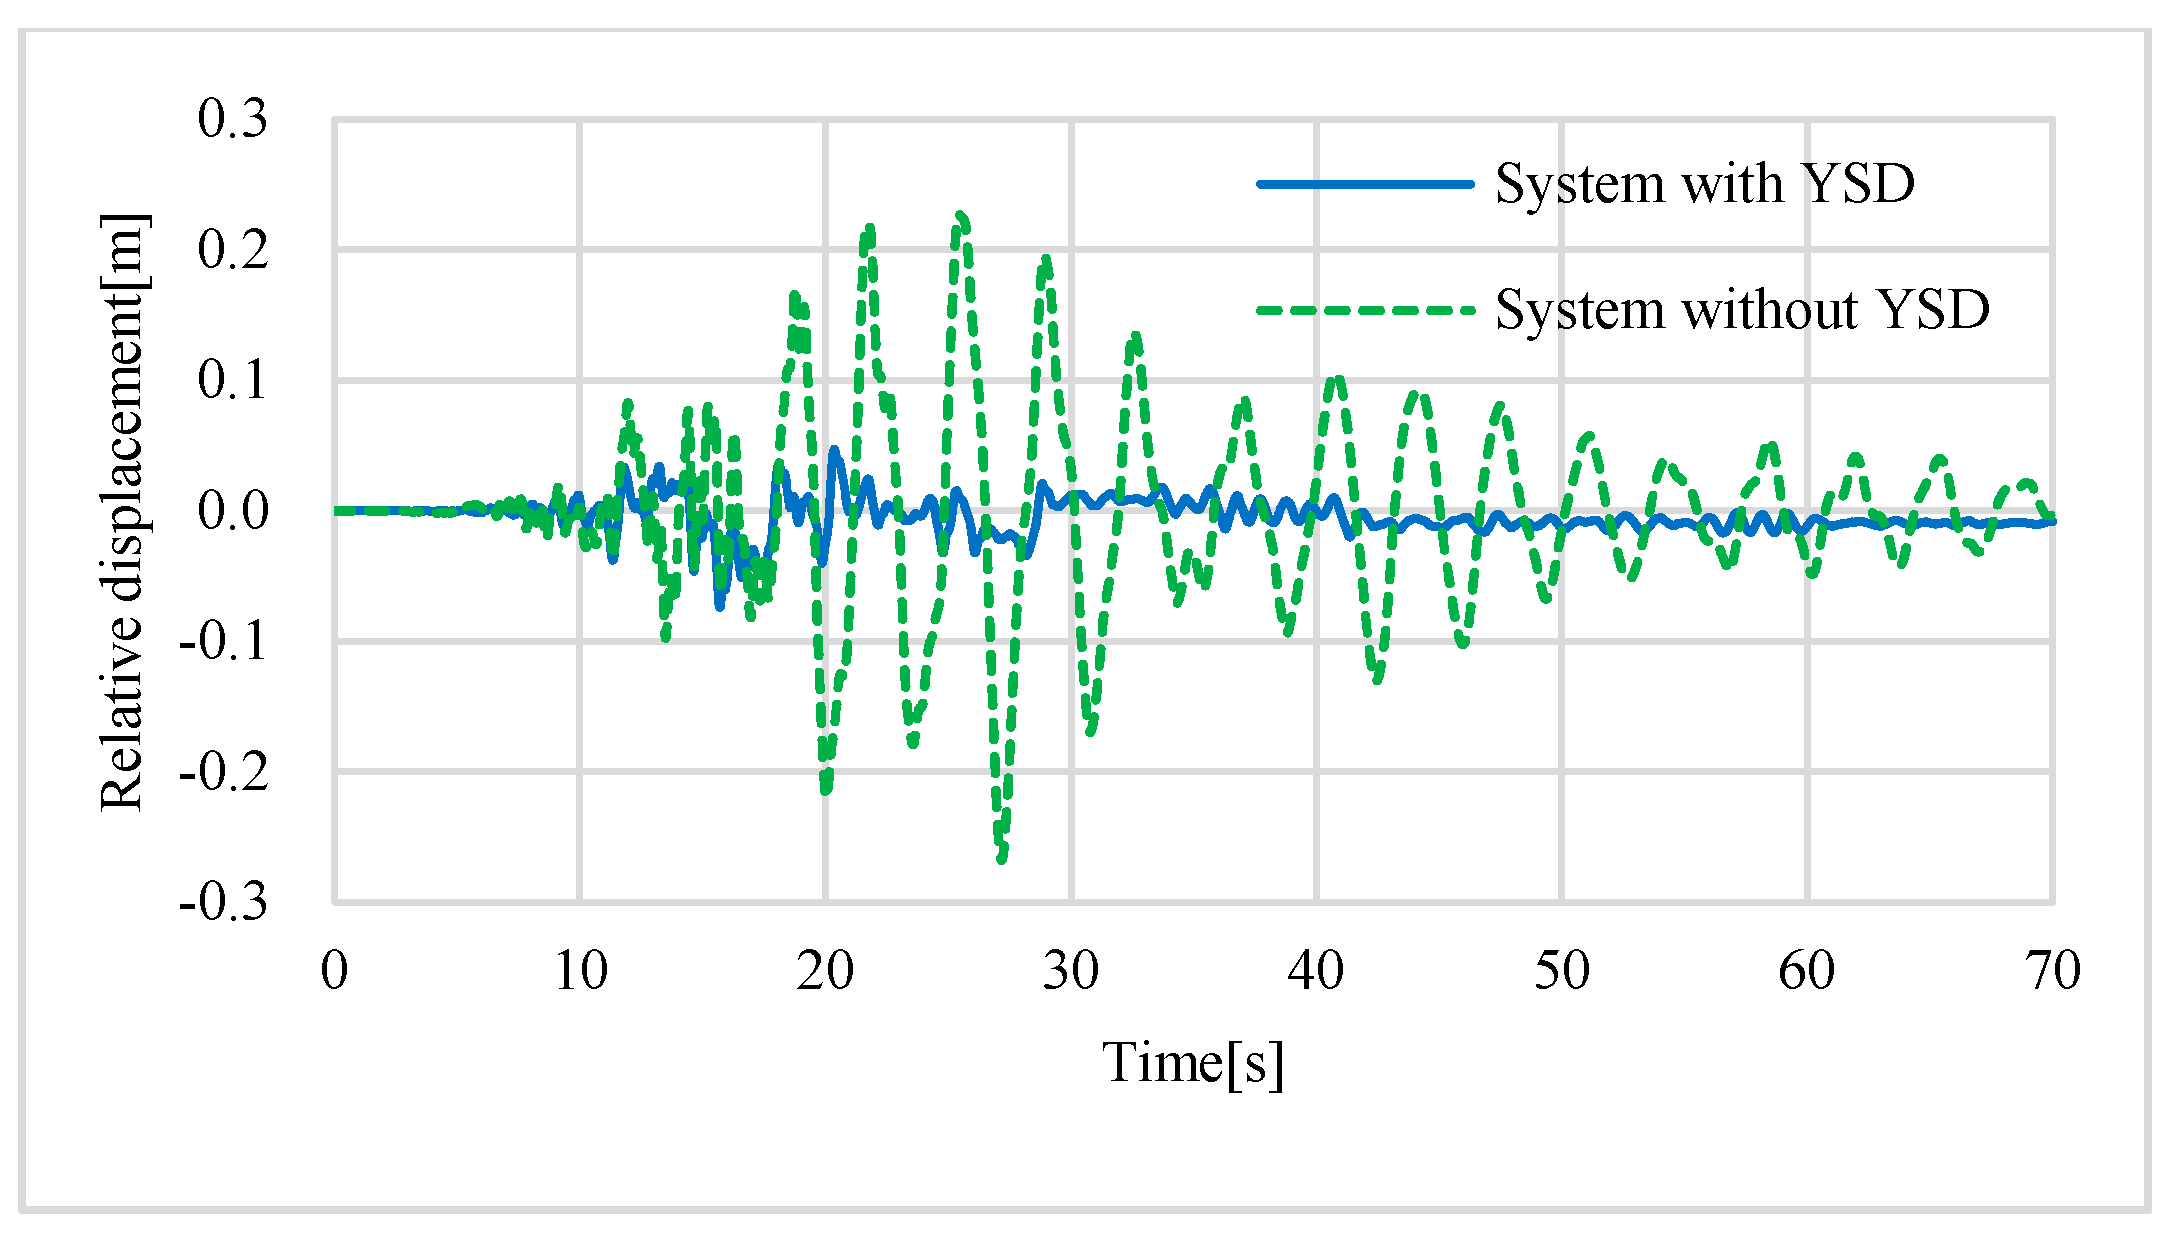
For illustration, the time histories of the bending moment at the bottom of the tower and the RD between the girder and the transition pier (under the artificial-1) are illustrated in Figure 26 and Figure 27. This shows that the application of YSDs with equal yielding strengths of 2000 kN does reduce the moment at the tower bottom and the girder–pier RD effectively, especially during the time steps when the ground motions become intensive.

6. Practical Method of YSD Design

Based on the above analysis, a more practical method to determine the yielding strength of YSD is proposed (Figure 28). Obviously, unequal yielding strength analysis is accurate but complicated, while equal yielding strength analysis can not only achieve the design goal but is also relatively simple, and so the latter is more suitable for engineering practice. In addition, according to the calculation, there is a ratio relationship between the reasonable yielding strength of YSDs and the weight of the main girder, which is around 10% for a medium-span cable-stayed bridge. Therefore, the total yielding strength of YSDs can be obtained quickly, the yielding strength of YSD is equally applied in each location, and then the key indicators are checked, such as RD and RCD. If it is necessary to adjust the yielding strength, the yielding strength analysis range can be determined using the method in Section 3.1, and then the equal yielding strength analysis can be carried out with the method in Section 5 to determine the yielding strength of YSD. The flowchart of this practical design method is shown in Figure 28.

7. Conclusions

Using YSDs can effectively improve a bridge’s seismic performance at key locations overall. The influence of the yielding strength on the seismic responses of a medium-span cable-stayed bridge is investigated through comprehensive parametric analysis, and reasonable layouts of YSDs are achieved according to two different design objectives by unequal yielding strength analysis and equal yielding strength analysis. Then, a more practical method to quickly determine the effective yielding steel damper parameter is proposed for engineering practice. Conclusions can be drawn as follows:
1
The increase of the yielding strength can effectively reduce the RD at each location, but its efficiency decreases with the increase of the yielding strength. For current engineering practice, the seismic design capacity of the auxiliary pier can essentially be decreased for cost efficiency.
2
Equal yielding strength analysis is much simpler than unequal yielding strength analysis; however, it may not be the most appropriate result theoretically, but it is effective enough for engineering practices.
3
The practical design method using equal yielding strength analysis can greatly reduce the analysis cases and hence improve the efficiency of seismic analysis.
It should be noted that the yielding strengths achieved in this study might not work for other cases. However, we provide a practical procedure to quickly achieve the proper yielding strength and layout of steel dampers (not only the shape used in the study but also other shapes) by simply running a few time history analysis cases instead of carrying out comprehensive parametric study, which might cause less theoretically accurate values but is time-efficient in engineering practice.

Author Contributions

Conceptualization, methodology and writing—review and editing, Y.X.; validation, analysis and writing—original draft preparation, Z.Z.; software and investigation, C.C.; investigation and data curation, S.Z.

Funding

This research was funded by National Key Research and Development Plan, China, grant number 2017YFC1500702 and the National Science Foundation of China, grant number 51878492.

Conflicts of Interest

The authors declare no conflict of interest.

References

  1. Guidelines for Seismic Design of Highway Bridges; China Communications Press: Beijing, China, 2008.
  2. Code for Seismic Design of Urban Bridges; China Architecture & Building Press: Beijing, China, 2011.
  3. Eurocode8: Design Provisions for Earthquake Resistance of Structures (Draft for Development); BSI Group: London, UK, 1998.
  4. Duan, X.; Xu, Y. Seismic Design Strategy of Cable Stayed Bridges Subjected to Strong Ground Motio. J. Comput. Theor. Nanosci. 2012, 9, 946–951. [Google Scholar] [CrossRef]
  5. Ali, H.E.M.; Abdel-Ghaffar, A.M. Seismic energy dissipation for cable-stayed bridges using passive devices. Earthq. Eng. Struct. Dyn. 1994, 23, 877–893. [Google Scholar] [CrossRef]
  6. Ali, H.M.; Abdel-Ghaffar, A.M. Modeling the nonlinear seismic behavior of cable-stayed bridges with passive control bearings. Comput. Struct. 1995, 54, 461–492. [Google Scholar] [CrossRef]
  7. Domaneschi, M.; Martinelli, L. Extending the benchmark cable-stayed bridge for transverse response under seismic loading. J. Bridge Eng. 2014, 19, 04013003. [Google Scholar] [CrossRef]
  8. Caicedo, J.M.; Dyke, S.J.; Moon, S.J.; Bergman, L.A.; Turan, G.; Hague, S. Phase ii benchmark control problem for seismic response of cable-stayed bridges. J. Struct. Control 2003, 10, 137–168. [Google Scholar] [CrossRef]
  9. Dyke, S.J.; Caicedo, J.M.; Turan, G.; Bergman, L.A.; Hague, S. Phase i benchmark control problem for seismic response of cable-stayed bridges. J. Struct. Eng. 2003, 129, 857–872. [Google Scholar] [CrossRef]
  10. Agrawal, A.K.; Yang, J.N.; He, W.L. Applications of some semiactive control systems to benchmark cable-stayed bridge. J. Struct. Eng. 2003, 129, 884–894. [Google Scholar] [CrossRef]
  11. Domaneschi, M.; Martinelli, L. Performance comparison of passive control schemes for the numerically improved asce cable-stayed bridge model. Earthq. Struct. 2012, 3, 181–201. [Google Scholar] [CrossRef]
  12. Soneji, B.B.; Jangid, R.S. Passive hybrid systems for earthquake protection of cable-stayed bridge. Eng. Struct. 2007, 29, 57–70. [Google Scholar] [CrossRef]
  13. Soneji, B.; Jangid, R. Response of an isolated cable-stayed bridge under bi-directional seismic actions. Struct. Infrastruct. Eng. 2010, 6, 347–363. [Google Scholar] [CrossRef]
  14. Casciati, F.; Cimellaro, G.P.; Domaneschi, M. Seismic reliability of a cable-stayed bridge retrofitted with hysteretic devices. Comput. Struct. 2008, 86, 1769–1781. [Google Scholar] [CrossRef]
  15. Saha, P.; Jangid, R. Seismic control of benchmark cable-stayed bridge using passive hybrid systems. IES J. Part A Civ. Struct. Eng. 2009, 2, 1–16. [Google Scholar] [CrossRef]
  16. Jung, H.-J.; Spencer Billie, F.; Lee, I.-W. Control of seismically excited cable-stayed bridge employing magnetorheological fluid dampers. J. Struct. Eng. 2003, 129, 873–883. [Google Scholar] [CrossRef]
  17. Iemura, H.; Pradono, M.H. Application of pseudo-negative stiffness control to the benchmark cable-stayed bridge. J. Struct. Control 2003, 10, 187–203. [Google Scholar] [CrossRef] [Green Version]
  18. Moon, S.-J.; A Bergman, L.; Asce, M.G.; Voulgaris, P. Sliding mode control of cable-stayed bridge subjected to seismic excitation. J. Eng. Mech. 2003, 129. [Google Scholar] [CrossRef]
  19. Zhou, L.; Wang, X.; Ye, A. Shake table test on transverse steel damper seismic system for long span cable-stayed bridges. Eng. Struct. 2019, 179, 106–119. [Google Scholar] [CrossRef]
  20. Shen, X.; Camara, A.; Ye, A. Effects of seismic devices on transverse responses of piers in the sutong bridge. Earthq. Eng. Eng. Vib. 2015, 14, 611–623. [Google Scholar] [CrossRef]
  21. Shen, X.; Wang, X.; Ye, Q.; Ye, A. Seismic performance of transverse steel damper seismic system for long span bridges. Eng. Struct. 2017, 141, 14–28. [Google Scholar] [CrossRef]
  22. Deng, K.; Pan, P.; Wang, C. Development of crawler steel damper for bridges. J. Constr. Steel Res. 2013, 85, 140–150. [Google Scholar] [CrossRef]
  23. Ismail, M.; Rodellar, J.; Ikhouane, F. An innovative isolation device for aseismic design. Eng. Struct. 2010, 32, 1168–1183. [Google Scholar] [CrossRef] [Green Version]
  24. Maleki, S.; Bagheri, S. Pipe damper, part i: Experimental and analytical study. J. Constr. Steel Res. 2010, 66, 1088–1095. [Google Scholar] [CrossRef]
  25. Maleki, S.; Bagheri, S. Pipe damper, part ii: Application to bridges. J. Constr. Steel Res. 2010, 66, 1096–1106. [Google Scholar] [CrossRef]
  26. Guan, Z.; Li, J.; Xu, Y. Performance test of energy dissipation bearing and its application in seismic control of a long-span bridge. J. Bridge Eng. 2010, 15, 622–630. [Google Scholar] [CrossRef]
  27. Parducci, A.M. Seismic isolation of bridges in italy. Bull. N. Z. Natl. Soc. Earthq. Eng. 1992, 25, 193–202. [Google Scholar]
  28. Xu, Y.; Wang, R.; Li, J. Experimental verification of a cable-stayed bridge model using passive energy dissipation devices. J. Bridge Eng. 2016, 21, 04016092. [Google Scholar] [CrossRef]
  29. Agostino, M. Development of a new type of hysteretic damper for the seismic protection of bridges. Spec. Publ. 1996, 164, 955–976. [Google Scholar]
  30. Zhu, B.; Wang, T.; Zhang, L. Quasi-static test of assembled steel shear panel dampers with optimized shapes. Eng. Struct. 2018, 172, 346–357. [Google Scholar] [CrossRef]
  31. Xiao-xian, L.I.U.; Jian-zhong, L.I.; Xu, C. Effects of x-shaped elastic-plastic steel shear keys on transverse seismic responses of a simply-supported girder bridge. J. Vib. Shock 2015, 34, 143–149. [Google Scholar]
  32. Pan, P.; Yan, H.; Wang, T.; Xu, P.; Xie, Q. Development of steel dampers for bridges to allow large displacement through a vertical free mechanism. Earthq. Eng. Eng. Vib. 2014, 13, 375–388. [Google Scholar] [CrossRef]
  33. Vasseghi, A. Energy dissipating shear key for precast concrete girder bridges. Sci. Iran. 2011, 18, 296–303. [Google Scholar] [CrossRef] [Green Version]
  34. Wang, H.; Zhou, R.; Zong, Z.; Wang, C.; Li, A. Study on seismic response control of a single-tower self-anchored suspension bridge with elastic-plastic steel damper. Sci. China Technol. Sci. 2012, 55, 1496–1502. [Google Scholar] [CrossRef]
  35. Ismail, M.; Casas Joan, R. Novel isolation device for protection of cable-stayed bridges against near-fault earthquakes. J. Bridge Eng. 2014, 19, A4013002. [Google Scholar] [CrossRef]
  36. SAP2000; University of California: Berkeley, CA, USA, 1996.
  37. CSI Aanalysis Reference Manual; Computers & Structures, Inc.: Berkeley, CA, USA, 2016.
  38. Bathe, K.-J.; Wilson, E.L. Numerical Methods in Finite Element Analysis; Prentice Hall: Englewood Cliffs, NJ, USA, 1976. [Google Scholar]
  39. Ernst, H.J. Der e-modul von seilen unter beruecksichtigung des durchhanges. Der Bauing. 1965, 40, 52–55. [Google Scholar]
  40. Battaini, M.M. Base isolation of allied join force command headquarters naples. In Proceedings of the 10th World Conference on Seismic Isolation, Energy Dissipation and Active Vibrations Control of Structures, Istanbul, Turkey, 27–30 May 2007. [Google Scholar]
  41. Priestley, M.J.N.; Seible, F.; Calvi, G.M. Seismic Design and Retrofit of Bridge; John Wiley & Sons, Inc.: Hoboken, NJ, USA, 1996. [Google Scholar]
  42. Oh, S.-H.; Song, S.-H.; Lee, S.-H.; Kim, H.-J. Seismic response of base isolating systems with u-shaped hysteretic dampers. Int. J. Steel Struct. 2012, 12, 285–298. [Google Scholar] [CrossRef]
  43. Martins, A.M.B.; Simões, L.M.C.; Negrão, J.H.J.O. Optimization of cable forces on concrete cable-stayed bridges including geometrical nonlinearities. Comput. Struct. 2015, 155, 18–27. [Google Scholar] [CrossRef]
  44. Anil, K.C. Dynamics of Structures: Theory and Applications to Earthquake Engineering; Pearson Education, Inc.: London, UK, 2012. [Google Scholar]
Figure 1. Elevation of the cable-stayed bridge (unit: m).
Applsci 09 02857 g001
Figure 2. Dimensions of the major structure and their sections (unit: cm).
Applsci 09 02857 g002
Figure 3. Finite element (FE) model.
Applsci 09 02857 g003
Figure 4. C-shaped steel damper group.
Applsci 09 02857 g004
Figure 5. One applied YSD and its connection.
Applsci 09 02857 g005
Figure 6. Simplified model of the YSD.
Applsci 09 02857 g006
Figure 7. The seismic time history.
Applsci 09 02857 g007
Figure 8. The displacement of the middle span.
Applsci 09 02857 g008
Figure 9. The displacement of the top tower.
Applsci 09 02857 g009
Figure 10. The displacement of the middle tower.
Applsci 09 02857 g010
Figure 11. Acceleration response spectra of the artificial ground motions.
Applsci 09 02857 g011
Figure 12. Mechanical diagram.
Applsci 09 02857 g012
Figure 13. Responses of the auxiliary pier with varying Fya and Fyt. (a) Relative displacement, (b) ratio of capacity to demand (RCD).
Applsci 09 02857 g013
Figure 14. Responses of the transition pier with varying Fyp and Fyt. (a) Relative displacement, (b) ratio of capacity to demand.
Applsci 09 02857 g014aApplsci 09 02857 g014b
Figure 15. Responses of the tower column with varying Fya and Fyp. (a) Relative displacement; (b) ratio of capacity to demand.
Applsci 09 02857 g015
Figure 16. Standard deviation of RCD.
Applsci 09 02857 g016
Figure 17. Contour of standard deviation of RCD (Fya = 4000 kN).
Applsci 09 02857 g017
Figure 18. Standard deviation of relative displacement (RD).
Applsci 09 02857 g018
Figure 19. Contour of standard deviation of RD (Fya = 1000 kN).
Applsci 09 02857 g019
Figure 20. Seismic responses with varying Fya. (a) Relative displacement (unit: mm); (b) ratio of capacity to demand.
Applsci 09 02857 g020
Figure 21. Seismic responses with varying Fyp. (a) Relative displacement; (b) ratio of capacity to demand.
Applsci 09 02857 g021
Figure 22. Seismic responses with varying Fyt. (a) Relative displacement; (b) Ratio of capacity to demand.
Applsci 09 02857 g022
Figure 23. Standard deviation of RD (changing Fya or Fyp or Fyt).
Applsci 09 02857 g023
Figure 24. Seismic responses with varying Fy. (a) Relative displacement; (b) ratio of capacity to demand.
Applsci 09 02857 g024
Figure 25. Standard deviation with varying Fy. (a) Standard deviation of RCD; (b) standard deviation of RD. Note: 1.0 mass means the original weight of the main girder, 1.5 mass means 1.5 times the original weight, 2.0 mass means 2.0 times the original weight.
Applsci 09 02857 g025
Figure 26. Time history of the tower bottom moment.
Applsci 09 02857 g026
Figure 27. Time history of the relative displacement between the transition pier and girder.
Applsci 09 02857 g027
Figure 28. Practical design method.
Applsci 09 02857 g028
Table 1. Main materials of the bridge.
Material and ComponentStandard Strength (MPa)Young’s Modulus (MPa)
Concrete (tower)32.43.45 × 104
Concrete (transition pier)26.83.25 × 104
Concrete (auxiliary pier)26.83.25 × 104
Cable17702.05 × 105
Rebar4002.06 × 105
Note: 1. The standard strength of concrete is the axial compressive strength of concrete measured with a 150 mm × 150 mm × 300 mm prism as the standard specimen, and the standard strength means the strength characteristic value with a certain guarantee rate (95%). 2. Statistical analysis shows that the test value of the rebar and cable strength conforms to normal distribution, and the standard strength of is the strength characteristic value with a certain guarantee rate (97.73%).
Table 2. The boundary condition of the bridge.
LocationDegree of Freedom
(without YSDs)
Degree of Freedom
(with YSDs)
UXUYUZRXRYRZUXUYUZRXRYRZ
Tower0110000YSD (2)1000
Auxiliary pier0010000YSD (2)1000
Transition pier0010000YSD (2)1000
Note: 1. “1” means fixed, “0” means free; yielding steel dampers (YSDs) are installed between the girder and the substructure, and numbers in () are the quantities of YSDs used on each side of the bridge. 2. X means the longitudinal direction, Y means the transverse direction, and Z means the vertical direction.
Table 3. Key response comparison.
Bridge SystemYSD Layout PlanRCD at TowerRCD at TPRCD at APRD at Tower RD at TPRD at APTower TDMid-Span Lateral Drift
AWithout YSDs0.592.041.990417235173515
BDesigned layout 1 (M)1.211.191.1918910869174312
Designed layout 2 (M)1.171.021.99118125125168227
Designed layout 3 (S)1.251.151.2412610653169235
Designed layout 4 (S)1.181.142.02125135131164209
Note: 1. TP means the transition pier, AP means the auxiliary pier, TD means top drift, M means multi-variable analysis, and S means single variable analysis. Designed layout 1: Fya = 4000 kN, Fyp = 4000 kN and Fyt = 1000 kN (designed for a large and uniform RCD), designed layout 2: Fya = 1000 kN, Fyp = 5000 kN and Fyt = 4000 kN (designed for a small and uniform RD), designed layout 3: Fya = 4000 kN, Fyp = 4000 kN and Fyt = 2000 kN (designed for a large and uniform RCD), designed layout 4: Fya = 1000 kN, Fyp = 4000 kN and Fyt = 4000 kN (designed for a small and uniform RD). 2. The unit of displacement is mm, and RCD is a dimensionless constant.
Table 4. Proportion of the above natural vibration responses.
FytM1M of TowerMsv of Towerα of TowerFyp/FyaM2M of TPM of APMsv of TPMsv of APα of TPα of AP
90003600005085421485420.29500020000027271925639672719563960.270.22
Note: 1. M1 means the moment of the tower due to the YSD, M2 means the moment of the pier due to the YSD, Msv means the moment due to self-vibration, α means the proportion of the self-vibration response to the total, TP means the transition pier, and AP means the auxiliary pier. 2. The unit of bending moment is kN·m, and α is a dimensionless constant.
Table 5. Dominant transversal modes of the cable-stayed bridge.
Conventional SystemYSD System (After Yielding)
Top ViewSide Viewlayout 3layout 4
Top ViewSide ViewMPMRPeriodMPMRPeriodMPMRPeriod
Applsci 09 02857 i001 Applsci 09 02857 i00210.8%3.42 s Applsci 09 02857 i003 Applsci 09 02857 i00448.0%7.30 s48.4%7.52 s
Applsci 09 02857 i005 Applsci 09 02857 i00653.5%1.18 s Applsci 09 02857 i007 Applsci 09 02857 i00819.0%0.95 s19.0%0.95 s
Note: MPMR means the modal participating mass ratio in the transversal direction.
Table 6. Key response comparison (Units: mm).
Bridge SystemYSD Layout PlanRCD of TowerRCD of TPRCD of APRD of TowerRD of TPRD of APTower TDMid-Span Lateral Drift
AWithout YSDs0.592.041.990417235173515
BDesigned layout 51.241.301.4412413080164198
Designed layout 61.281.701.66189170152165245
Note: TP means the transition pier, AP means the auxiliary pier, and TD means top drift. Designed layout 5: Fya = 3000 kN, Fyp = 3000 kN and Fyt = 3000 kN (designed for a large and uniform RCD), designed layout 6: Fya = 2000 kN, Fyp = 2000 kN and Fyt = 2000 kN (designed for a small and uniform RD).
Table 7. The ratio between the yield strength of YSDs and the weight of the superstructure (unit: kN).
For a Large and Uniform RCDFor a Small and Uniform RD
Yield StrengthWeightRatioYield StrengthWeightRatio
1.0 mass12 × 3000280,00013%12 × 2000280,0009%
1.5 mass12 × 4000420,00011%12 × 3000420,0009%
2.0 mass12 × 4000560,0009%12 × 4000560,0009%