Abstract
Raman spectroscopy has been applied to study unsaturated fatty acid in edible vegetable oils. The relative intensity ratio of characteristic vibrational bands has been investigated as a function of the content of totally unsaturated fatty acid, polyunsaturated fatty acid, and monounsaturated fatty acid. The results suggest the intensity ratio of 1655 cm−1 to 1440 cm−1 or 1265 cm−1 to 1300 cm−1, i.e., a characteristic vibrational band correlated with carbon-carbon double bond in acid chain to a vibrational band not correlated with double bond, could be applied for preliminary analysis of the content of polyunsaturated fatty acid or monounsaturated fatty acid, but cannot be used to analyze the content of total unsaturated fatty acid. Additionally, two-dimensional correlation spectroscopy (2DCOS) has been performed on the content dependent Raman spectra. The 2DCOS result is consistent with that by Raman spectroscopy.
1. Introduction
The main components of edible vegetable oils are triglycerides, which can be characterized in terms of fatty acids making part of their structure [1]. Fatty acids can be divided into saturated fatty acids and unsaturated fatty acids. An unsaturated fatty acid (UFA) has at least one carbon-carbon double bond within the acid chain; it is monounsaturated if it contains only one double bond, and polyunsaturated if it contains more than one double bond. Both monounsaturated fatty acids (MUFA) and polyunsaturated fatty acids (PUFA) are very important for health [2,3,4]. Studies have shown that MUFA are helpful to improve insulin sensitivity, and can lead to reduced anger and irritability; additionally in children, consumption of MUFA is associated with healthier serum lipid profiles [5,6,7]. PUFA may be helpful to reduce the risk of cardiovascular disease and breast cancer [8,9]. PUFA protects against cardiovascular disease by providing more membrane fluidity than MUFA, but it are more vulnerable to lipid peroxidation. In various common edible vegetable oils, the total content of UFA could be very similar, while the contents of PUFA or MUFA are very different. Therefore, it would be interesting to differentiate PUFA or MUFA from the total UFA for quality evaluation of edible vegetable oils.
Raman spectroscopy and infrared spectroscopy have been extensively applied to investigate various types of oils [10,11,12,13,14,15,16,17,18,19,20,21,22]. In spectroscopy analyses, studying the relative intensity ratios of characteristic bands is more powerful than investigating the intensity of a particular band, as it can provide more reliable and more detailed intrinsic information of the investigated samples [23,24,25,26]. In this paper, we investigate the relative intensity ratios of characteristic vibrational bands of vegetable oils as a function of the content of totally unsaturated fatty acids, polyunsaturated fatty acids, and monounsaturated fatty acids through Raman spectroscopy. The results suggest that characteristic relative intensity ratios could be applied for preliminary differentiation of PUFA or MUFA from the total UFA in common edible vegetable oils.
Generalized two-dimensional correlation spectroscopy (2DCOS) has become one of the most sensitive analysis techniques that interprets spectral data sets obtained under external perturbation such as temperature, time, pressure, potential, etc. [27,28,29,30,31,32]. 2DCOS has been applied to study the fine spectral features for liquid oleic acid (the most common MUFA) and linoleic acid (a common PUFA with two carbon-carbon double bonds) based on the time dependent attenuated total reflectance infrared spectra, which suggested that the carbon-carbon double bond in the alkyl chain plays an important role in the self-assembling of the carboxyl acids [33]. In this paper, 2DCOS has been performed on the content dependent Raman spectra of common edible vegetable oils, which indicated that the analyses of vibrational bands correlated with the carbon-carbon double bond is helpful for quality evaluation of edible vegetable oils. The 2DCOS result is consistent with that by Raman analyses of relative intensity ratios.
2. Experiment
Seven edible vegetable oil samples (A–G) and three types of unsaturated fatty acids (oleic acid, linoleic acid, and α-linolenic acid) were investigated. Sample A is Golden Dragon Fish sunflower seed oil. Samples B and C are corn oils of the Fortune and Golden Dragon Fish brands, respectively. Sample D is Luhua peanut oil. Samples E, F, and G are extra virgin olive oils of the Huilerie Loued, Olivoila, and Luhua brands, respectively. These samples were purchased from standard supermarkets in Wuhan. The oleic acid (OA), linoleic acid (LA) and α-linolenic acid (ALA) samples were purchased from MOLBASE. All the samples were used as received without further treatment. Table 1 lists the MUFA, PUFA, and saturated fatty acid content in the samples A–G, which were declared by the producers of these samples. The stated purities of the OA, LA, and ALA are 98.5%, 97%, and 97%, respectively.

Table 1.
The monounsaturated fatty acids (MUFA), polyunsaturated fatty acids (PUFA), and saturated fatty acid content in the samples A–G.
Raman spectra of the samples were obtained in backscattering configuration with a Nanobase XperRam200 microprobe spectrometer. The excitation source was a 532 nm green laser. The samples were placed in glass flasks. The laser spot on the sample was about two micrometers. The laser power on sample was varied up to 5 mW to check the laser power’s influence on the Raman spectral features of the samples, which indicated that laser heating or damage of the samples was negligible in our experiment. The scattered signal was detected by an air-cooled CCD detector. The spectral resolution is about 1.5 cm−1 with 1800 lines/mm grating. All the spectra were recorded at room temperature of about 25 °C, with 15 s acquisition time and 2 scan average. For wavenumber calibration, a Si substrate was measured first, then the system was calibrated using the 521 cm−1 phonon mode of Si as reference. The Si spectrum was also measured after experiments to ensure the calibration was not changed during the measurements. For each sample, 5 random spectra were measured and the average spectrum was used for the analyses of relative intensity ratios.
The synchronous and asynchronous 2D spectra were calculated using the software 2D Shige. The baseline of raw Raman spectrum was corrected using Origin Pro 8.0 program. The baseline correction was performed with subtraction of a polynomial curve of the raw Raman spectrum, the main feature of the raw Raman spectrum is kept with this treatment, especially in the spectral range of 1200–1800 cm−1. The baseline corrected data was put into the 2D Shige software with increasing MUFA content (or decreasing PUFA content). The calculated result was replotted in Origin for better visualization.
3. Results and Discussion
Figure 1 presents the Raman scattering spectra of the seven vegetable oil samples A–G. For each sample, the spectrum was obtained from the average of five random spots. All these samples show characteristic vibrational bands at 1080 cm−1, 1265 cm−1, 1300 cm−1, 1440 cm−1, 1655 cm−1, and 1750 cm−1. The band at 1080 cm−1 can be assigned to (C–C) stretching of the (CH2)n group; the band at 1265 cm−1 can be assigned to (=C–H) deformation of cis(R–HC=CH–R); the band at 1300 cm−1 can be assigned to (C–H) bending twist of the CH2 group; the band at 1440 cm−1 can be assigned to (C–H) scissoring of CH2; the band at 1655 cm−1 can be assigned to (C=C) of cis(RHC=CHR); and the band at 1750 cm−1 can be assigned to (C=O) stretching of RC=OOR [10,11,12,13,14,15,16,17,18,19,20,21,22]. These peaks are the common characteristic vibrational bands of almost all edible vegetable oils.
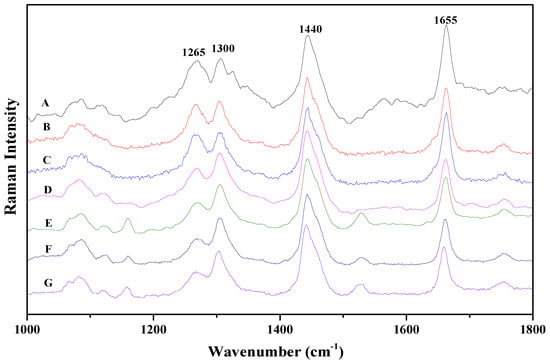
Figure 1.
Raman spectra of the seven vegetable oil samples: (A) Golden Dragon Fish sunflower seed oil; (B) Fortune corn oil; (C) Golden Dragon Fish corn oil; (D) Luhua peanut oil; (E) Huilerie Loued olive oil; (F) Olivoila olive oil; (G) Luhua olive oil. Each spectrum is y-shifted for clarity.
Among the common vibrational bands of vegetable oils observed in Figure 1, the bands at 1265 cm−1 and 1655 cm−1 are correlated with vibration of the carbon-carbon double bond within the acid chain. Thus, comparing the intensity ratios of these two characteristic vibrational bands with other bands which are not correlated with vibration of the double bond could be helpful to investigate the UFA content in vegetable oils. In our analyses, the relative intensity ratios of 1655 cm−1 to 1440 cm−1 and 1265 cm−1 to 1300 cm−1 are investigated. For comparison, the relative intensity ratio of 1440 cm−1 to 1300 cm−1 is also studied, these two bands are correlated with vibration of single carbon-carbon bond.
Figure 2 shows the relative intensity ratios of 1655 cm−1 to 1440 cm−1, 1265 cm−1 to 1300 cm−1, and 1440 cm−1 to 1300 cm−1 as a function of total UFA content in the seven vegetable oil samples. These relative intensity ratios were calculated from the averaged spectra presented in Figure 1. At first thought, it would be expected that with increasing the UFA content in vegetable oils, the intensity increase of the bands at 1265 cm−1 and 1655 cm−1 would be more significant than that of the bands at 1300 cm−1 and 1440 cm−1. Thus, when the UFA content increases, the relative intensity ratios of 1655 cm−1 to 1440 cm−1 and 1265 cm−1 to 1300 cm−1 would also increase, while the relative intensity ratio of 1440 cm−1 to 1300 cm−1 would not change. As can be seen in Figure 2, the relative intensity ratio of 1440 cm−1 to 1300 cm−1 indeed does not depend on the UFA content. However, the correlation of intensity ratios of 1655 cm−1 to 1440 cm−1 and 1265 cm−1 to 1300 cm−1 with the UFA content is contradictory to the expectation. Even with the same UFA content, the intensity ratios of 1655 cm−1 to 1440 cm−1 and 1265 cm−1 to 1300 cm−1 in one sample could be about twice that of those in another sample. This suggests that the relative intensity ratios of 1655 cm−1 to 1440 cm−1 and 1265 cm−1 to 1300 cm−1 are not proportional to the UFA content.
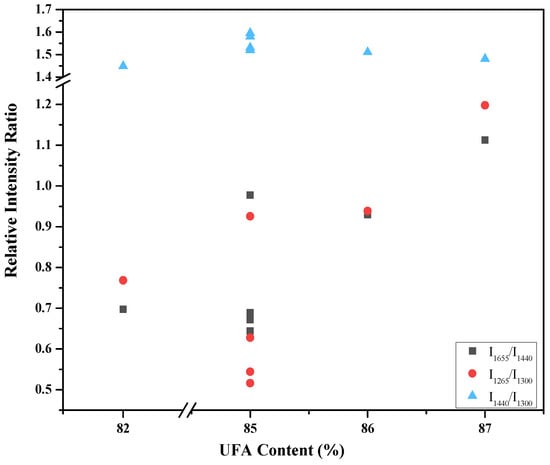
Figure 2.
Relative intensity ratios of I1655/I1440 (square), I1265/I1300 (dot), and I1440/I1300 (triangle) as a function of the total unsaturated fatty acid (UFA) content. The error bars of the relative intensity ratios were estimated to be about 10%, mainly caused by baseline corrections.
In Figure 3a, b, the intensity ratios of 1655 cm−1 to 1440 cm−1 and 1265 cm−1 to 1300 cm−1 as a function of the content of PUFA and MUFA are plotted, respectively. Figure 3 shows that the intensity ratios of 1655 cm−1 to 1440 cm−1 and 1265 cm−1 to 1300 cm−1 would have a correlation with the content of PUFA or MUFA, but not the total UFA. These intensity ratios increase with increasing PUFA content (and decrease with increasing MUFA content). Table 1 showed that the variance of total UFA content is much smaller than that of PUFA or MUFA content for the studied samples. This indicates that in PUFA, the intensity ratios of 1655 cm−1 to 1440 cm−1 and 1265 cm−1 to 1300 cm−1 would be significantly larger than those in MUFA. This is consistent with the Raman analyses of oleic acid and linoleic acid, which showed that the intensity ratios of 1655 cm−1 to 1440 cm−1 and 1265 cm−1 to 1300 cm−1 are significantly larger in linoleic acid than those in oleic acid [14]. If the PUFA content (or MUFA content) is different for vegetable oils with the same UFA content, then the intensity ratios of 1655 cm−1 to 1440 cm−1 and 1265 cm−1 to 1300 cm−1 would be very different in those samples. Therefore, the intensity ratio of a characteristic vibrational band correlated with double bond to a vibrational band not correlated with double bond could be applied for preliminary analysis of the PUFA content (or MUFA), but could not be used to analyze the total UFA content.
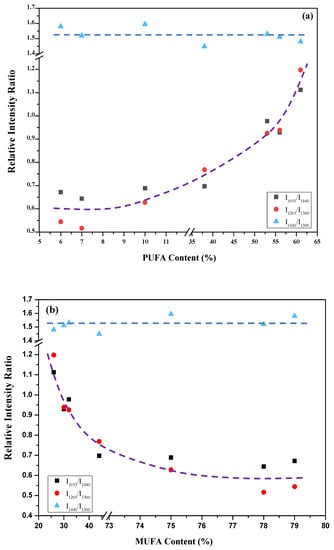
Figure 3.
Relative intensity ratios of I1655/I1440 (square), I1265/I1300 (dot), and I1440/I1300 (triangle) as a function of the content of PUFA (a) and MUFA (b). The curves are not fitted, they simply show the trend how the relative intensity ratios change. The error bars of the relative intensity ratios were estimated to be about 10%, mainly caused by baseline corrections.
Two-dimensional correlation spectroscopy (2DCOS) analyses were applied to the content-dependent 1D Raman spectra in Figure 1 in order to quantify the correlation of the intensities of various vibrational bands with MUFA content (or PUFA). The raw Raman spectra were baseline corrected and the intensities were normalized using the intensity of the vibrational band at 1440 cm−1 as a reference. In our 2DCOS analyses, the average spectrum was selected as the reference spectrum, same as described in Reference [28]. Figure 4 shows the synchronous and asynchronous 2D Raman correlation spectra. The power spectrum extracted along the diagonal line in the synchronous 2D spectrum is also shown at the top of Figure 4a. The synchronous spectrum shows that there are two strong autopeaks at 1265 cm−1 and 1655 cm−1, but no autopeaks at 1300 cm−1 and 1440 cm−1. Since the intensity was normalized using the vibrational band at 1440 cm−1 as a reference, it is natural that the vibrational band at 1440 cm−1 shows negligible intensity change when the MUFA content (or PUFA) changes. However, it is worthwhile to note that the vibrational band at 1300 cm−1 does not change at all, while the vibrational bands at 1265 cm−1 and 1660 cm−1 show significant intensity changes. In addition, Figure 4a shows that the vibrational band at 1665 cm−1 has positive cross peak with the band at 1265 cm−1. This indicates that the intensity of these two bands changes with same trend when the MUFA content (or PUFA) changes. These are in good agreement with the results in Figure 3, further supporting that the relative intensity ratios of 1265 cm−1 to 1300 cm−1 and 1655 cm−1 to 1440 cm−1 could be applied for differentiation of MUFA (or PUFA) from the total UFA in common edible vegetable oils.
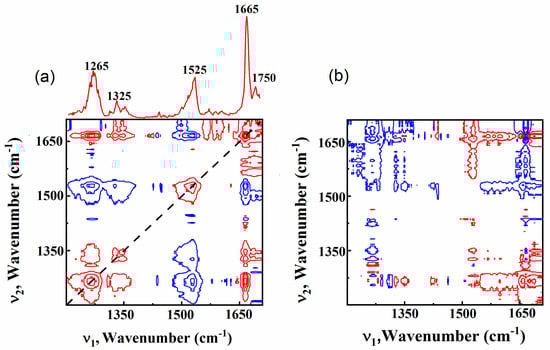
Figure 4.
Synchronous (a) and asynchronous (b) 2D correlation spectra obtained from the series of 1D Raman spectra. Red and blue colors represent positive and negative peaks, respectively. The auto correlation spectrum extracted along the diagonal line in synchronous 2D correlation spectrum is shown at the top of Figure 4a.
Figure 4a also shows a relatively strong autopeak at 1525 cm−1 and two weak autopeaks at 1325 cm−1 and 1750 cm−1. This suggests that the intensity of these peaks would vary when the MUFA content (or PUFA) changes. The band at 1525 cm−1 is a characteristic vibration of olive oil [16], but is not observed in other types of vegetable oils, and the two bands at 1325 cm−1 and 1750 cm−1 are quite weak to investigate. Therefore, detailed analyses of these peaks are not included in this paper. Figure 4b shows that the cross peak at (1665 cm−1, 1265 cm−1) is positive, indicating that the intensity change of 1265 cm−1 occurs after that of 1665 cm−1 when the MUFA content (or PUFA) changes. This suggests further systematic analyses of intensity changes between 1665 cm−1 and 1265 cm−1 could be helpful to differentiate between MUFA and PUFA.
The above Raman spectroscopy and 2DCOS analyses of vegetable oils indicated that the relative intensity ratio of 1655 cm−1 to 1440 cm−1 would be helpful for differentiating common edible vegetable oils. To further understand the differences of the relative intensity ratio of 1655 cm−1 to 1440 cm−1 in various vegetable oils, we investigated Raman scattering of three different types of pure UFA, one MUFA (OA) and two PUFAs (LA and ALA). The result is presented in Figure 5. OA, LA and ALA have the molecular formula of C18H34O2, C18H32O2 and C18H30O2, respectively. The difference of these three acids is the number of double bonds in their acid chains; OA, LA and ALA have one, two, and three double bonds, respectively. Interestingly, the relative intensity ratio of 1660 cm−1 to 1440 cm−1 in OA, LA and ALA have the values of 1.1, 1.7, and 3.1, respectively. This not only confirms the results in Figure 3 and Figure 4, but also indicates that the relative intensity ratio of 1655 cm−1 to 1440 cm−1 could be further applied for differentiating different types of PUFAs. A systematic density functional theory (DFT) calculation of the Raman spectra of UFAs with up to six carbon-carbon double bonds is currently underway. The DFT calculation indicates that the relative intensity ratio of 1655 cm−1 to 1440 cm−1 of UFAs with one, two, and three double bonds agrees well with the Raman scattering study of OA, LA, and ALA. However, for UFAs with four, five, and six double bonds, the relative intensity ratio of 1660 cm−1 to 1440 cm−1 does not increase systematically with the number of double bonds. This suggests that further systematic studies on different types of UFAs are needed to fully understand the relative intensity ratios in UFAs for future practical applications of quality evaluation of vegetable oils by Raman spectroscopy.
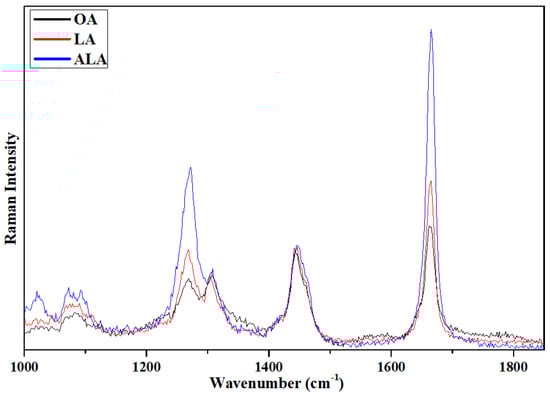
Figure 5.
Raman scattering spectra of oleic acid (OA), linoleic acid (LA), and α-linolenic acid (ALA). The intensity was normalized using the intensity of the band at 1440 cm−1 as a reference.
4. Conclusions
Raman analyses of relative intensity ratios has been applied to investigate total unsaturated fatty acid, polyunsaturated fatty acid, and monounsaturated fatty acid in common edible vegetable oils. The results suggest that for edible vegetable oils with similar total UFA content, the intensity ratios of 1655 cm−1 to 1440 cm−1 and 1265 cm−1 to 1300 cm−1 could be applied for rough qualitative comparison of PUFA or MUFA content. The results of 2DCOS analyses are consistent with that by Raman spectroscopy. Furthermore, the Raman analyses of OA, LA and ALA indicated that the relative intensity ratio of 1655 cm−1 to 1440 cm−1 could be further applied for differentiating different types of PUFAs. With further understanding of relative intensity ratios in various types of UFAs and the development of portable Raman systems, our proposed relative Raman intensity analyses method could be of great interest for practical applications of on-site quality evaluation of edible vegetable oils.
Author Contributions
J.Q. performed the experiments, analyzed the data, and wrote the original draft; H.-Y.H. analyzed the data and participated in discussions of the research; N.T.H. performed the 2DCOS analyses; I.-S.Y. and X.-B.C. supervised the project and revised the manuscript.
Funding
This research was funded by the National Natural Science Foundation of China (Grant No. 11574241) and the National Research Foundation of Korea (NRF) grant funded by the Korean Ministry of Science and ICT (No. 2017R1A2B2009309).
Conflicts of Interest
The authors declare no conflict of interest.
References
- Jentzsch, P.V.; Ciobotă, V. Raman spectroscopy as an analytical tool for analysis of vegetable and essential oils. Flavour Fragr. J. 2014, 29, 287–295. [Google Scholar] [CrossRef]
- Calder, P.C. Functional Roles of Fatty Acids and Their Effects on Human Health. JPEN J. Parenter. Enter. Nutr. 2015, 39, 18S–32S. [Google Scholar] [CrossRef] [PubMed]
- Hunter, J.E.; Zhang, J.; Kris-Etherton, P.M. Cardiovascular disease risk of dietary stearic acid compared with trans, other saturated, and unsaturated fatty acids: A systematic review. Am. J. Clin. Nutr. 2010, 91, 46–63. [Google Scholar] [CrossRef] [PubMed]
- Lee, H.; Park, W.J. Unsaturated Fatty Acids, Desaturases, and Human Health. J. Med. Food 2014, 17, 189–197. [Google Scholar] [CrossRef] [PubMed]
- Vessby, B.; Uusitupa, M.; Hermansen, K.; Riccardi, G.; Rivellese, A.A.; Tapsell, L.C.; Nälsén, C.; Berglund, L.; Louheranta, A.; Rasmussen, B.M.; et al. Substituting dietary saturated for monounsaturated fat impairs insulin sensitivity in healthy men and women: The KANWU study. Diabetologia 2001, 44, 312–319. [Google Scholar] [CrossRef] [PubMed]
- Kien, C.L.; Bunn, J.Y.; Tompkins, C.L.; Dumas, J.A.; Crain, K.I.; Ebenstein, D.B.; Koves, T.R.; Muoio, D.M. Substituting dietary monounsaturated fat for saturated fat is associated with increased daily physical activity and resting energy expenditure and with changes in mood. Am. J. Clin. Nutr. 2013, 97, 689–697. [Google Scholar] [CrossRef]
- Bayle, M.S.; Gonzalez-Requejo, A.; Pelaez, M.J.; Morales, M.T.; Asensio-Anton, J.; Anton-Pacheco, E. A ross-sectional study of dietary habits and lipid profiles. The Rivas-Vaciamadrid study. Eur. J. Pediatr. 2008, 167, 149–154. [Google Scholar] [CrossRef] [PubMed]
- Willett, W.C. The role of dietary n-6 fatty acids in the prevention of cardiovascular disease. J. Cardiovasc. Med. 2007, 8, S42–S45. [Google Scholar] [CrossRef] [PubMed]
- Pala, V.; Krogh, V.; Muti, P.; Chajes, V.; Riboli, E.; Micheli, A.; Saadatian, M.; Sieri, S.; Berrino, F. Erythrocyte Membrane Fatty Acids and Subsequent Breast Cancer: A Prospective Italian Study. J. Natl. Cancer Inst. 2001, 93, 1088–1095. [Google Scholar] [CrossRef] [PubMed]
- Huang, F.; Li, Y.; Guo, H.; Xu, J.; Chen, Z.; Zhang, J.; Wang, Y. Identification of waste cooking oil and vegetable oil via Raman spectroscopy. J. Raman Spectrosc. 2016, 47, 860–864. [Google Scholar] [CrossRef]
- Li, Y.; Fang, T.; Zhu, S.; Huang, F.; Chen, Z.; Wang, Y. Detection of olive oil adulteration with waste cooking oil via Raman spectroscopy and chemometrics. Spectrochim. Acta A 2018, 189, 37–43. [Google Scholar] [CrossRef] [PubMed]
- Jentzsch, P.V.; Gualpa, F.; Ramos, L.A.; Ciobotă, V. Adulteration of clove oil: Detection using a handheld Raman spectrometer. Flavour Frag. J. 2018, 33, 184–190. [Google Scholar] [CrossRef]
- Alvarenga, B.R.; Xavier, F.A.N.; Soares, F.L.F.; Carneiro, R.L. Thermal Stability Assessment of Vegetable Oils by Raman Spectroscopy and Chemometrics. Food Anal. Methods 2018, 11, 1969–1976. [Google Scholar] [CrossRef]
- Fan, Y.; Li, S.; Xu, D.-P. Raman spectra of oleic acid and linoleic acid. Spectrosc. Spect. Anal. 2013, 33, 3240–3243. [Google Scholar]
- Graham, S.F.; Haughey, S.A.; Ervin, R.M.; Cancouët, E.; Bell, S.; Elliott, C.T. The application of near-infrared (NIR) and Raman spectroscopy to detect adulteration of oil used in animal feed production. Food Chem. 2012, 132, 1614–1619. [Google Scholar] [CrossRef] [PubMed]
- El-Abassy, R.M.; Donfack, P.; Materny, A. Rapid Determination of Free Fatty Acid in Extra Virgin Olive Oil by Raman Spectroscopy and Multivariate Analysis. J. Am. Oil Chem. Soc. 2009, 86, 507–511. [Google Scholar] [CrossRef]
- Osawa, C.C.; Gonçalves, L.A.G.; Ragazzi, S. Correlation between free fatty acids of vegetable oils evaluated by rapid tests and by the official method. J. Food Compos. Anal. 2007, 20, 523–528. [Google Scholar] [CrossRef]
- Baeten, V.; Dardenne, P.; Aparicio, R. Interpretation of Fourier Transform Raman Spectra of the Unsaponifiable Matter in a Selection of Edible Oils. J. Agric. Food Chem. 2001, 49, 5098–5107. [Google Scholar] [CrossRef] [PubMed]
- Jiménez-Sanchidrián, C.; Ruiz, J.R. Use of Raman spectroscopy for analyzing edible vegetable oils. Appl. Spectrosc. Rev. 2016, 51, 417–430. [Google Scholar] [CrossRef]
- Dymińska, L.; Calik, M.; Albegar, A.M.M.; Zając, A.; Kostyń, K.; Lorenc, J.; Hanuza, J. Quantitative determination of the iodine values of unsaturated plant oils using infrared and Raman spectroscopy methods. Int. J. Food Prop. 2017, 20, 2003–2015. [Google Scholar]
- Czarnecki, M.A.; Liu, Y.; Ozaki, Y.; Suzuki, M.; Iwahashi, M. Potential of Fourier transform near-infrared spectroscopy in studies if dissociation of fatty acids in the liquid phase. Appl. Spectrosc. 1993, 47, 2162–2168. [Google Scholar] [CrossRef]
- Sadeghi-Jorabchi, H.; Wilson, R.H.; Belton, P.S.; Edwards-Webb, J.D.; Coxon, D.T. Quantitative analysis of oils and fats by Frourier transform Raman spectroscopy. Spectrochim. Acta A 1991, 47A, 1449–1458. [Google Scholar] [CrossRef]
- Kong, M.H.; Wu, D.X.; Chen, X.B. Qualitative and Quantitative Studies on Artemisinin with Raman Spectroscopy. Spectrosc. Spect. Anal. 2017, 37, 778–782. [Google Scholar]
- Zarei, A.; Klumbach, S.; Keppler, H. The Relative Raman Scattering Cross Sections of H2O and D2O, with Implications for In Situ Studies of Isotope Fractionation. Acs Earth Space Chem. 2018, 2, 925–934. [Google Scholar] [CrossRef]
- Chen, X.B.; Hien, N.T.M.; Han, K.; Nam, J.Y.; Huyen, N.T.; Shin, S.I.; Wang, X.; Cheong, S.W.; Lee, D.; Noh, T.W.; et al. Study of spin-ordering and spin-reorientation transitions in hexagonal manganties through Raman spectroscopy. Sci. Rep. 2015, 5, 13366. [Google Scholar] [CrossRef] [PubMed]
- Kong, M.-H.; Choi, J.-Y.; Kim, H.-T.; Chen, X.-B. Raman spectroscopy studies of spin-wave in V2O3thin films. J. Phys. D Appl. Phys. 2016, 49, 465304. [Google Scholar]
- Noda, I. Generalized Two-Dimensional Correlation Method Applicable to Infrared, Raman, and other Types of Spectroscopy. Appl. Spectrosc. 1993, 47, 1329–1336. [Google Scholar] [CrossRef]
- Noda, I.; Ozaki, Y. Two-Dimentional Correlation Spectroscopy; Applications in Vibrational Spectroscopy; John Wiley & Sons Inc.: New York, NY, USA, 2004. [Google Scholar]
- Jung, Y.M.; Noda, I. New approaches to generalized two-dimensional correlation spectroscopy and its applications. Appl. Spectrosc. Rev. 2006, 41, 515–547. [Google Scholar] [CrossRef]
- Shinzawa, H.; Awa, K.; Noda, I.; Ozaki, Y. Pressure-induced variation of cellulose tablet studied by two-dimensional (2D) near-infrared (NIR) correlation spectroscopy in conjunction with projection pretreatment. Vib. Spectrosc. 2013, 65, 28–35. [Google Scholar] [CrossRef]
- Nguyen, T.H.; Nguyen, T.M.H.; Chen, X.-B.; Yang, I.-S.; Park, Y.; Jung, Y.M. 2D correlation analysis of the magnetic excitations in Raman spectra of HoMnO3. J. Mol. Struct. 2014, 1069, 280–283. [Google Scholar] [CrossRef]
- Nguyen, T.M.H.; Nguyen, T.H.; Chen, X.-B.; Park, Y.; Jung, Y.M.; Lee, D.; Noh, T.; Cheong, S.-W.; Yang, I.-S. Correlation between magnon and magnetic symmetries of hexagonal RMnO3 (R = Er, Ho, Lu). J. Mol. Struct. 2016, 1124, 103–109. [Google Scholar] [CrossRef]
- Pi, F.; Shinzawa, H.; Czarnecki, M.A.; Iwahashi, M.; Suzuki, M.; Ozaki, Y. Self-assembling of oleic acid (cis-9-octadecenoic acid) and linoleic acid (cis-9, cis-12-octadecadienoic acid) in ethanol studied by time-dependent attenuated total reflectance (ATR) infrared (IR) and two-dimensional (2D) correlation spectroscopy. J. Mol. Struct. 2010, 974, 40–45. [Google Scholar] [CrossRef]
© 2019 by the authors. Licensee MDPI, Basel, Switzerland. This article is an open access article distributed under the terms and conditions of the Creative Commons Attribution (CC BY) license (http://creativecommons.org/licenses/by/4.0/).