1. Introduction
Parkinson’s disease (PD) is a chronic neurological disease which leads to a great loss of motor function. There are multiple symptoms that indicate the severity of PD, including resting tremor, akinesia, decreased motor activity (hypokinesia), bradykinesia and dyskinesia. Among the most common chronic neuro-degenerative diseases, PD is ranked in the second place. Records show that PD affects more than four million people all over the world, affecting about 1–2% of the elderly people exceeding the age of 60 years. On the other hand, freezing of gait (FOG) is a phenomenon known as brief moments in which patients suffer from being unable to start appropriate forward movements. It is known as one of the most important things that might affect life in PD patients [
1,
2]. In addition, it is considered as one of the most important reasons of falls [
3]. Hence, it is important to develop wearable systems to predict and reduce FOG incidences [
4].
The idea of getting quantitative data of human locomotion using wearable technology has received an increased interest from researchers in recent years. Typically, quantitative assessment using wearable sensors allows for continuous, economical, straightforward data collection. Also, it can improve doctor–patient interaction, which helps in making decisions, and eventually affects the overall global health status. Normally, patients’ scheduled clinical visits do not provide all snapshots of the conditions that a patient has in that particular situation as how he/she performs at home. However, some neurological diseases that affect human gait, such as Parkinson’s disease, are characterized by its fluctuations, which may or may not consistently occur within and across days. This necessitates the need for the use of new technologies that can quantitatively measure, assess, and remotely transmit data to the doctor. Practical quantitative recordings from wearable sensors may also help capture accurate and meaningful data that is more informative than clinical surveys. Also, monitoring patients’ locomotion with neurological diseases such as Parkinson’s disease in clinics does not always provide the doctors with a valid and accurate data due to the fact that patients always know that they are being monitored. So, the normal symptoms may not occur as they happen in normal days [
5,
6].
The most important task of using different wearable sensors is to combine the data from these sensors, and generate useful knowledge and reasonable information that can help in predicting and decreasing the severity of locomotion abnormality remotely. The most commonly used types of wearable sensors that have been proposed in the literature for locomotion monitoring include accelerometers, gyroscopes, and magnetometers. Still, these sensors have their limitations [
7]. In addition to these sensors, few studies recommended to combine surface electromyography (EMG) with some of the above mentioned sensors. However, the studies in that field are still evolving with few preliminary trials reported in the literature. Rissanen et al. [
8] proposed using surface EMG with accelerometers, as surface EMG (sEMG) in PD patients is characterized by alternating patterns. In this study, the EMG was collected from the biceps brachii (BB) muscle, and accelerometers were placed on the Palmer wrists. sEMG was also used by Loconsole et al. [
9] for tremor detection, where Myo armbands were attached to the subjects’ forearms.
In addition to the use of wearable sensors, the application of machine learning (ML) techniques on the measured data has received increased attention by researchers in recent years. More specifically, the application of ML techniques enables an automatic and accurate assessment of the measured data, which in turn facilitates the employment of tele-rehabilitation. Moreover, ML, when combined with signal processing techniques, helps to overcome some of the limitations and inaccuracies encountered during the measurement process using wearable sensors [
10].
In this article, we propose a body sensor network (BSN) based on wearable surface EMG and accelerometers for a highly accurate classification of PD tremor and tele-rehabilitation. The proposed BSN is based on sensor fusion of a sEMG placed on the forearm and an accelerometer on the Palmer wrist. We further apply ML algorithms to automatically classify tremor in PD patients. Moreover, we compare the proposed approach to corresponding techniques in the literature.
This paper is organized as follows.
Section 2 summarizes related work on wearable sensors used for tremor detection and assessment.
Section 3 introduces the materials and methods used in dataset collection and classification. Results and discussion are provided in
Section 4. Then, conclusions are given in
Section 5.
2. Ralated Work
There are different common types of wearable motion measurement sensors and systems which help in diagnosing and detecting neurological diseases that affect human gait such as Parkinson’s disease wirelessly. These sensors include accelerometers, gyroscopes, magnetometers, electromagnetic tracking systems (ETS), force sensors, and surface electromyography (EMG) [
11]. All these sensors can be used together or separately as deemed to help in various analysis applications. For instance, an accelerometer is a sensor that measures linear acceleration and is suitable for measuring the locomotion status in human gait [
12]. On the other hand, a gyroscope is an angular velocity sensor that can be used for measuring the posture and motion of the patient in gait analysis by measuring the segments’ angular rate of the patient’s body [
12]. Whereas, electromyography (EMG) is used for measuring the action and the activity of the muscles, as an indirect measurement of muscle activity by using surface or wire electrodes [
13]. Even though electrocardiogram (ECG) measures the electrical activity of the heart using an outer body surface electrodes placed on the skin, it has also been proposed in some cases of gait monitoring [
11]. Among the sensors used for the detection and assessment of neurological diseases, accelerometers have been widely used in most studies, either solely or in combination with other types of sensors, as they provide insightful information about the movement of body limbs being tested, which directly affects gait parameters [
14].
There are a number of medical uses for accelerometers that can greatly impact the quantitative measurement of PD. The following is some studies which included accelerometers in their tests. Patel et al. [
15] conducted a research was including twelve test subjects with age ranges from 46 to 75 years to diagnose idiopathic PD. Three accelerometers were used in total to detect FOG and to measure three-dimensional (3D) acceleration. Two of the sensors were attached to the patients’ legs at the shank slightly above the ankle and on the thigh right above the knee. The third 3D accelerometer was positioned on the lower back of the patient on a belt [
15]. Typically, the number and position of sensors vary according to the target gait parameter being tested, and the anticipated accuracy of results.
Another approach was proposed by Lee et al. [
16], in which seven patients diagnosed with PD were recruited (six males; 62.7 ± 10 years). Eight accelerometers (based on the Shimmer platform) have been placed on the upper and lower arms and legs of test subjects to monitor them while they were asked to do specific sets of motor tasks. Several studies employed wireless wearable accelerometers and smartphones for the assessment of PD tremor and simulated tremor, e.g., the study conducted by LeMoyne et al. [
17].
Other research suggested the use of accelerometers, gyroscopes and magnetometers together to increase the rate of success in diagnosing PD. Woung et al. [
18] collected their data by using tri-axial wearable sensors, namely accelerometer, magnetometer and gyroscope for the classification of patients with PD from healthy controls. The wearable sensors were attached to both wrists and limbs of each test subject to capture movement data while performing certain motor tests. The output signals were passed through a low-pass filter with a cutoff frequency of 4 Hz.
Rissanen et al. [
8] proposed a newer approach to diagnose PD, in which they combined accelerometer sensors and EMG sensors. More specifically, they used sEMG electrodes to measure the data from the EMG electrodes that were placed on the belly of the biceps with an inter electrode spacing of 3 cm. The neutral electrode was positioned 6–7 cm from the recording electrode. They also used accelerometers that were placed on the Palmer sides of each patient’s wrists. The data was collected by measuring output signals from patients while they were on their medication to avoid the tendency to fall, and it was proven that medication may reduce variations between the EMG signals of PD patients and healthy subjects. However, it does not remove them entirely. Also, they tested a number of patients that were off medication.
Loconsole et al. [
9] proposed the use of sEMG in the form of a Myo armband attached to eight different points on the forearm. This measurement set is complex and requires an experienced specialist. For tele-rehabilitation purposes, it is recommended that the subjects be allowed to move freely, as they are supposed to take their measurements at home or the office.
As stated from previous tests, accelerometers can only measure the acceleration and induce the changes in locomotion of the human body. However, using accelerometers alone has its drawbacks. In particular, it is almost impossible to detect tremors with an accelerometer, as it can only measure high frequency components of a tremor, whereas the magnitude of sensor output is completely dependent on the angular position. Another disadvantage is the fact that while all movements are based on rotations of joints, accelerometers measure linear acceleration. So, to increase the accuracy of output data, we may use one of the new approaches such as sEMG sensors, which can measure the muscle activity in combination with accelerometers to assess and predict PD remotely.
Muscle activation is measured using surface electromyography (EMG), and can be used in PD for tremor analysis. Nowadays, there is an increased interest in the approaches based on surface EMG in addition to the commonly measured kinematics of PD patients.The reason for this is that they have the advantage of the absence of complex measurement setup and typically measurements are easy to be captured. Also, they are cost-effective and non-invasive. Recently, surface EMG signals proved that they can effectively be used to differentiate between healthy subjects and patients with PD. Since PD characteristics can considerably vary over the period of the day, thus using EMG recordings is beneficial for continuous monitoring of patients along the day. Previous studies showed that long-term EMG monitoring is valid and reliable for measuring and quantifying pathological tremor, which, as was previously stated, can greatly help in detecting PD patients.
More recently, the deployment of machine learning (ML) techniques in addition to wearable sensors has been evolving [
19]. The use of ML algorithms enables for both accurate and automatic assessment of patient symptoms, which in turn deemed to help in both decision making and long-term monitoring of patients. Some of the aforementioned studies, among others, have employed ML algorithms in their studies. A summary of the important related work from the literature that employed ML techniques is depicted in
Table 1. The best classification accuracy was reported in [
9] using a Myo armband on eight points of the forearm with a classification accuracy of 92.98% using support vector machine (SVM) classifier. However, as was stated earlier, for tele-rehabilitation purposes where the patient is allowed to take measurements at home, having a complex measurement approach would not be feasible.
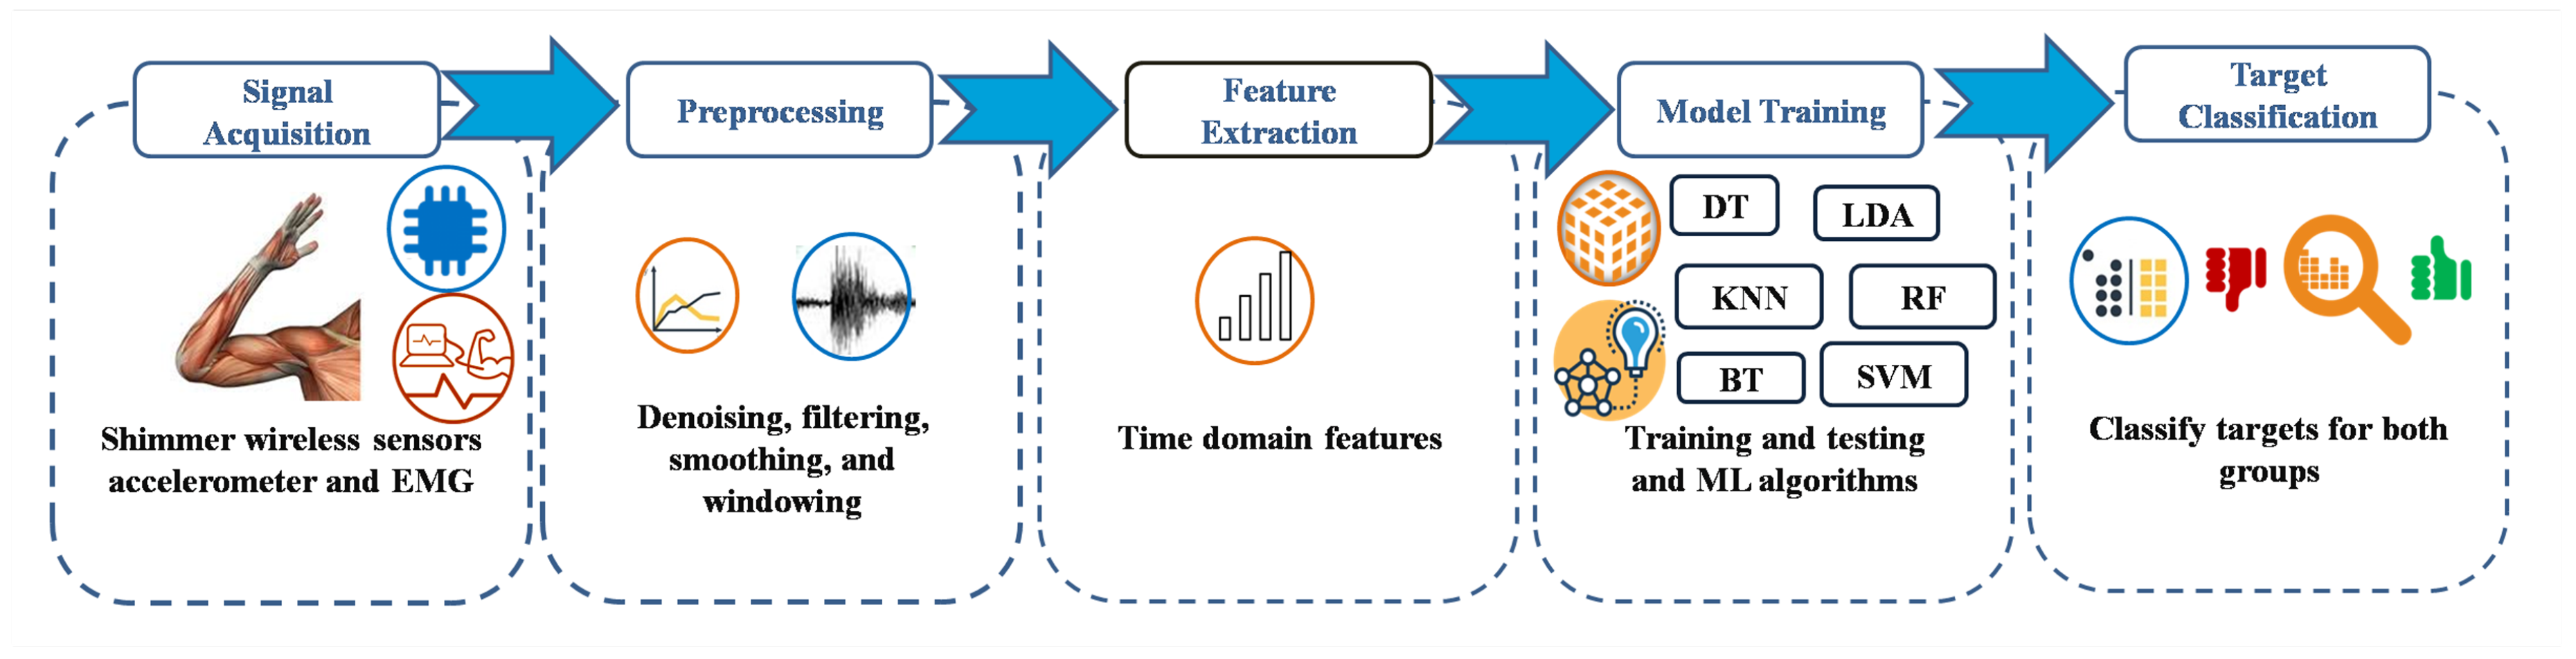
3. Materials and Methods
3.1. Participants and Procedures
In our proposed approach, we combined accelerometer and sEMG data to discriminate between patients with simulated PD tremors and healthy test subjects. Burkhard et al. [
23] proved that healthy subjects are able to simulate indistinguishable tremors from PD patients in frequency and regularity. Furthermore, Bettina et al. [
24] investigated the simulated parkinsonian tremors of healthy subjects using sEMG and whole head neuromagnetometer, and showed that healthy subjects did not have any difficulties simulating PD tremors. In our study, we adopt both approaches. In particular, twenty-one normal subjects, summarized in
Table 2, participated in accelerometer and EMG movement measurements and voluntary simulated tremors after giving their informed verbal consent. The test subjects had an earlier diagnosis, and they did not have other diseases that may interfere with motor function. The study was approved by AASTMT EC Ethics Committee (Reference number 36/22 February 2016).
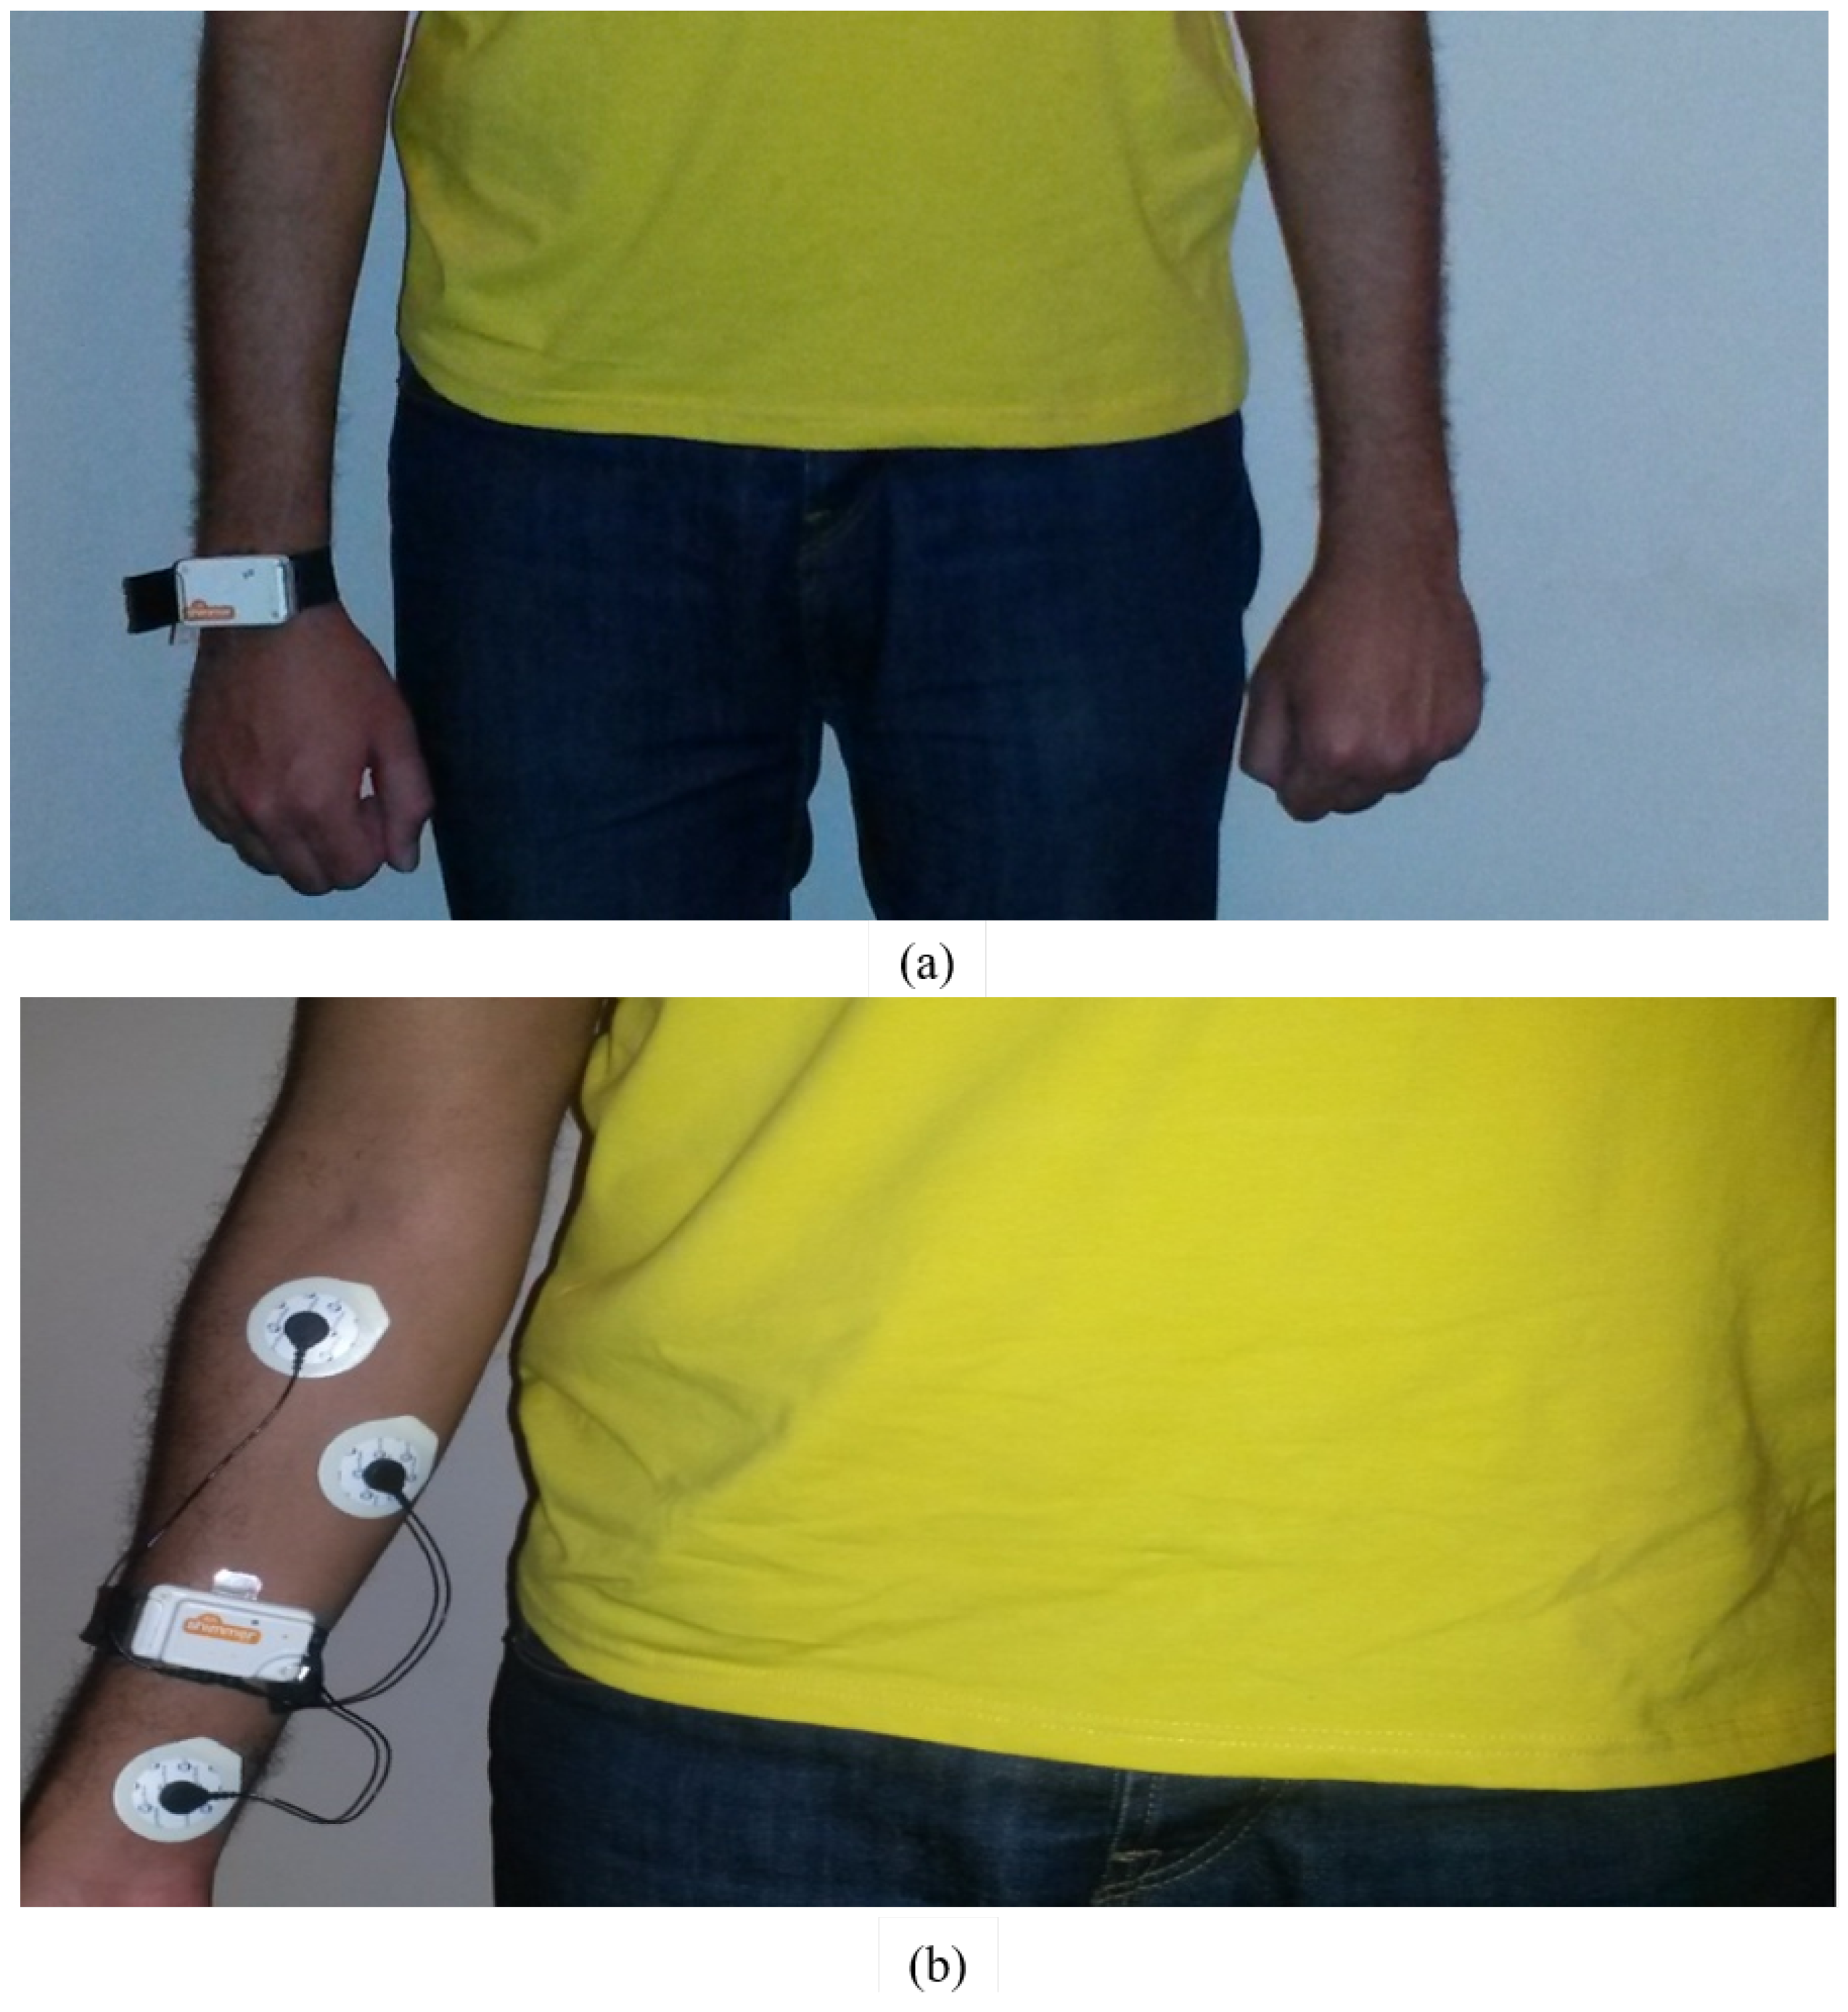
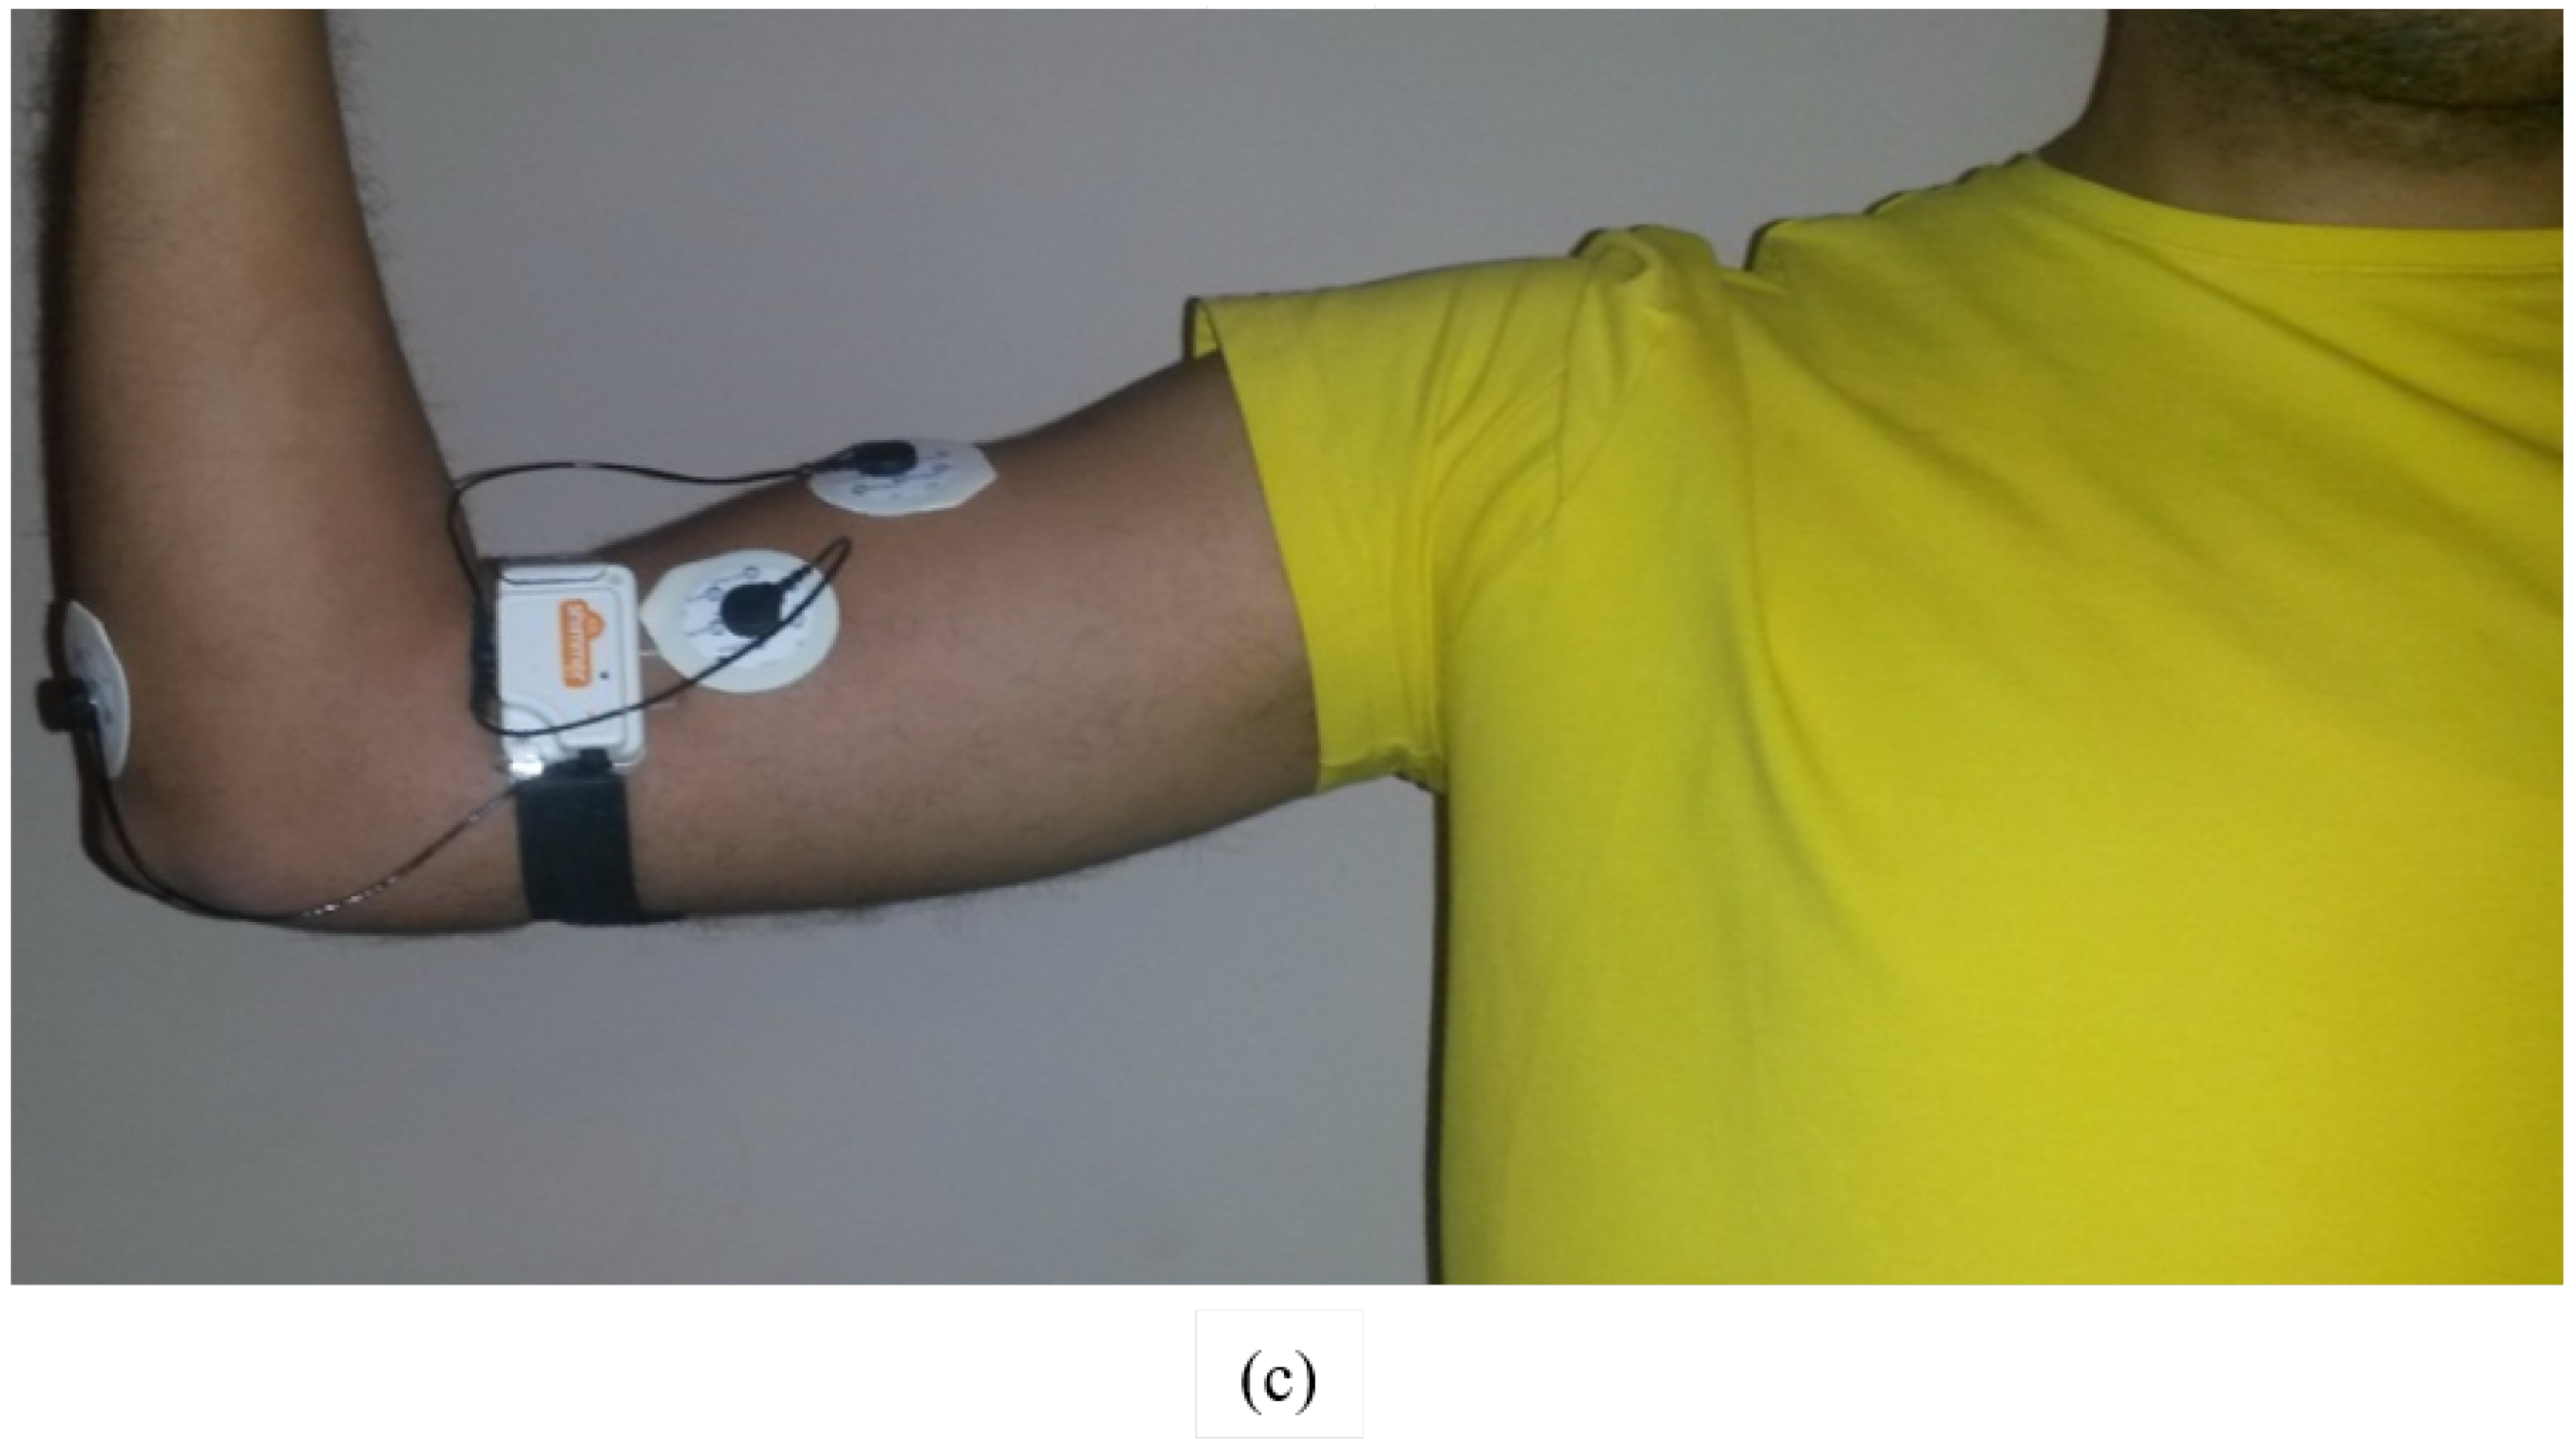
In our study, wearable surface EMG and 3D accelerometers by Shimmer were used to capture the data. Sensors were attached to healthy subjects, where they simulated the symptoms of PD patients like tremor as an example. In our proposed measurement set, the accelerometer sensors were placed on the Palmar sides of each subject’s wrists. The sEMG sensors were placed on the forearm muscles, which control the movement of wrists and are proven to be more responsible for tremor action than biceps brachii muscle. Typically, Parkinson’s disease tremor is characterized by oscillations in wrist extension and flexion, pronation and supination, or finger flexion [
25]. EMG signals captured for tremor assessment are commonly measured from the forearm [
25]. The captured signals were measured by using Ag/AgCl disposable electrodes with 3 cm spacing and the neutral electrode was placed on Palmer wrist side as shown in
Figure 1. This is opposed to the technique used by Rissanen et al. [
8], where the surface EMG sensors were placed on the biceps brachii muscles of the patients. Prior to taking the measurements, test subjects were shown how to mimic the tremor, and the measurement set was explained. Then during measurements, they were asked to walk in the normal way holding their elbows at an angle of
with their palms up in a straight line for about 10 m, then turn around and come back to the starting point. The main investigated symptom was the tremor. This procedure was repeated while simulating Parkinson’s disease symptoms. Both signals were sampled at a 1000 Hz rate. The detailed sequence of the proposed methodology is shown in
Figure 2.
Equipment
In our measurements, we used wearable sensors by Shimmer. The used sensor platform is made for wireless wearable applications. The basic 3D accelerometer and EMG sensors have large storage and low-power communication standards. These features enable the sensors to be used in many applications like motion capture with continuous data processing, and real-time vital sign monitoring. The used Shimmer sensors consist of 3D accelerometer using free scale MMA7260Q 1.5/2/4/6 g MEMs accelerometer, signal quest SQ-SEN200 passive MEMs omnidirectional tilt and vibration sensor with expansion boards for 3-Lead ECG, EMG kinematics (3D gyroscope). They have high reliability standards based mobility such as Bluetooth radio (Roving Networks RN-42), which facilitates data transfers from sensors at high rates, MicroSD card slot of up to 2 GB of flash memory. Also, Shimmer sensors have small size 53 mm × 32 mm × 15 mm which does not irritate the patients while wearing.
3.2. Data Preprocessing
The data preprocessing is divided into two successive stages, namely, noise removal and filtering followed by segmentation. Raw signals are usually noisy, particularly EMG signals, so they need to be filtered in order to remove noise, unwanted frequencies, and only retain frequencies of interest. For this purpose, the raw data from the accelerometer (ACC) and electromyogram (EMG) are filtered using a band-pass filter (20–450 Hz). Also, a notch filter at 50 Hz is further applied to EMG signals to avoid AC interference. In the segmentation stage both EMG and ACC filtered signals are segmented into 150 ms segments with a sliding window of increment step of 25 ms. Each of these segments is considered as a single trial and will be used later in the feature extraction and classification steps. Thus, each trial will have a size of , where N = 1 is the number of channels and T = 150 corresponds to 150 ms segment sampled at 1000 Hz.
3.3. Feature Extraction
In order to train a machine learning model, discriminative features are needed to be extracted from the EMG and ACC segmented data. For each trial of an EMG signal, four features are extracted from the time domain (TD). This feature set includes; mean absolute value (MAV), the number of zero crossing (ZC), the waveform length (WL), and the number of slope sign changes (SSC). As for the ACC signals, seven statistical features are extracted from (TD) as well, namely; mean, variance, standard deviation, minimum, index of the minimum, maximum, and index of the maximum.
3.4. Model Training
In this step, feature sets generated in the feature extraction phase were used to construct four popular individual machine learning classifiers. These classifiers were linear discriminate analysis (LDA), K-nearest neighbor (KNN), support vector machine (SVM), and decision tree (DT) classifiers. Distance metric used for the KNN is Euclidian distance and the number of neighbors (K) is equal to 1. Linear kernel function is employed for SVM. As for DT, the split criterion used is gini index and the number of splits is 100.
Ensemble classifier is a technique that combines prediction of several individual classifiers by a fusion rule. Ensemble combines the strength of each classifier in the pool of classifiers which commonly leads to an enhancement in the performance of individual classifiers. Also, it can lower chances of poor results that can be produced from a certain unsuitably individual model. Ensemble process is similar to the case in which clinical diagnosis is made by taking diagnosis from a number of clinicians to end up to a more confident final decision.
Ensemble has two topologies; cascaded and parallel. In the former topology, classifiers of the pool are connected in cascaded manner. This topology includes the Adaboosting. In Adaboosting, every classifier in the pool of classifiers tries to enhance the performance of the previous weaker classifier. Adaboosting employs a class weighting resampling technique to learn the subsequent model in the ensemble. Examples that are misclassified using the initial classifier in the ensemble are given higher weights and then these resampled instances go into the next classifier. This is reiterated until all models are processed. In the later structure, classifiers of the ensemble were connected in parallel and their predictions are combined using majority voting, maximum probability, minimum probability, or averaging methods. This type includes Bagging. Bagging ensemble depends on the Bootstrap resampling technique which generates several random data subsets from the original data. These subsets are used to construct the pool of classifiers available in the ensemble [
26].
Bagging and Adaboosting were employed in this paper to build ensembles of decision tree classifiers. Both individual and ensemble classifiers are constructed and validated using 10 cross validation method.
Our experiments were implemented on Intel® core I7 and NVIDIA GEFORCE, Windows 10, 64 bit with 4 GB RAMS. MATLAB R2016 b software was used for the implementation of the proposed framework.
In order to evaluate the performance of proposed framework, several metrics were adopted such as; classification accuracy (CA), sensitivity, specificity, and area under receiver operation characteristic (AUC) were used. Equations (1)–(3) describe these metrics.
where;
—True Positive,
—true negative,
—false positive, and
—false negative.
A receiving operating characteristics (ROC) is a curve demonstrating the sensitivity as a function of the 1- specificity. The AUC describes the area under the ROC curve it value ranges between ‘0’ and ‘1’. A higher AUC value gives a better classification performance.
4. Results and Discussion
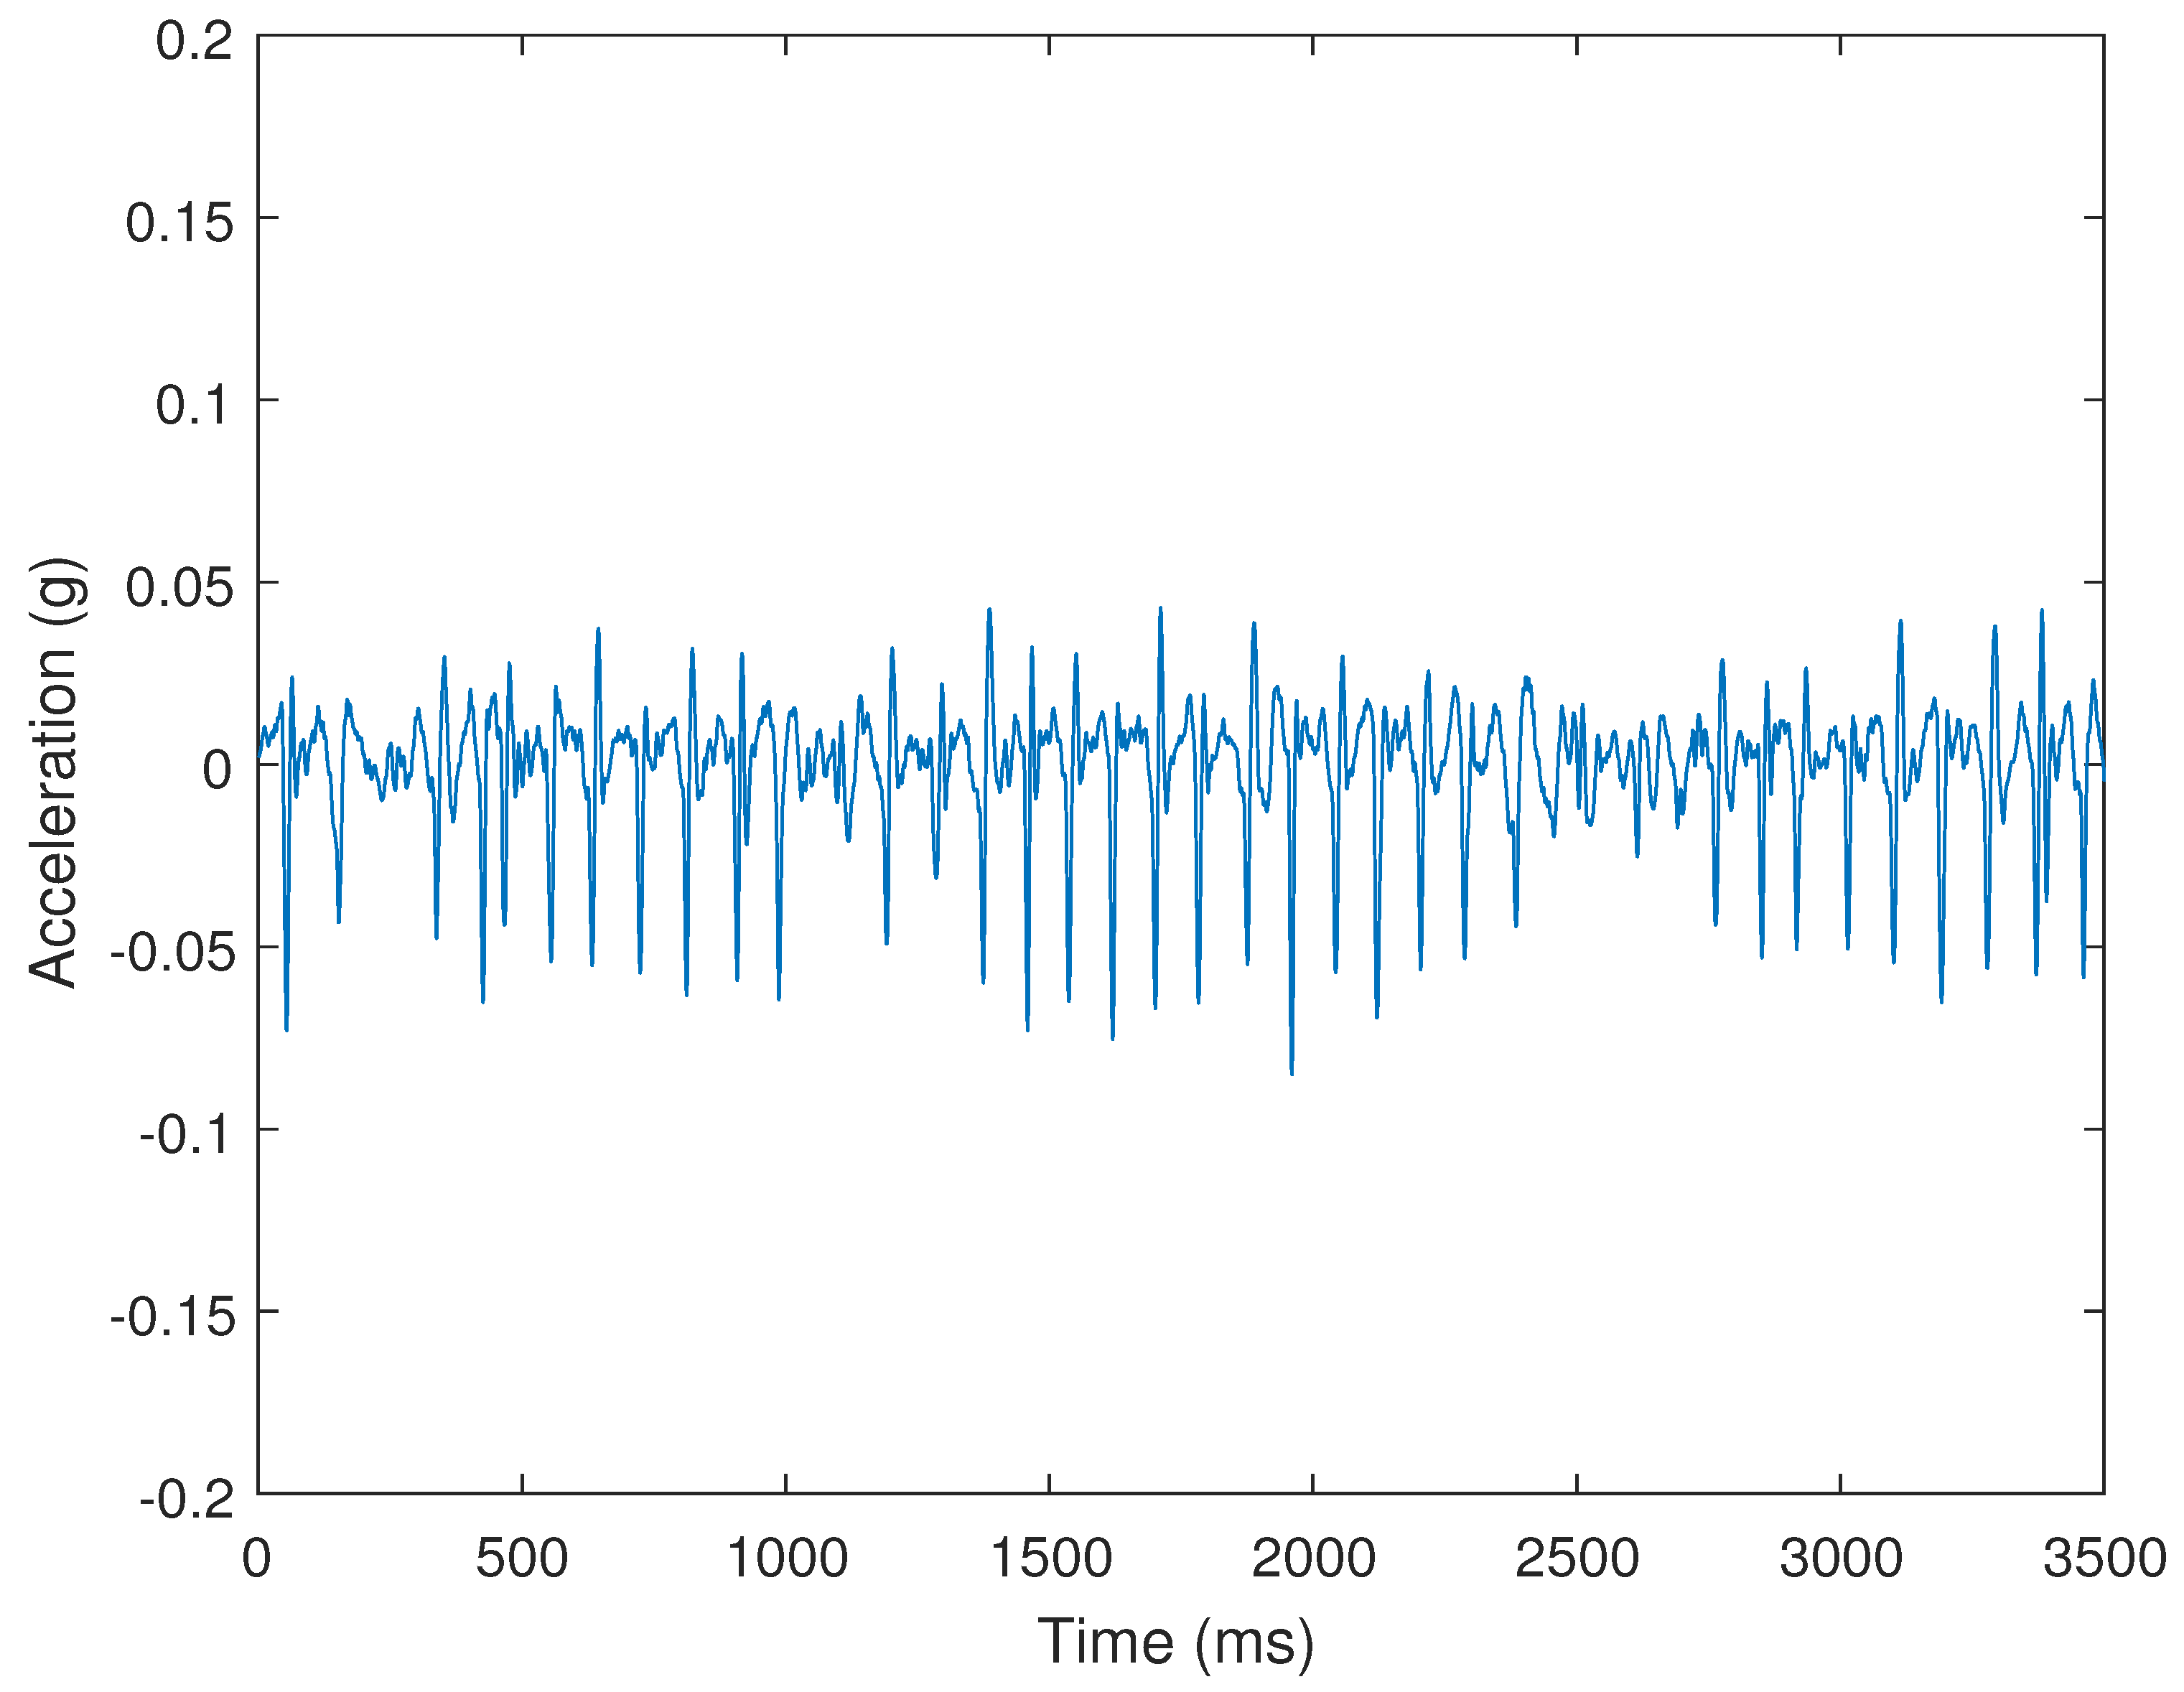
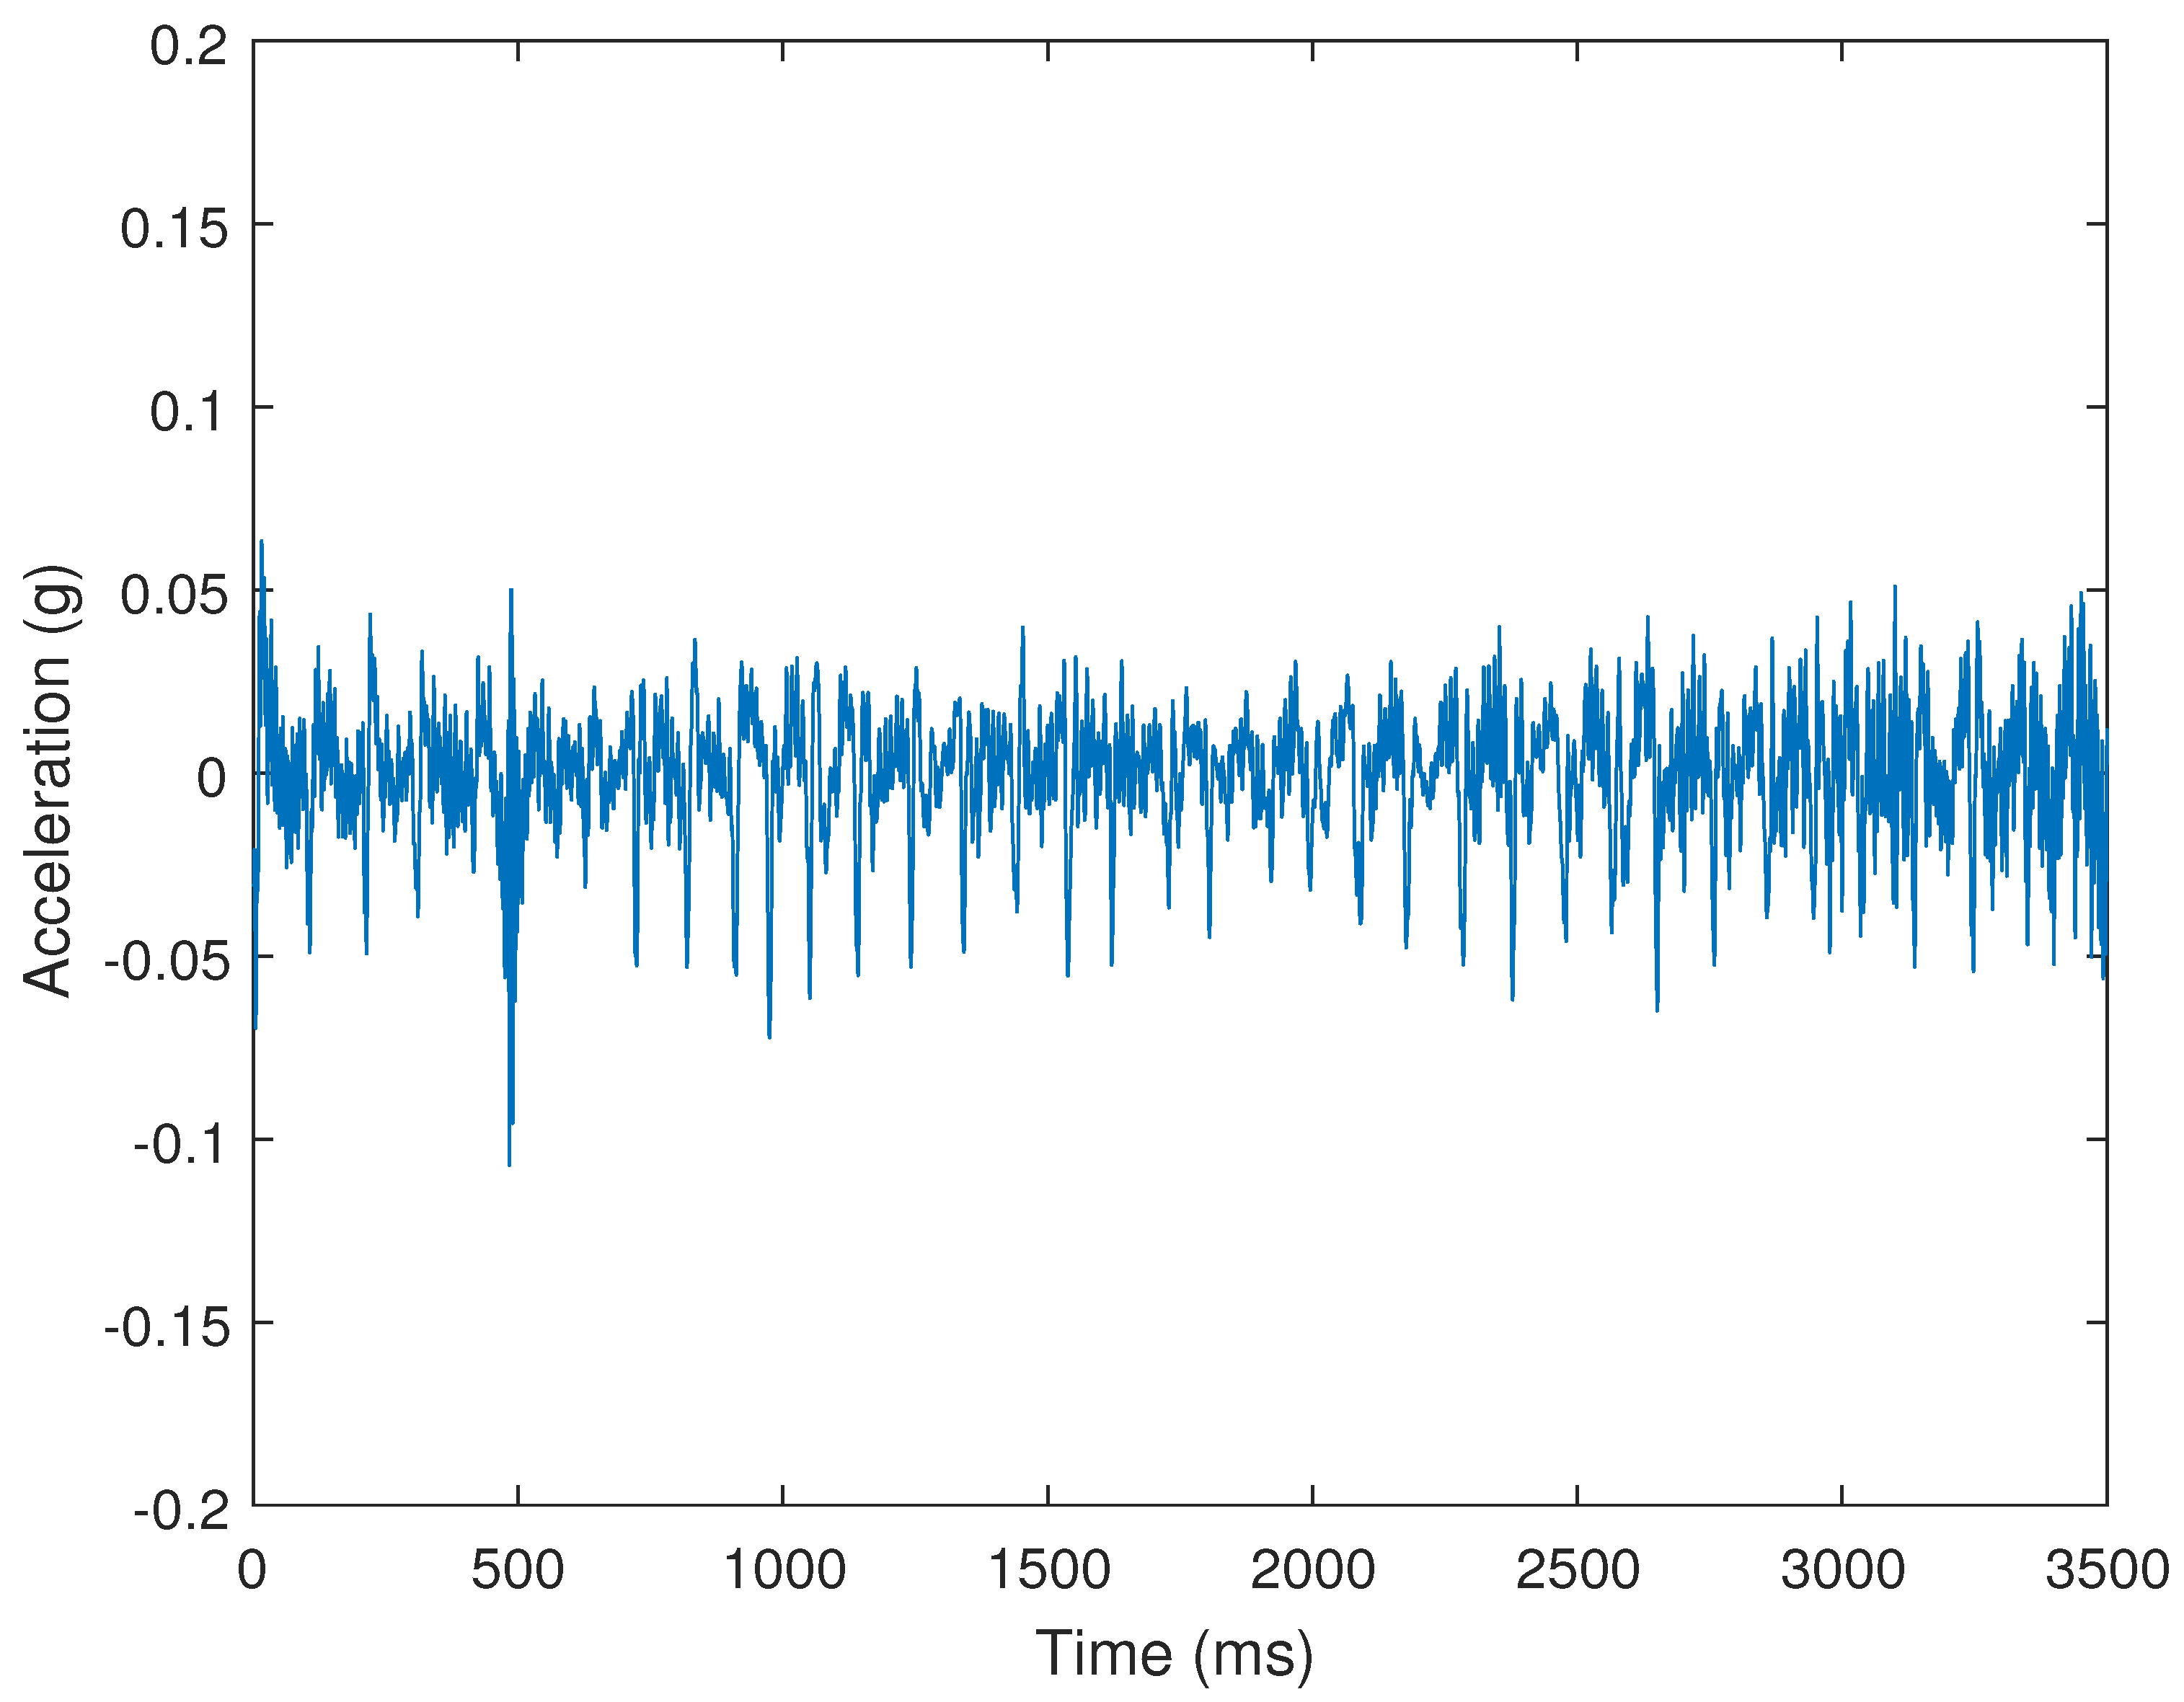
The results as shown in
Figure 3 and
Figure 4 show that the accelerometer data of a PD patient has higher amplitude as compared to a normal test person. This is due to the effect of tremor of PD patients.
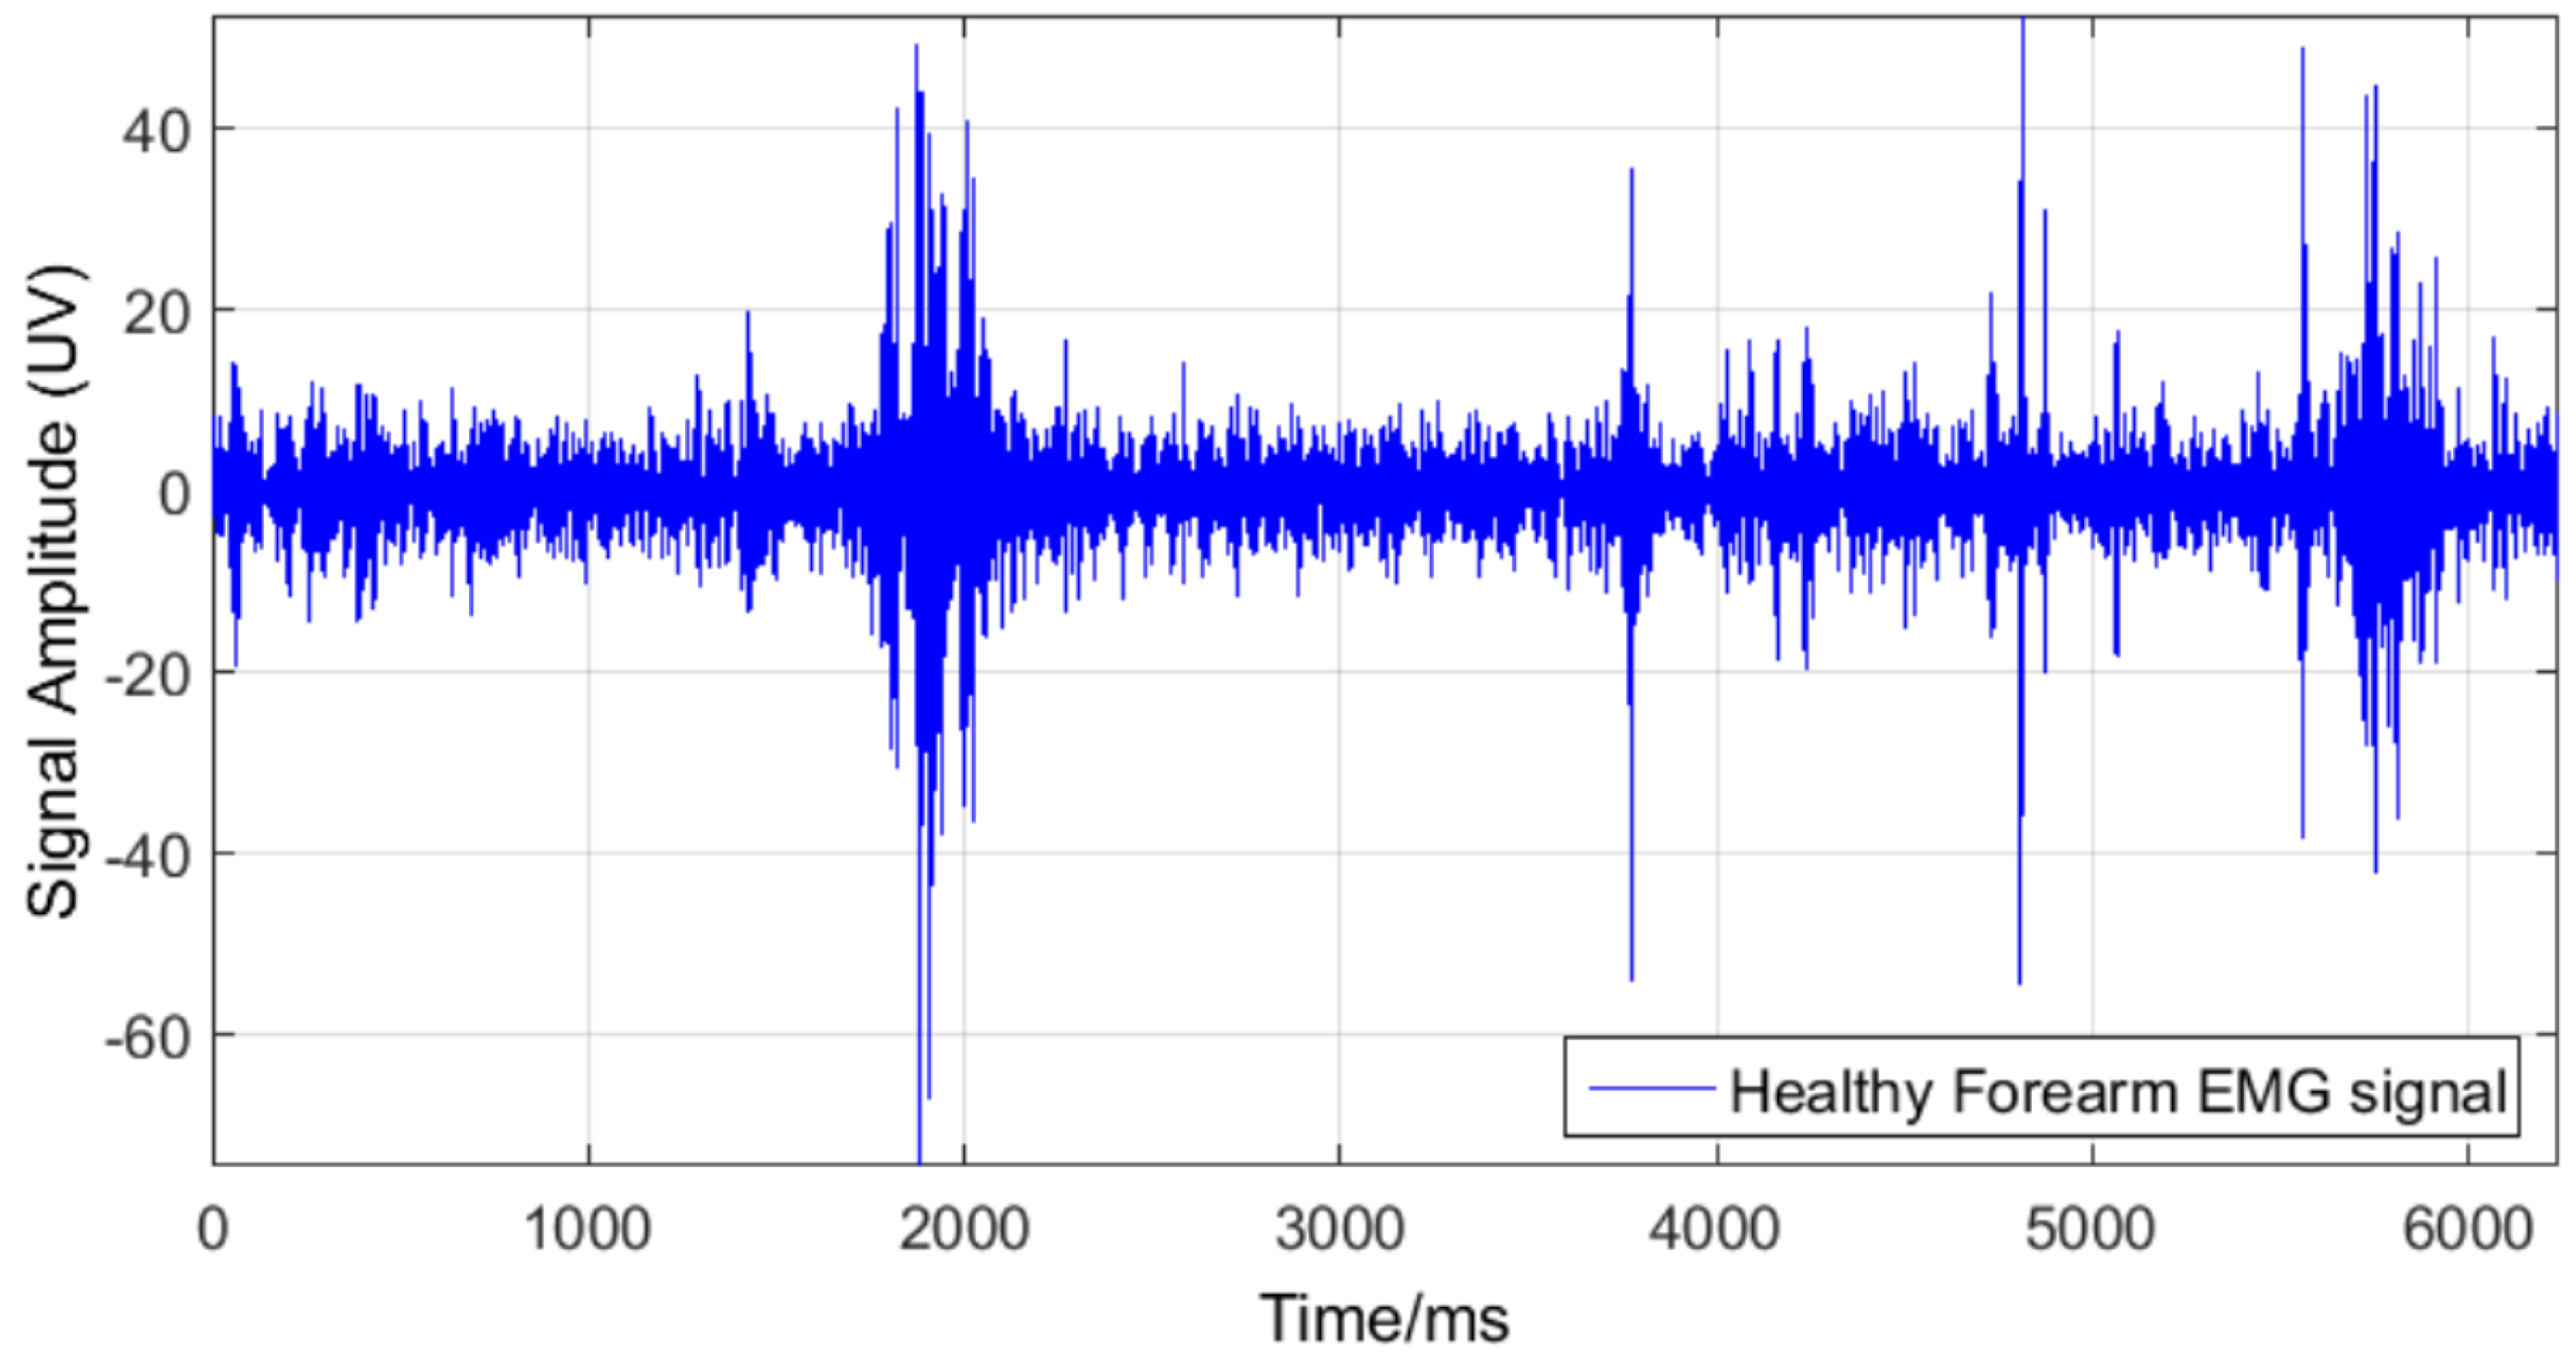
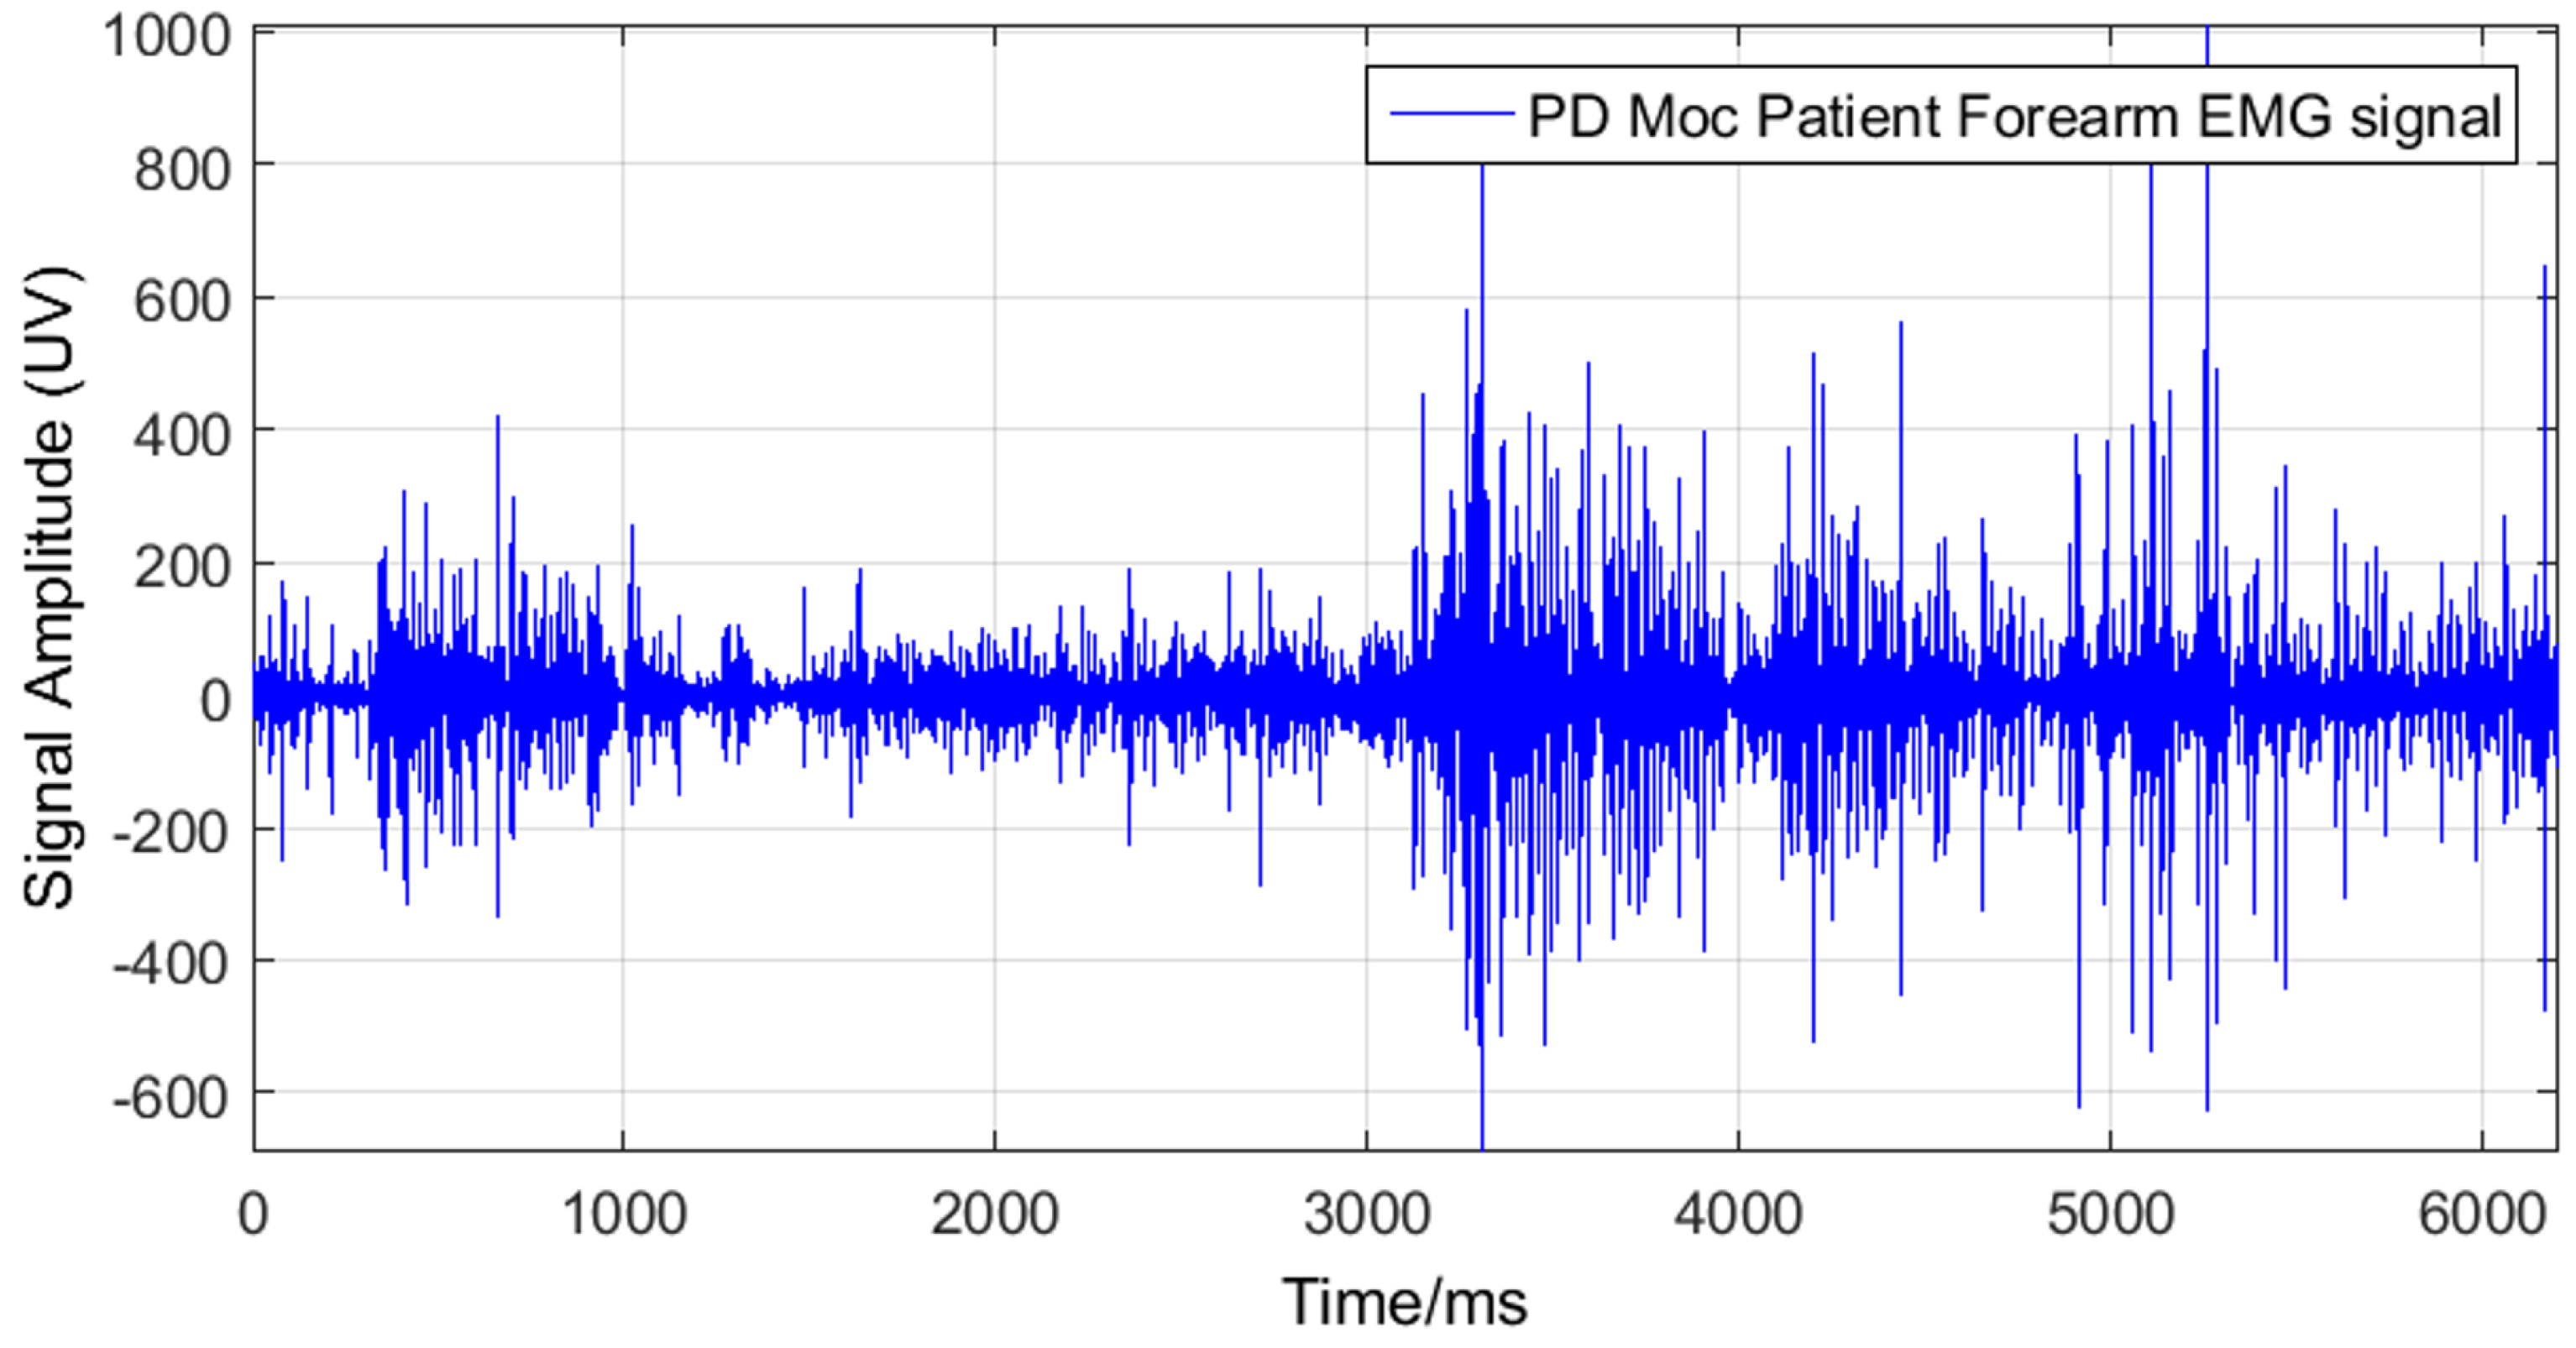
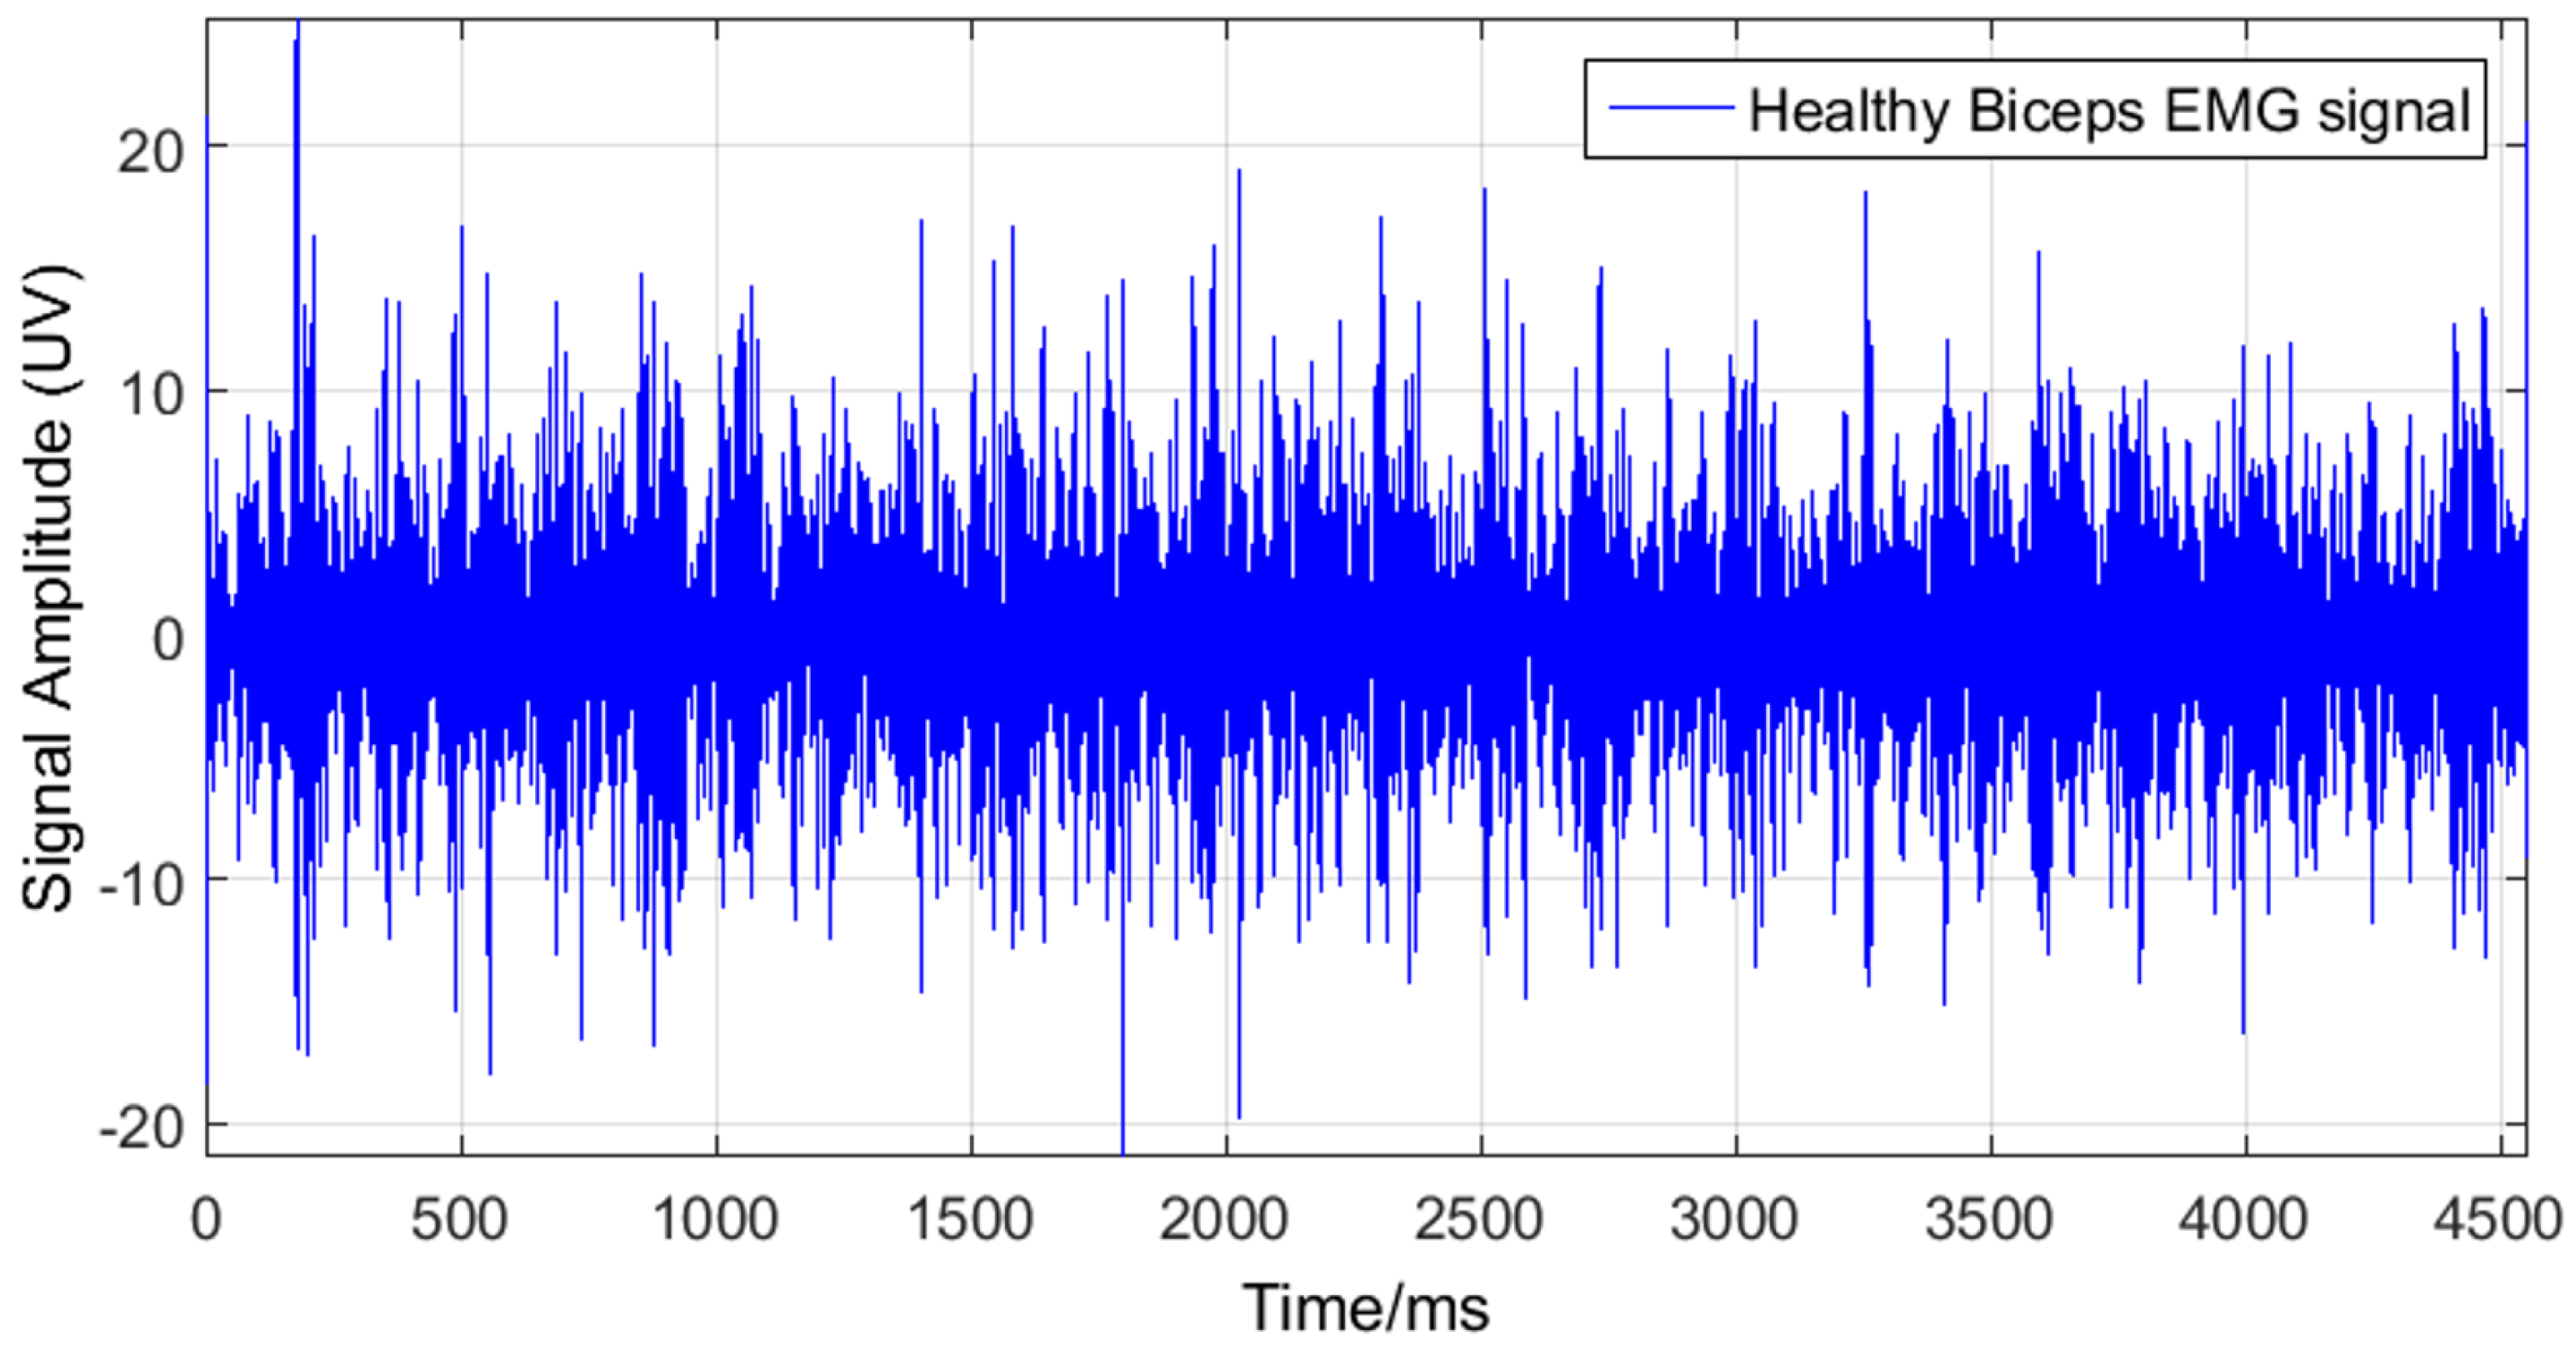
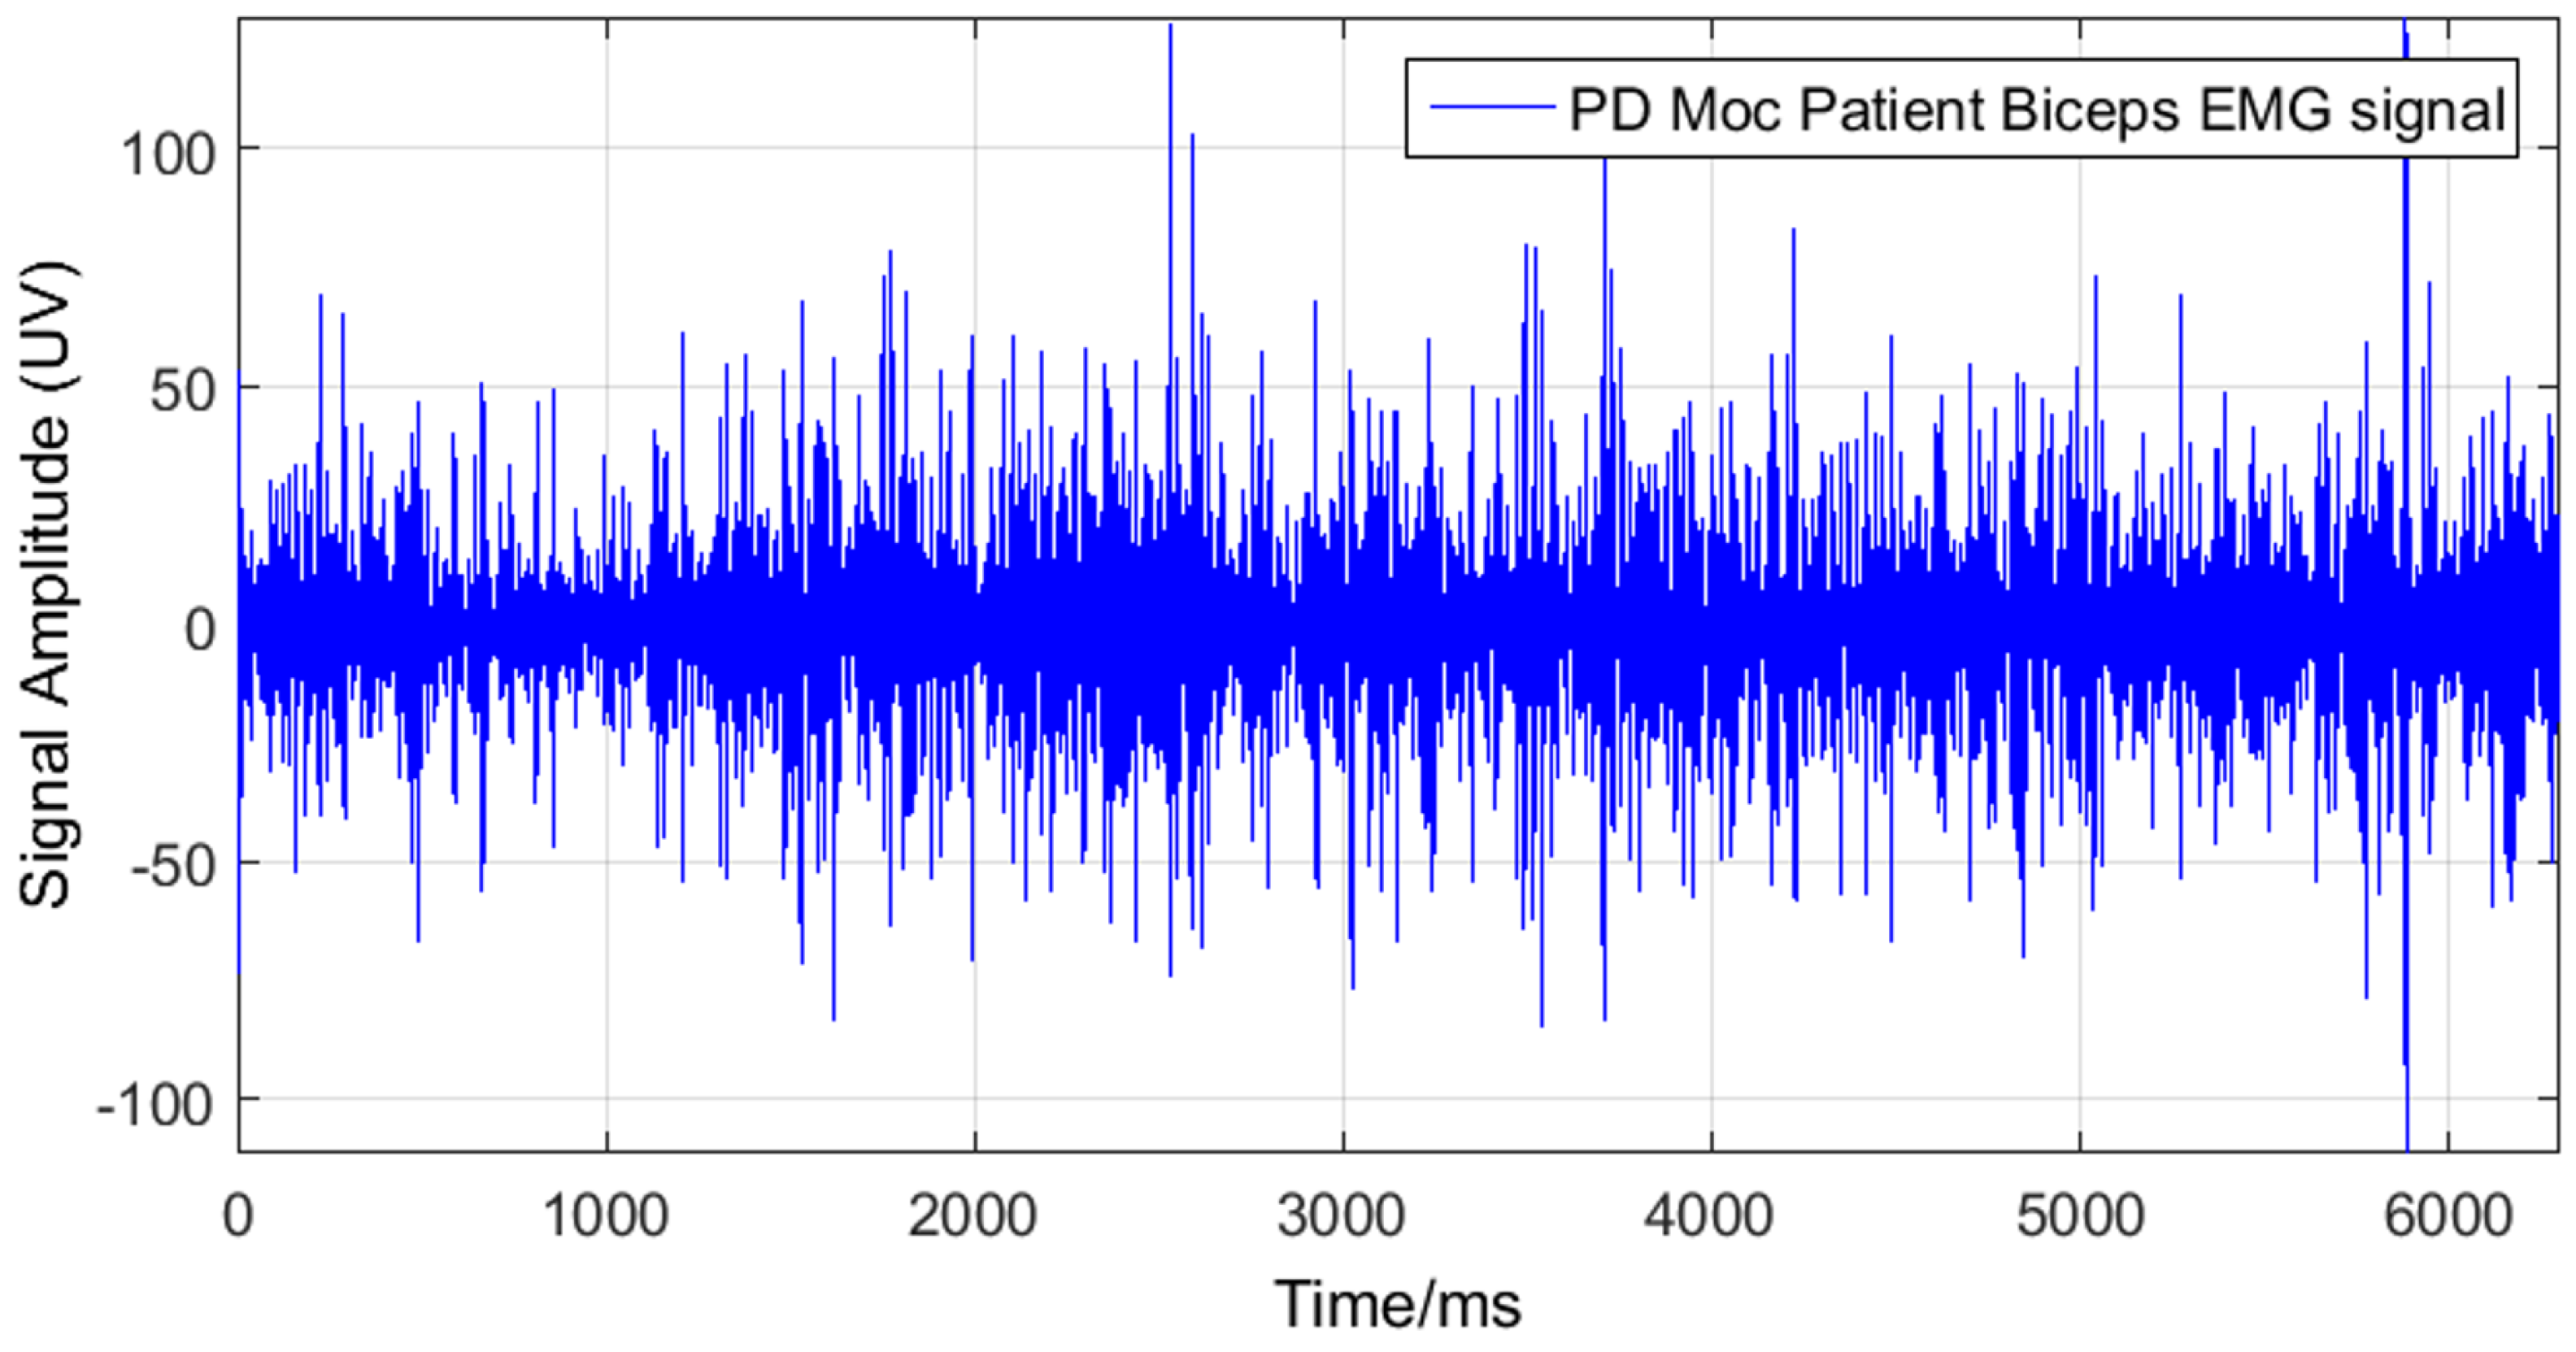
Figure 5,
Figure 6,
Figure 7 and
Figure 8 show that the pattern of bursts in processed EMG data calculated from forearm muscle, which is responsible for hand movement, of PD patient is more recognizable than healthy controls. Also, the EMG signal of PD patient has spikes, and is more affected by the pattern of bursts as compared to the healthy test person data. In addition, the EMG signal measured from the biceps brachii muscle shows some coherence with the acceleration signal in the case of PD patient.
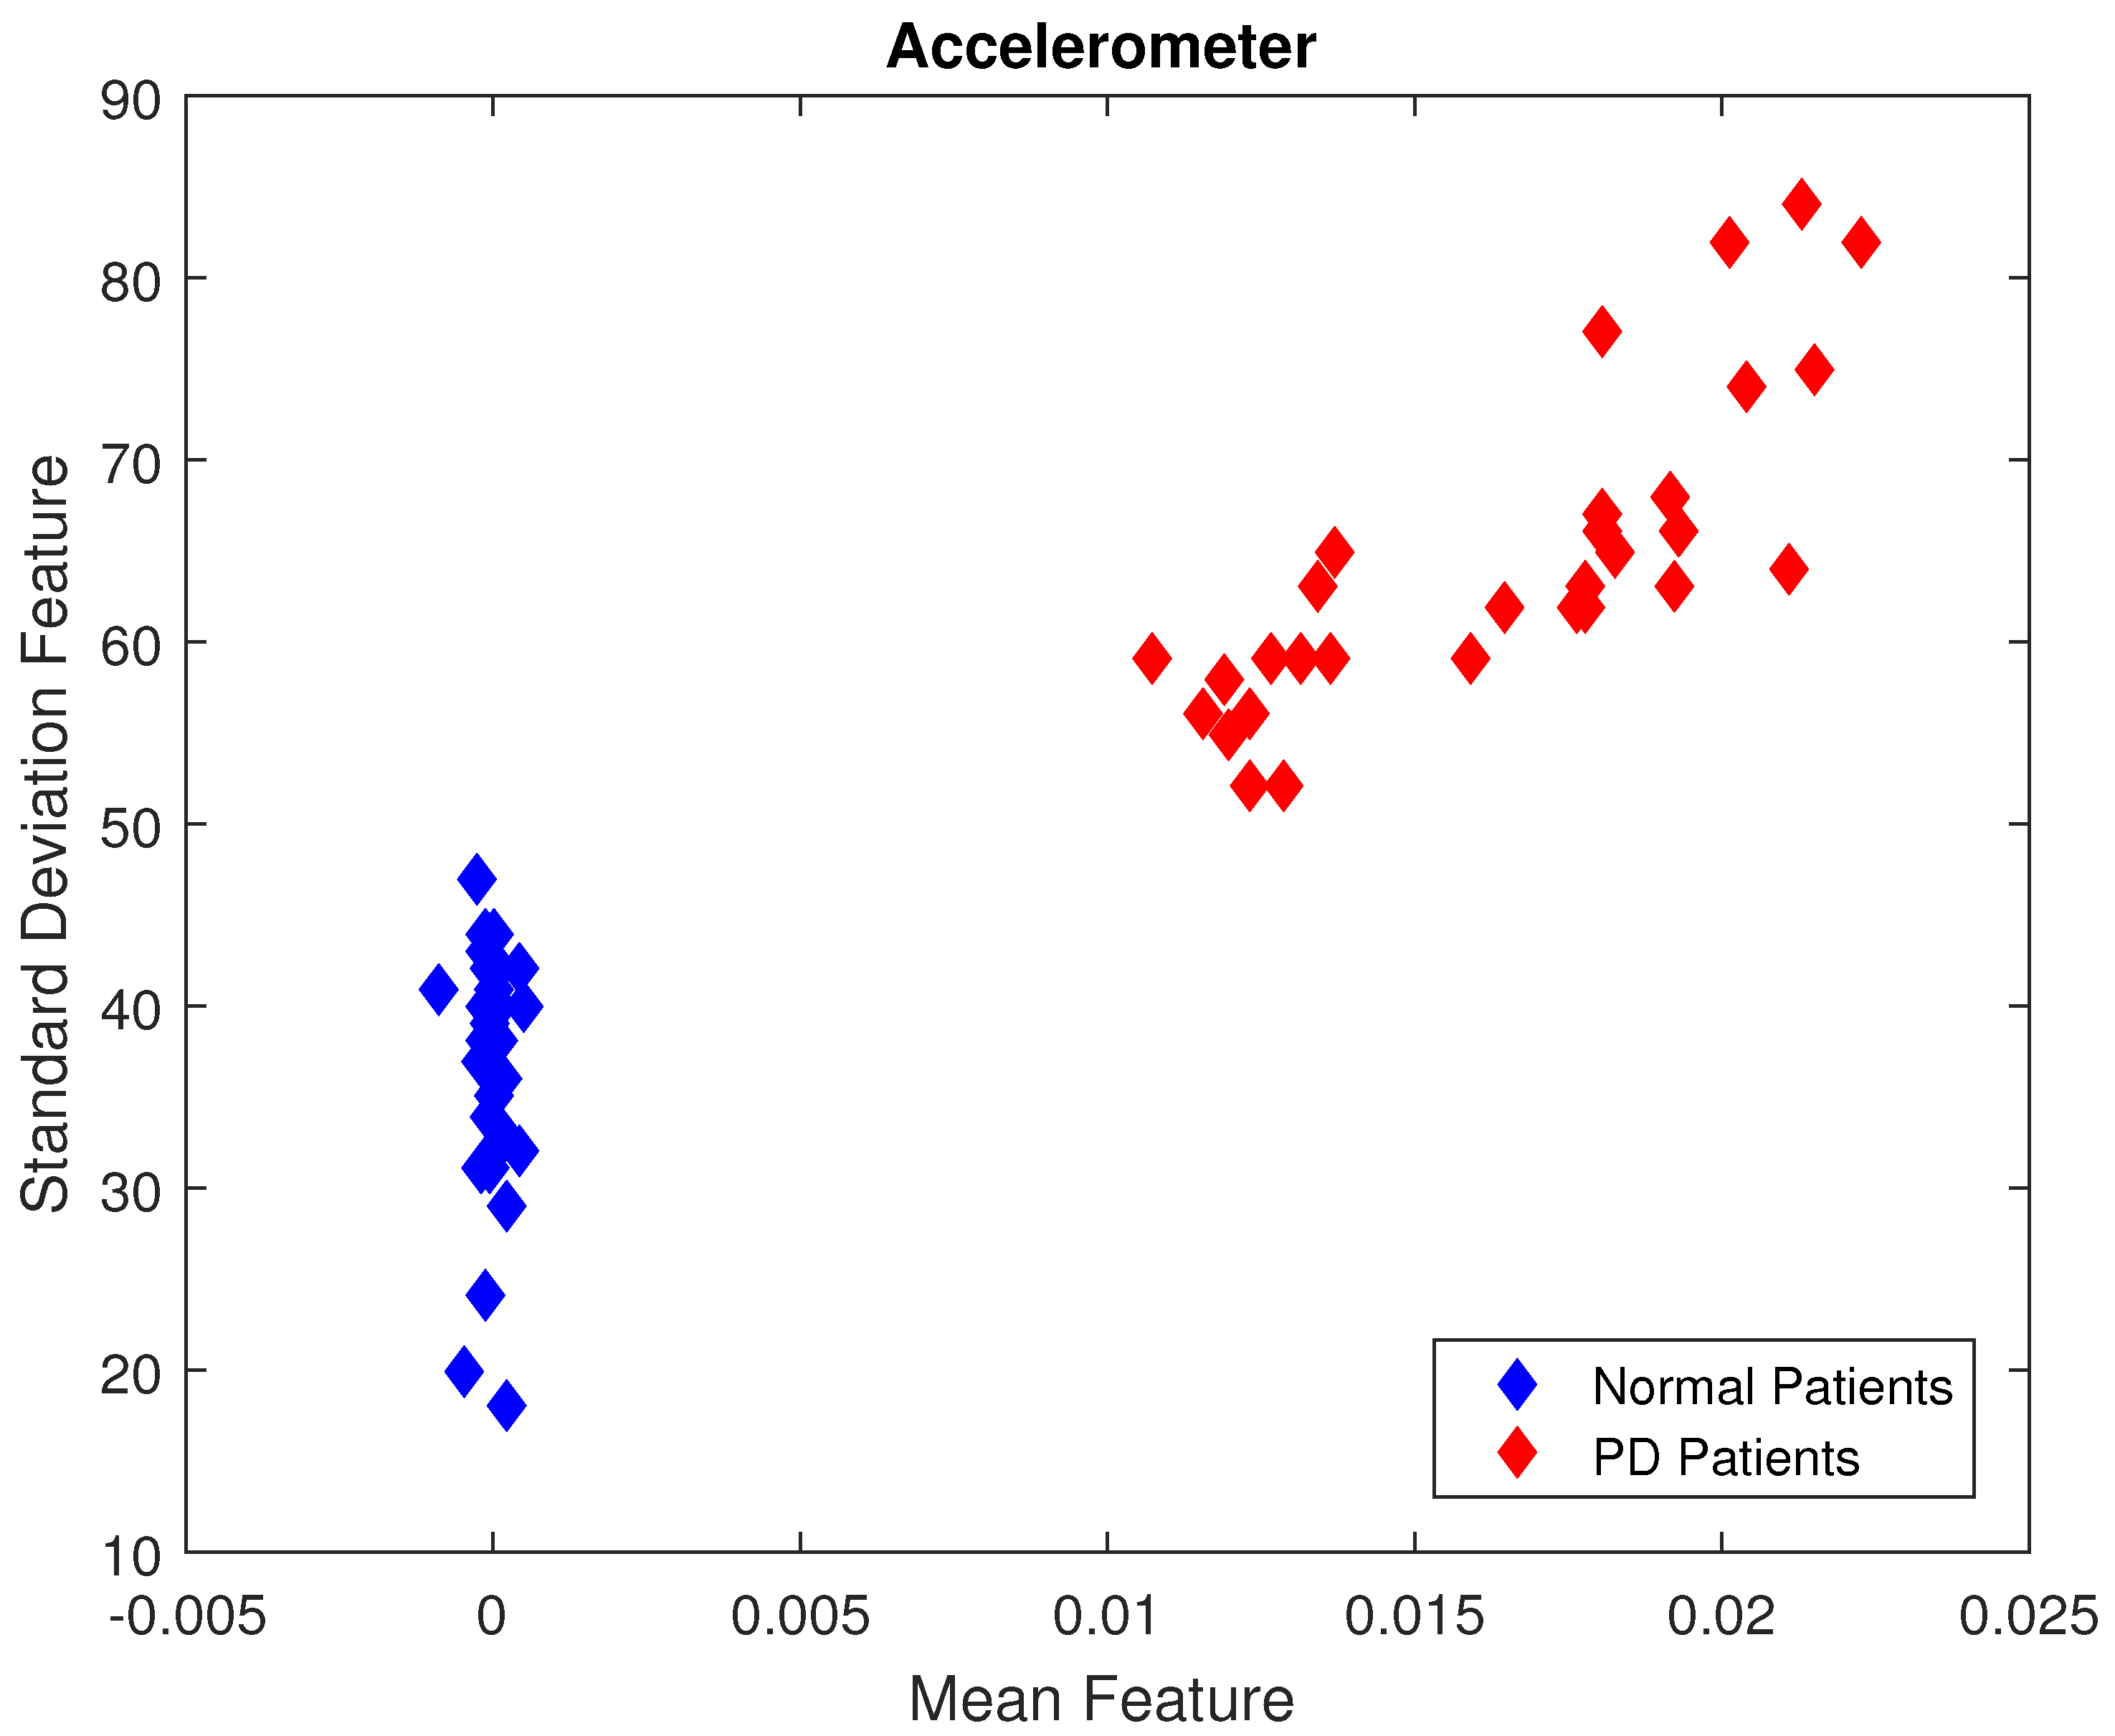
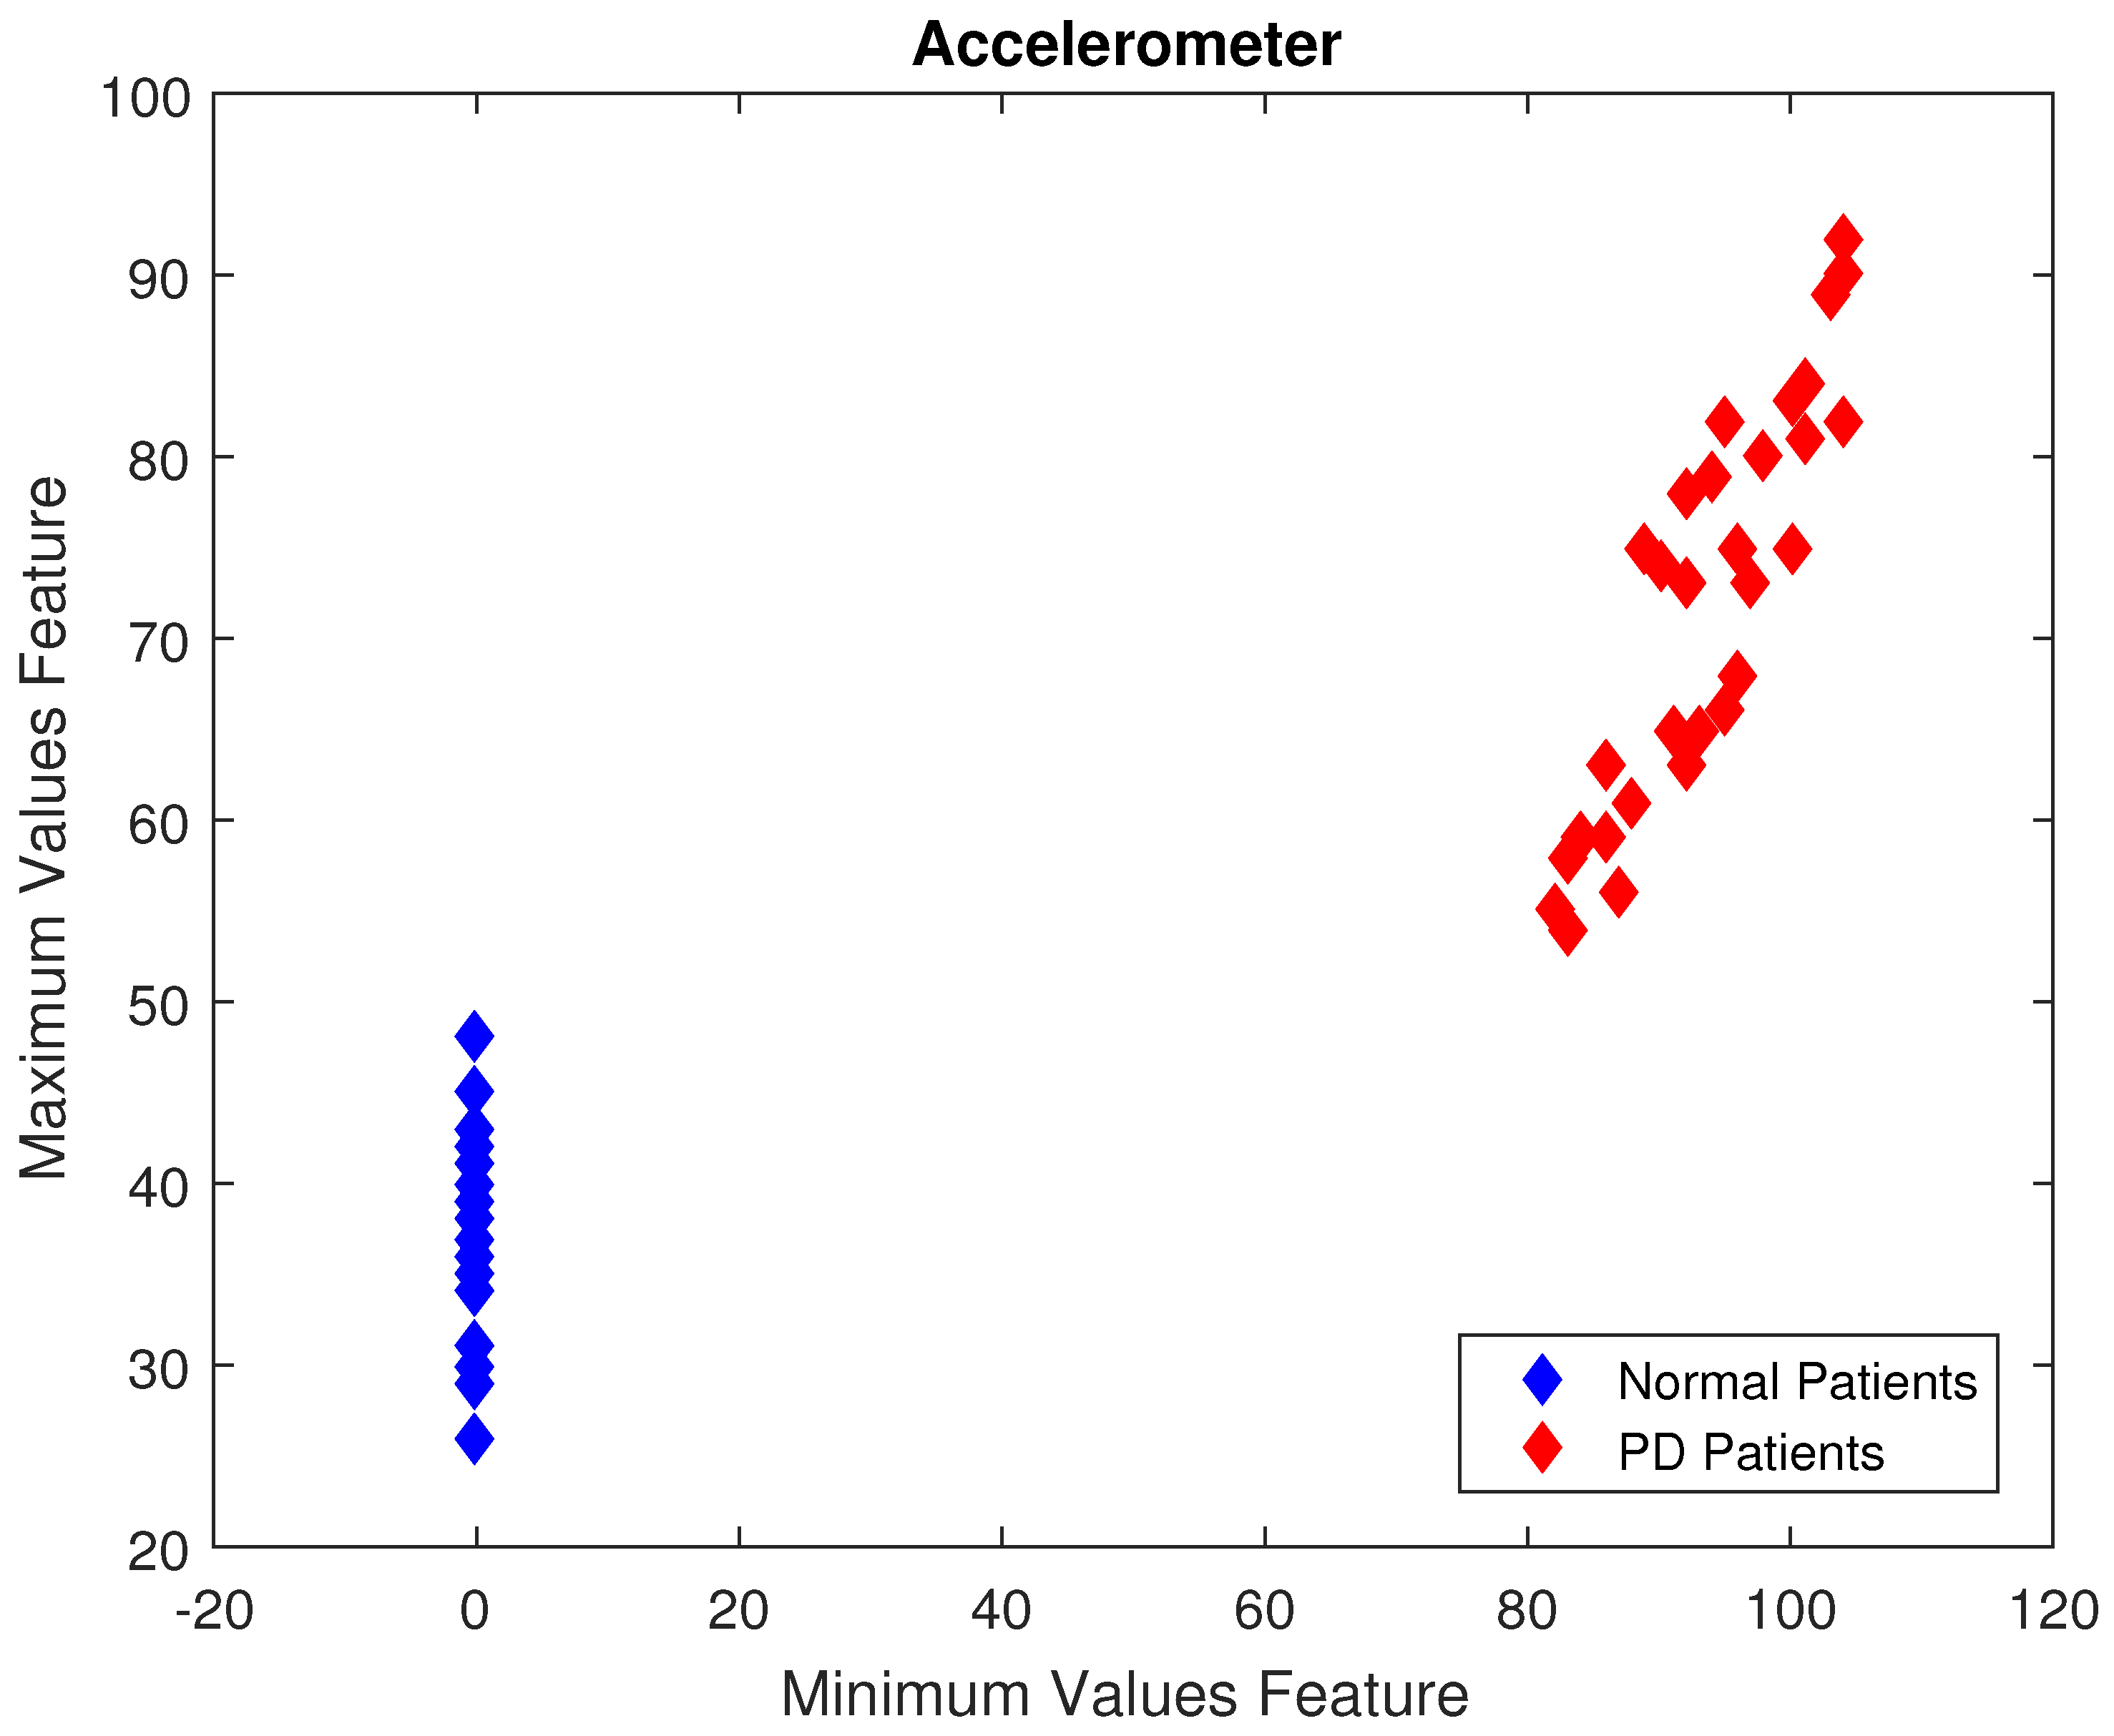
Figure 9 and
Figure 10 show two-dimensional scatter plots based on the feature vectors of wrist accelerometer data for normal and PD patients.
Figure 9 represents the standard diviation versus the mean of accelerometer data for normal and PD patient classes.
Figure 10 represents the maximum value features versus minimum value features of accelerometer data also for normal and PD patient classes. As, can be seen, both figures show good separation between the two classes.
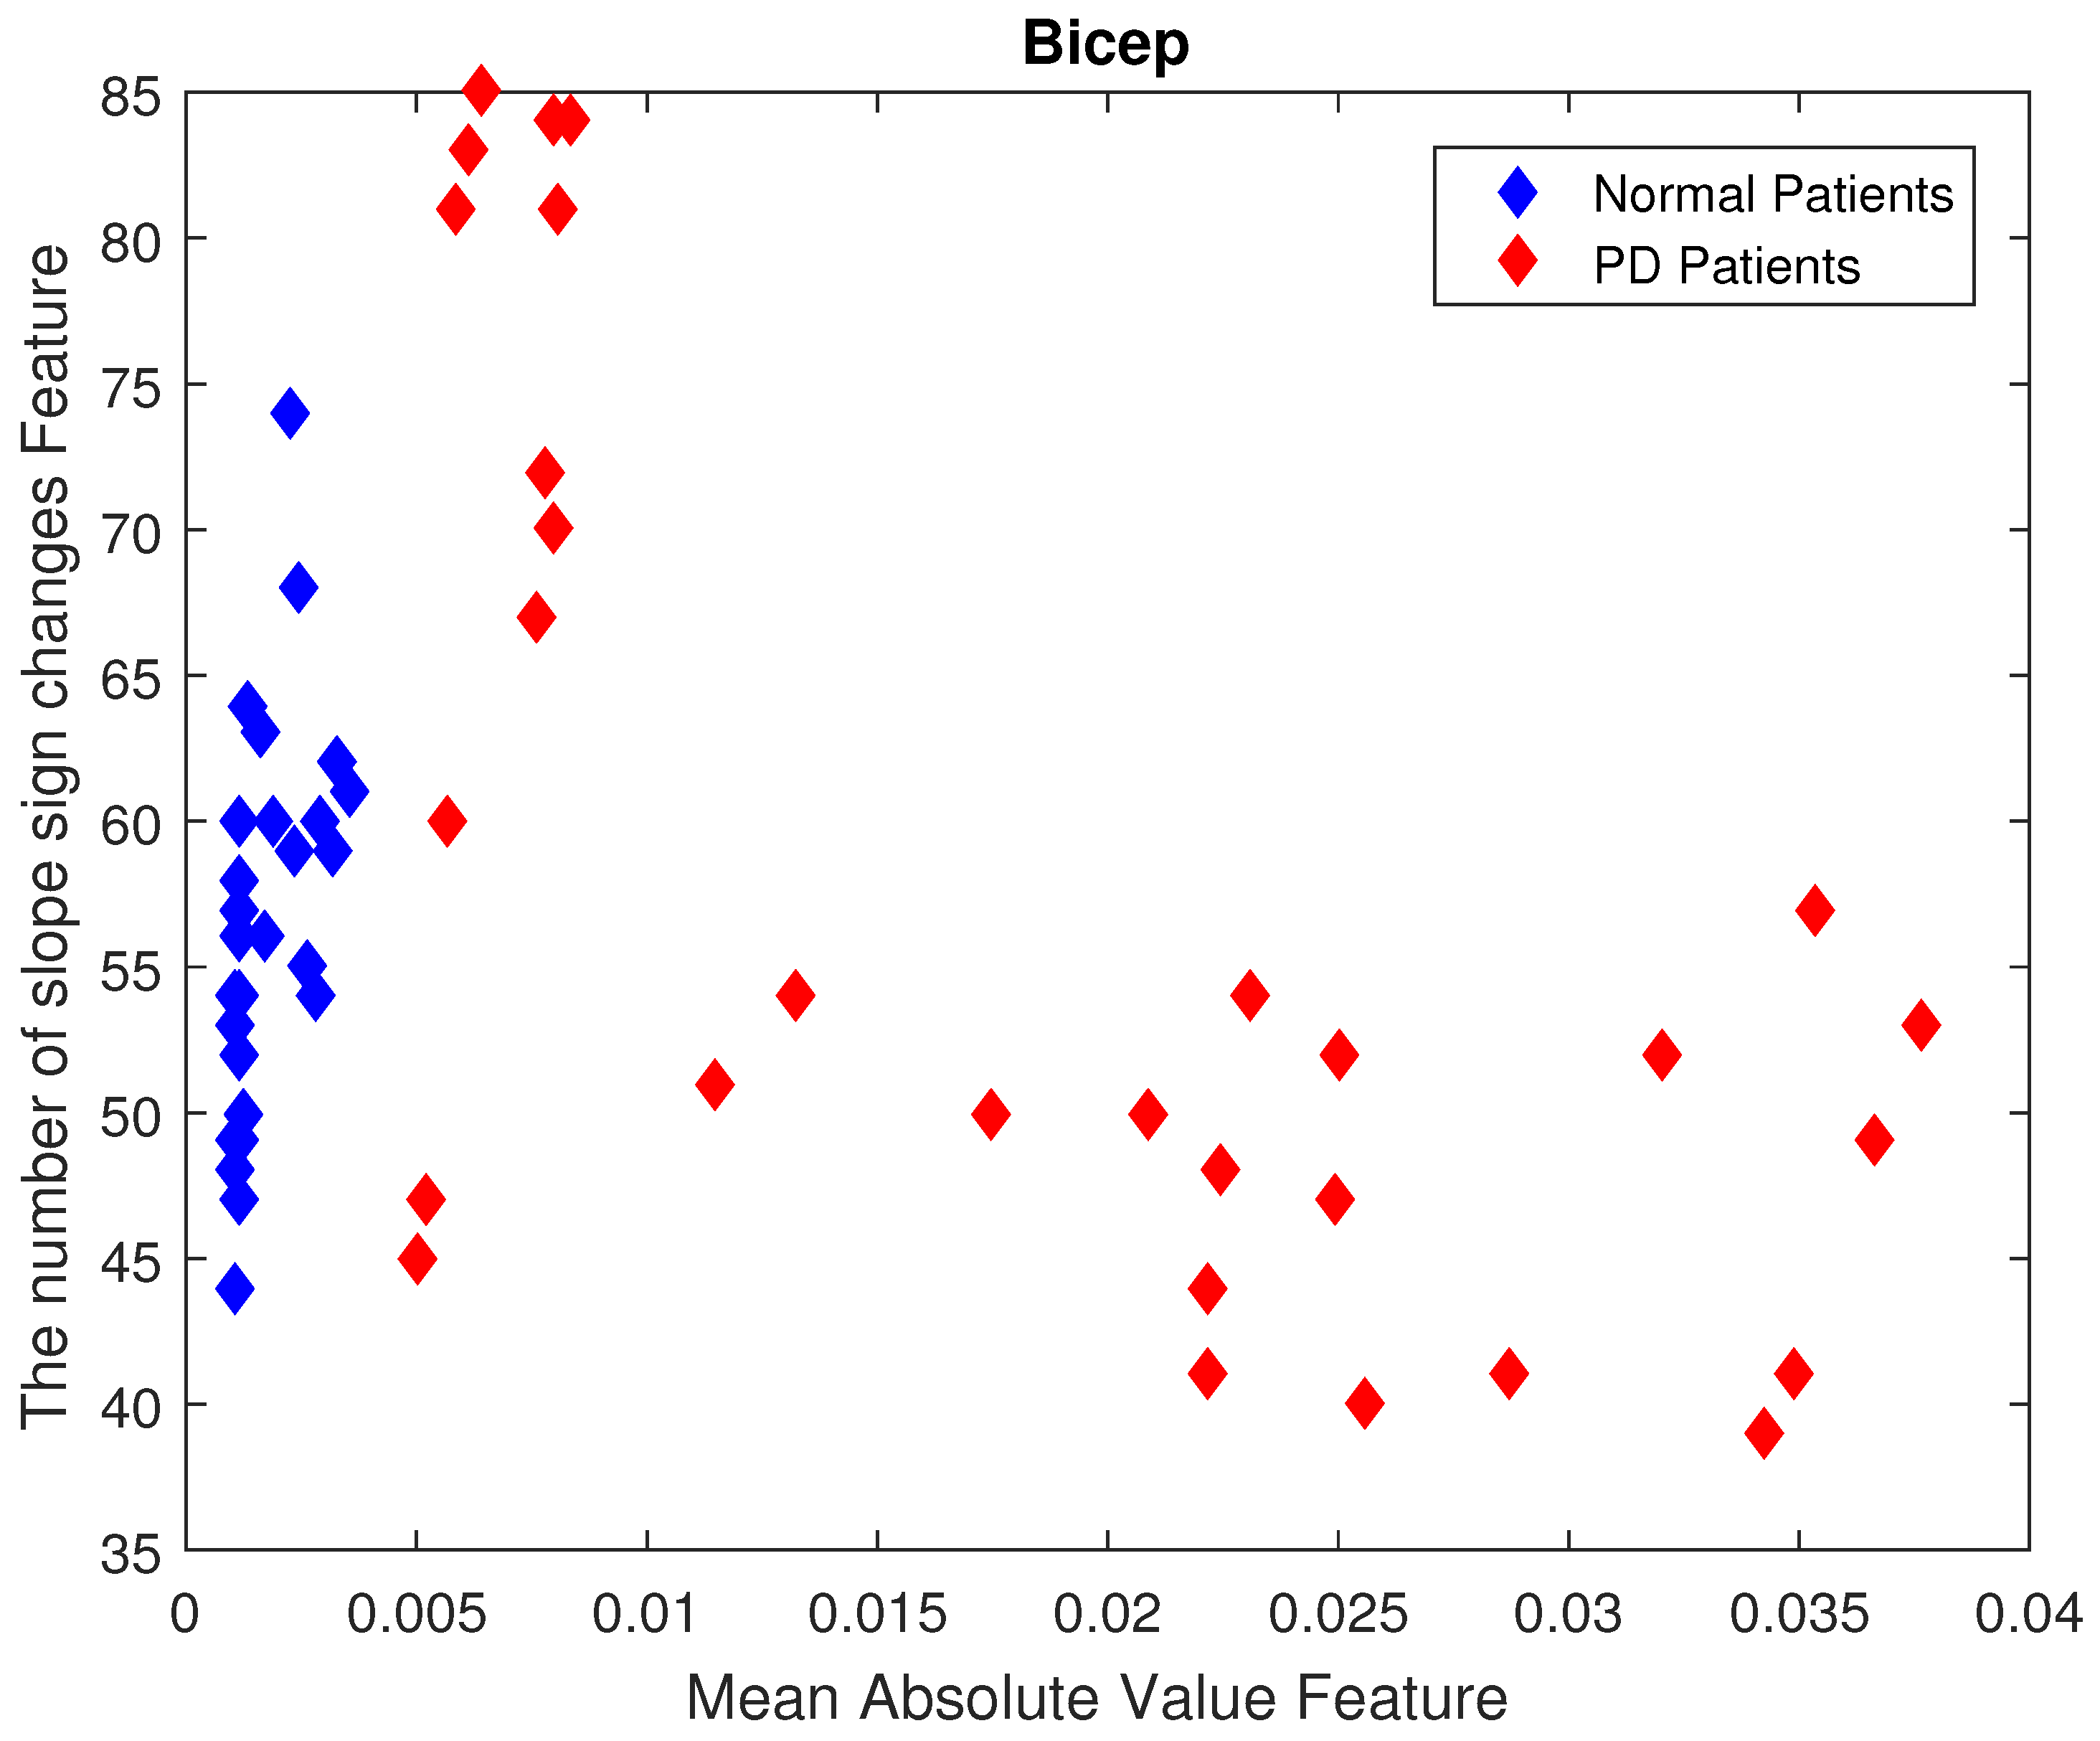
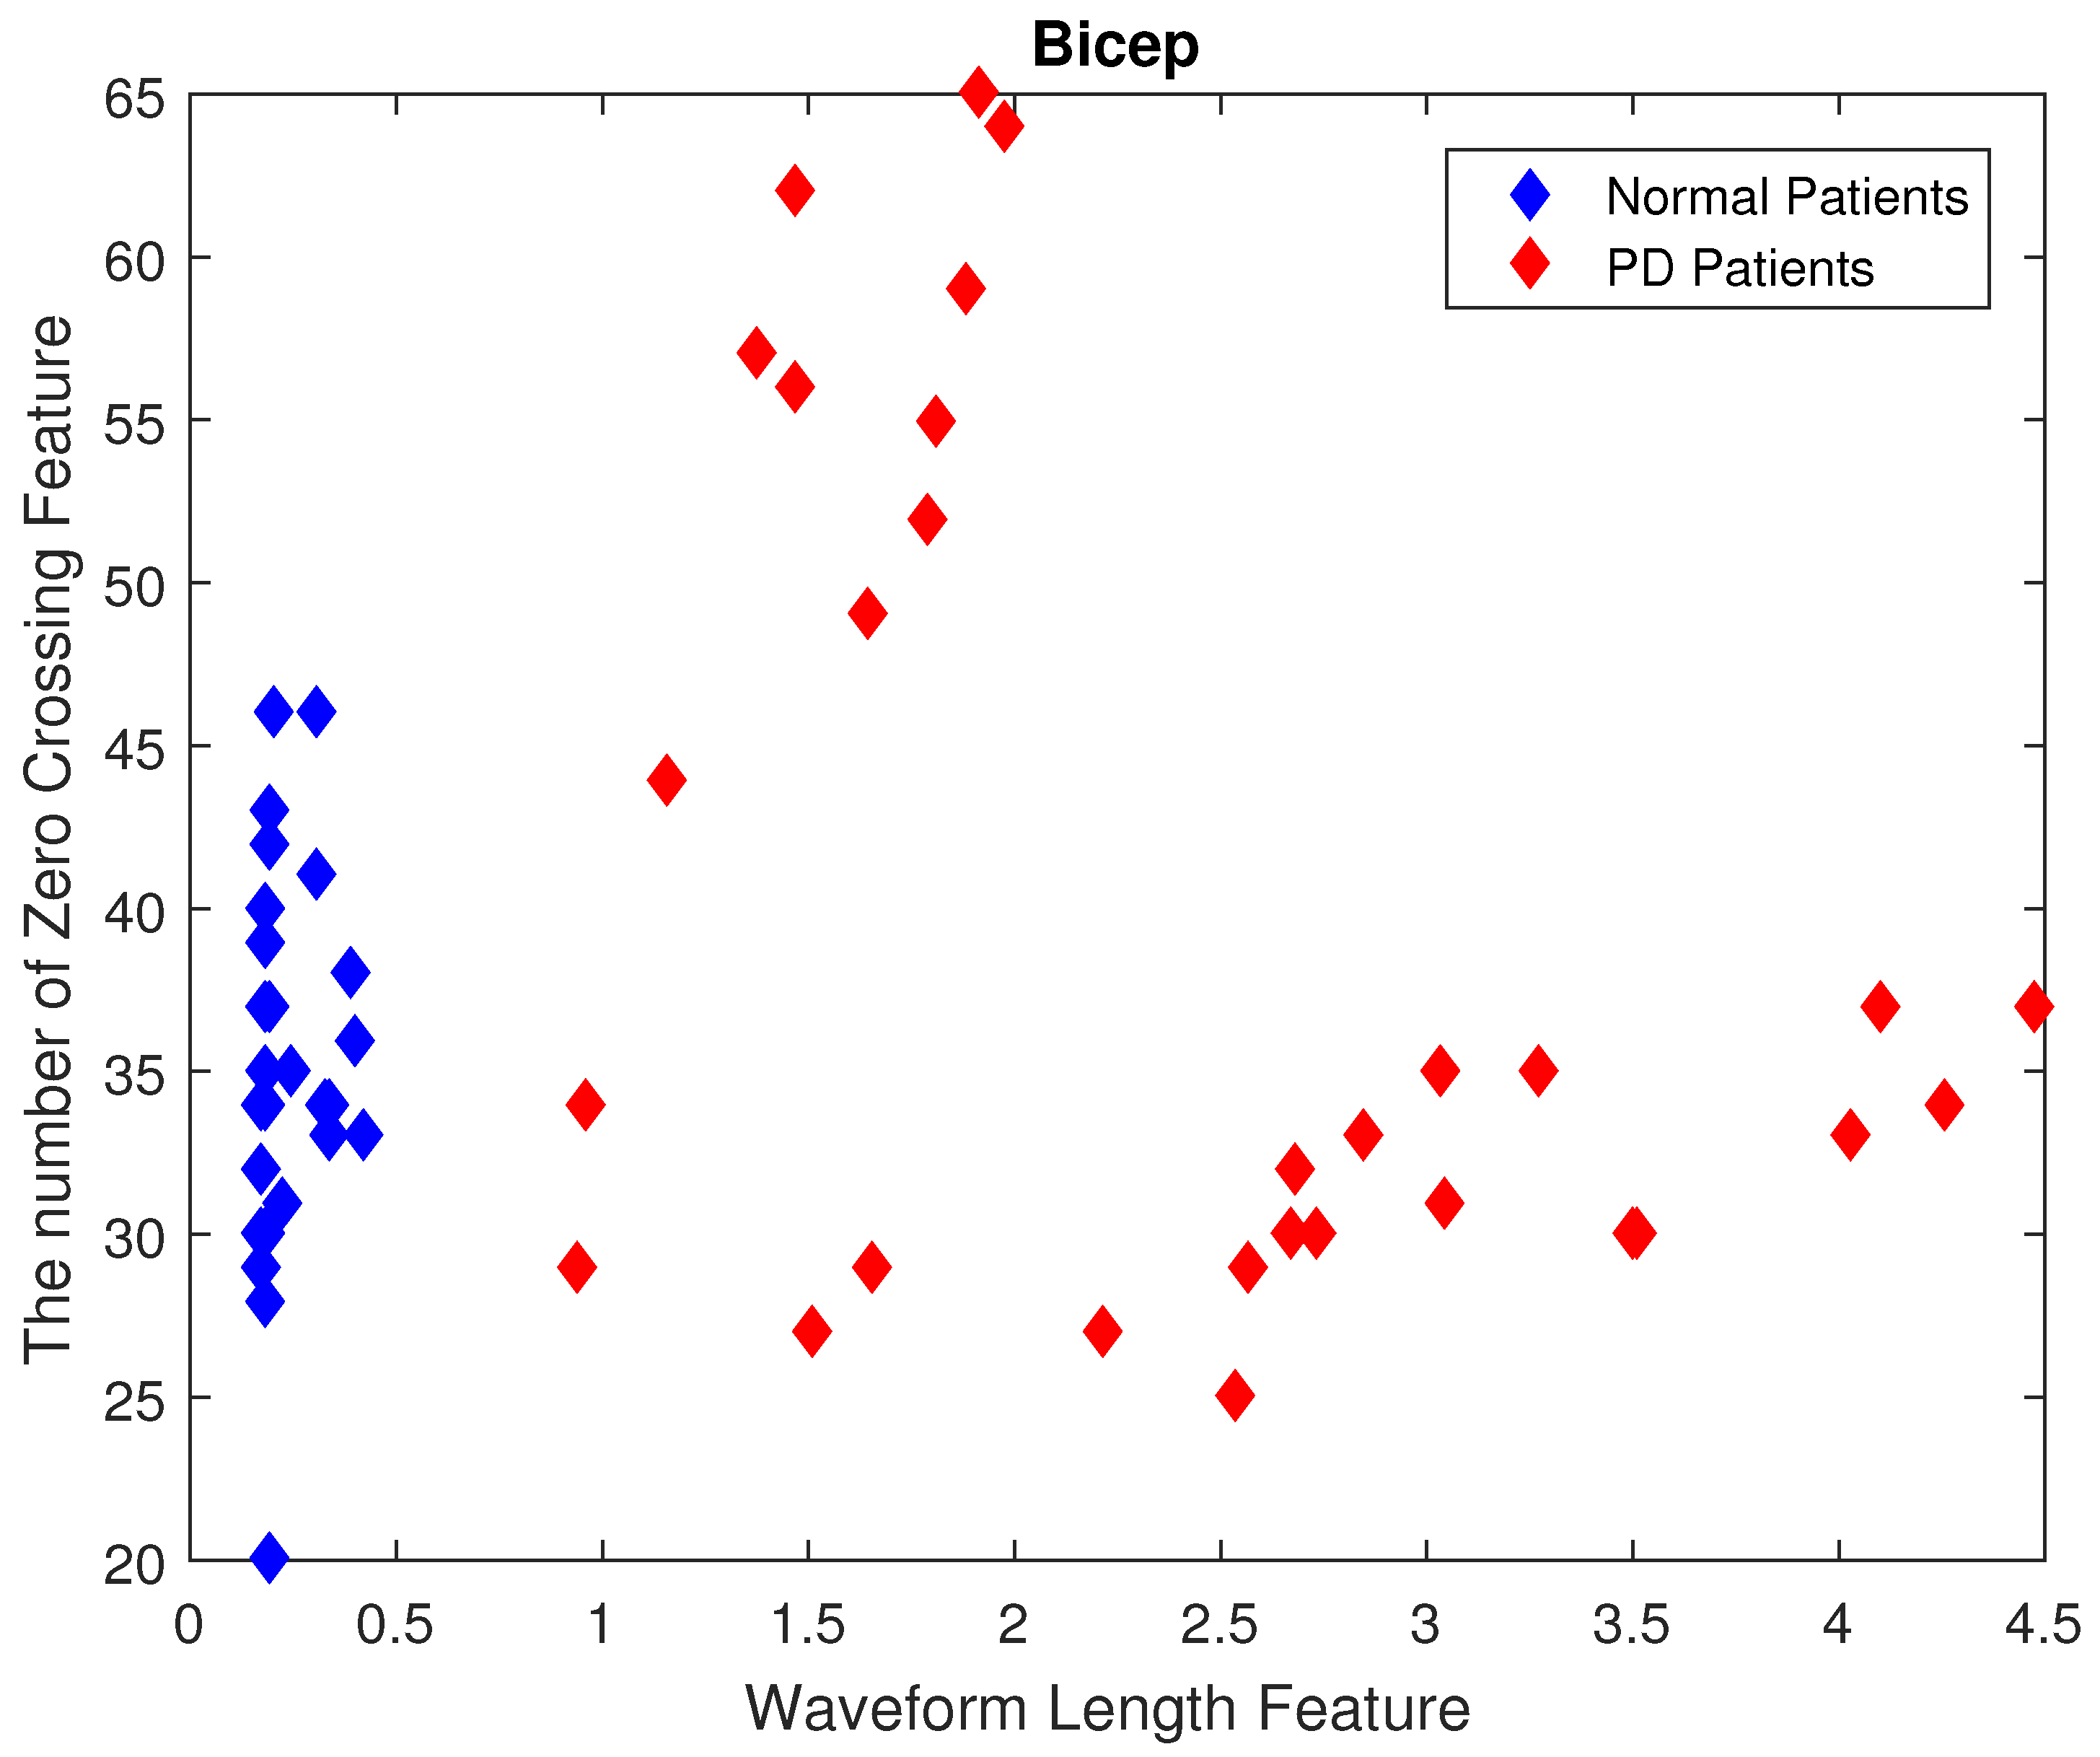
Figure 11 and
Figure 12 show two-dimensional scatter plots based on the feature vectors of the biceps brachii muscle, and
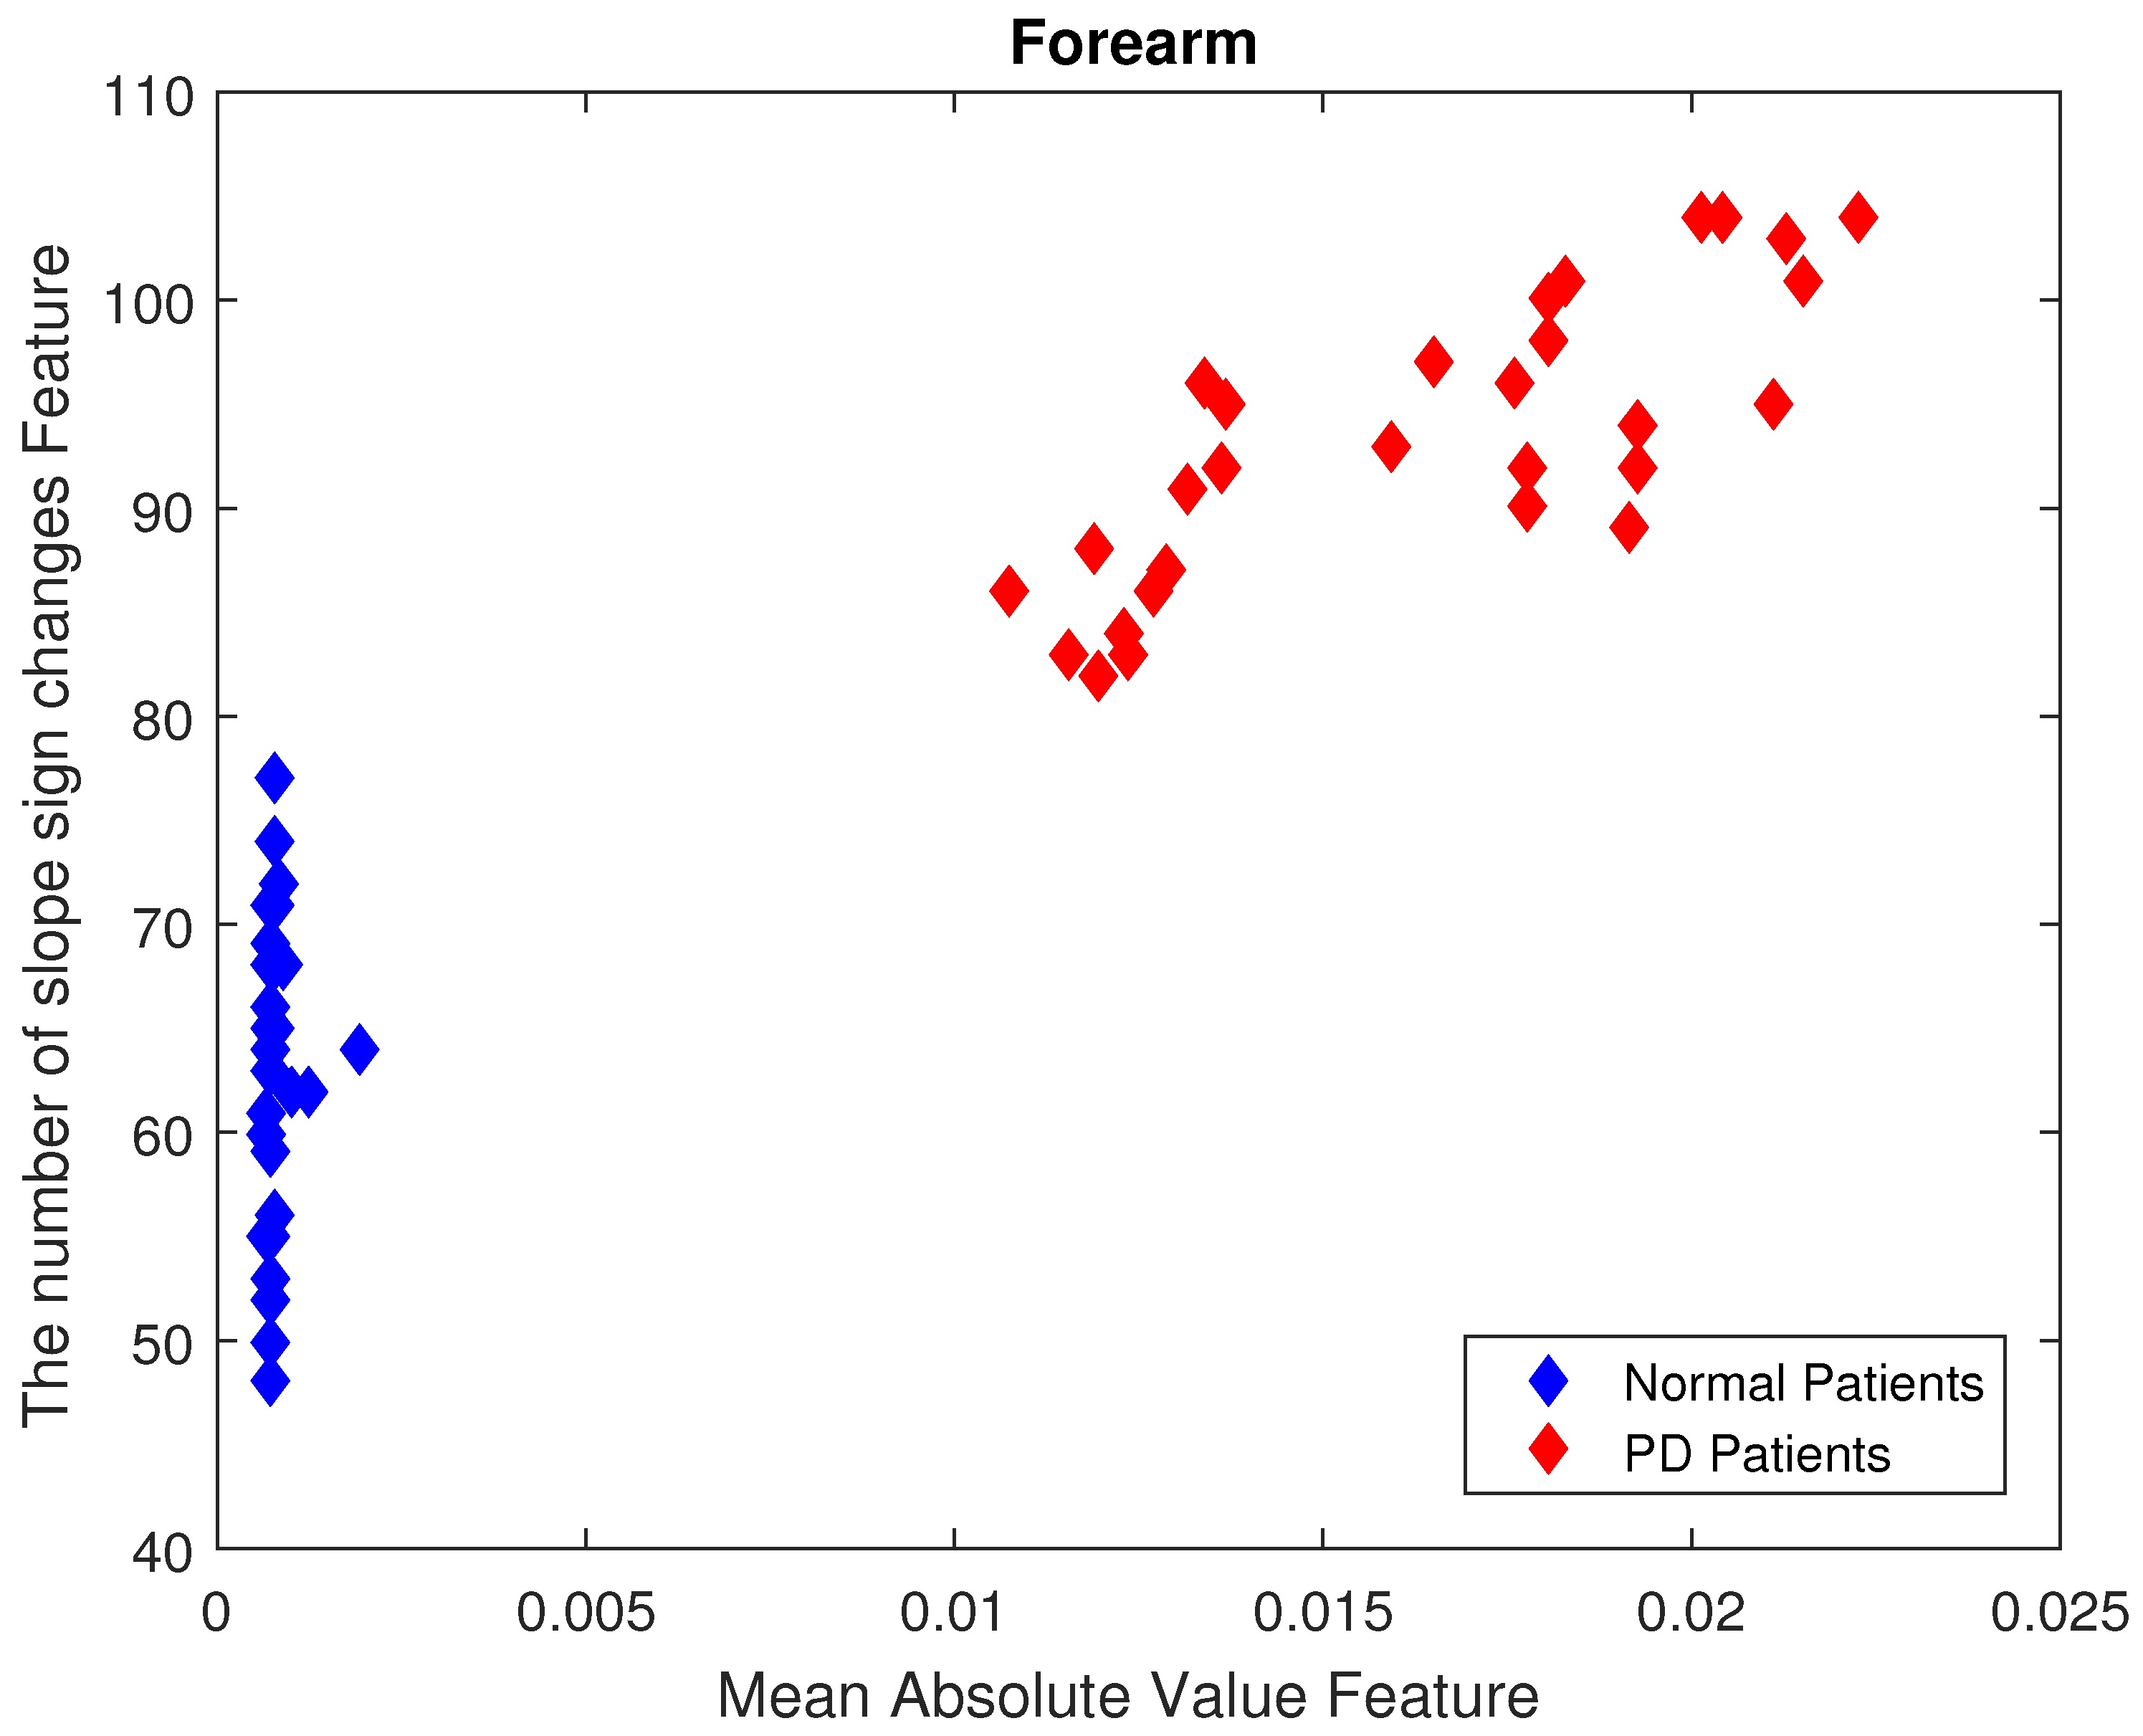
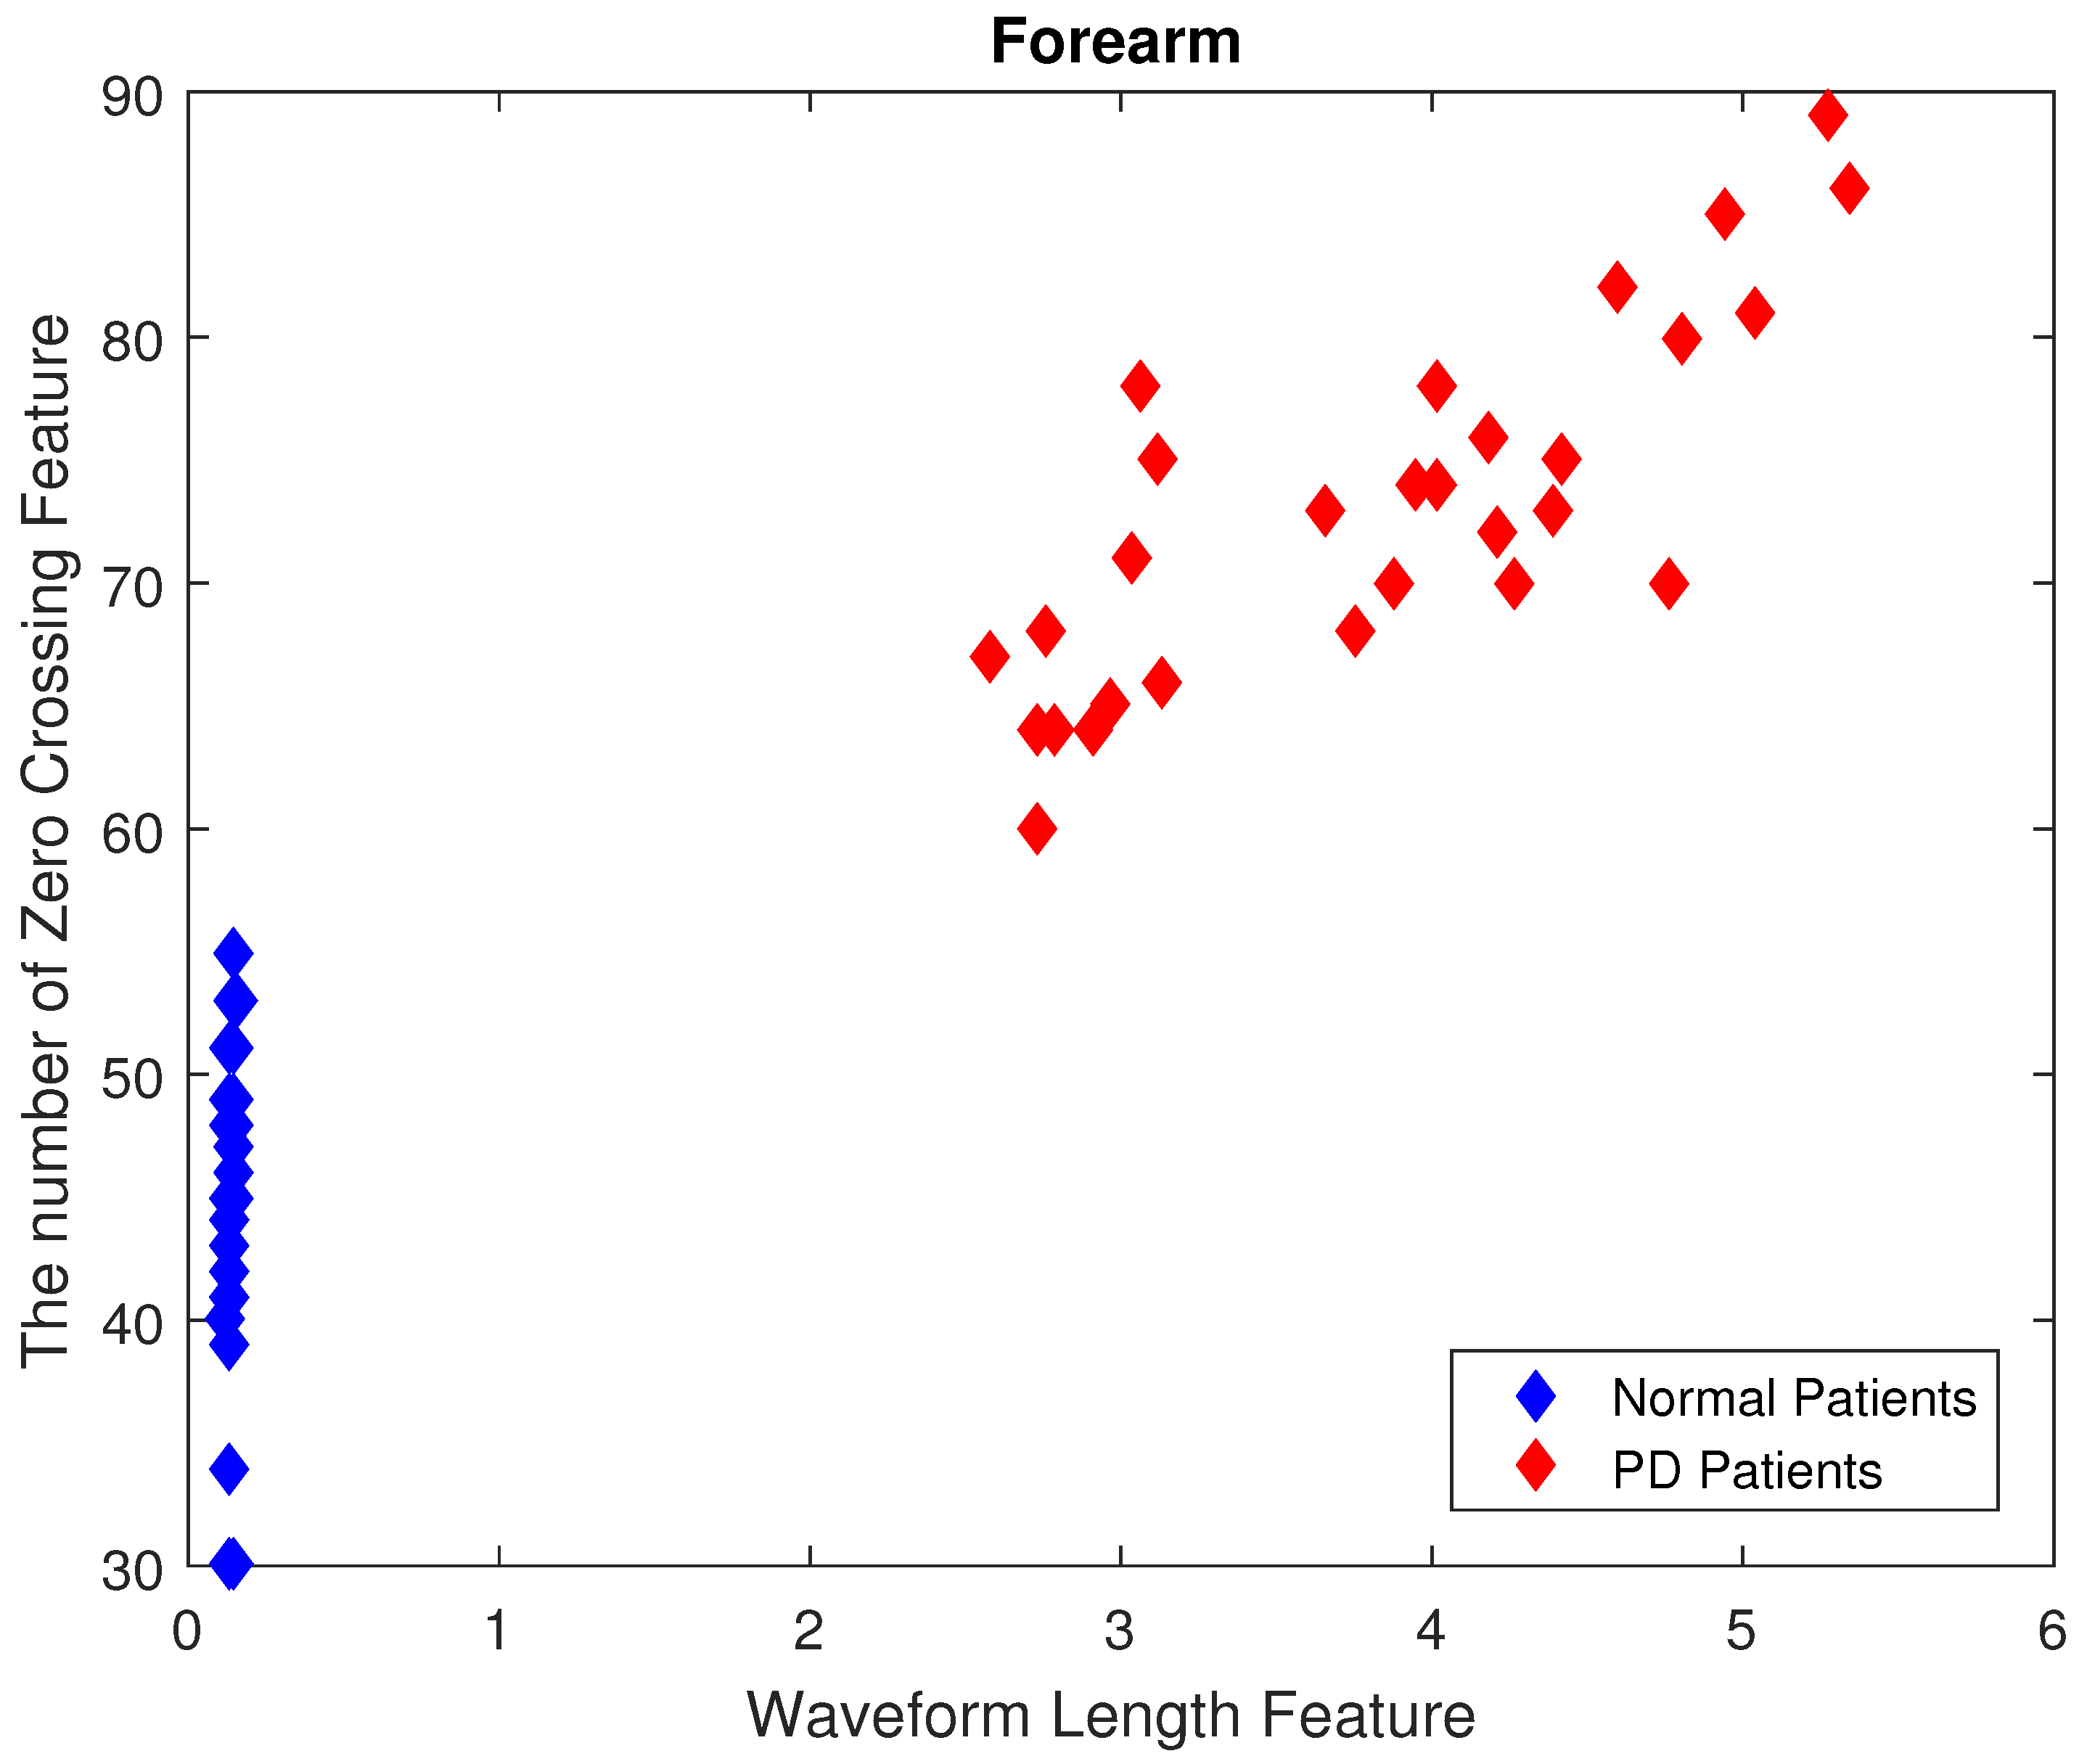
Figure 13 and
Figure 14 show the corresponding scatter-plots for the forearm muscle. Both
Figure 11 and
Figure 13 represent the two-dimensional scatter-plots of the number of SSC versus MAV of the processed sEMG data of the biceps brachii and forearm muscles, respectively. As, can be visually inspected, the forearm muscle has a better class seperability between normal and PD patients compared to the biceps brachii muscle. On the other hand,
Figure 12 and
Figure 14 represent the two-dimensional scatter-plots of the ZC versus WL of preprocessed sEMG data of the biceps brachii and forearm muscles, respectively. Also, the forearm muscle shows a better discrimination between the normal and PD patient classes.
To test the performance of the proposed approach and compare the results to the relevant approaches reported in the literature, several machine leaning classifiers were constructed.
As it is hard to compare absolute achieved accuracies for different datasets and scenarios, in our work we investigated two measurement sets. The first set included a sEMG attached to the biceps brachii muscle and an accelerometer attached to the Palmer wrist as in [
8], and the second set, our proposed measurement set, included a sEMG attached to the forearm and an accelerometer attached to the Palmer wrist. Furthermore, in our results we compared the classification accuracies of four different scenarios namely, sEMG attached to the biceps brachii muscle, sEMG attached to the forearm as proposed by Loconsole et al. [
9], sEMG attached to the biceps brachii muscle combined with an accelerometer attached to the Palmer wrist as proposed by Rissanen et al. [
8], and our proposed set of a sEMG attached to the forearm combined with an accelerometer attached to the Palmer wrist.
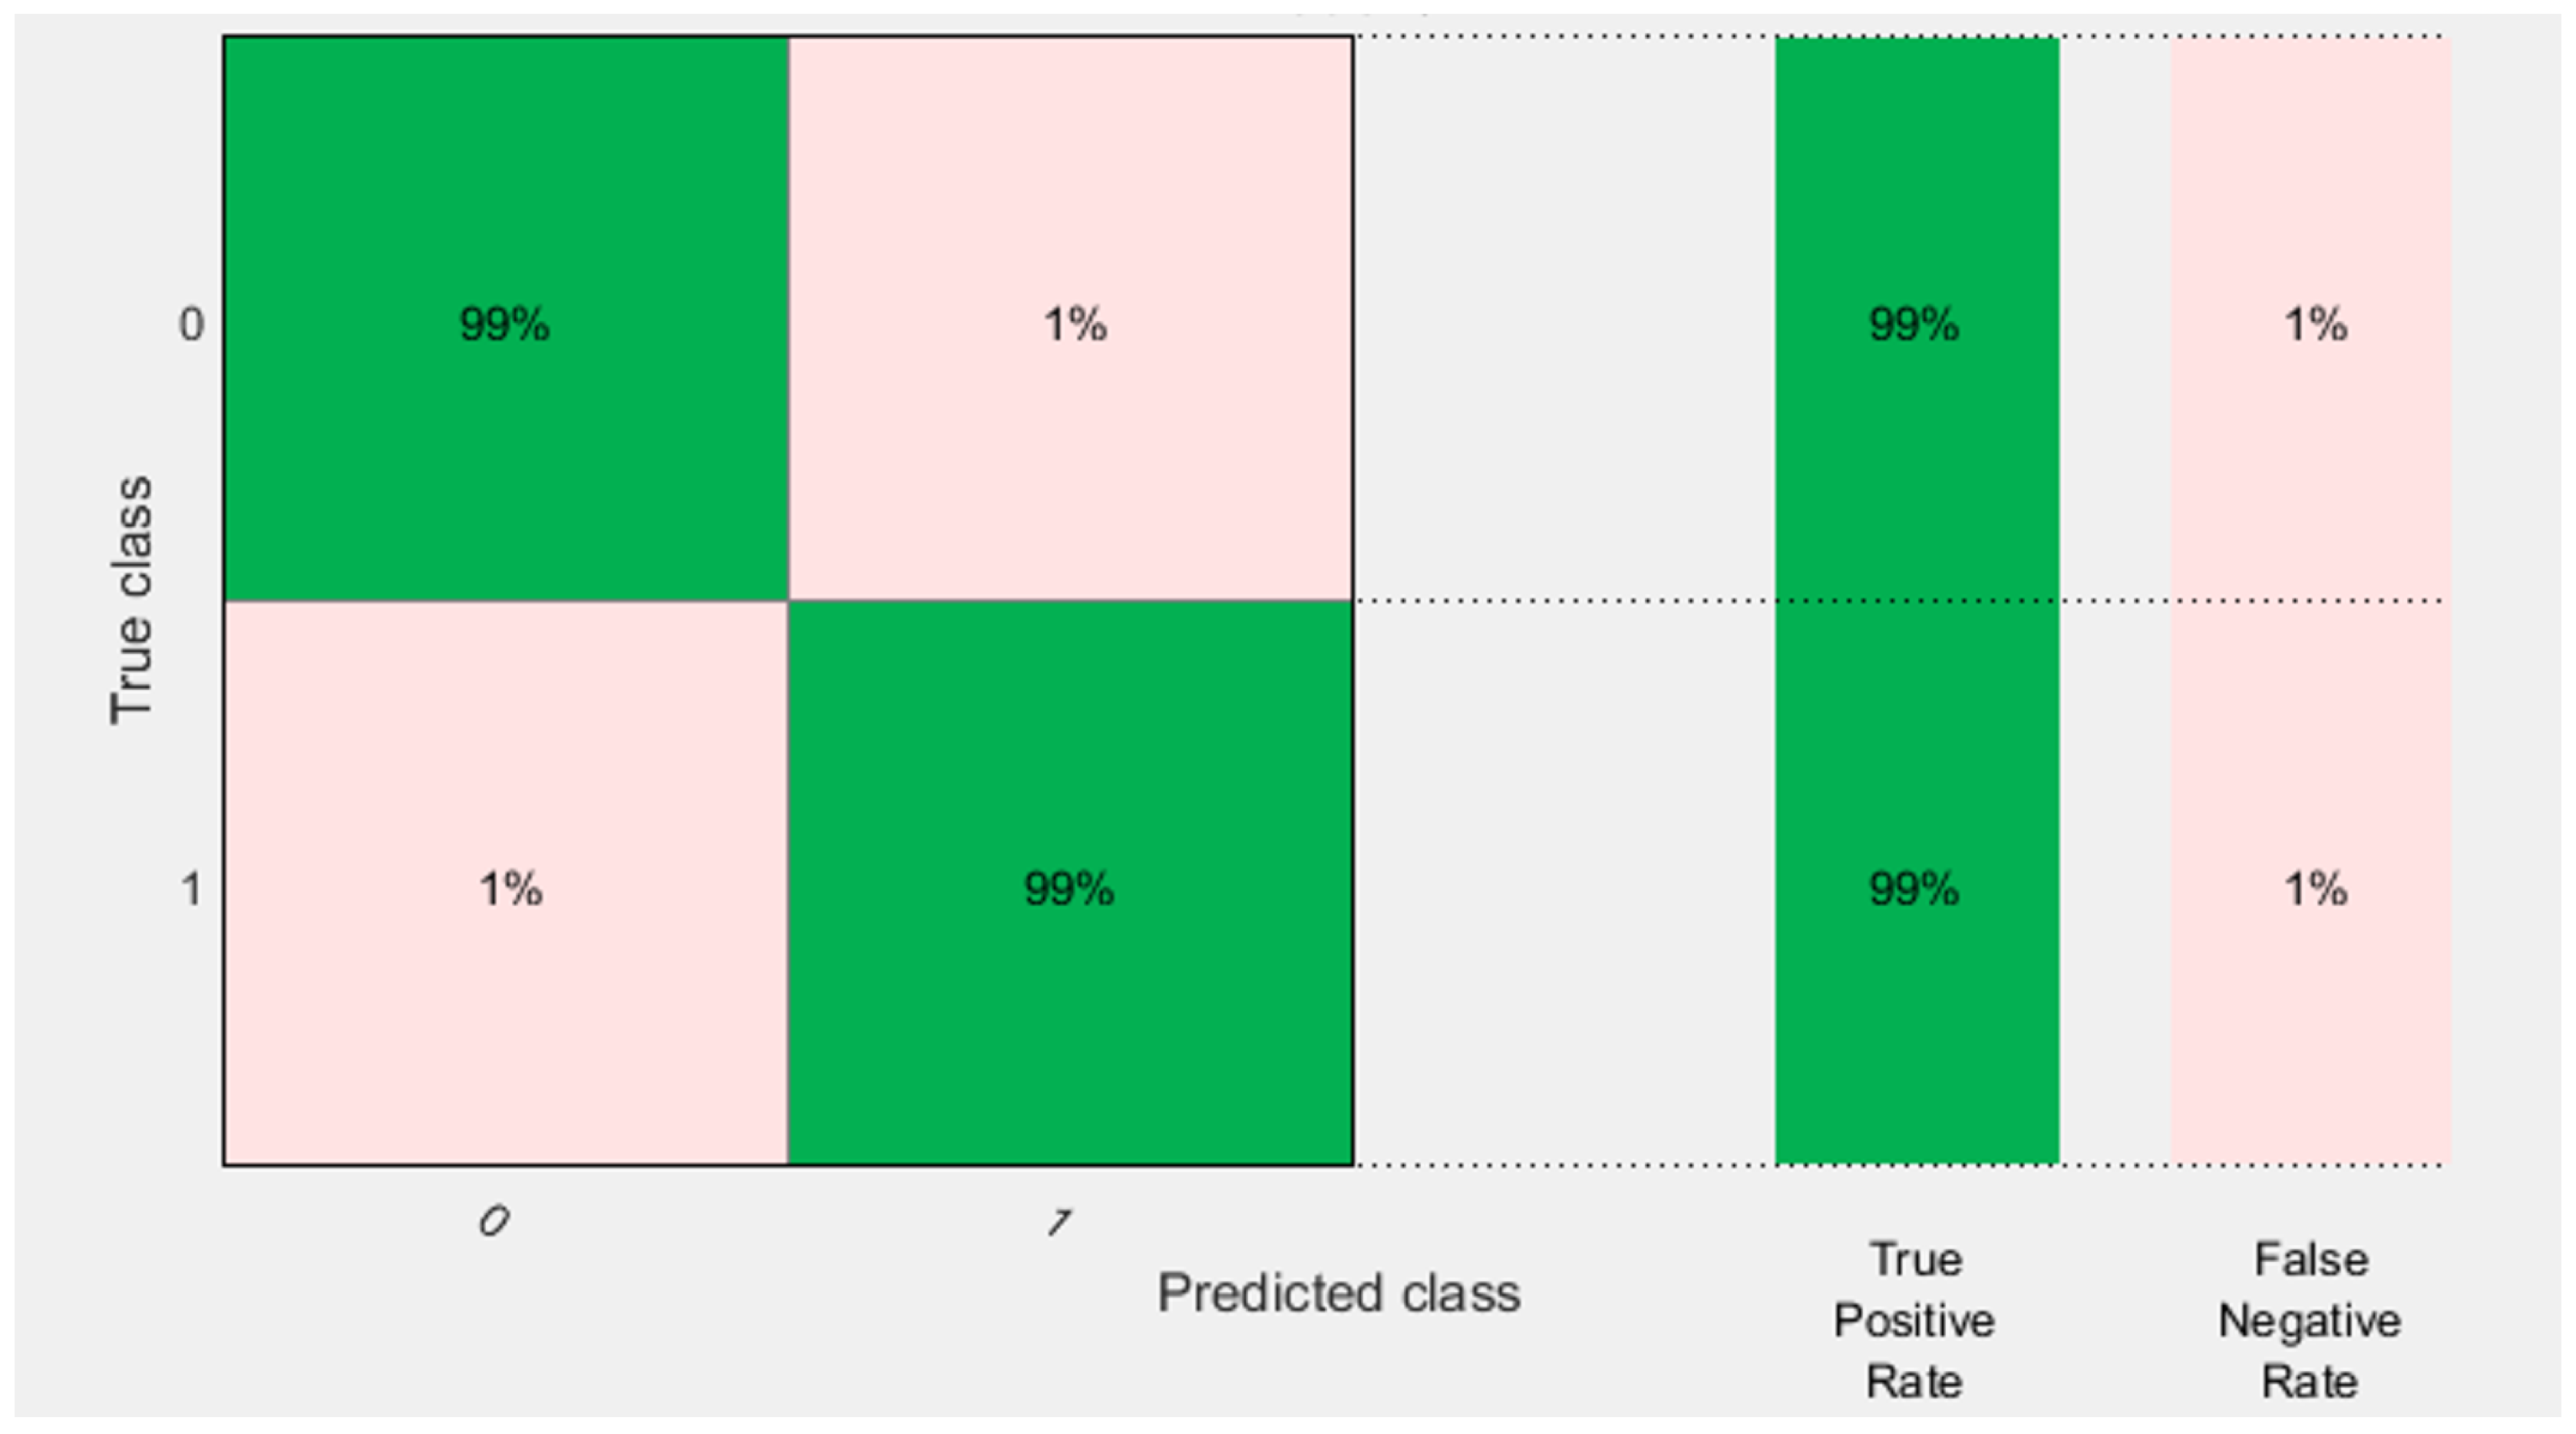
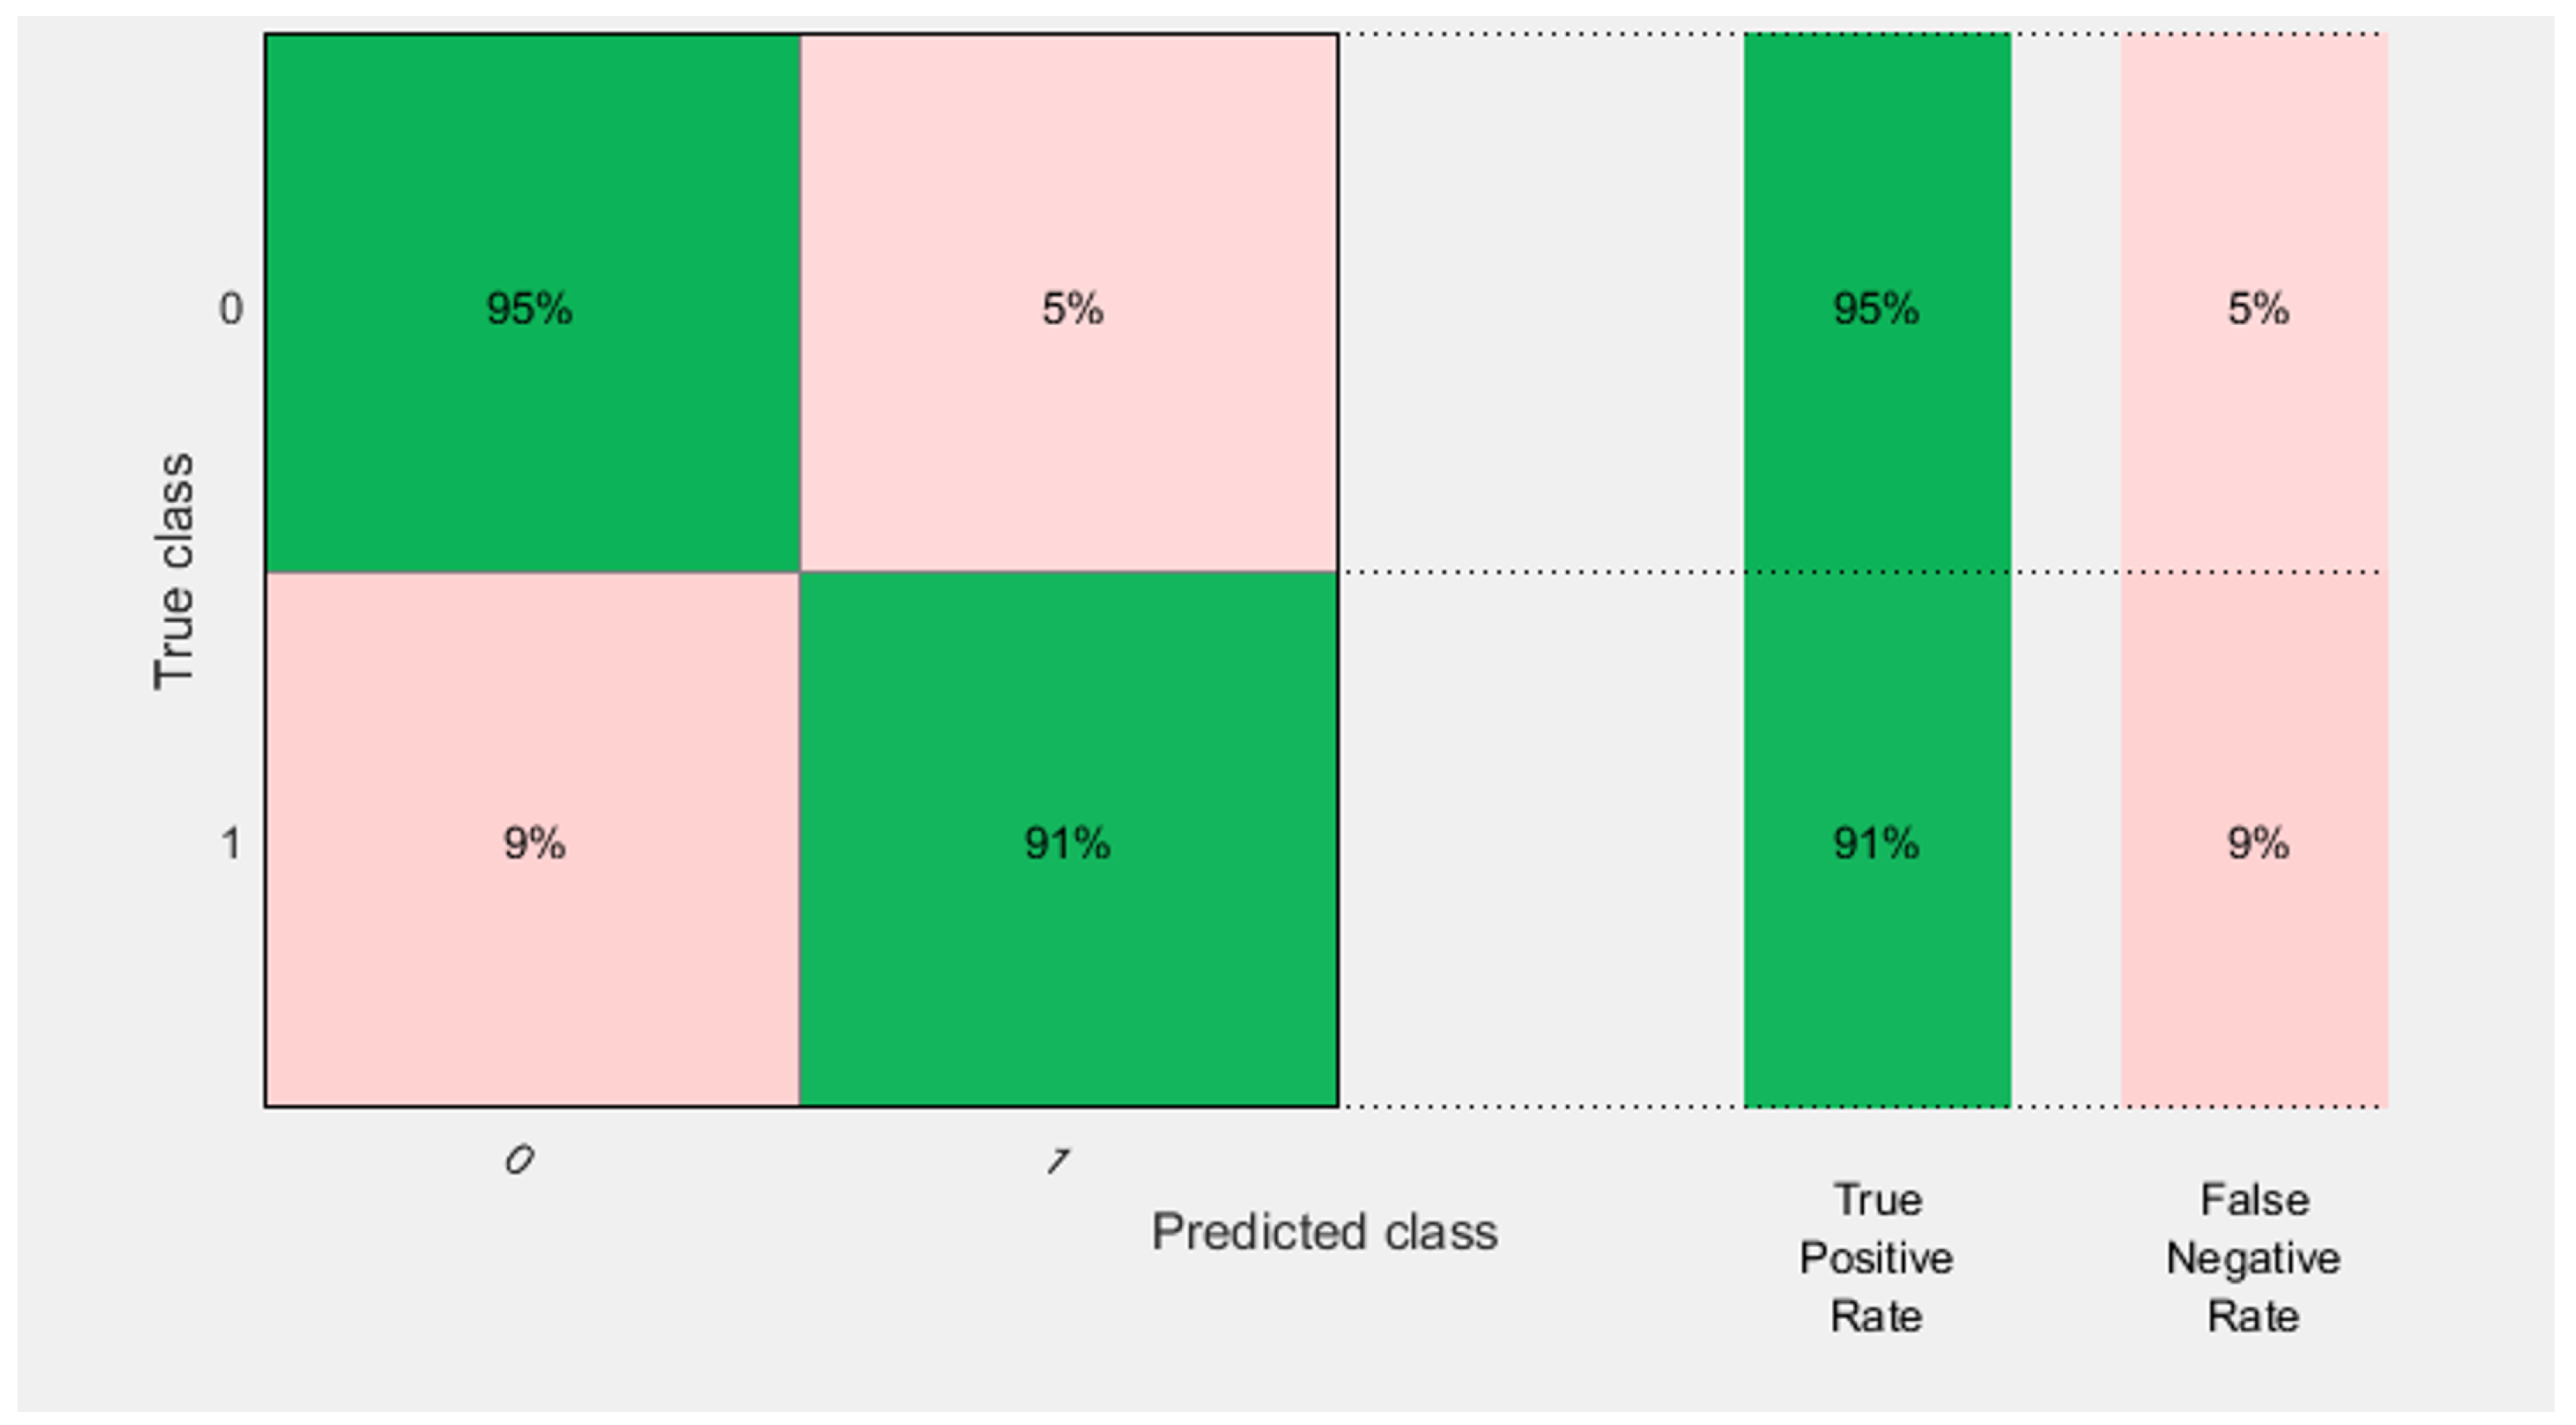
Table 3 shows that the processed EMG data extracted from the forearm muscle was capable to differentiate between healthy and PD patients. This is clear as the KNN achieved a classification accuracy of 98.6% which is higher than the 89.8% of the processed EMG data taken from biceps muscle. Moreover, when constructing the ensemble classifiers using the EMG data extracted from the forearm muscle using bagged decision tree classifier, the classifications accuracy has slightly increased to 98.8%, which is greater than the 93.1% of the processed EMG data taken from biceps brachii muscle.
Figure 15 and
Figure 16 show the confusion matrices of the bagged tree classifier in case of EMG measured from the forearm and biceps brachii muscles, respectively.
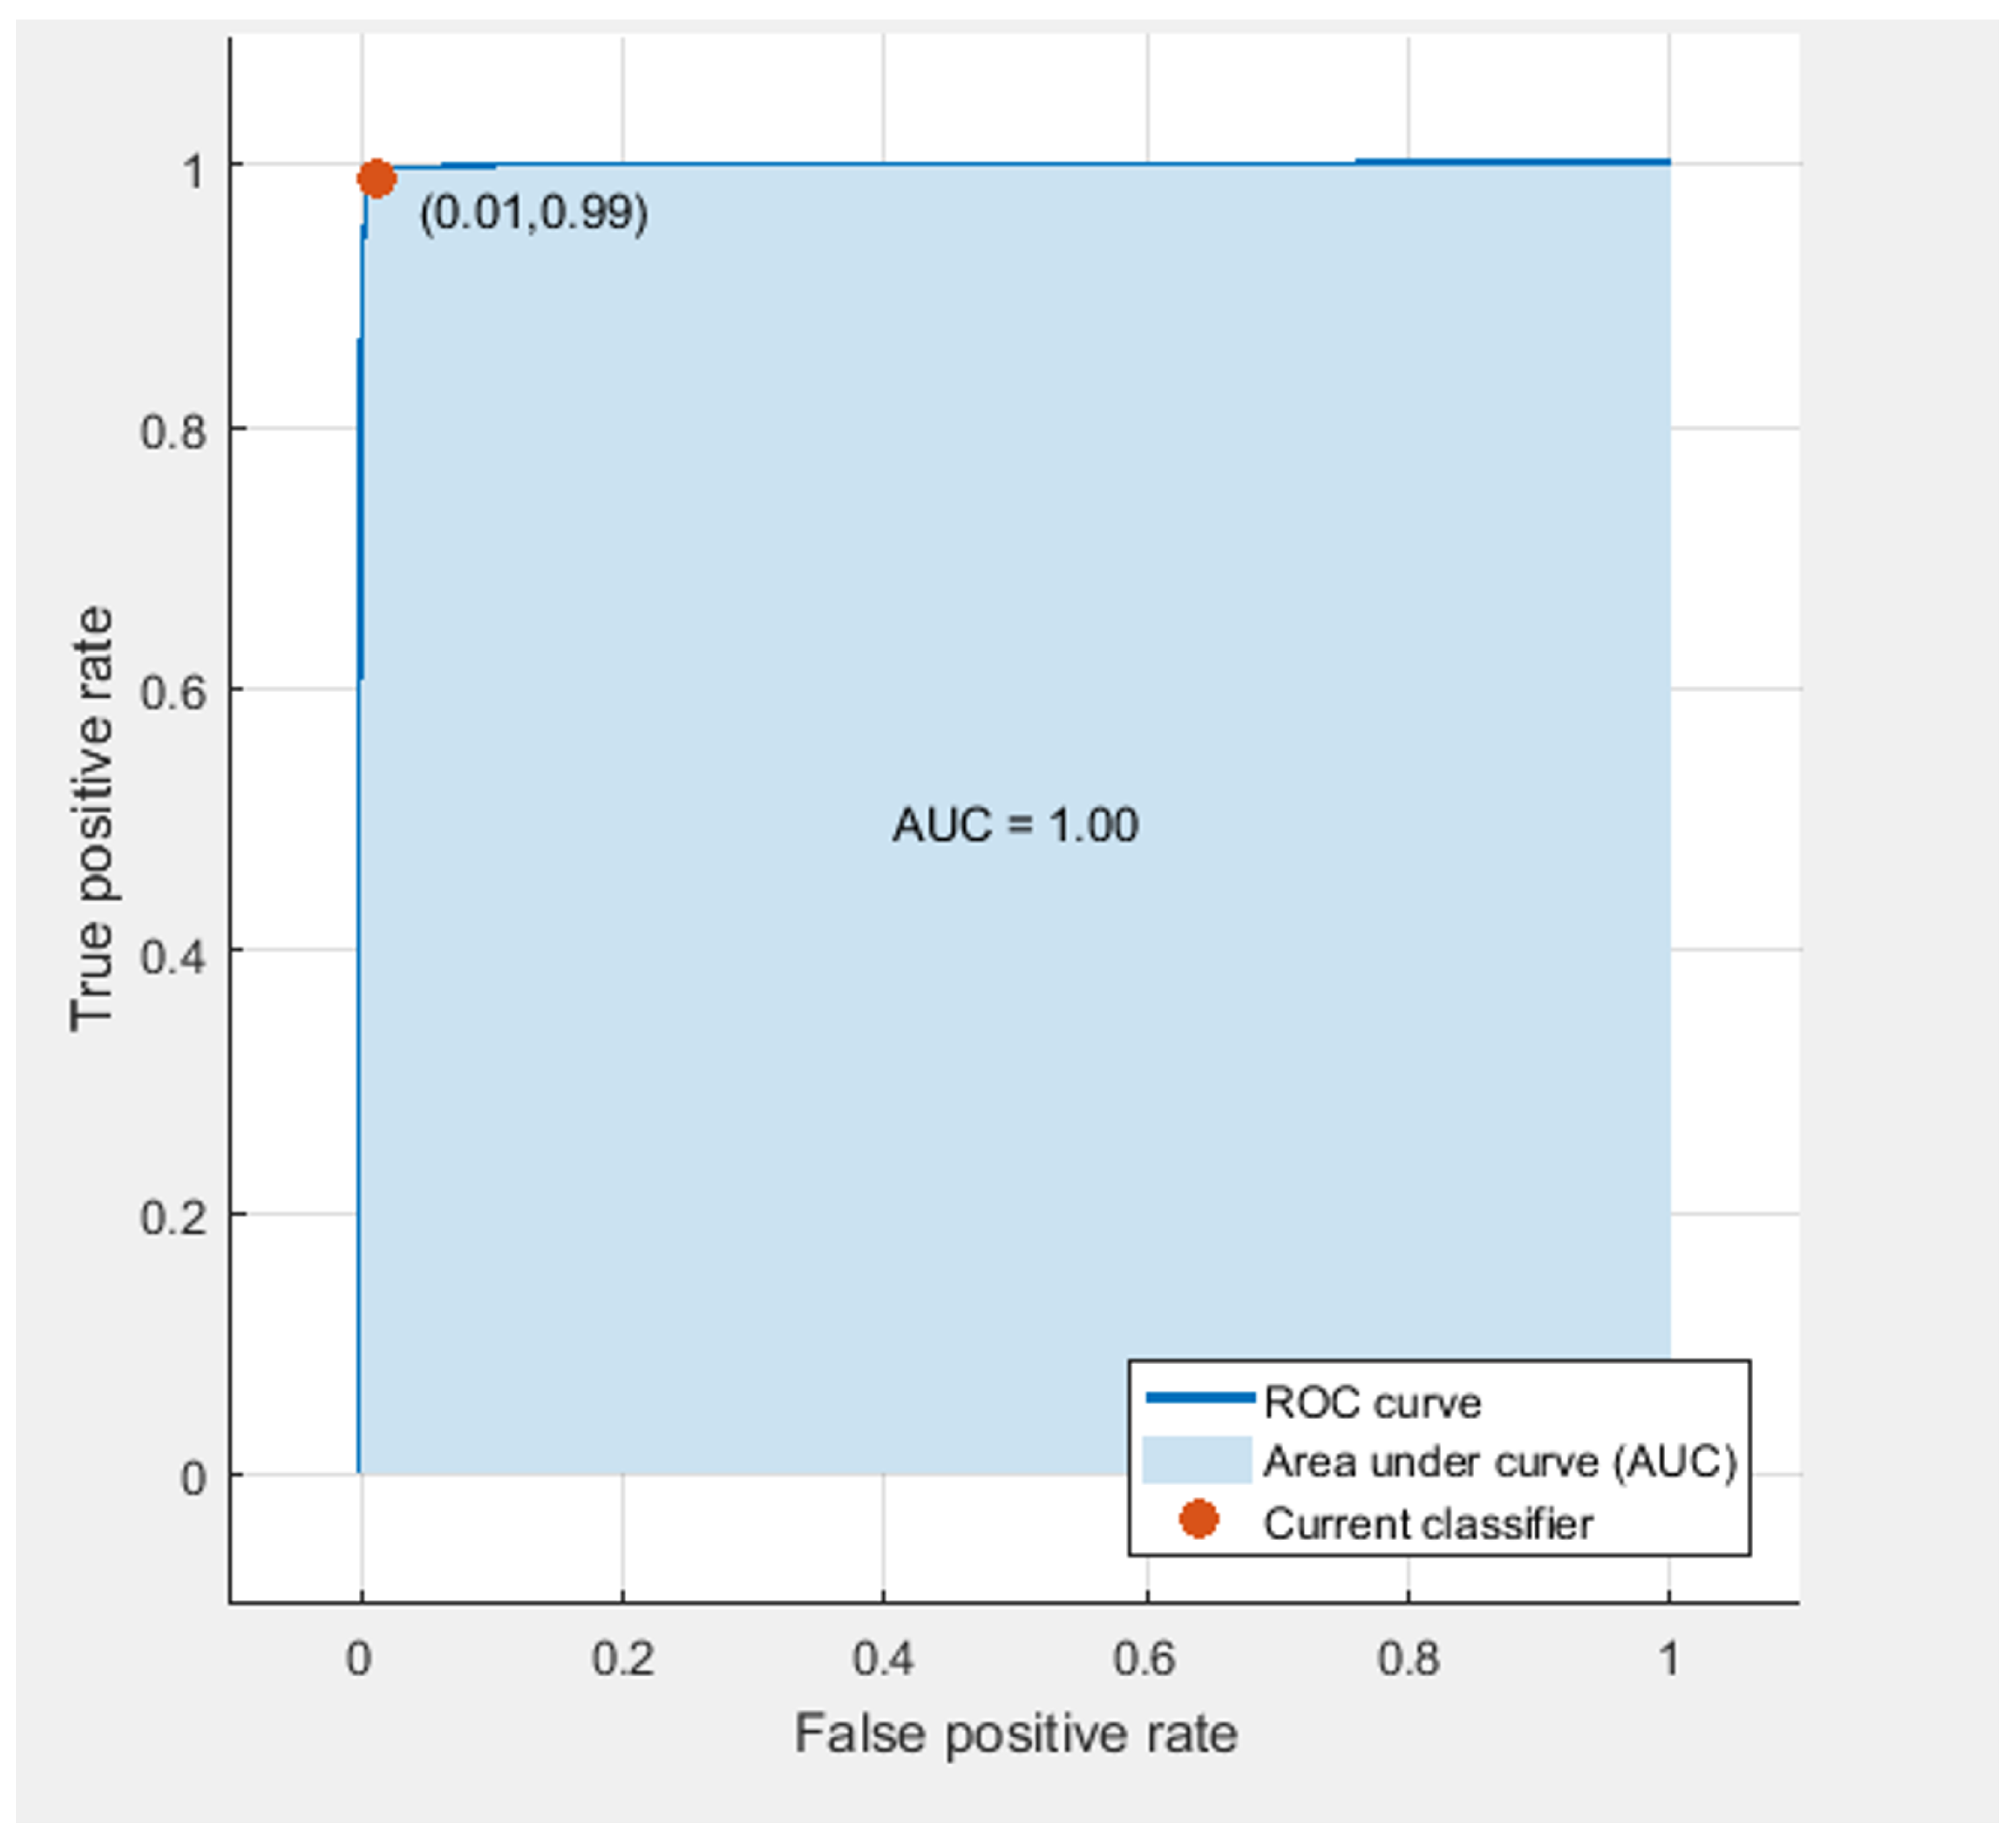
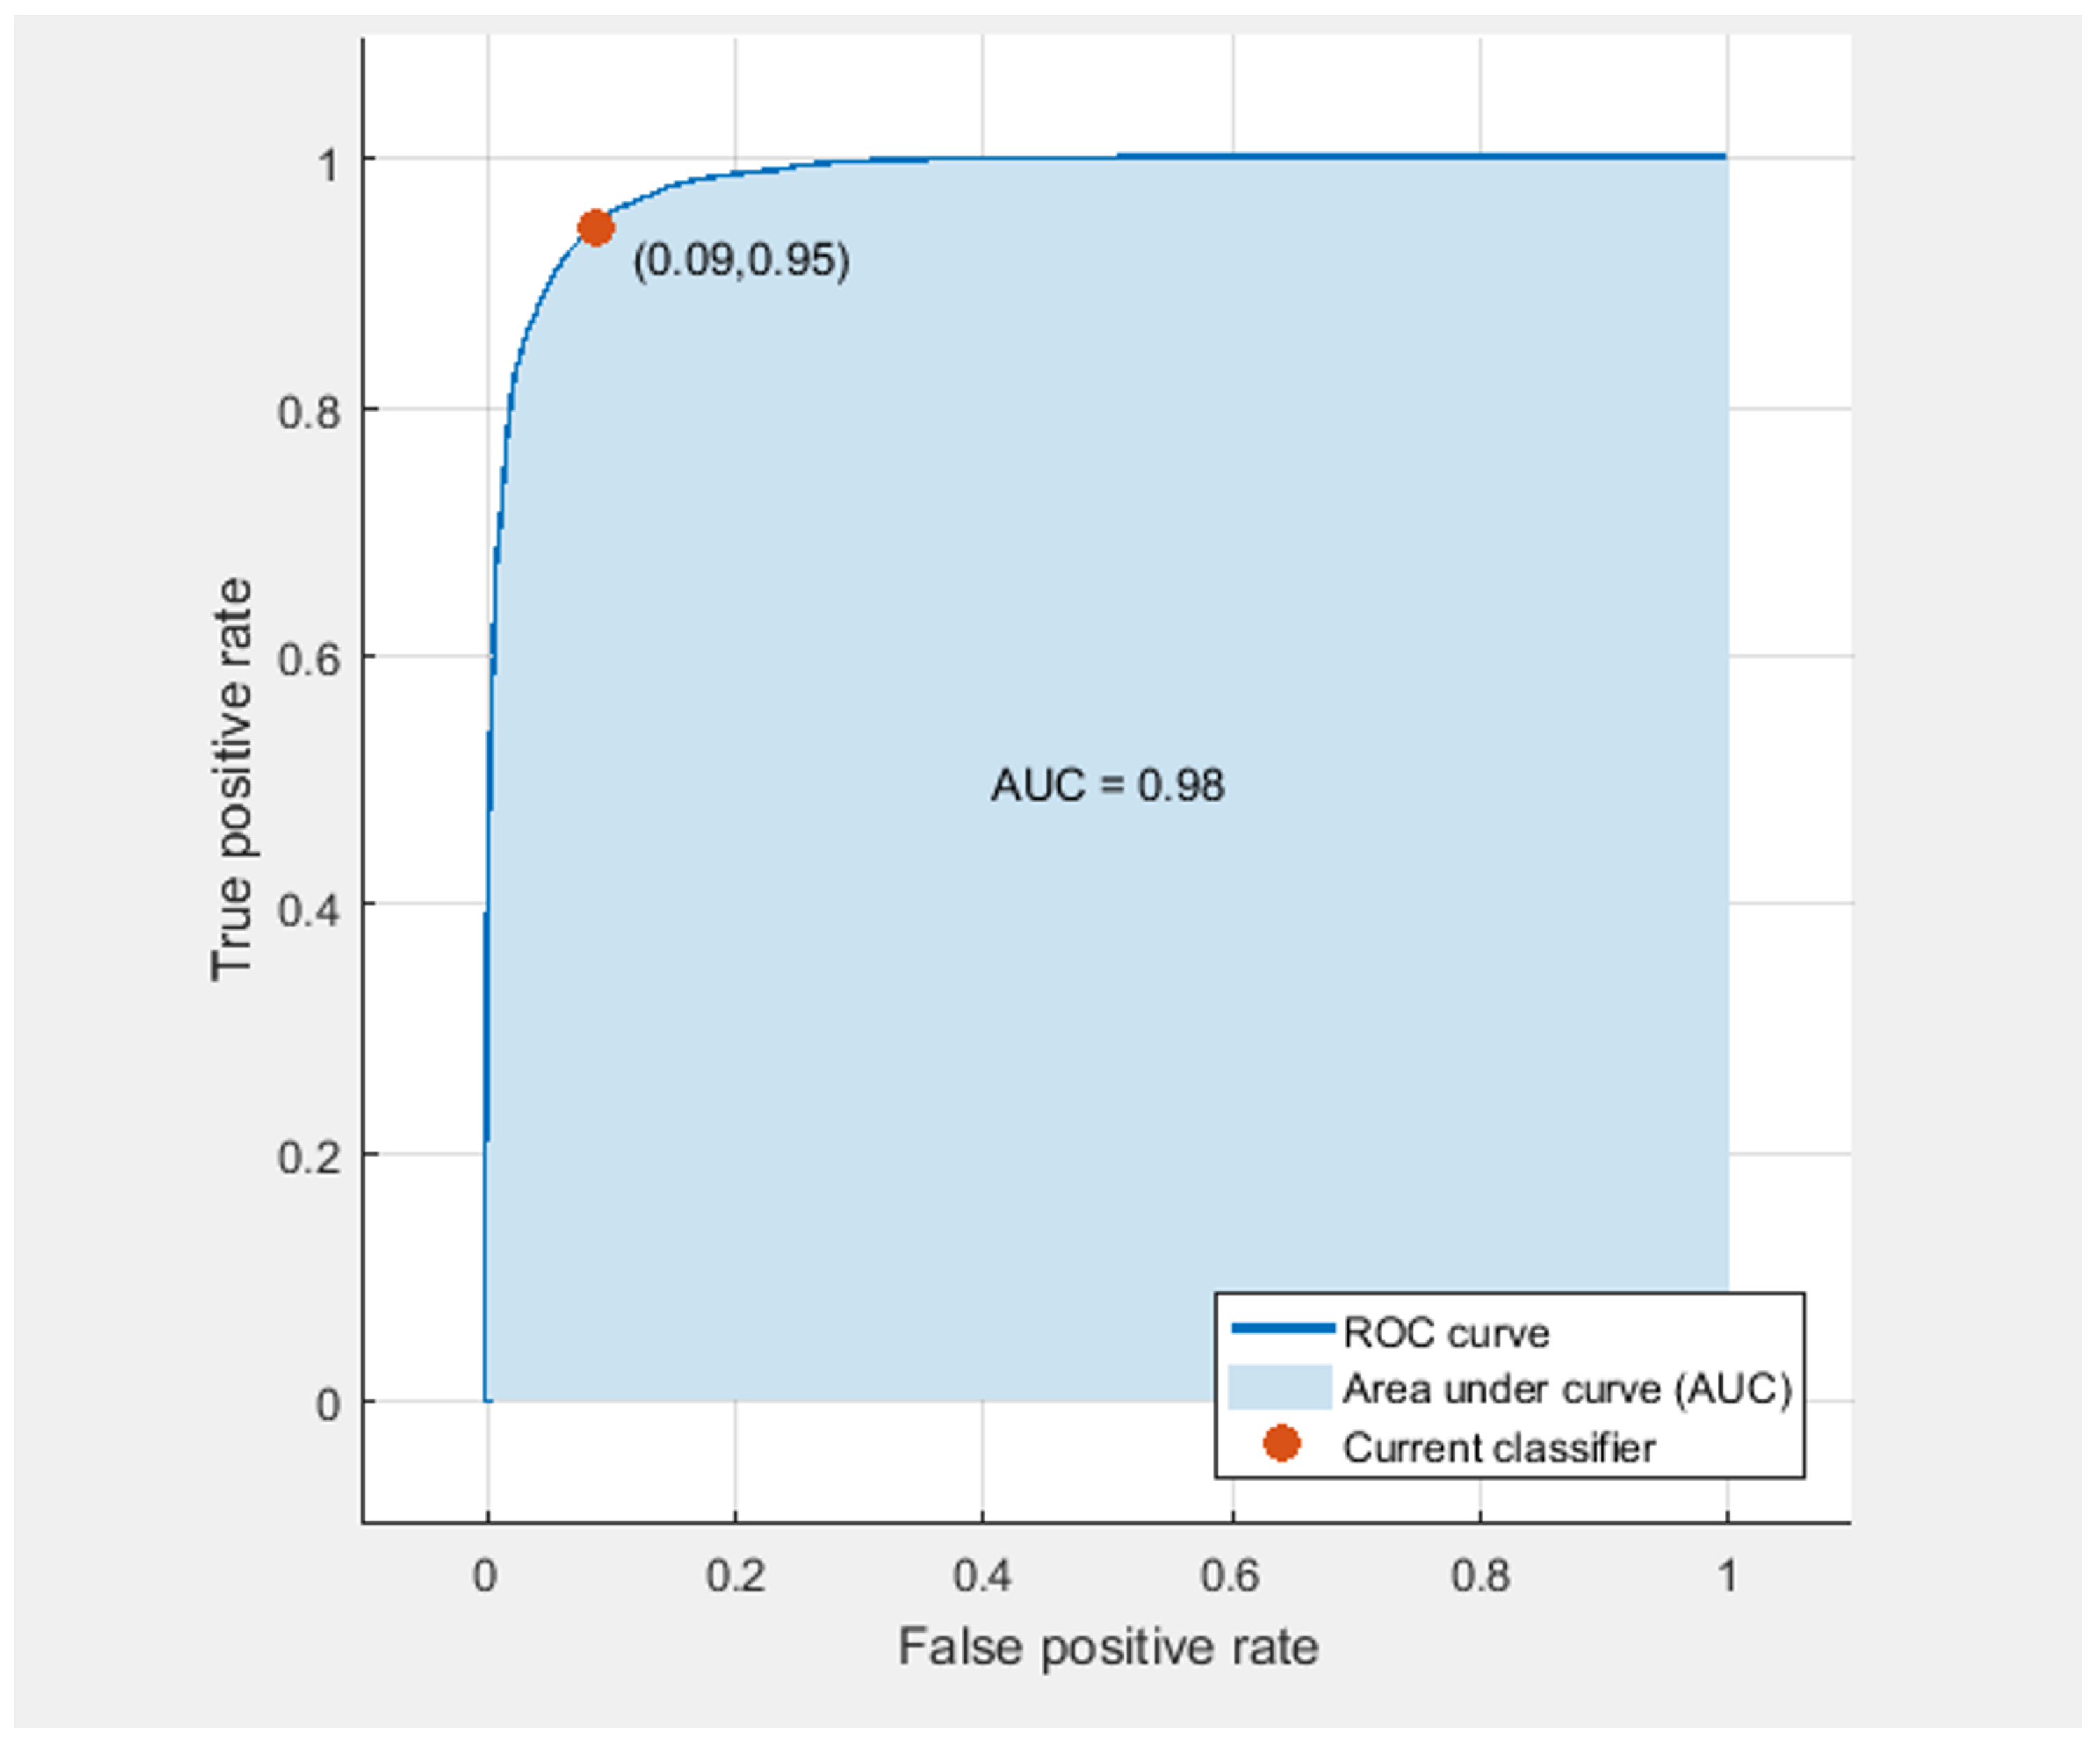
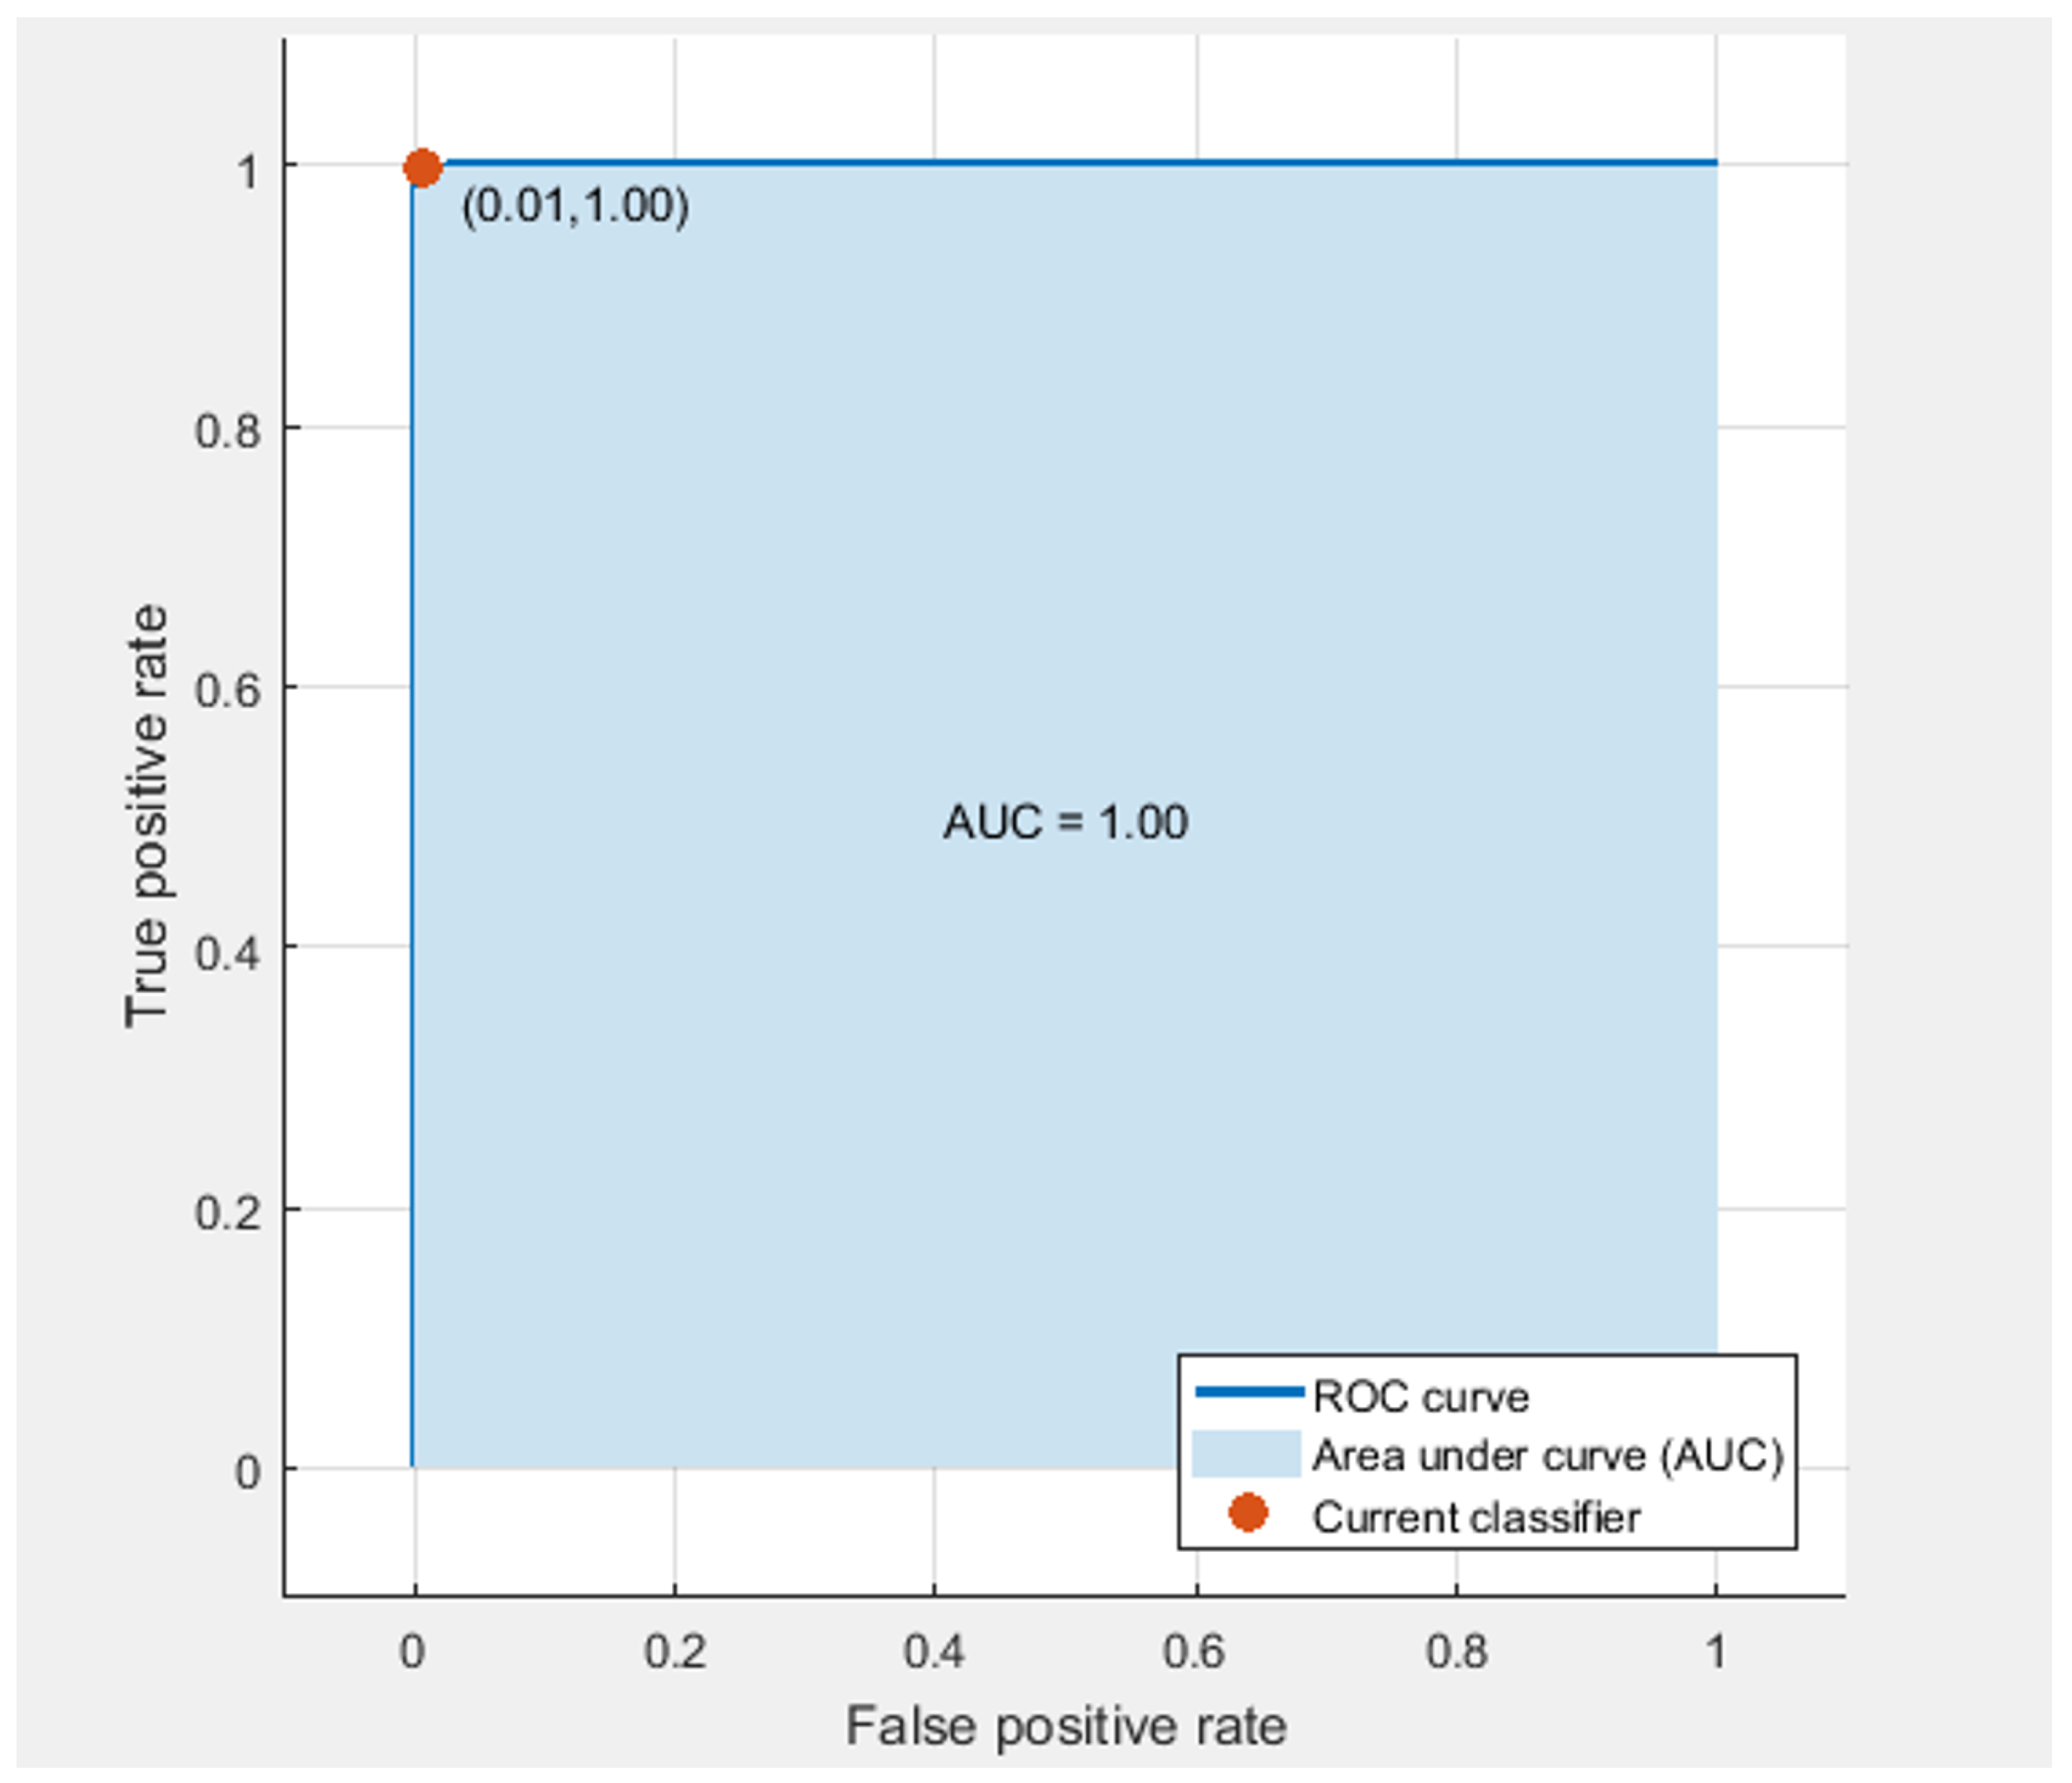
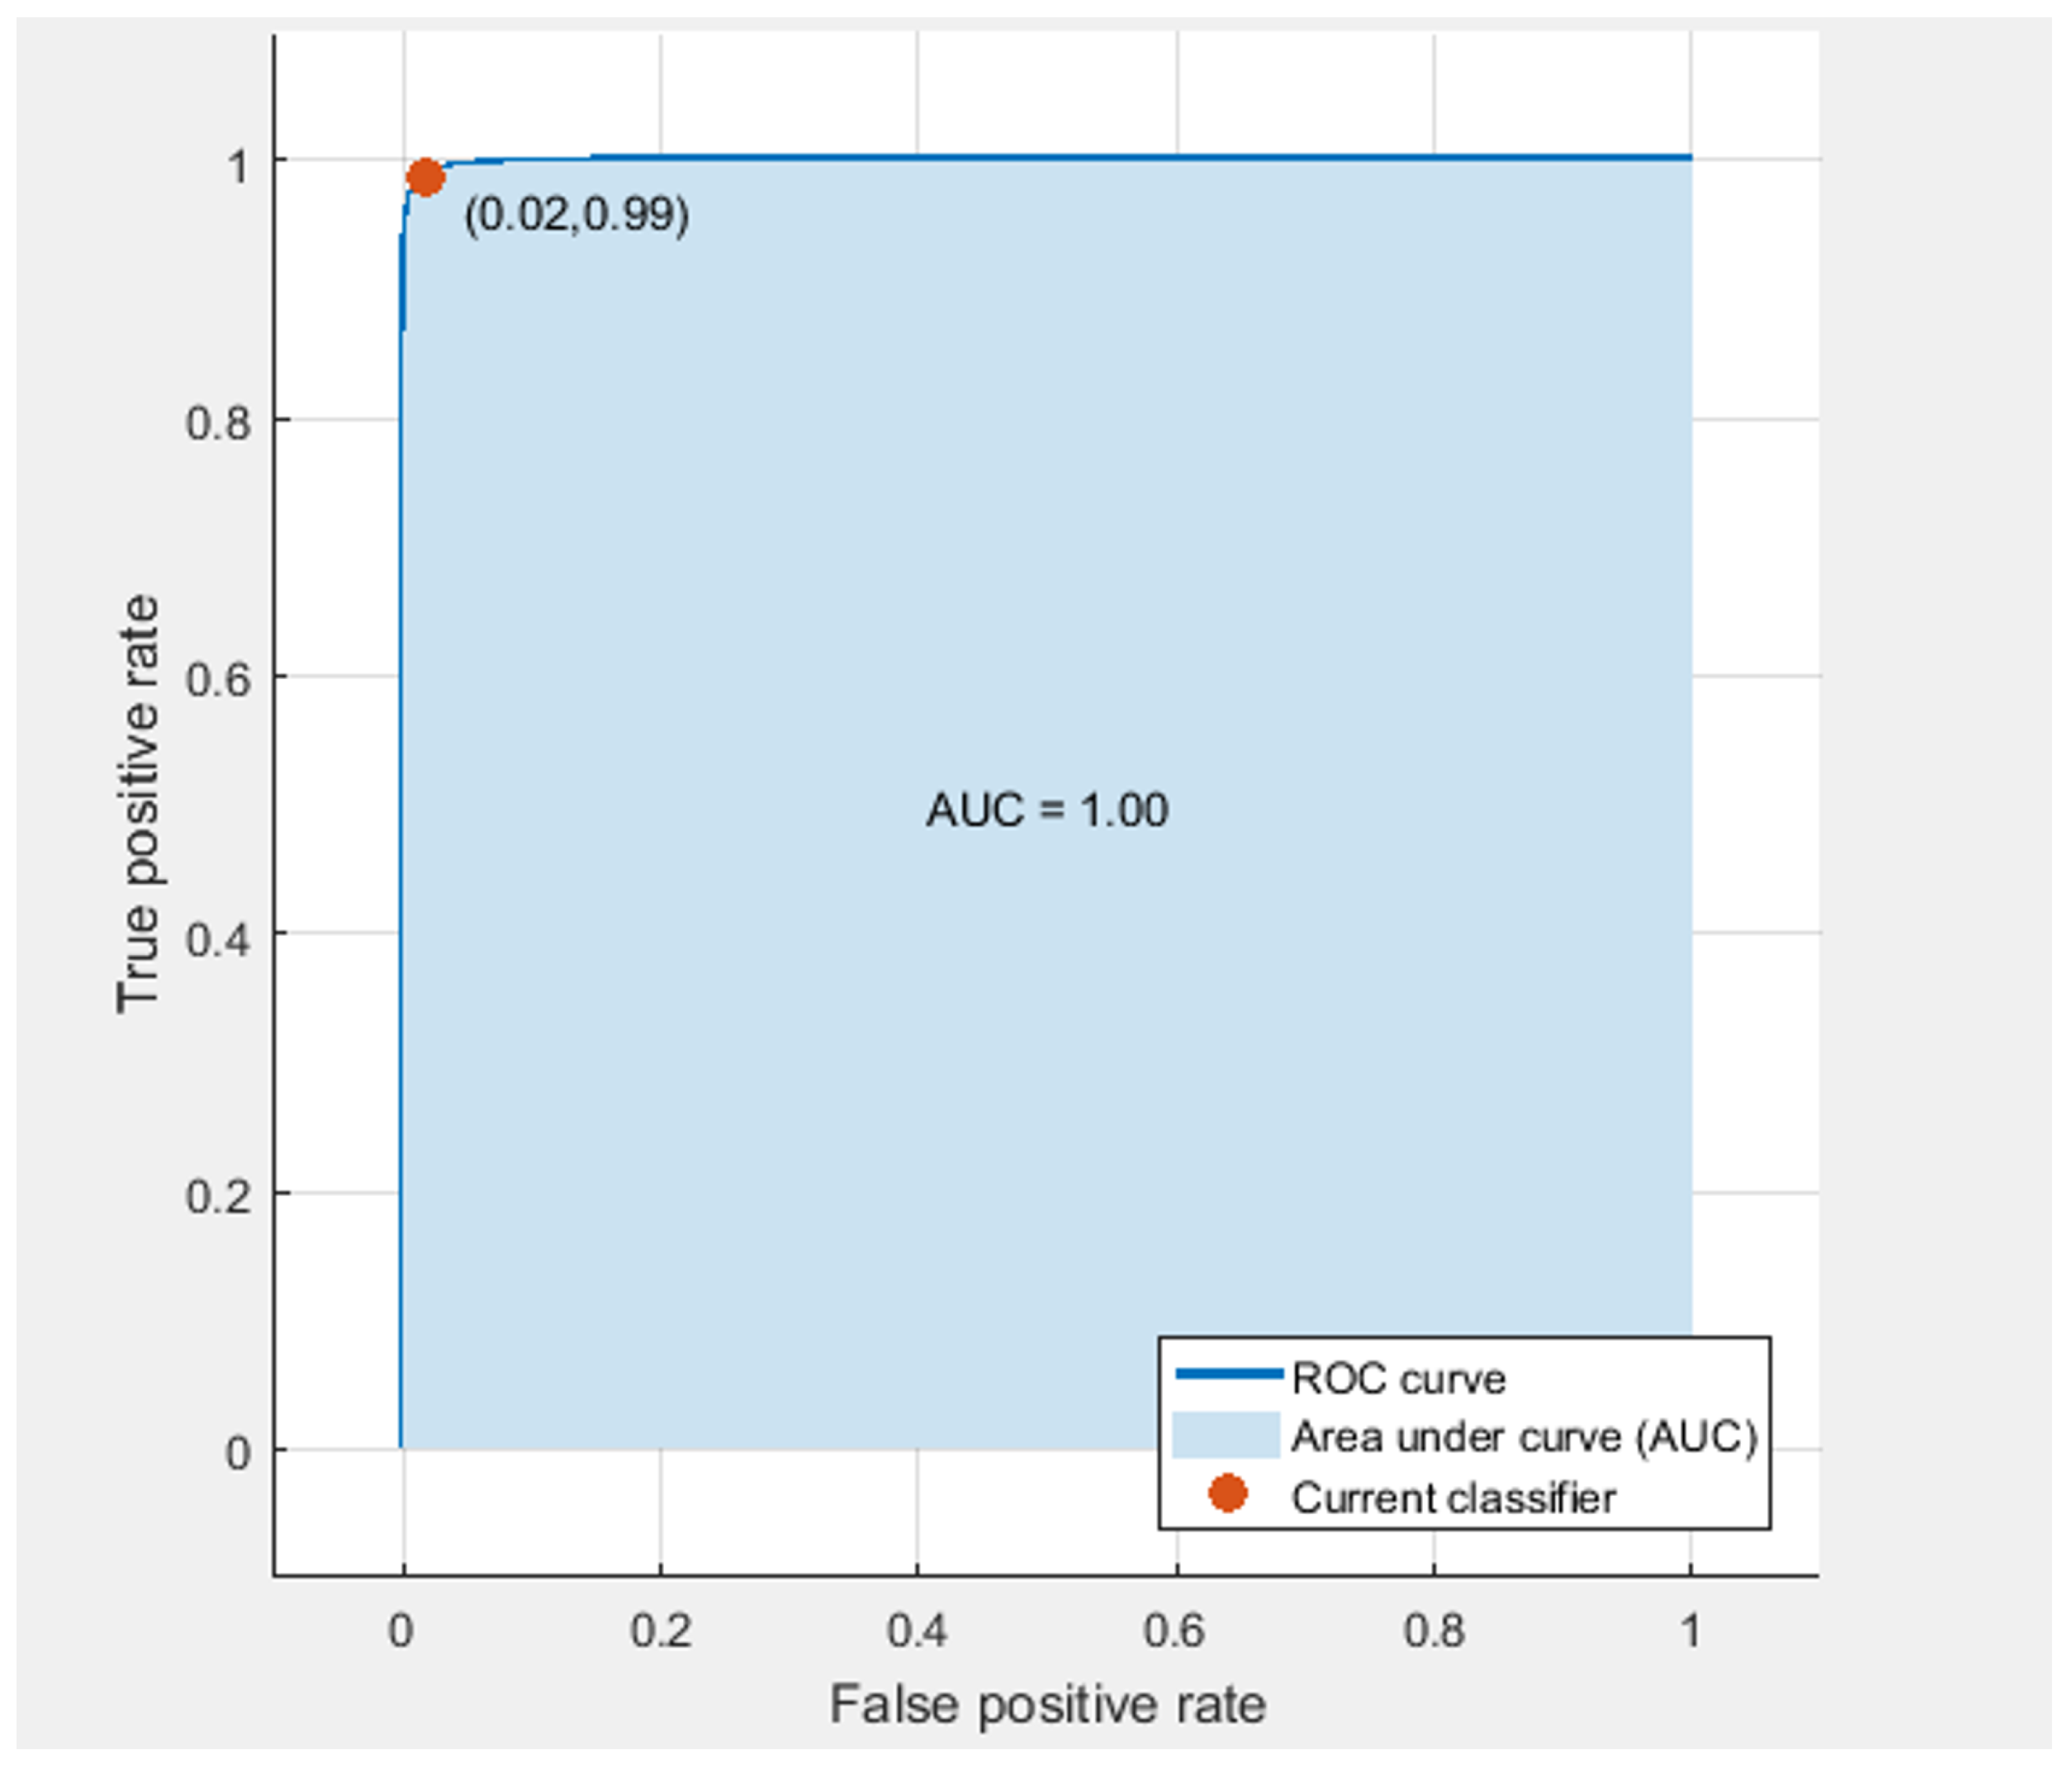
Figure 17 and
Figure 18 show the ROC curve for the bagged tree classifier of the EMG signals of the forearm and bicep brachii muscles, respectively. The corresponding areas under ROC (AUC) curves are 1 and 0.98, respectively.
The best achieved accuracy by Loconsole et al. [
9] was 92.98% using a SVM classifier. In our work, using Shimmer sEMG sensor attached to the forearm on one point gave an accuracy of 96.9% for the same classifier. The reason for the difference in classification accuracies, from our point of view, is due to the difference in sampling frequencies between the two sensors. Phinyomark et al. [
27] investigated the effect of sampling rate of sEMG sensor data on the classification accuracy, and concluded that the frequency content of EMG signals > 100 Hz is critical to the performance of myoelectric systems. They also concluded that the loss of high frequency content degrades the classification accuracies. Myoarmband’s original sampling rate is 200 Hz, as stated in the same reference, which is considered a low sampling frequency, and causes the frequency content above 100 Hz to be lost. This in turn affects the classification accuracy.
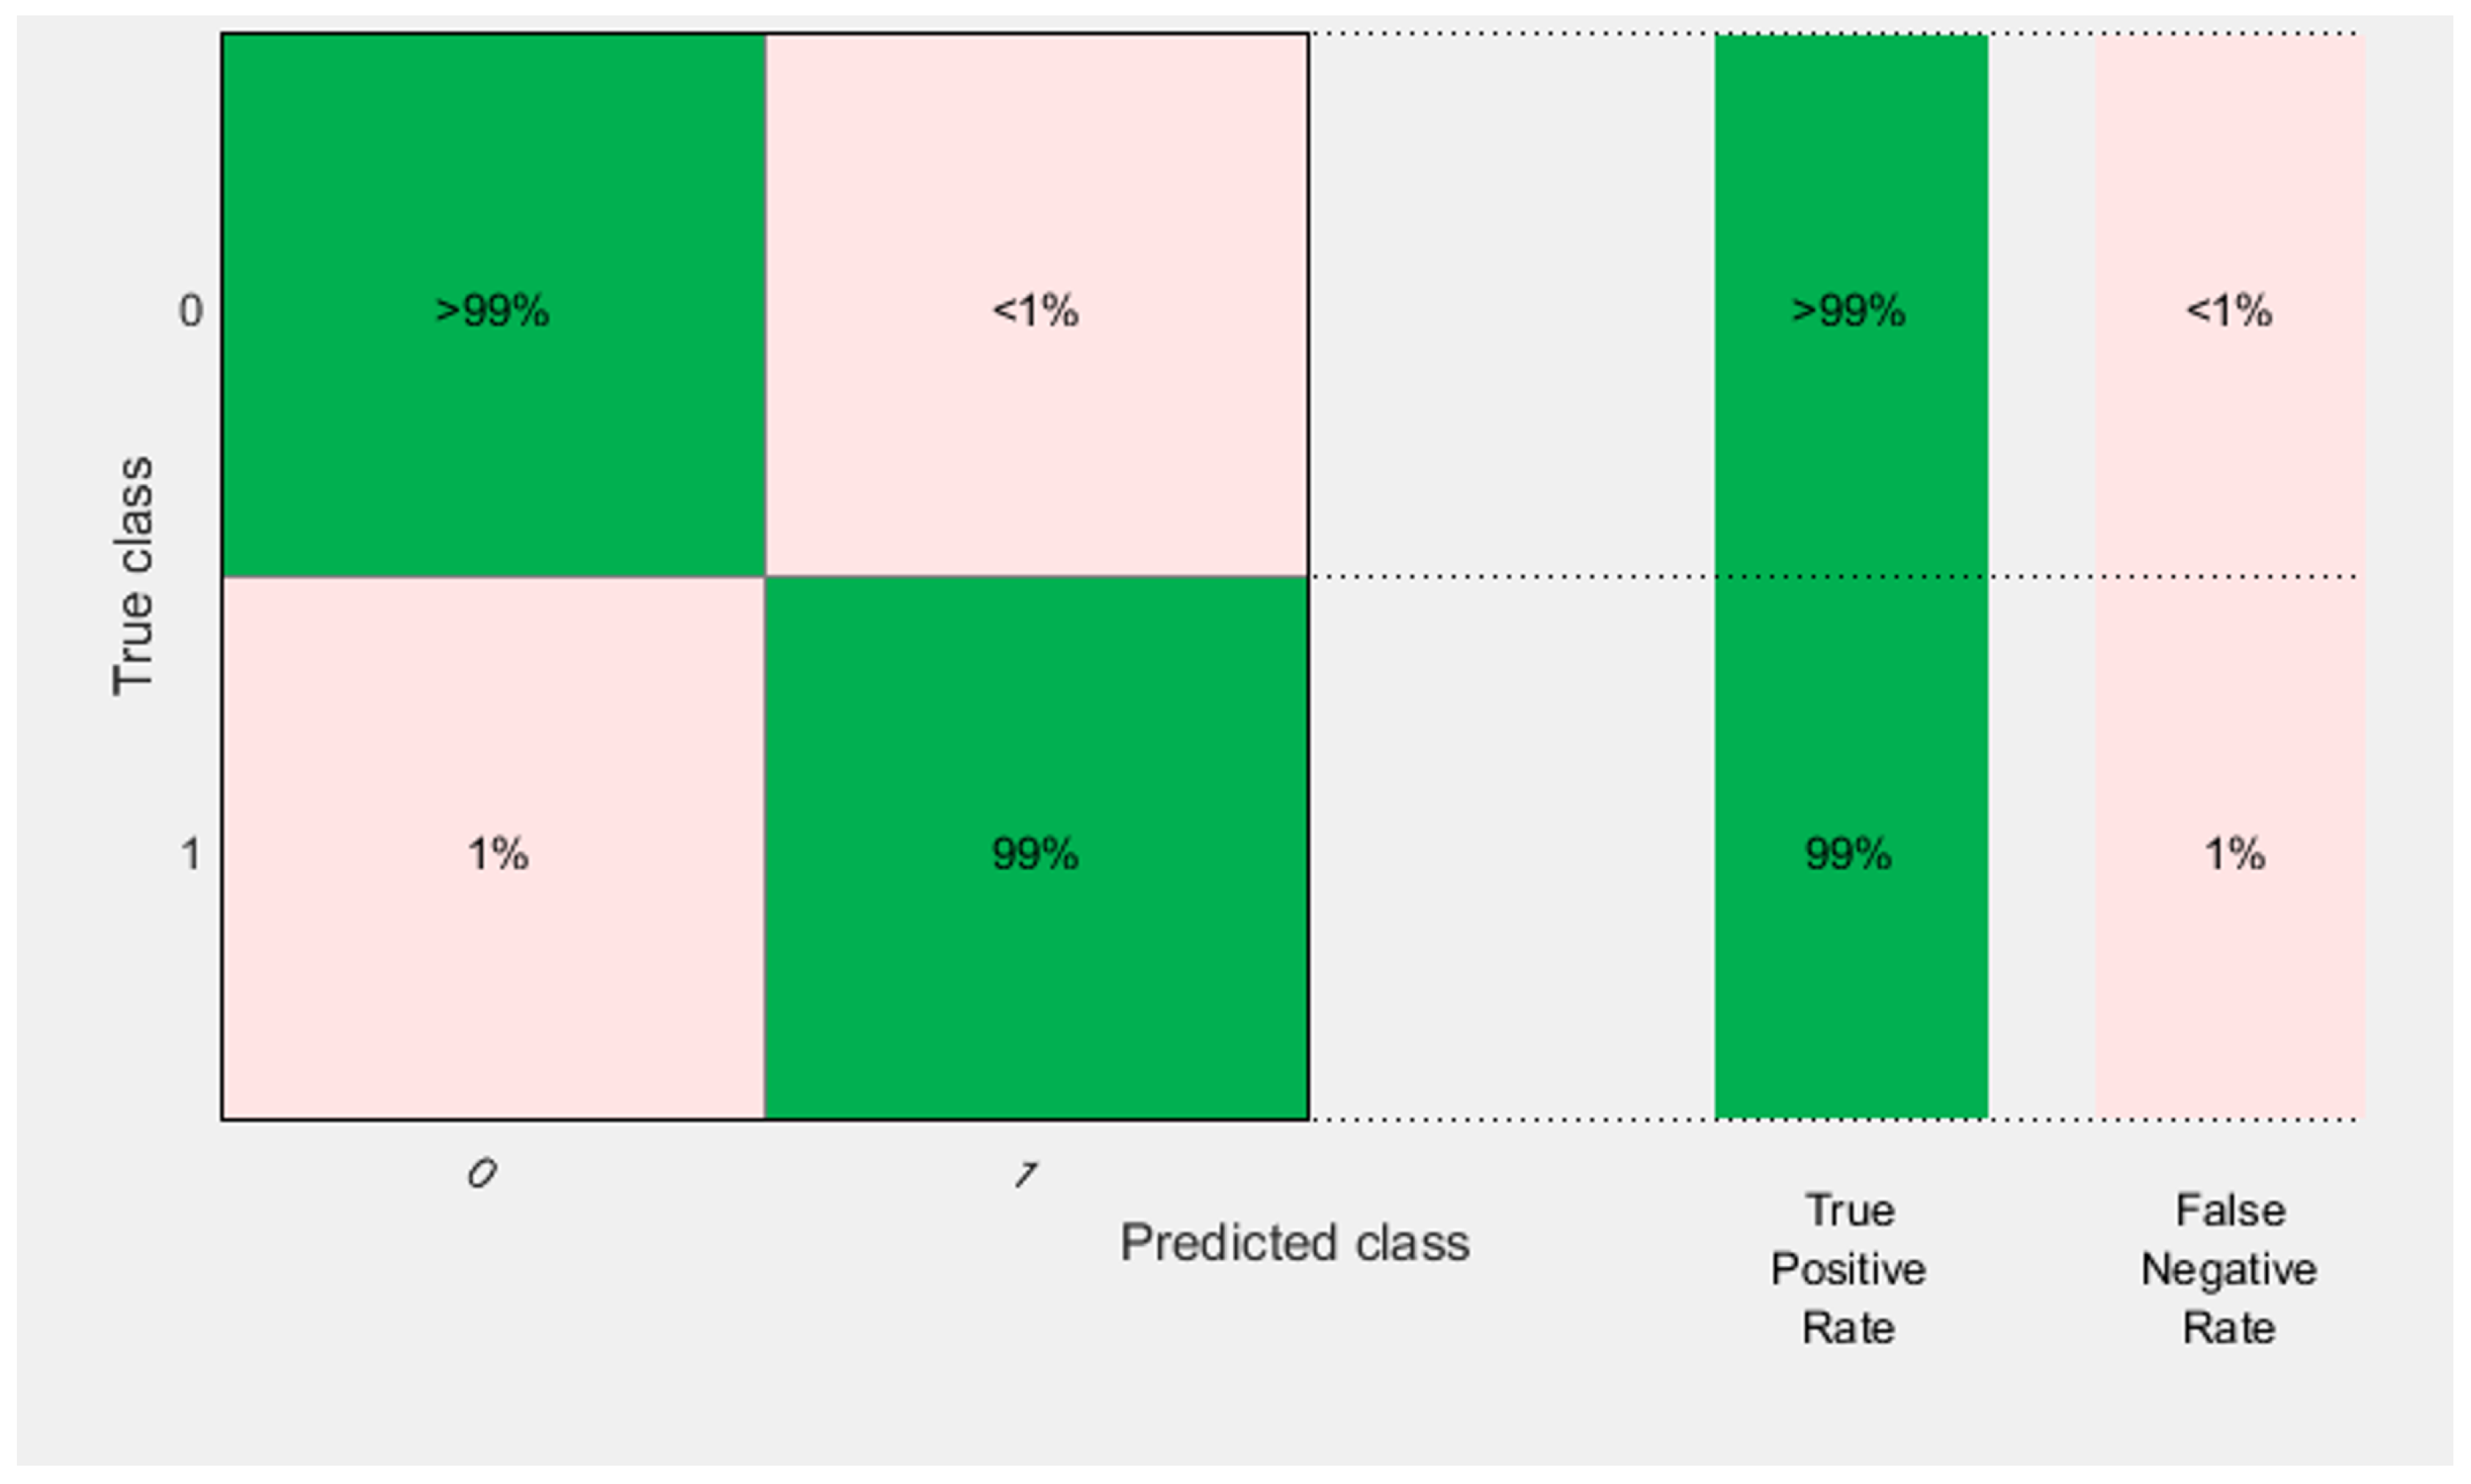
Furthermore, combining readings of the EMG and accelerometer signals taken from the forearm muscle has improved classification accuracy as shown in
Table 4. After sensor fusion, the accuracy has reached 99.2% for decision tree classifer, which is higher than the 97.3% when using EMG alone for the bicep brachii muscle. Similarly, the classification accuracy has further increased to 99.6% using bagged and boosted decision tree classifiers constructed using EMG and accelerometer signals taken from the biceps brachii muscle, which is higher than 98.5% of the bagged tree built with the EMG and accelerometer signals taken from the forearm muscle as shown in
Table 4.
Figure 19 and
Figure 20 show the confusion matrices of the bagged tree classifiers in case of sensor data fusion of accelerometer and EMG of the forearm and biceps brachii muscles, respectively.
Figure 21 and
Figure 22 show the ROC curves of the bagged tree classifier for the sensor fusion of ACC from Palmer wrist and EMG signals of the forearm and biceps brachii muscles, respectively.
Figure 21 and
Figure 22 also display the area under ROC (AUC) for each of ACC combined with EMG signals of the forearm and biceps brachii muscles, respectively, which are equal to 1 in both cases.
Comparing the results of the proposed ML approaches and measurement set to the results presented in
Table 1, it is quite clear that the proposed approach outperformes all relative techniques from the literature. More specifically, The best achieved classification accuracies were for the proposed technique of combined sEMG at the forearm and accelerometer at the Palmer wrist with accuracies of 86.5% to 99.6% for the different investigated classifiers. In all investigated scenarios, the lowest classification accuracies were achieved using LDA classifier, and best results were for bagged tree classifier. Thus, the proposed approach with bagged tree classifier achieves the best classification accuracy of 99.6%. This is due to two facts, first the right selection of the sensor types and positions, and second the application of the appropriate signal processing and ML techniques.


