1. Introduction
Cavitation damage is a common problem of high-velocity water in hydraulic engineering [
1,
2,
3]. An economical and effective solution to reducing the possibility of cavitation is to aerate the water flow [
4,
5,
6,
7,
8]. Aeration devices are usually installed along a spillway to make use of the air above the water surface. However, in a spillway tunnel that is a half-closed system and not connected directly to the atmosphere, the air can be dragged away by high-velocity water and needs supplementation. Therefore, air intake wells are usually installed along the tunnel. If these wells are not designed sufficiently large and cannot meet the air demands, extreme negative air pressures will occur. Negative pressure can increase the possibility of cavitation and cause many secondary disasters, such as structure vibration [
9,
10] and low frequency noise [
11,
12]. It is clear that the prediction of the air demand of a spillway tunnel is fundamental work for the reliability of project design.
Research on the prediction of air demand can be classified into three categories, namely, theoretical analysis, empirical formulas derived from fitting experimental data and numerical simulation. The original theoretical model for calculating the air demand of spillway tunnels was proposed by Gao [
13]. The dynamic balance of the whole airflow above the water surface was considered in the model. In addition, the empirical equation was subsequently improved by Lou [
14], which took the drag force into consideration based on their experiments and prototype data. Silisiji [
15] also proposed a theoretical method to calculate the air demand, but the theoretical results had significant errors compared to the data from prototype observations. Liu and Li [
16] proposed a mathematical model based on the simplified Navier–Stokes equation set, which was only applicable to uniform flow or gradually varying flow.
Kalinske and Roberston [
17] were the pioneers who proposed the empirical formula that correlated the air demand to the Froude number based on their experiments in the laboratory. Then, a similar empirical formula based on prototype data was proposed by Campbell and Guyton [
18]. Nevertheless, the air demand is much more complicated and should be a function of multiple parameters, not only the Froude number [
19]. It was suggested that the flow regime would influence the applicability of formulas and should be initially judged, which means that an empirical formula should be selected for a specific flow regime. Several empirical formulas have been proposed for different flow regimes by Sharma [
20] based on their experiments. In addition, Speerli and Hager [
21] studied the air demand in a rectangular tunnel. Their experimental results indicated that the air demand is related not only to the Froude number of water flow but also to the structures of the spillway tunnel and the gate [
22,
23]. Chen et al. [
24] proposed a different empirical formula based on a large amount of prototype data, which considered more parameters, including types of sluice gates, lengths of tunnels and ranges of Froude numbers. However, all of the previous empirical formulas were based on experimental or prototype data of a specific project, which limited their application to a wider extent.
Recently, numerical simulation technology has been greatly developed due to the improvement in computer technology [
25,
26,
27,
28,
29,
30]. The results from numerical simulations can give full details of the flow field, so many researchers have conducted numerical simulations on spillway tunnels for investigation. For instance, the hydraulic characteristics of spillway tunnels with high water heads have been studied with FLUENT by Deng and Xu et al. [
25], but the height of the water-free space in a spillway tunnel could not be obtained. Li and Tian [
26] studied the influence of the area of the air intake well on the ventilation rate, but there was no verification with observation data. Yazdi and Zarrati [
27] employed a volume of fluid (VOF) model to simulate the air–water flow in a gated tunnel for different gate openings, and the numerical results were compared to experimental data from References [
19,
21]. The researchers concluded that the VOF model could not simulate the self-aeration of water. Thereafter, three-dimensional computation of the water-air flow along the spillway bottom was conducted [
28]. Similarly, the particle finite element method (PFEM) was used to model the air–water interaction downstream of the Susqueda Dam bottom outlet [
29]. However, there is a common difficulty whereby the numerical simulations require considerable computational efforts to ensure accuracy during the calculations.
In general, the application of empirical formulas based on experimental or prototype data of a specific project is limited due to the experimental limitations, scale effect or measurement accuracy, and the numerical simulation of air-water flow in spillway tunnels is limited by the requirement of fine resolution meshes in air-water interfaces. Furthermore, the currently existing theoretical models are only applicable to a spillway tunnel with only one air intake well behind its sluice gate. As an increasing number of spillway tunnels with several air intake wells have recently been built worldwide, especially in China, the development of a theoretical model for multiple intake wells is urgent and necessary.
3. Calibration and Verification
The drag coefficient is critical for the solution of this theoretical approach. However, the value of the drag coefficient is influenced by many factors, such as flow pattern, water velocity, water surface condition and height of the water-free space. Thus, a general formula for calculating the drag coefficient has not yet been established.
In this section, based on the prototype data of the spillway tunnel in the Jinping-I project, the drag coefficient is calibrated first, and then the theoretical calculation results are verified by the prototype data.
3.1. Project Description
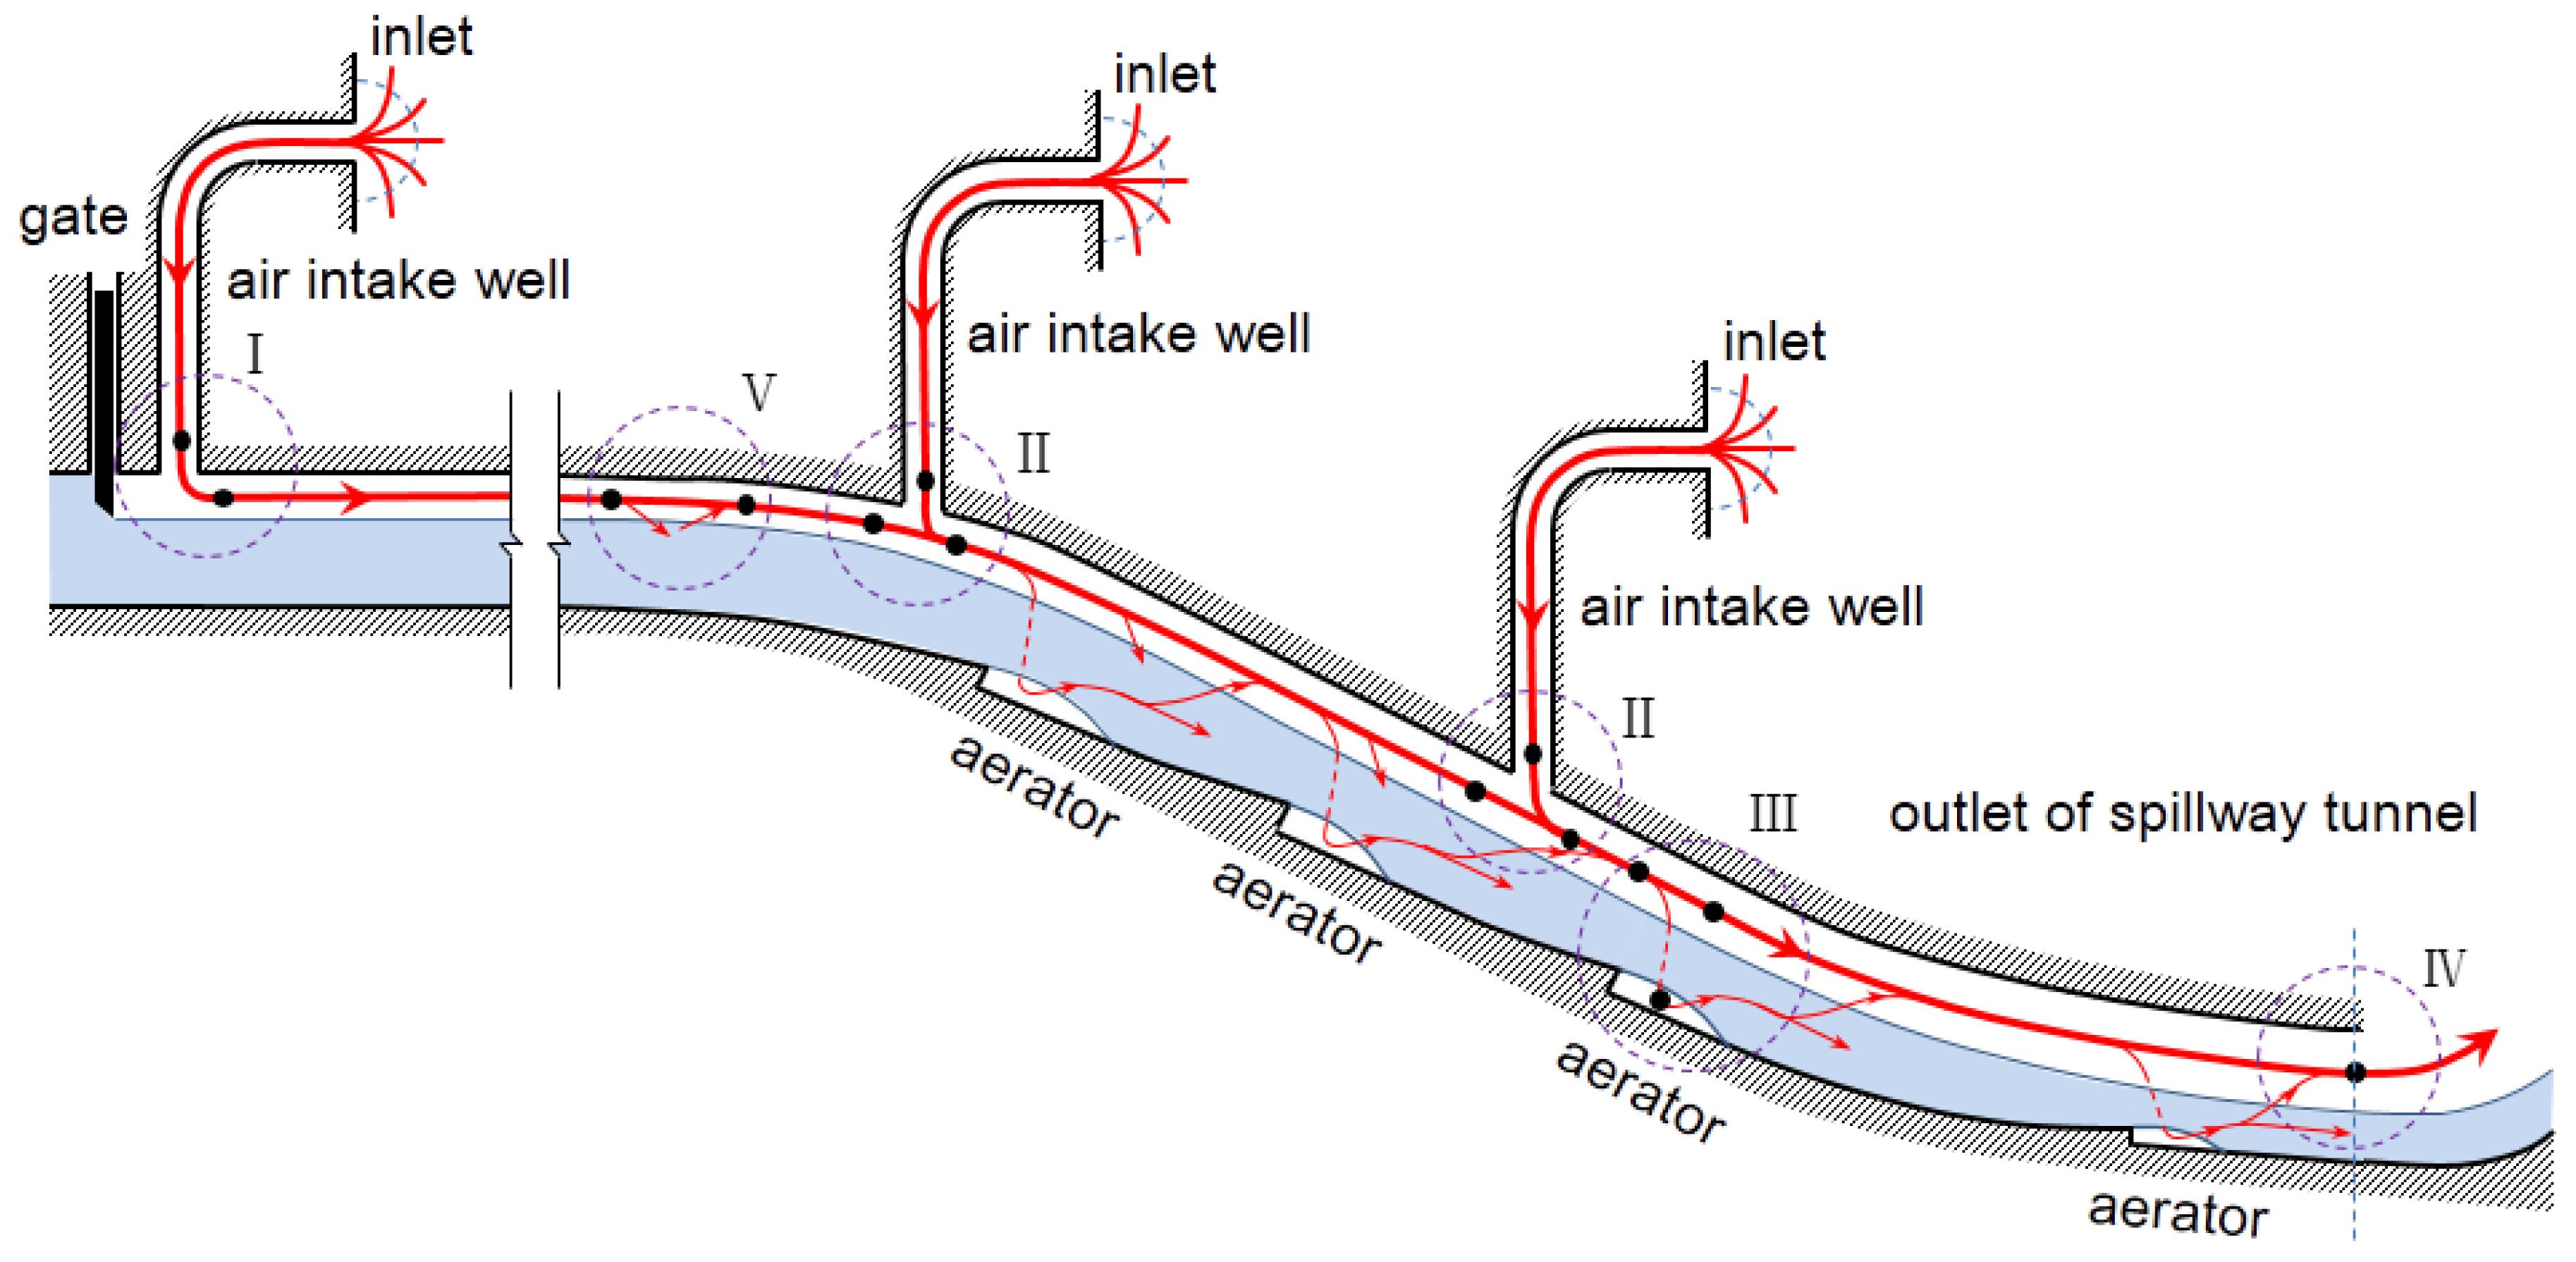
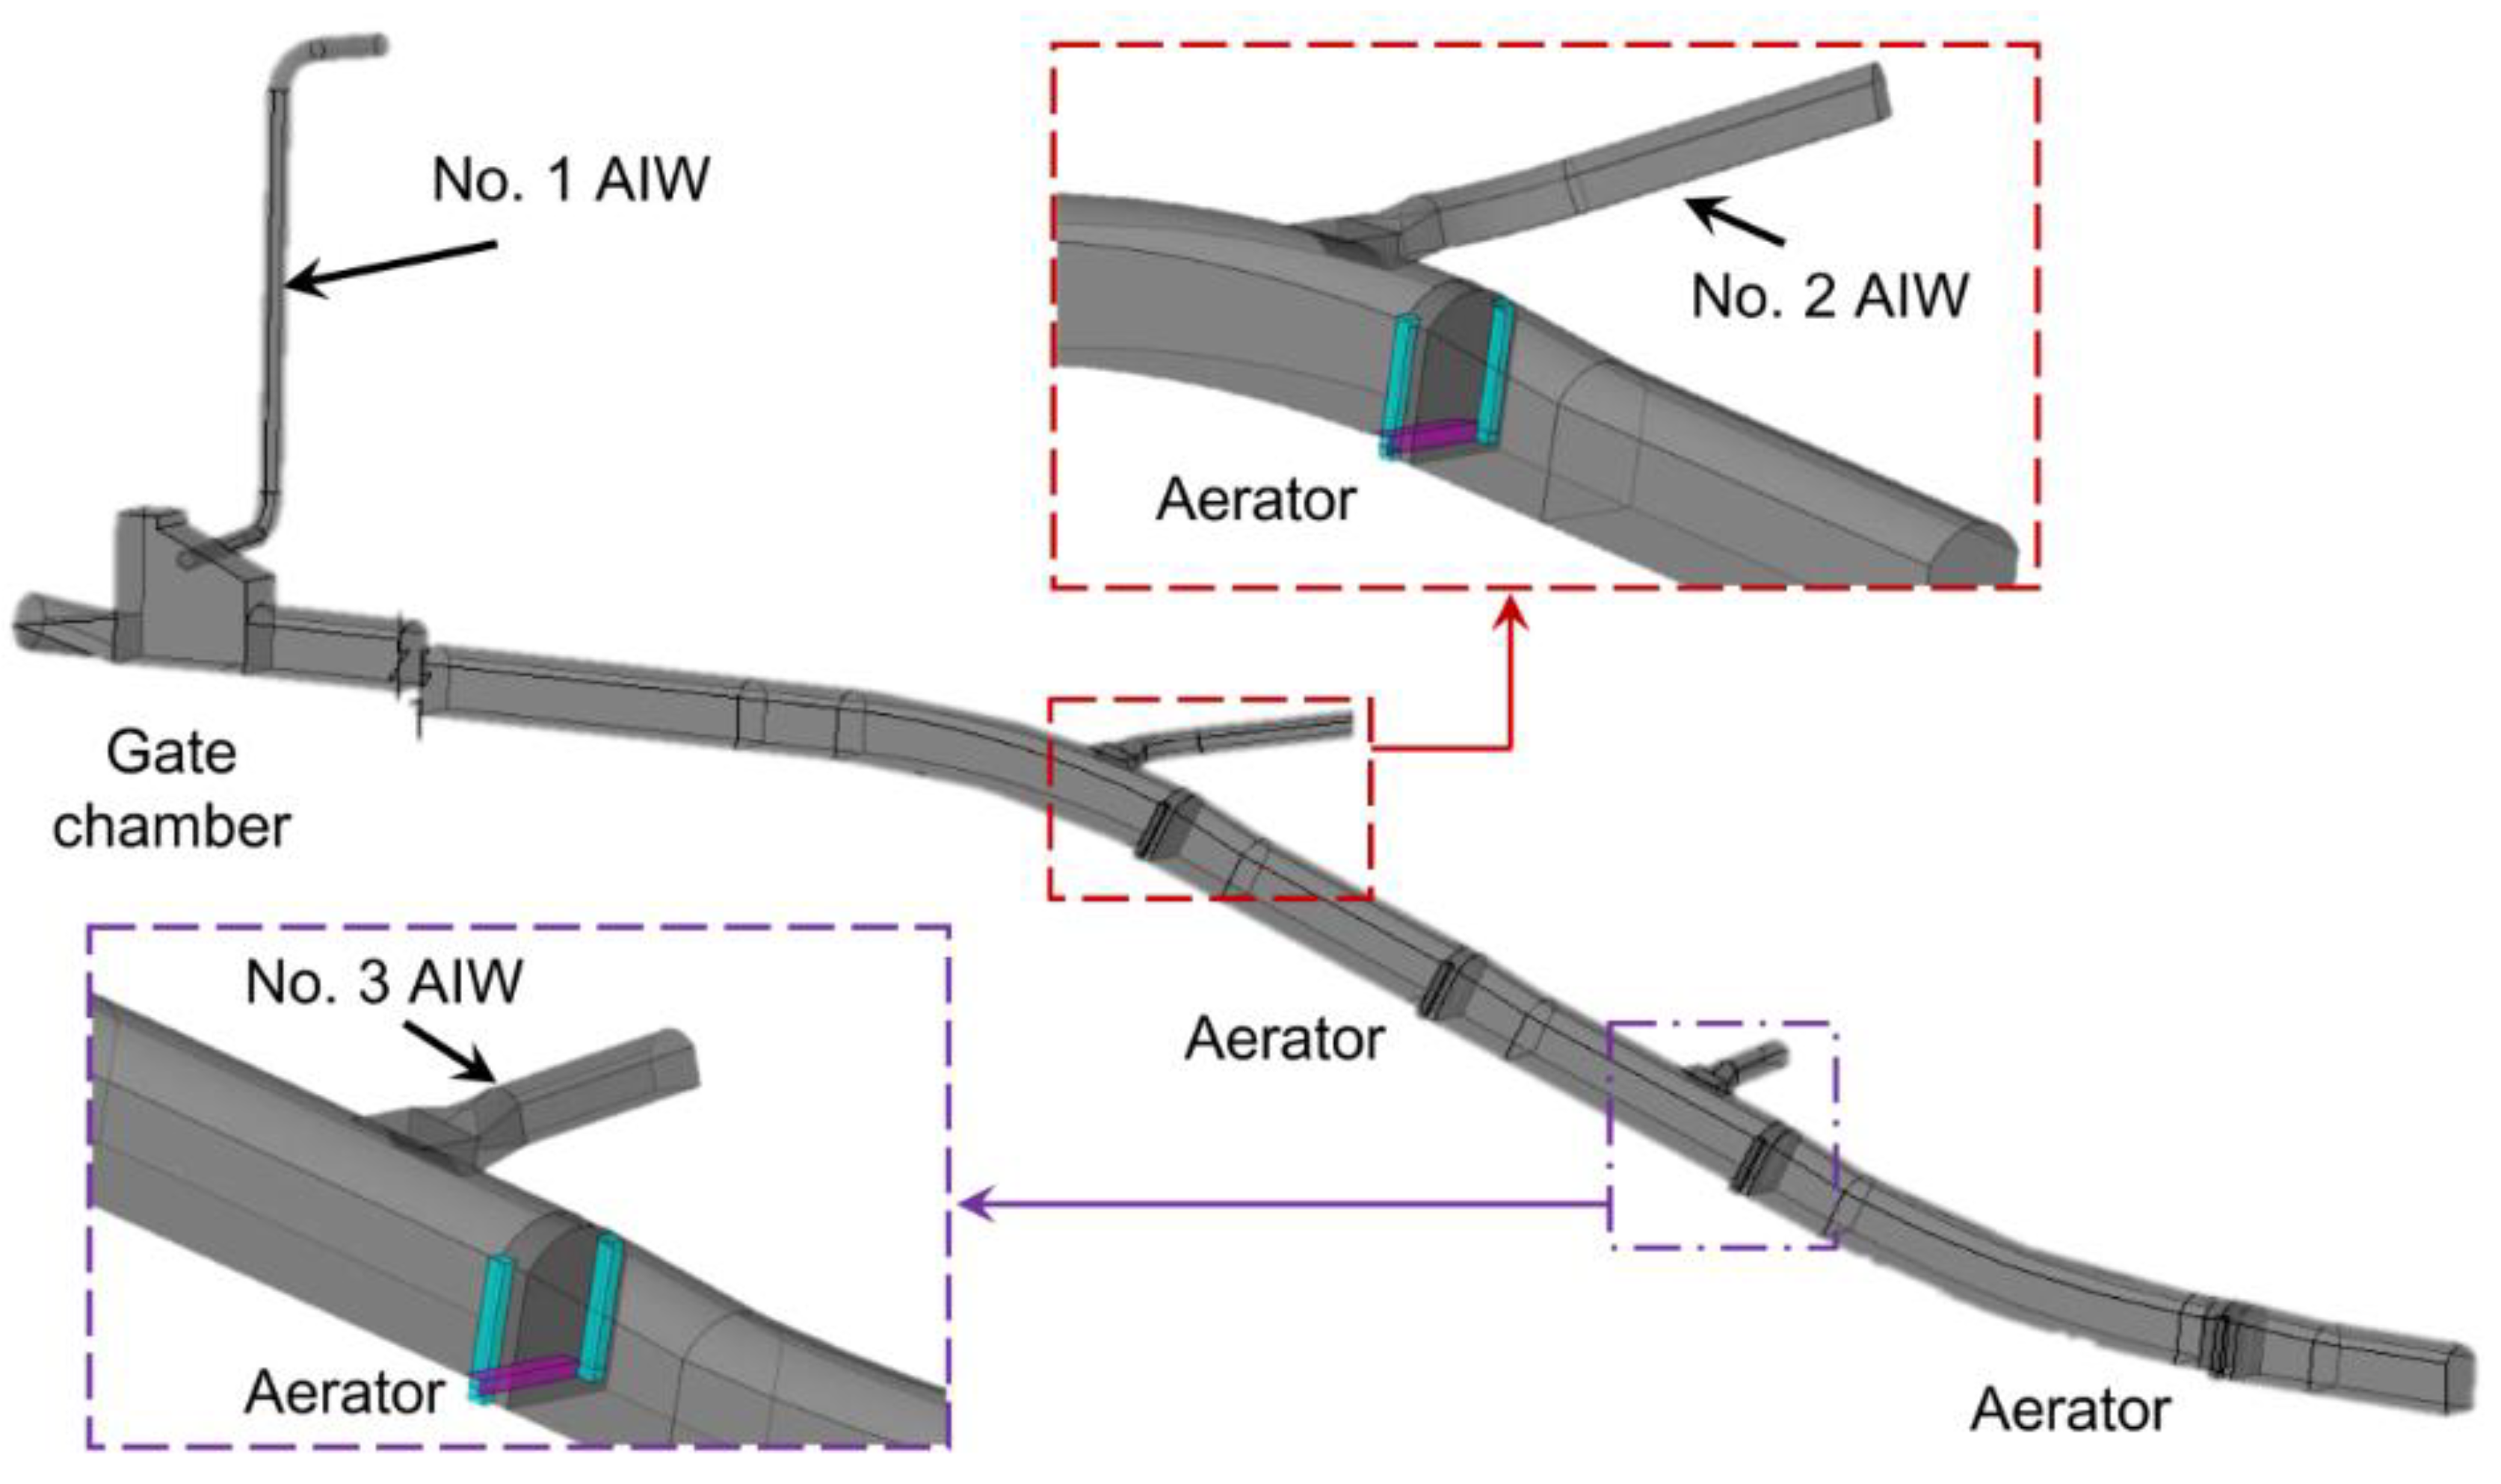
The Jinping-I Dam, with a height of 305 m, is currently the highest arched dam in the world. One spillway tunnel on the right bank is 1407 m long, and the flow velocity in its free flow tunnel section can reach up to 50 m/s. To alleviate cavitation damage, four aerators and three air intake wells for air supply were built. A schematic diagram of the free flow tunnel is shown in
Figure 5, and the specific parameters of each air intake well are listed in
Table 1.
The parameters required for theoretical analysis are as follows. The water depth and water velocity in the spillway tunnel can be obtained from a physical model test. The air velocity in the air intake well, the air duct of the aerator and the water-free space in the spillway tunnel can be obtained from prototype observations; all of the details can be referred to in Lian and Qi’s research results [
31]. The local resistance coefficient is confirmed by the geometry of the spillway tunnel and the air intake wells. A frictional resistant coefficient of 0.015 is adopted in this study, referring to the Moody diagram [
32].
3.2. Calibration of the Drag Coefficient
In this study, the expression of the drag coefficient refers to the empirical formula proposed by Luo [
14]:
where
is the gravitational acceleration;
is the height of the water-free space in the spillway tunnel;
is the water velocity; and
is a constant that depends on the data sample. According to Luo’s analysis [
14],
.
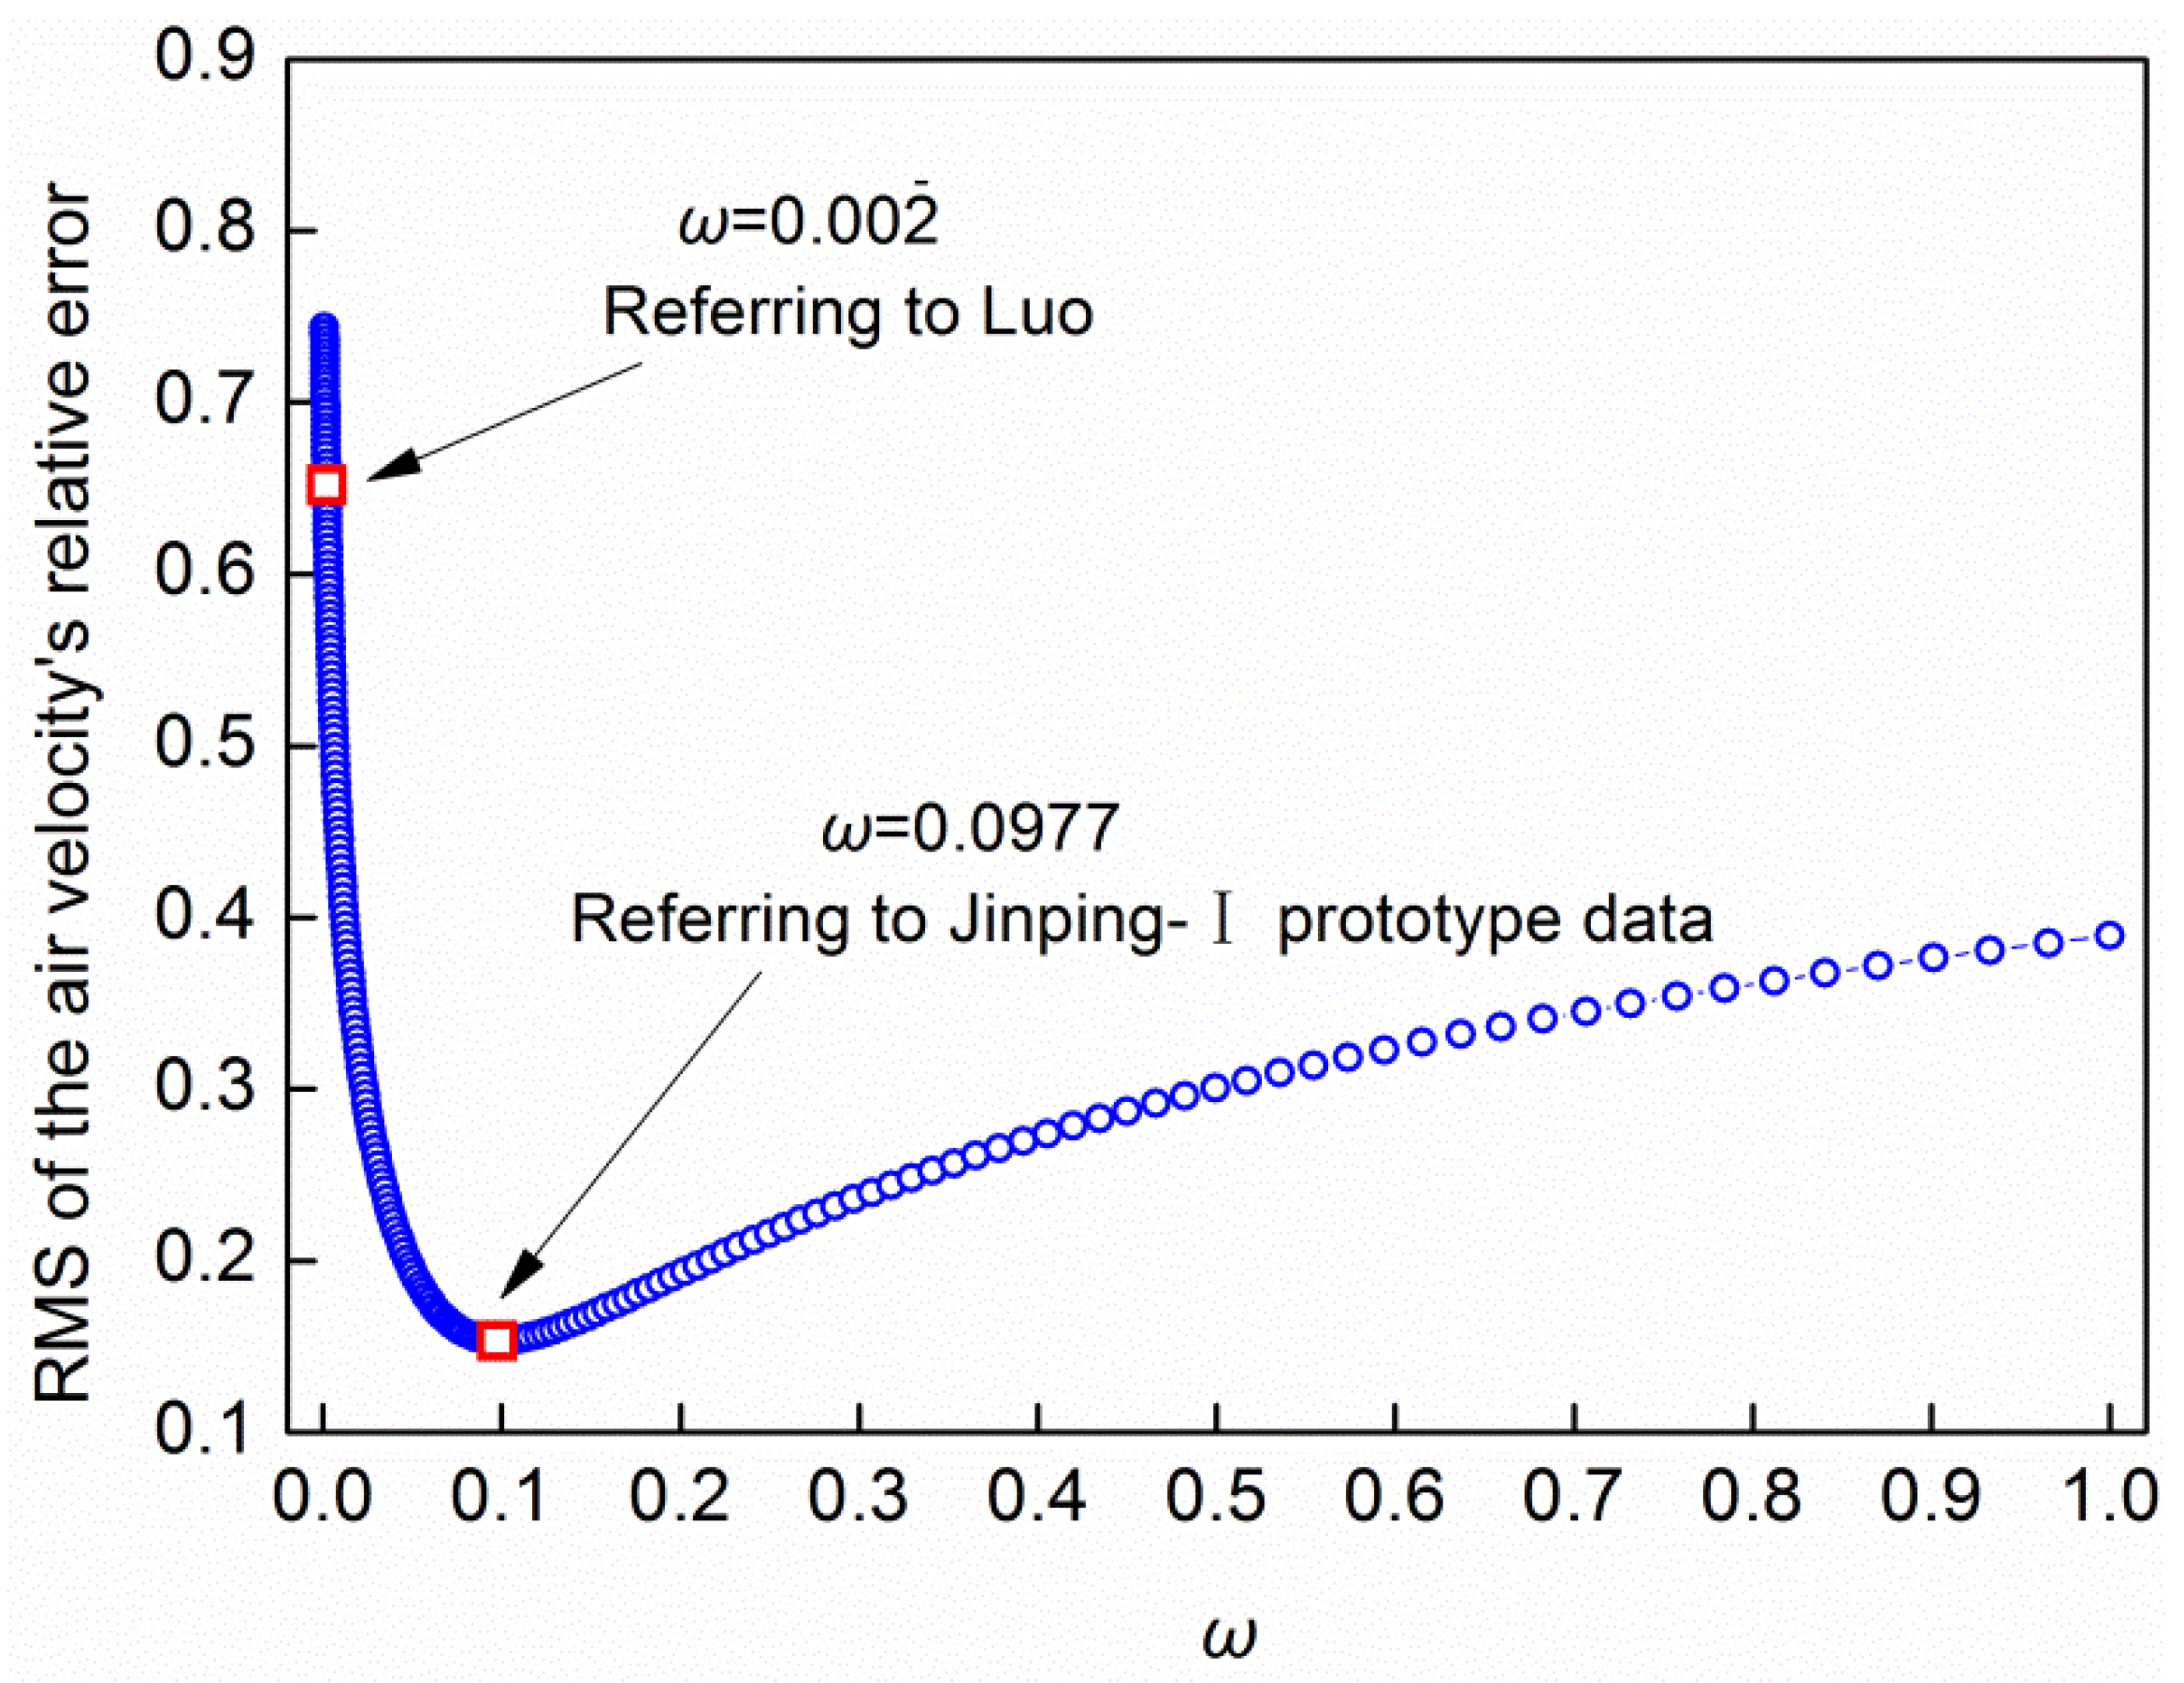
The root mean square (RMS) of the air velocity’s relative error inside the air intake wells between the theoretical value and prototype value is regarded as the criterion. When the RMS reaches its minimum, the theoretical results are the closest to the prototype data.
The RMS of the air velocity’s relative error is defined as
where
is the number of samples and
and
are the actual and the theoretical air velocities in the air intake well, respectively.
Based on the prototype data of the Jinping-I project, the trial of constant term
in Equation (15) is carried out. The trial results are shown in
Figure 6. When
, the RMS of the air velocity’s relative error obtains the minimum value. Clearly, if the constant term is in accordance with Luo (
), the relative error between the calculation results and the prototype data is large.
Equation (15) is obtained by fitting the prototype data. The water head of the early hydraulic structure is relatively small. However, with the increase in the dam height, the water head becomes larger, even reaching up to 220 m in the Jinping-I project. The higher water velocity in the spillway tunnel leads to larger water surface fluctuations, which makes the drag force of the water flow to the air flow increase, so the previous drag coefficient is no longer applicable. The drag coefficient based on the prototype data of the Jinping-I project is expressed as
3.3. Verification Based on the Prototype Data
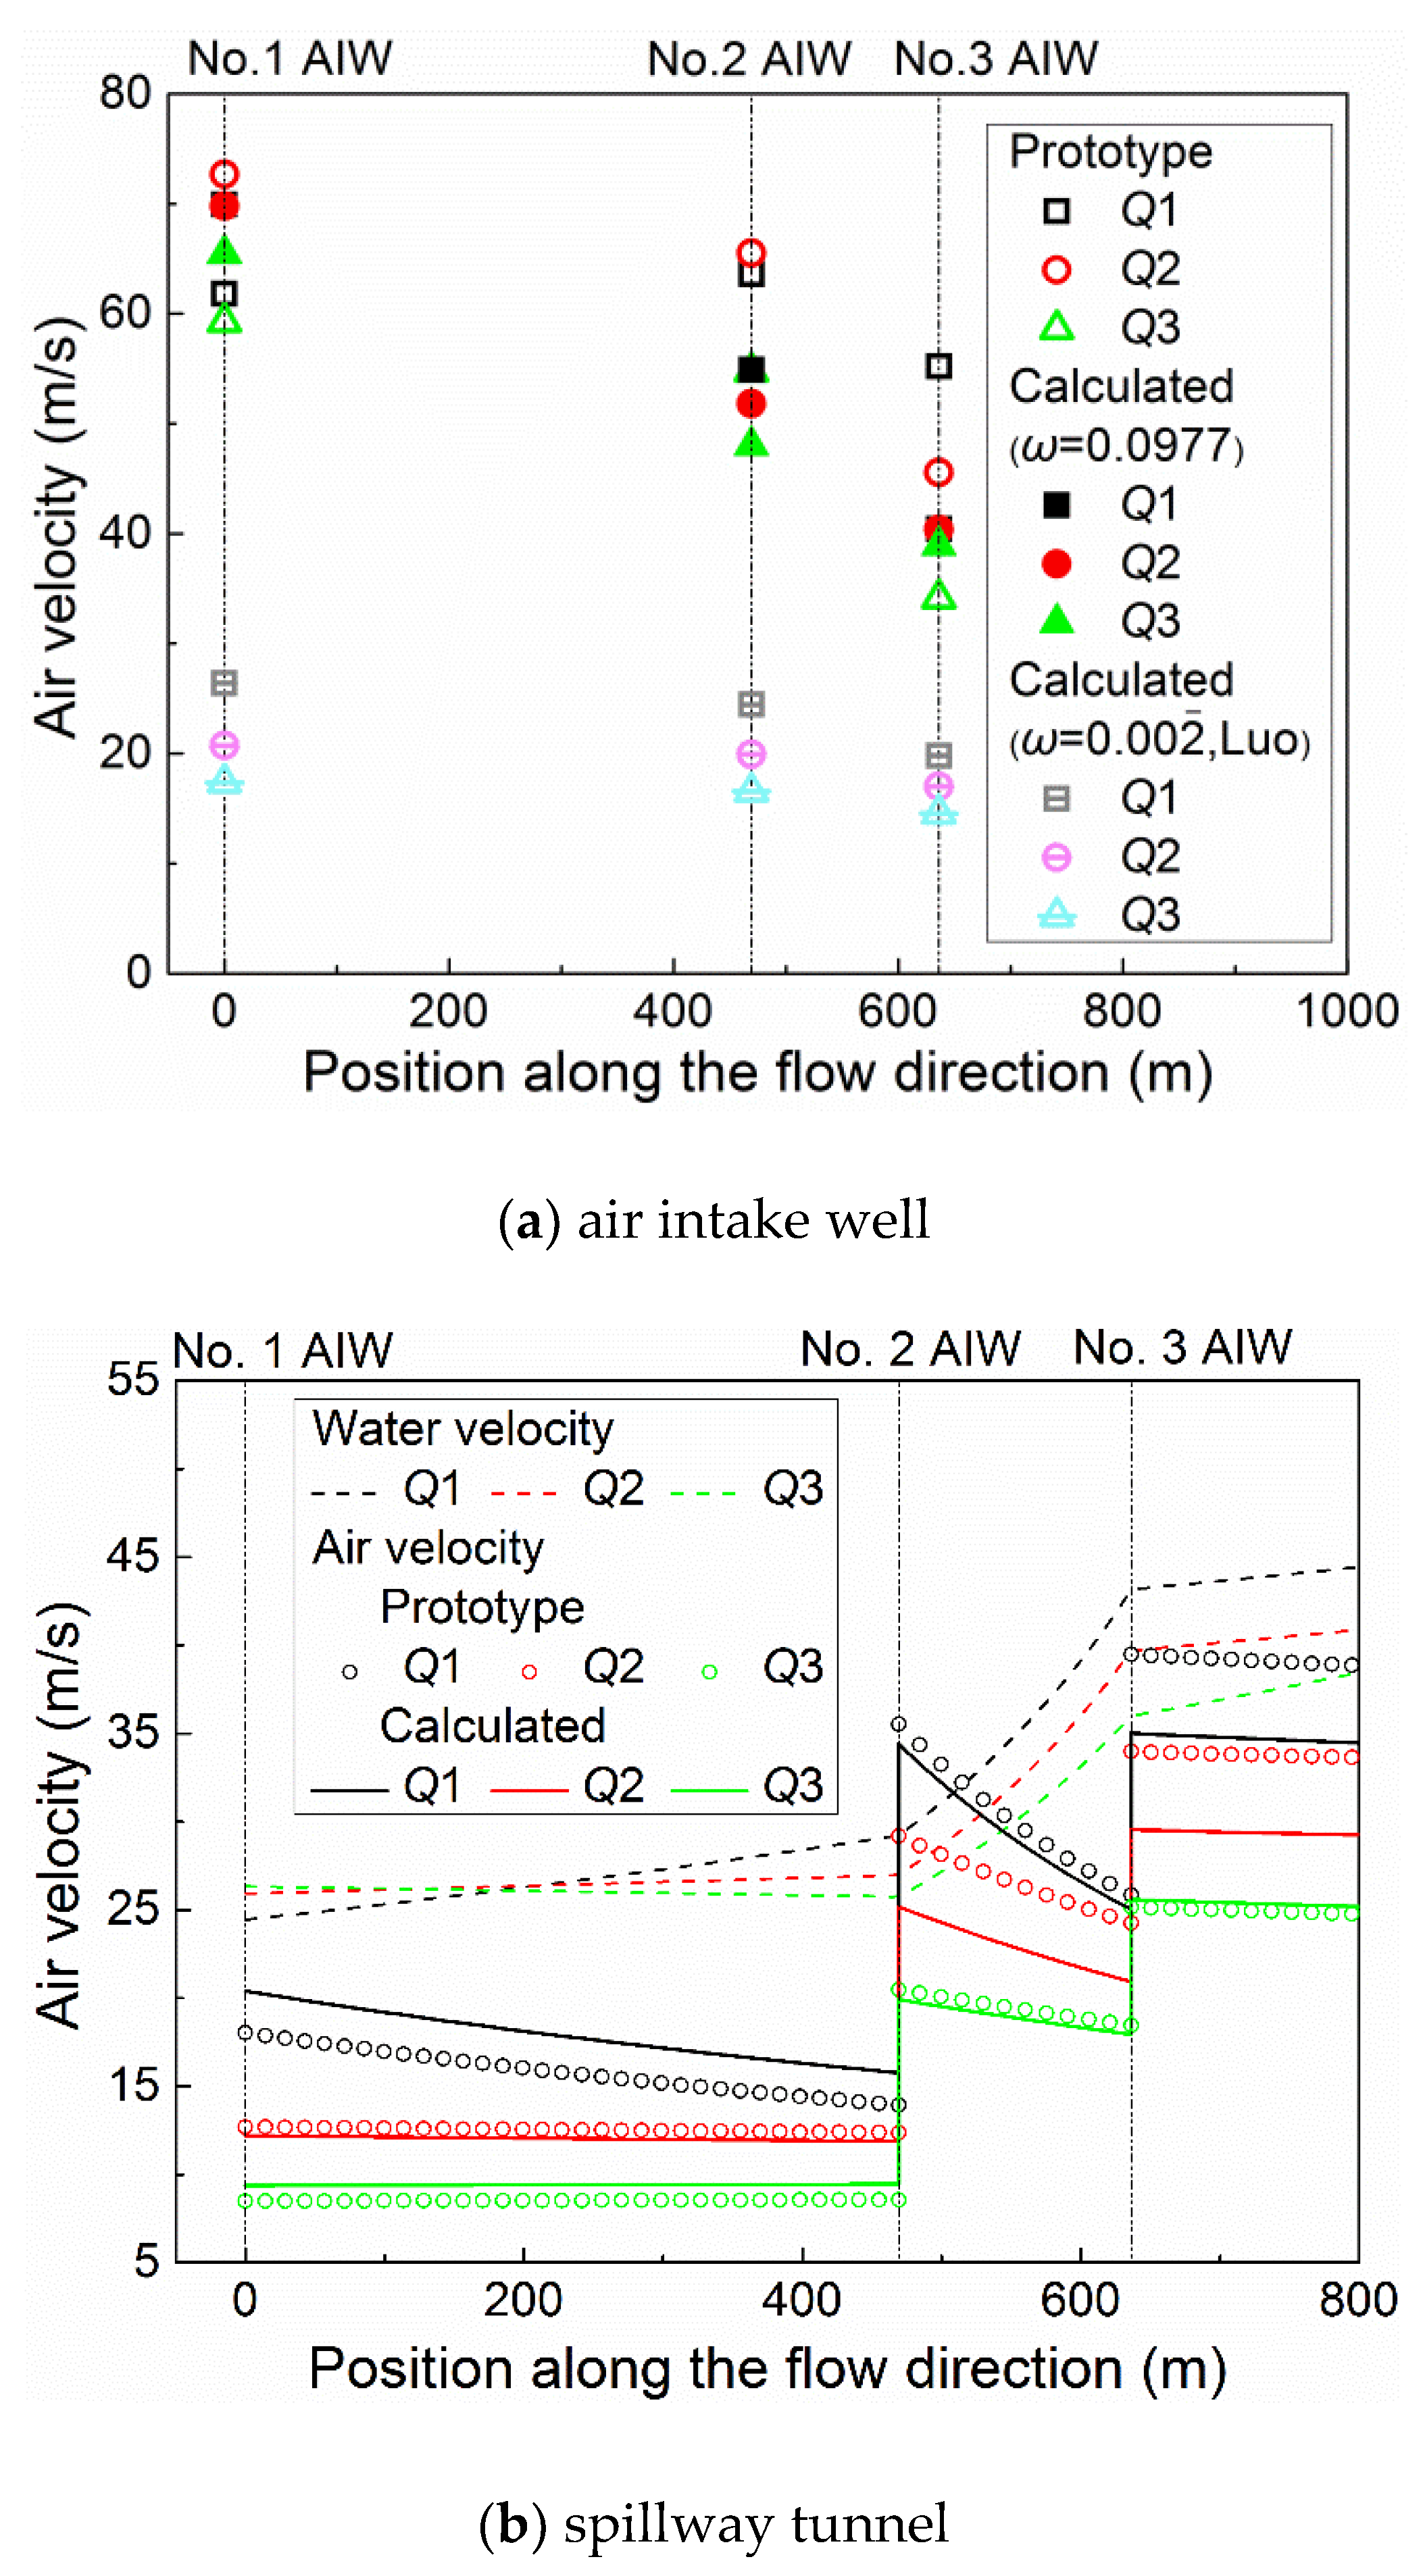
The data at three flow rates were measured in the spillway tunnel of the Jinping-I project: 3200 m3/s (labeled Q1), 2130 m3/s (labeled Q2) and 1462 m3/s (labeled Q3). To validate the established theoretical approach, the theoretical calculations were compared with the prototype data.
The comparison of the actual and the theoretical air velocities of the air intake wells is shown in
Figure 7a. The trend of the theoretical air velocity is consistent with that of the prototype data. In general, the theoretical calculations are approximately 74%~114% of the prototype data with an average relative error of 13%. Compared with the results calculated with the constant term proposed by Luo [
14], it is apparent that the air velocity calculated with the constant term proposed in this study is much closer to the prototype data.
A comparison of the actual and the theoretical air velocities in the water-free space of the spillway tunnel is shown in
Figure 7b. The actual air velocity refers to the average air velocity calculated according to the air velocity inside the air intake well and the cross-sectional area of the air intake well and the water-free space. In general, the air velocity in the water-free space is lower than the water velocity, except at the position of the air intake well, where the air velocity increases sharply due to the inflow of air. Although there are certain differences between the theoretical calculations and the prototype data, the values have the same magnitude and a consistent distribution trend.
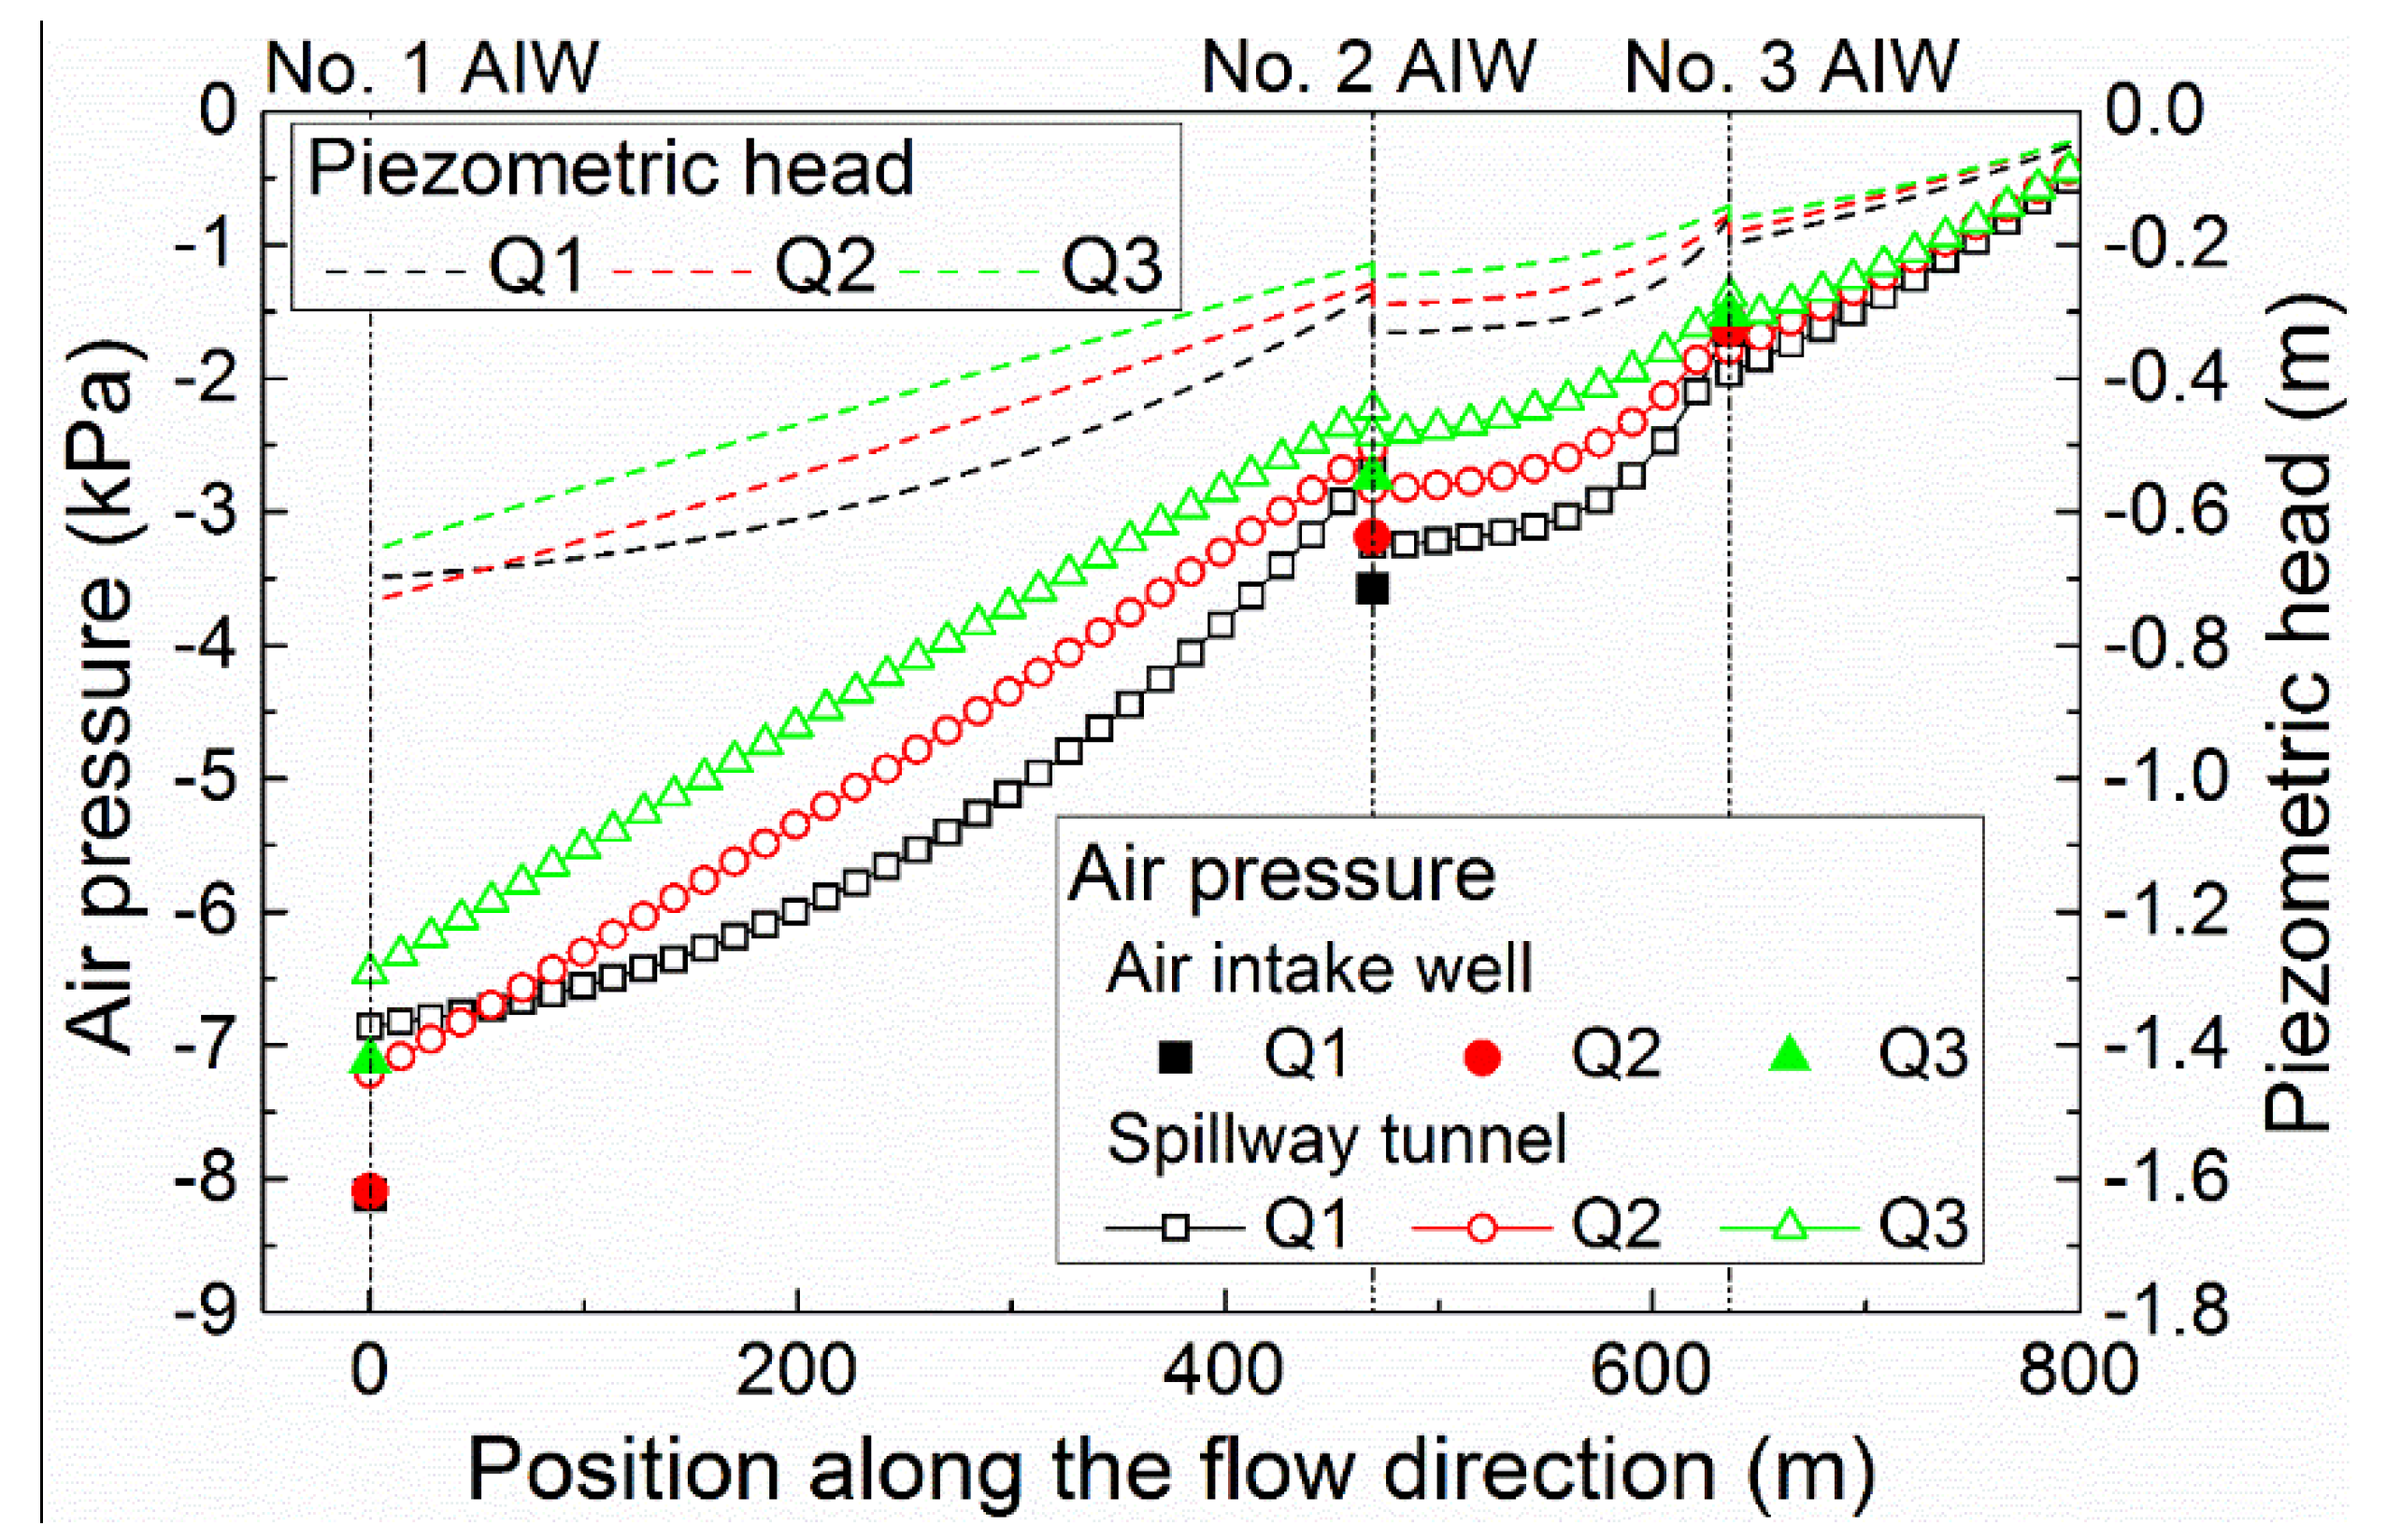
The air pressure in the water-free space of the spillway tunnel calculated by the theoretical approach is shown in
Figure 8. The corresponding piezometric head along the flow direction, divided with the specific weight of the water is also shown in
Figure 8. The maximum sub-pressure appears at the beginning of the free flow tunnel, and along the flow direction, the sub-pressure decreases gradually, reaching up to the atmospheric pressure at the outlet of the spillway tunnel. Due to the inflow of air, a sudden drop in the air pressure occurs at the position of the air intake well. The sub-pressure at the outlet of the air intake well is always higher than that in the water-free space at the same horizontal position, which is related to the decrease in airflow caused by the change in the cross-sectional area. Overall, the distribution of the air pressure in the water-free space of the spillway tunnel is reasonable.
Based on the above analysis results, with a reasonable drag coefficient, the theoretical approach established in this paper can be used to study the ventilation characteristics of multi-intake-well air supply systems in spillway tunnels. In view of the convenience of this approach, the method can be better applied in the design and layout optimization of the multi-intake-well air supply system.
4. Application Example
The ventilation phenomenon of the multi-intake-well air supply system is complex and is affected by factors such as the hydraulic conditions of flow and the spatial layout of the structure. Based on the spillway tunnel of the Jinping-I project, the established theoretical approach was used to analyze the influences of certain structural factors on the ventilation characteristics of the multi-intake-well air supply system. In this part, five changes in structural factors are considered, including the cross-sectional height of the spillway tunnel and the number, location, cross-sectional area and length of the air intake well; only one factor is changed at a time. The influences of these structural factors on the ventilation characteristics are evaluated by four indicators, which are the air velocity and air pressure in the air intake well and the water-free space of the spillway tunnel. The preceding will be introduced separately.
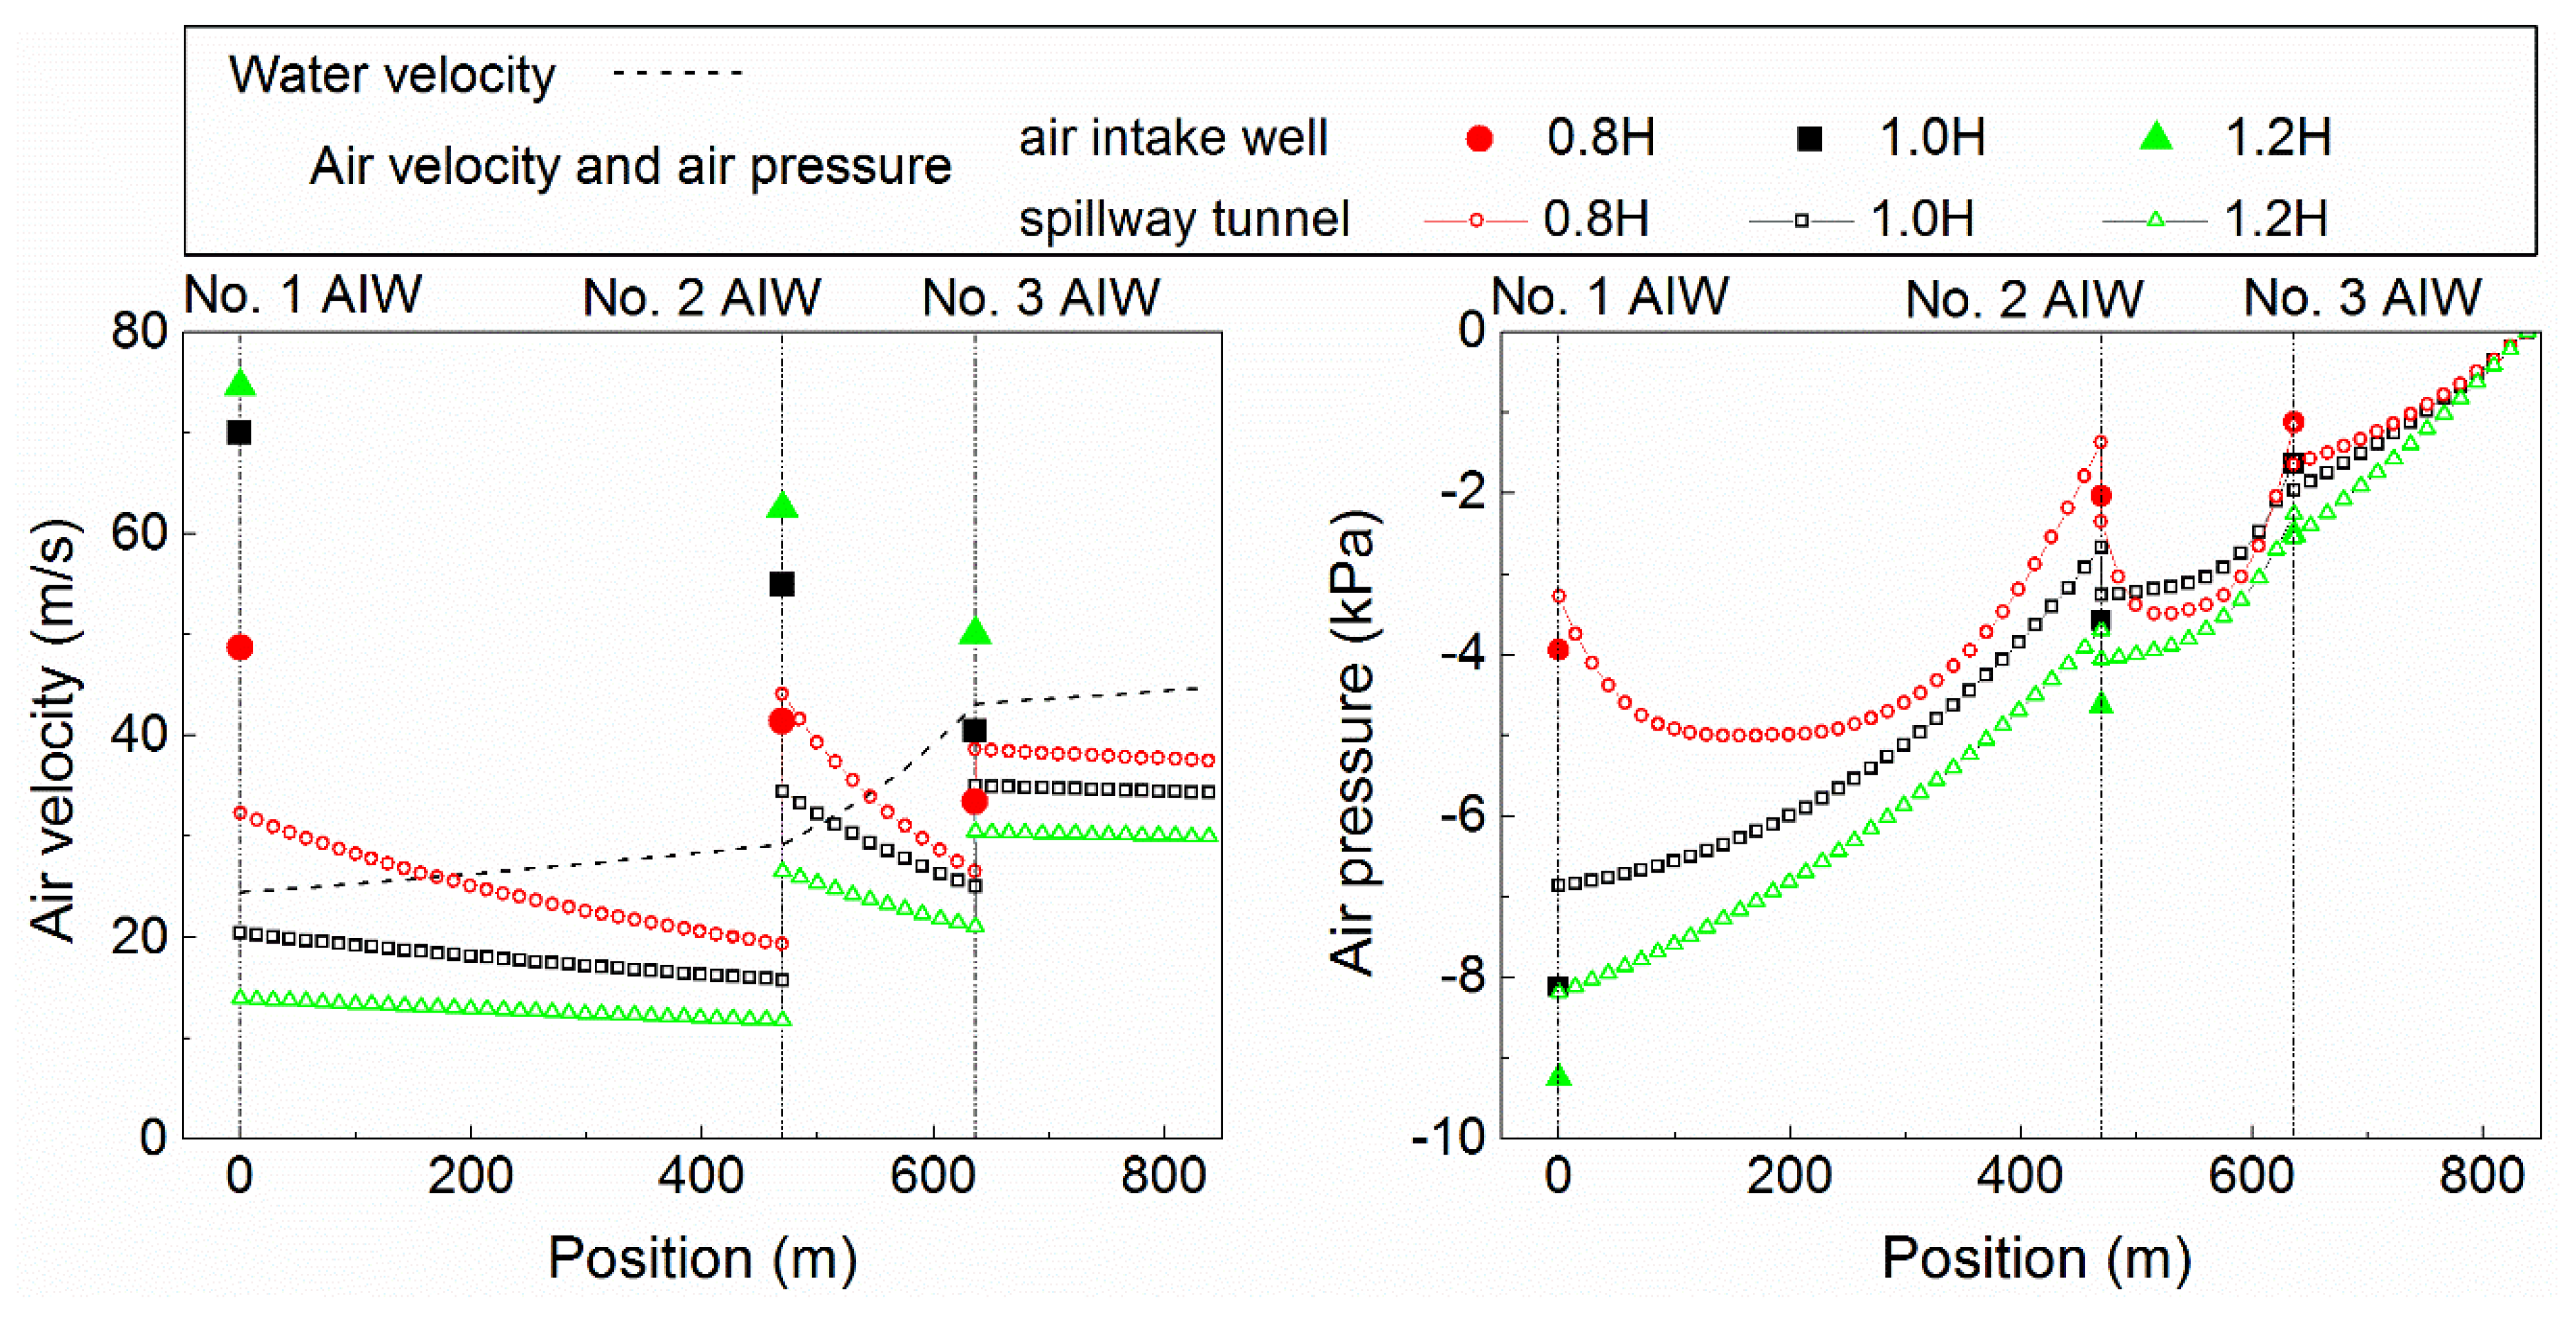
4.1. Influence of the Cross-Sectional Height of the Spillway Tunnel
The cross-sectional height is considered in three cases, in which the cross-sectional height is 0.8 times, 1.0 times and 1.2 times the original height. The air velocity and air pressure in the different cases are shown in
Figure 9. The corresponding total ventilation rates of the air supply system are 3429, 4537 and 5185 m
3/s, respectively.
As observed, with the decrease in the cross-sectional height of the spillway tunnel, the air velocity in the air intake well decreases, while the velocity in the spillway tunnel notably increases. The sub-pressure in the air intake well and the spillway tunnel decrease, as well as the total ventilation rate. The reason is that the cross-sectional area leads to a greater driving force and the resistance becomes higher at the same time at a relatively low rate. Consequently, the variation mentioned above appears.
The analysis indicates that the cross-sectional height of the spillway tunnel has a great effect on the ventilation characteristics of the air supply system at the Jinping-I Dam. It is critical to balance the ventilation rate and air velocity and sub-pressure in the air intake wells and spillway tunnels.
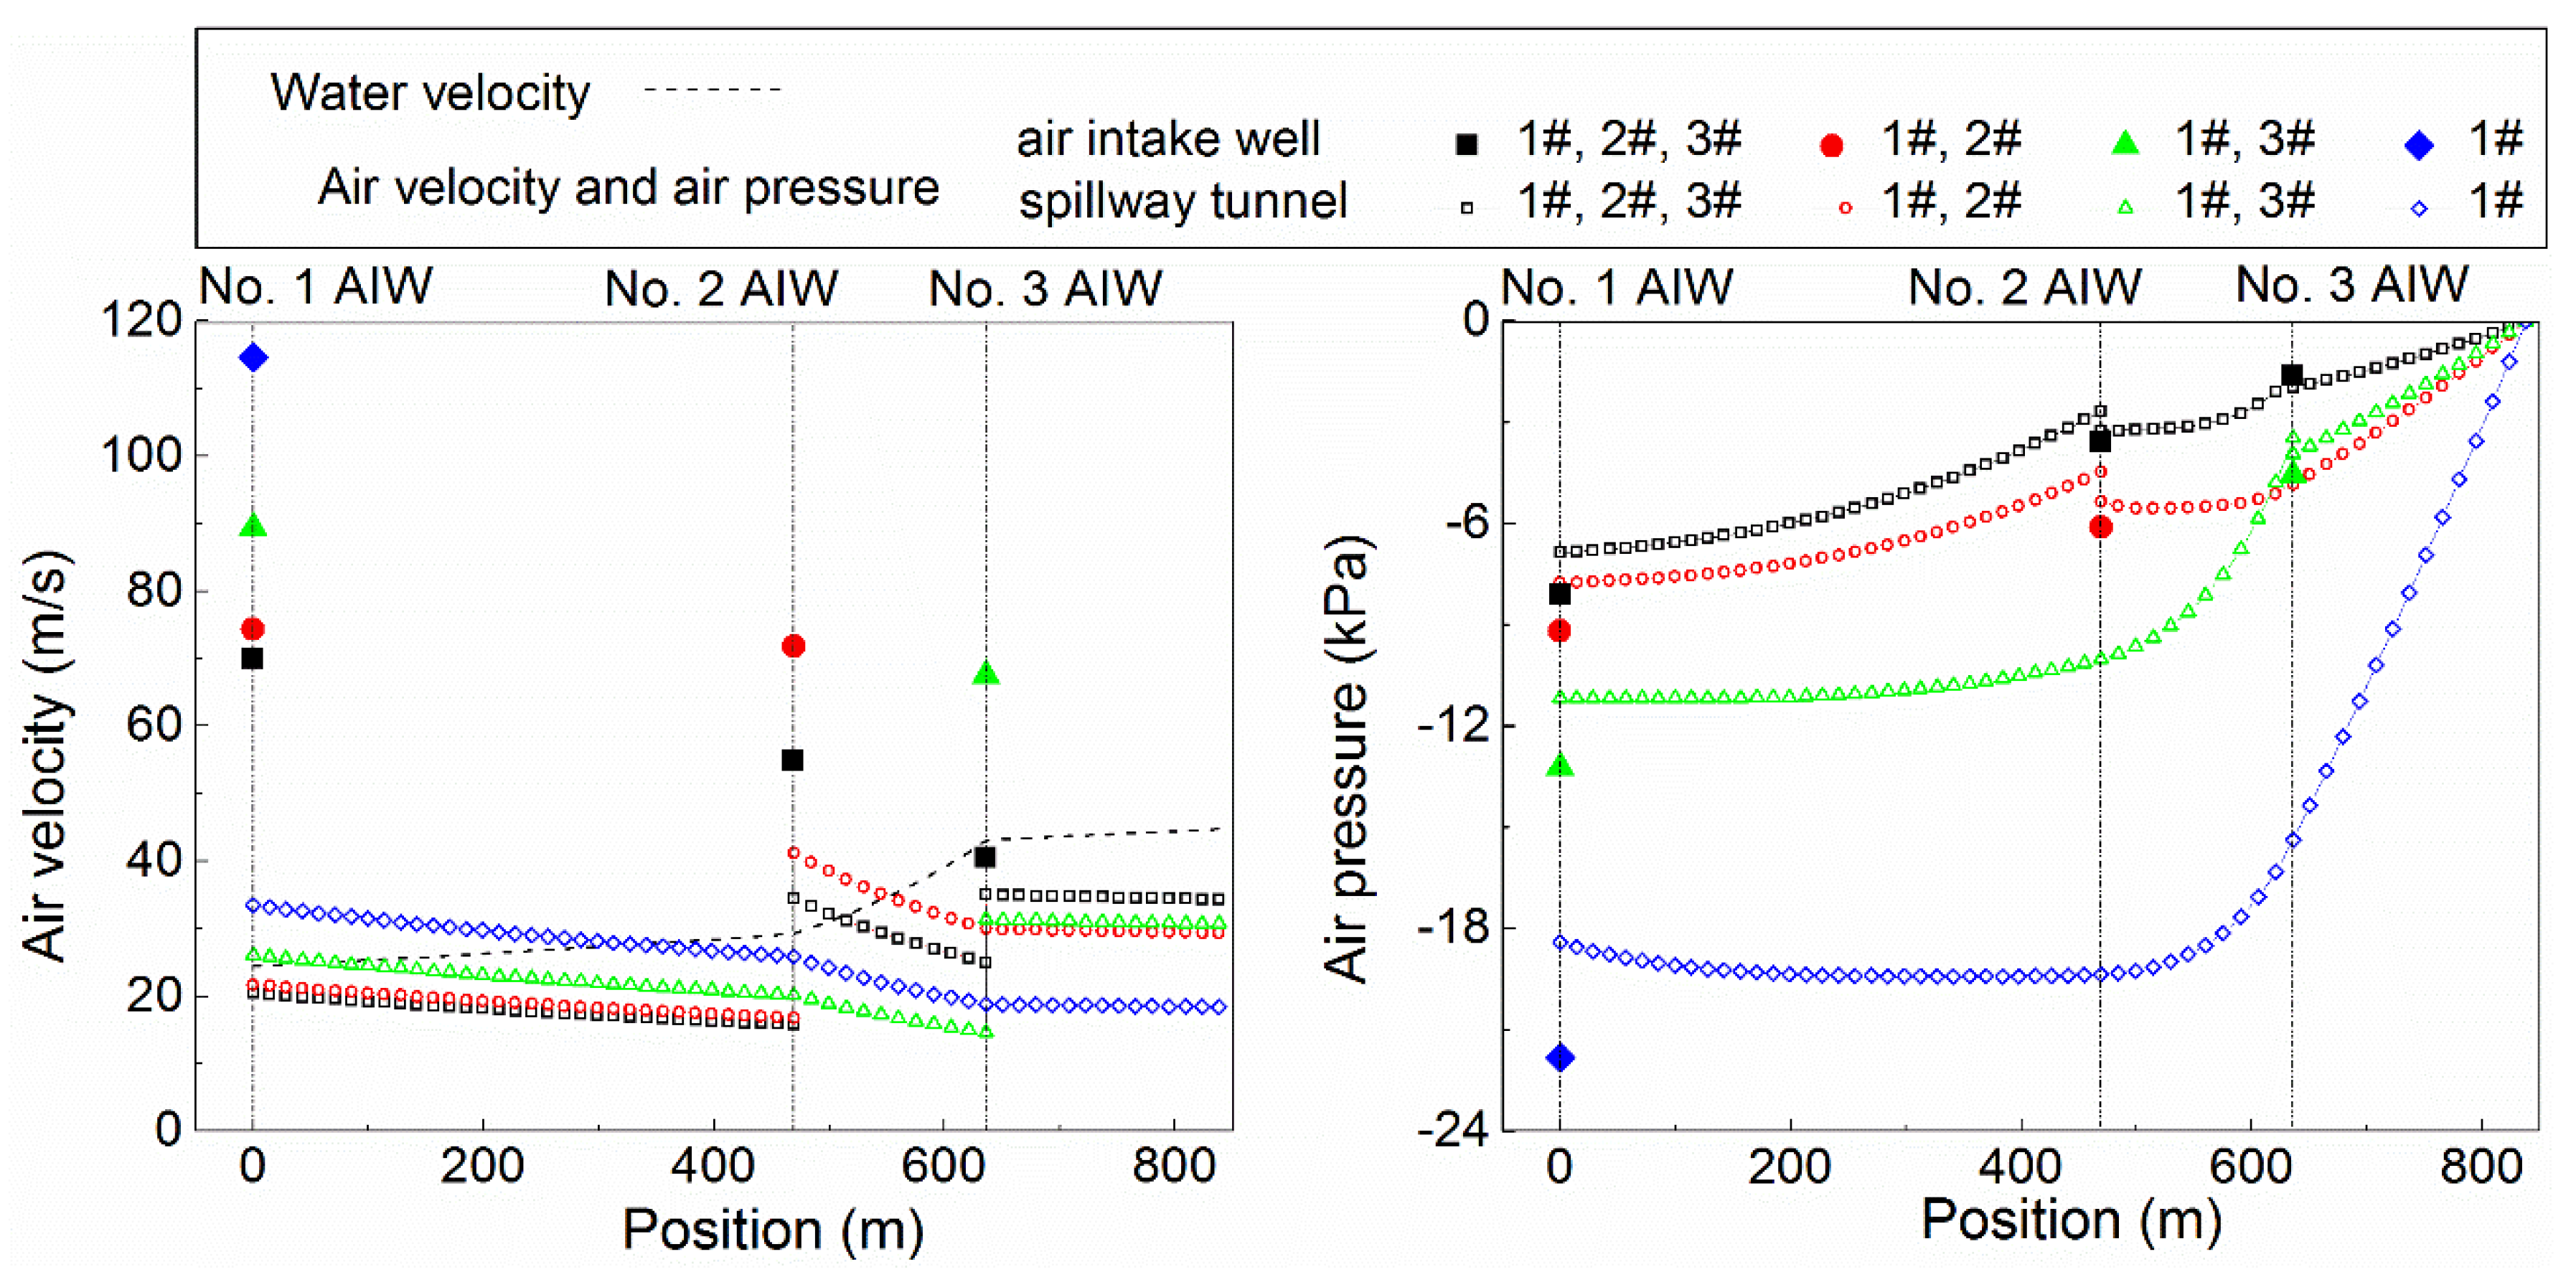
4.2. Influence of the Number of the Air Intake Wells
In this section, four conditions are considered with the change in the number of air intake wells. Condition 1 is that all air intake wells are retained. Condition 2 is that the no. 1 and no. 2 air intake wells are retained, with the no. 3 air intake well removed. Condition 3 is that the no.1 and no. 3 air intake wells are retained, with the no. 2 air intake well removed. Condition 4 is that the no. 1 air intake well is retained, with the no. 2 and no. 3 air intake wells removed. The air velocity and air pressure in the different cases are shown in
Figure 10. The corresponding total ventilation rates of the air supply system are 4537, 3876, 4056 and 2434 m
3/s, respectively.
The air intake well number can influence the ventilation rate directly. The airflow sucked into the spillway tunnel is mainly from the no. 1 air intake well. The no. 2 air intake well, located closer to the no. 1 air intake well, can better share the airflow that is sucked into the spillway tunnel than the no. 3 air intake well. Therefore, compared with the no. 3 air intake well removed, the air velocity and sub-pressure in the no. 1 air intake well increase notably with the no. 2 air intake well removed. When the no. 2 and no. 3 air intake wells are removed, the ventilation rate decreases greatly and is 0.5 times that of condition 1, with three air intake wells retained. The air velocity in the no. 1 air intake well sharply increases, even higher than 110 m/s. The sub-pressure at the end of the no. 1 air intake well sharply increases, even reaching −21 kPa, and the sub-pressure in the spillway tunnel also sharply increases. It is concluded that this condition is highly dangerous for the safety of air supply systems.
The analysis indicates that the number of air intake wells has a large effect on the ventilation characteristics of the air supply system at the Jinping-I project. Using the multi-intake-well air supply system could effectively reduce the sub-pressure in the spillway tunnel and the air velocity in the air intake well.
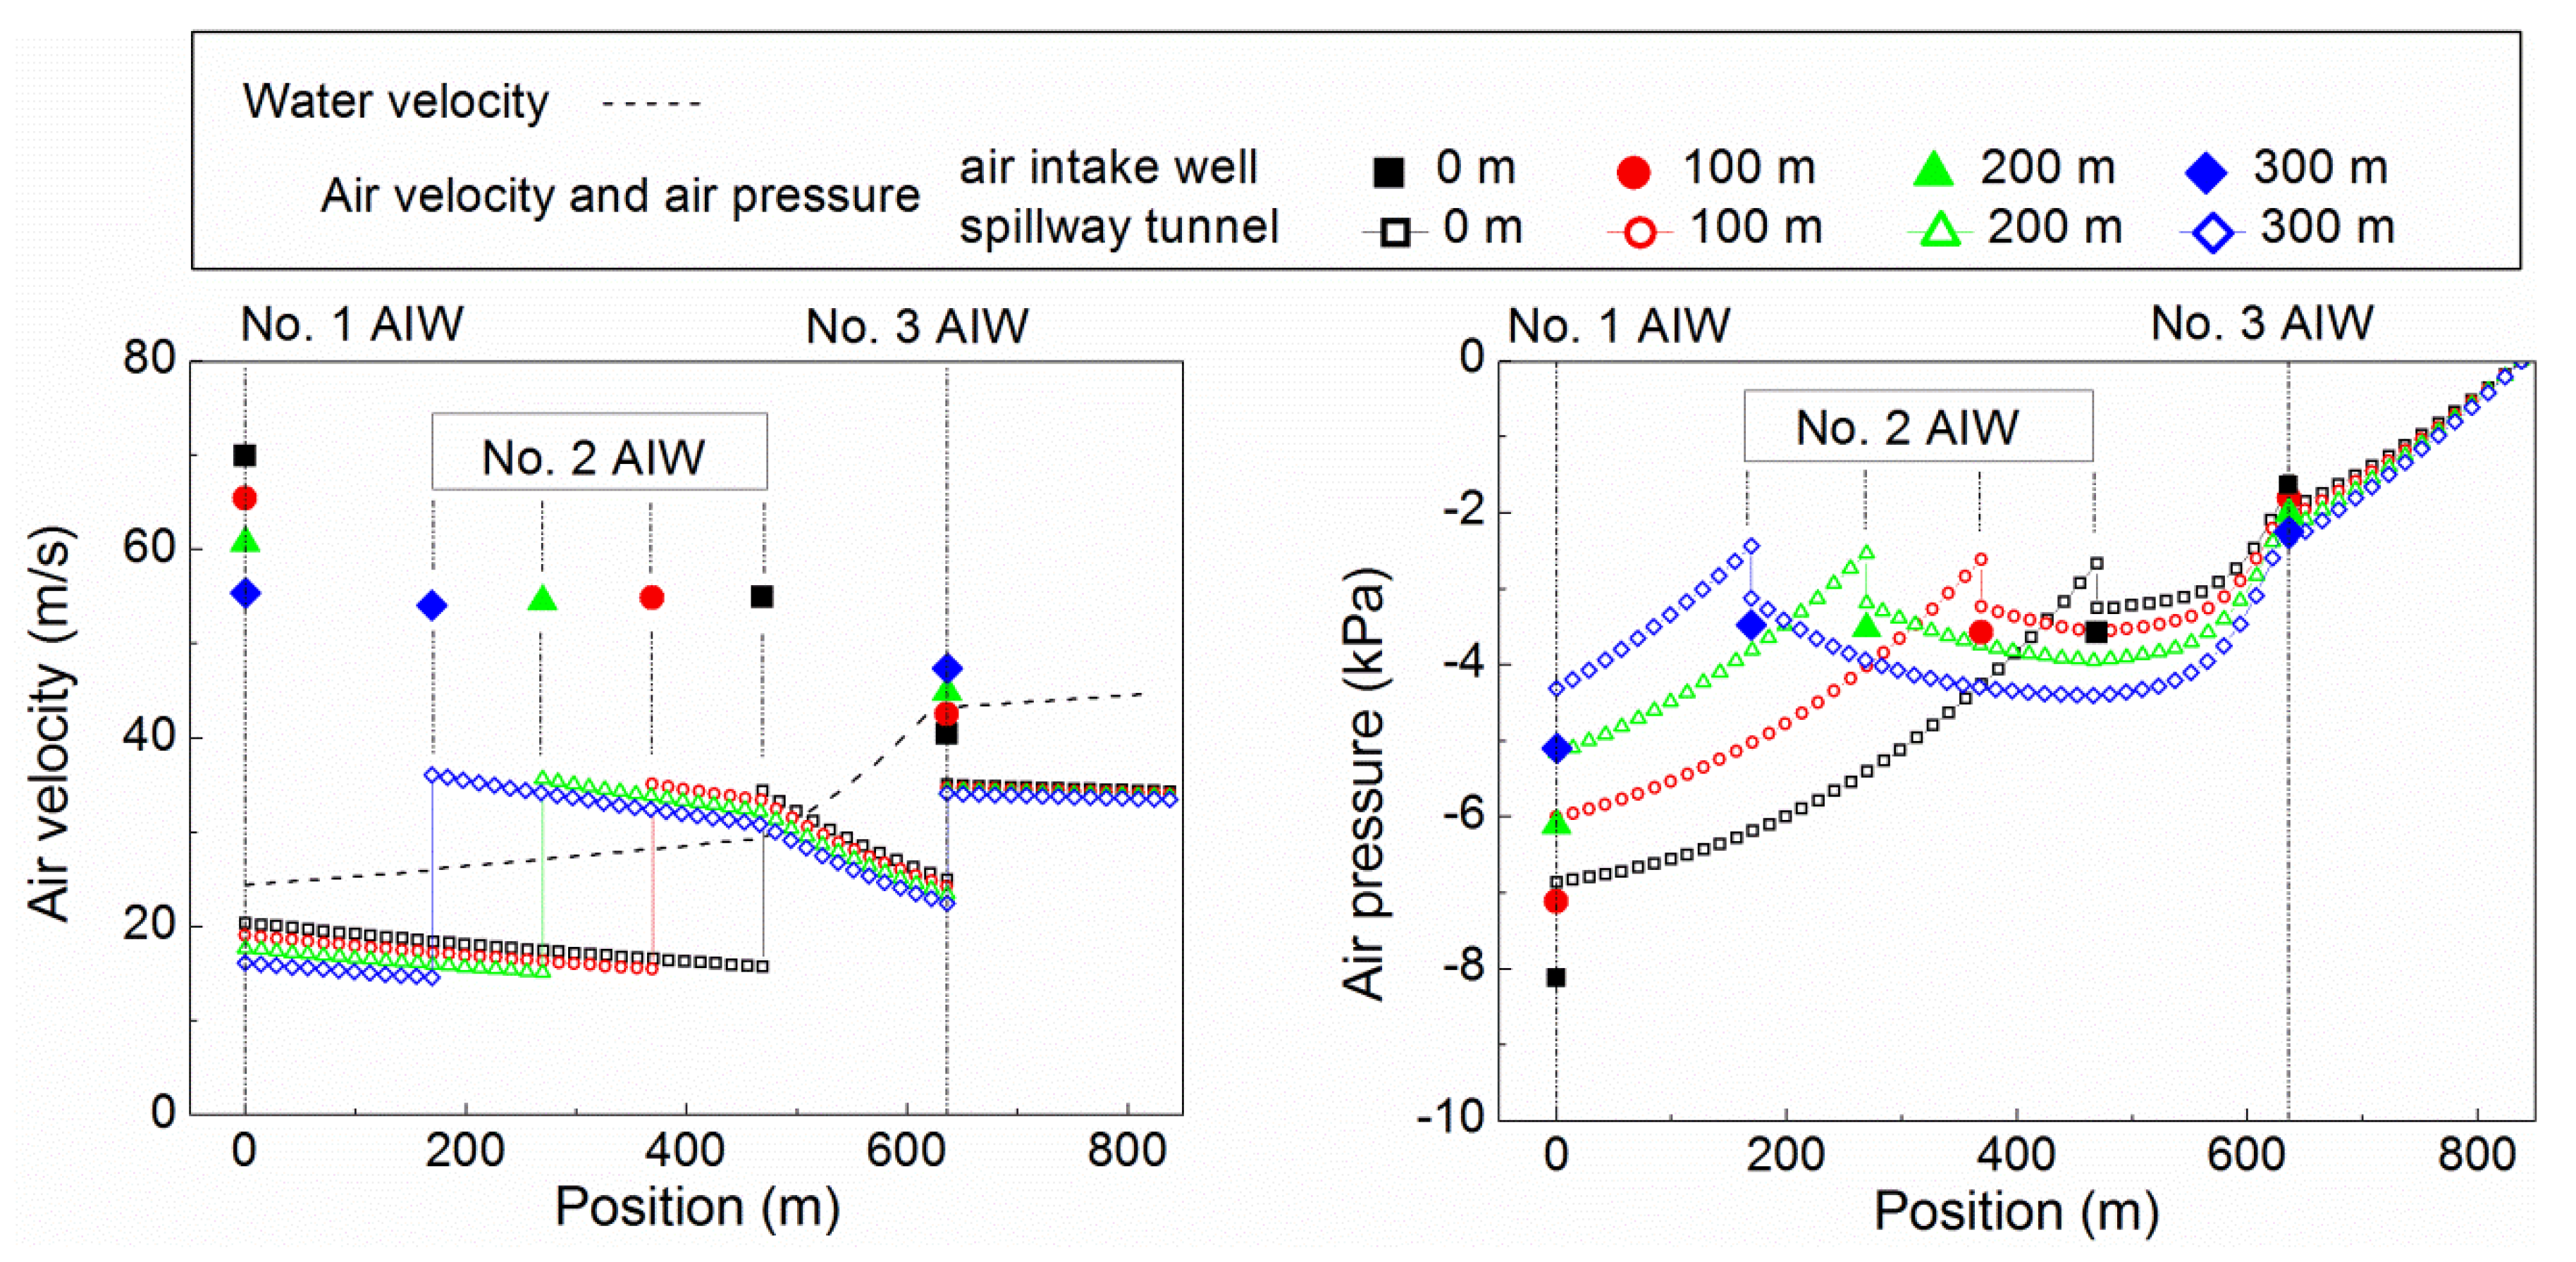
4.3. Influence of the Location of the Air Intake Wells
The ventilation characteristics are studied with the change in the relative position between the air intake well and spillway tunnel. With the locations of the no. 1 and no. 3 air intake wells unchanged, the location of no. 2 moves up along the axis of the spillway tunnel by 0, 100, 200 and 300 m. The air velocity and air pressure in the different cases are shown in
Figure 11. The corresponding total ventilation rates of the air supply system are 4537, 4504, 4467 and 4424 m
3/s, respectively.
With the no. 1 and no. 3 air intake well locations changed, the ventilation rate is basically the same as before. This result is because the sum of the frictional resistance and local resistance changes slightly in the different cases. However, with the no. 2 air intake well moving up, the airflow in the no. 2 air intake well is sucked into the spillway tunnel earlier than before. Consequently, the air velocity in the no. 1 air intake well decreases greatly, and the air velocity in the no. 2 and no. 3 air intake wells increase. Moreover, the sub-pressure in the spillway tunnel between the no. 1 and no. 2 air intake wells decreases greatly, with a more uniform distribution along the flow direction.
The analysis indicates that the air intake well location has a slight effect on the ventilation rate and has a great effect on the air velocity and pressure in the air intake well and spillway tunnel. It is advantageous to have a reasonable air intake well location to obtain a good distribution of the sub-pressure in spillway tunnels.
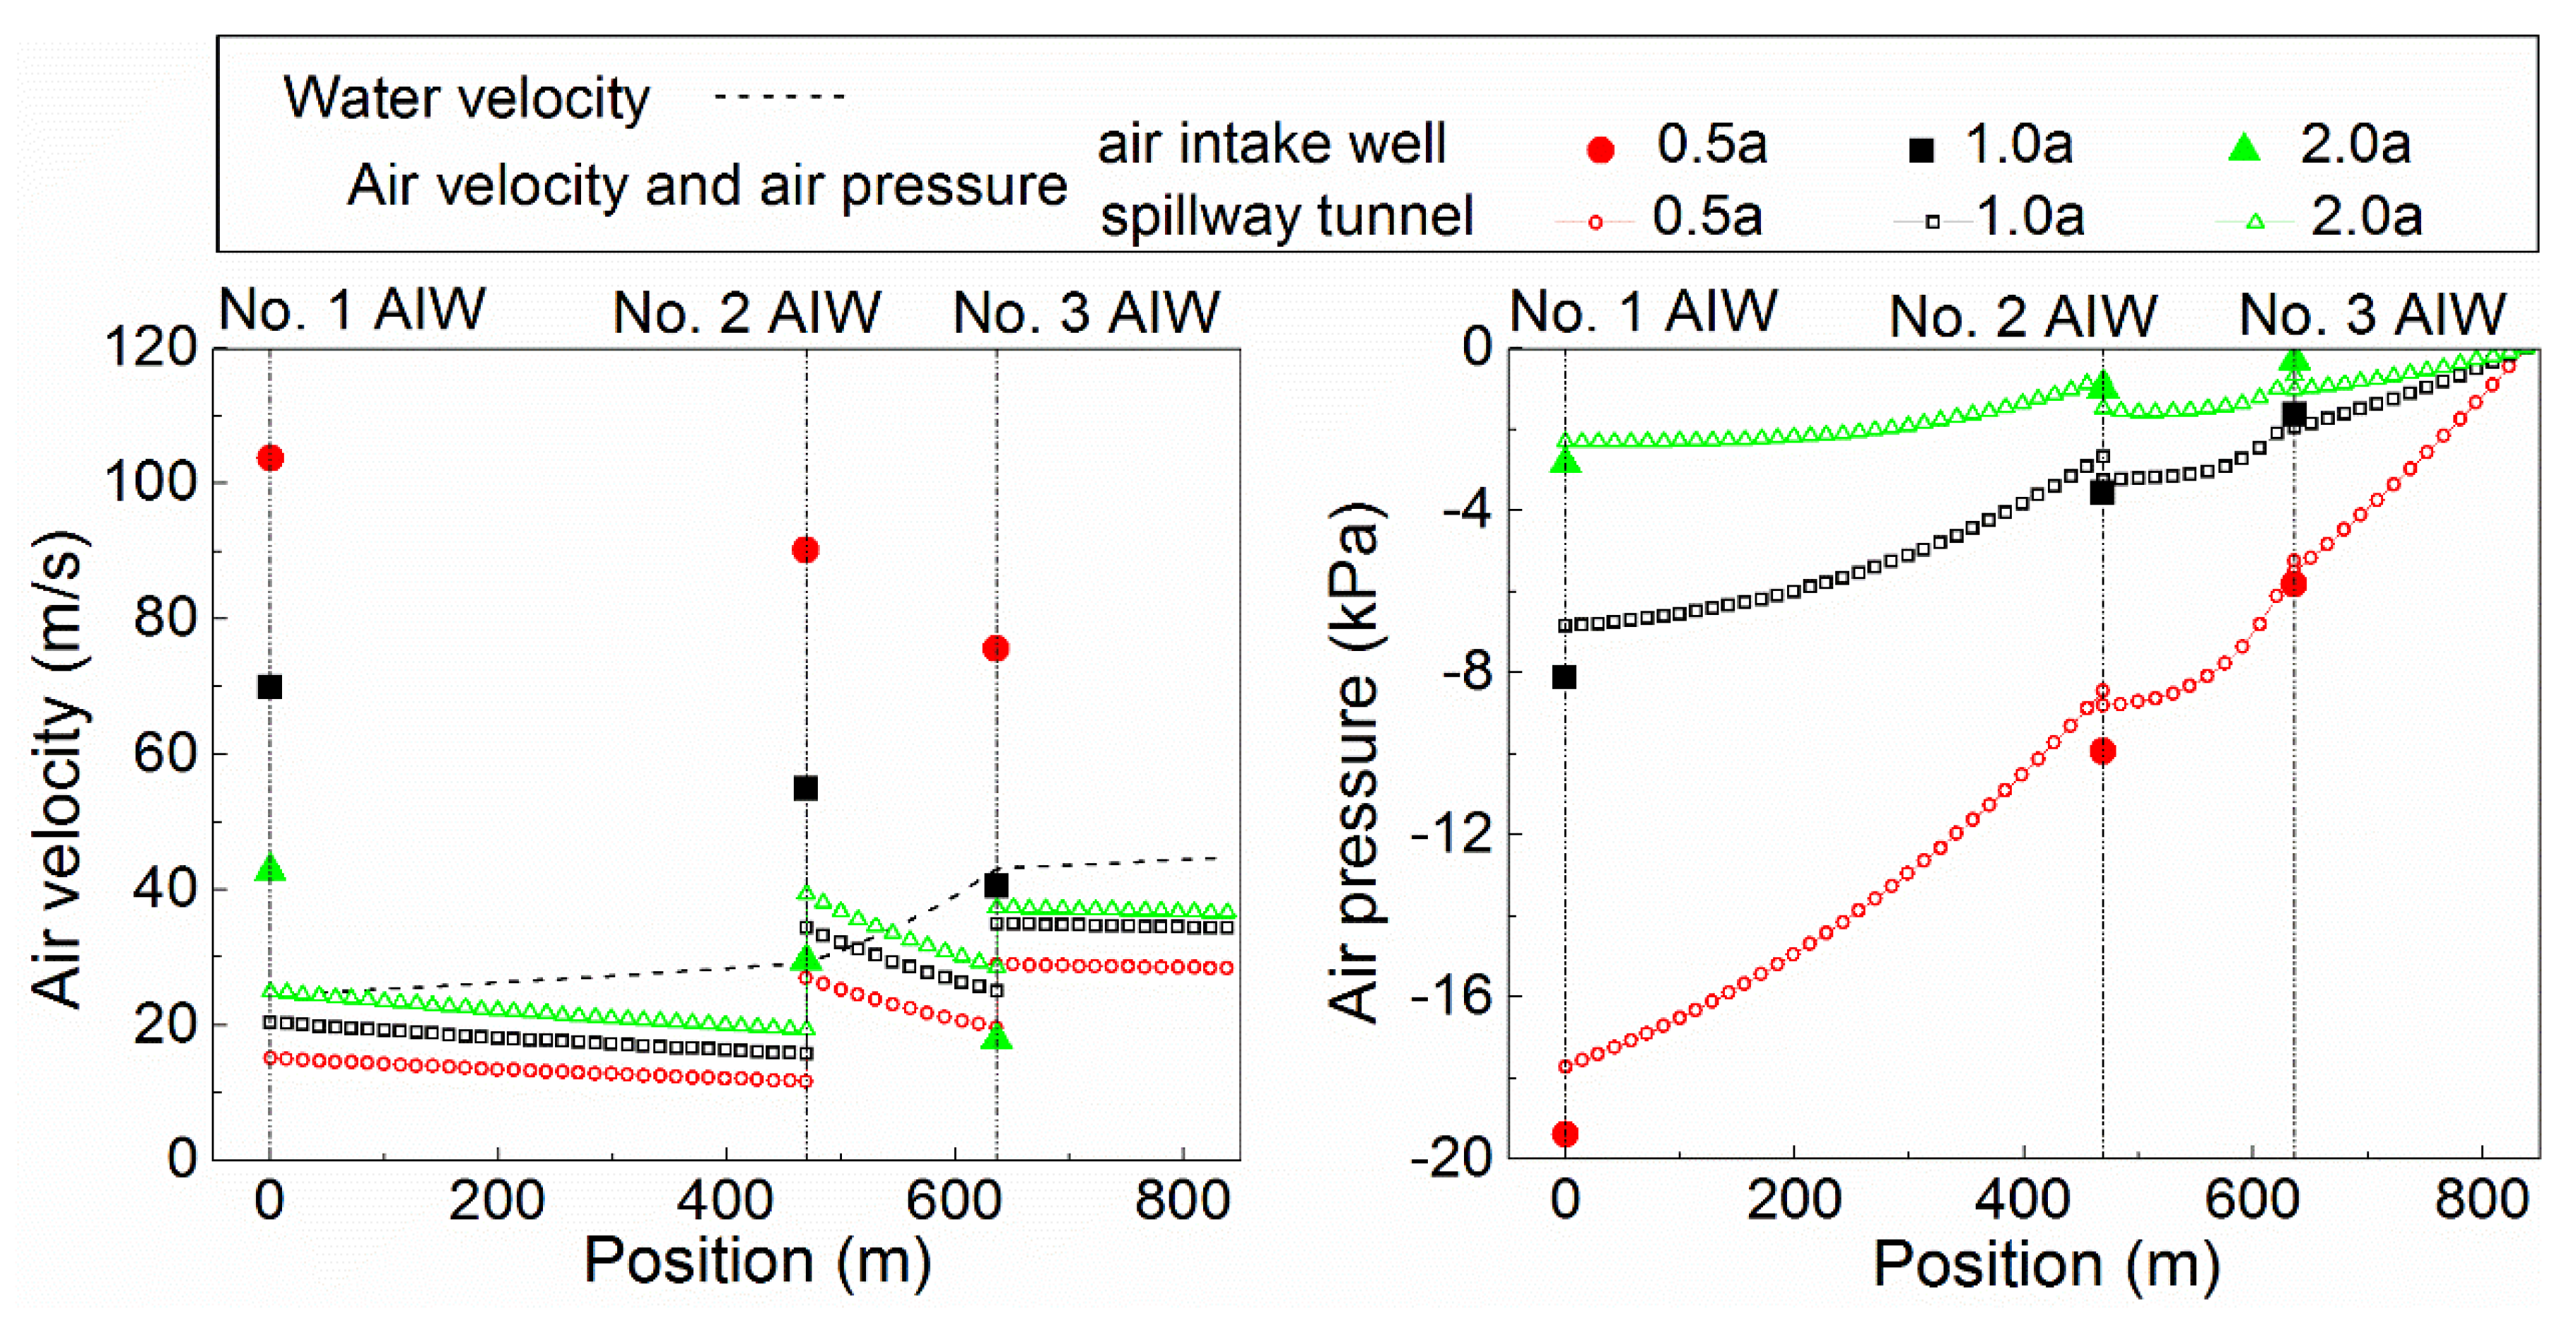
4.4. Influence of the Cross-Sectional Area of the Air Intake Wells
There are three cases of the cross-sectional area of the air intake well, in which the area is 0.5 times, 1.0 times and 2.0 times the original cross-sectional area. The air velocity and air pressure in the different cases are shown in
Figure 12. The corresponding total ventilation rates of the air supply system are 3752, 4537 and 4842 m
3/s, respectively.
The air velocity in the air intake well decreases, but that in the spillway tunnel increases. Moreover, there are sharp decreases in the sub-pressure in the spillway tunnel and air intake well. This result is because the increase in the air intake well cross-sectional area decreases the local resistance coefficient, making the air flow much more smoothly than before. Therefore, irrespective of the cost of cavern excavation, it is better to choose a larger cross-sectional area.
The analysis indicates that the change in the air intake well cross-sectional area has a large influence on the ventilation rate, air velocity and pressure in both the air intake well and the spillway tunnel. Considering the structure safety and stability, it is better to adopt a larger cross-sectional area of the air intake well to allow the air to flow smoothly and decrease the air velocity and air pressure simultaneously.
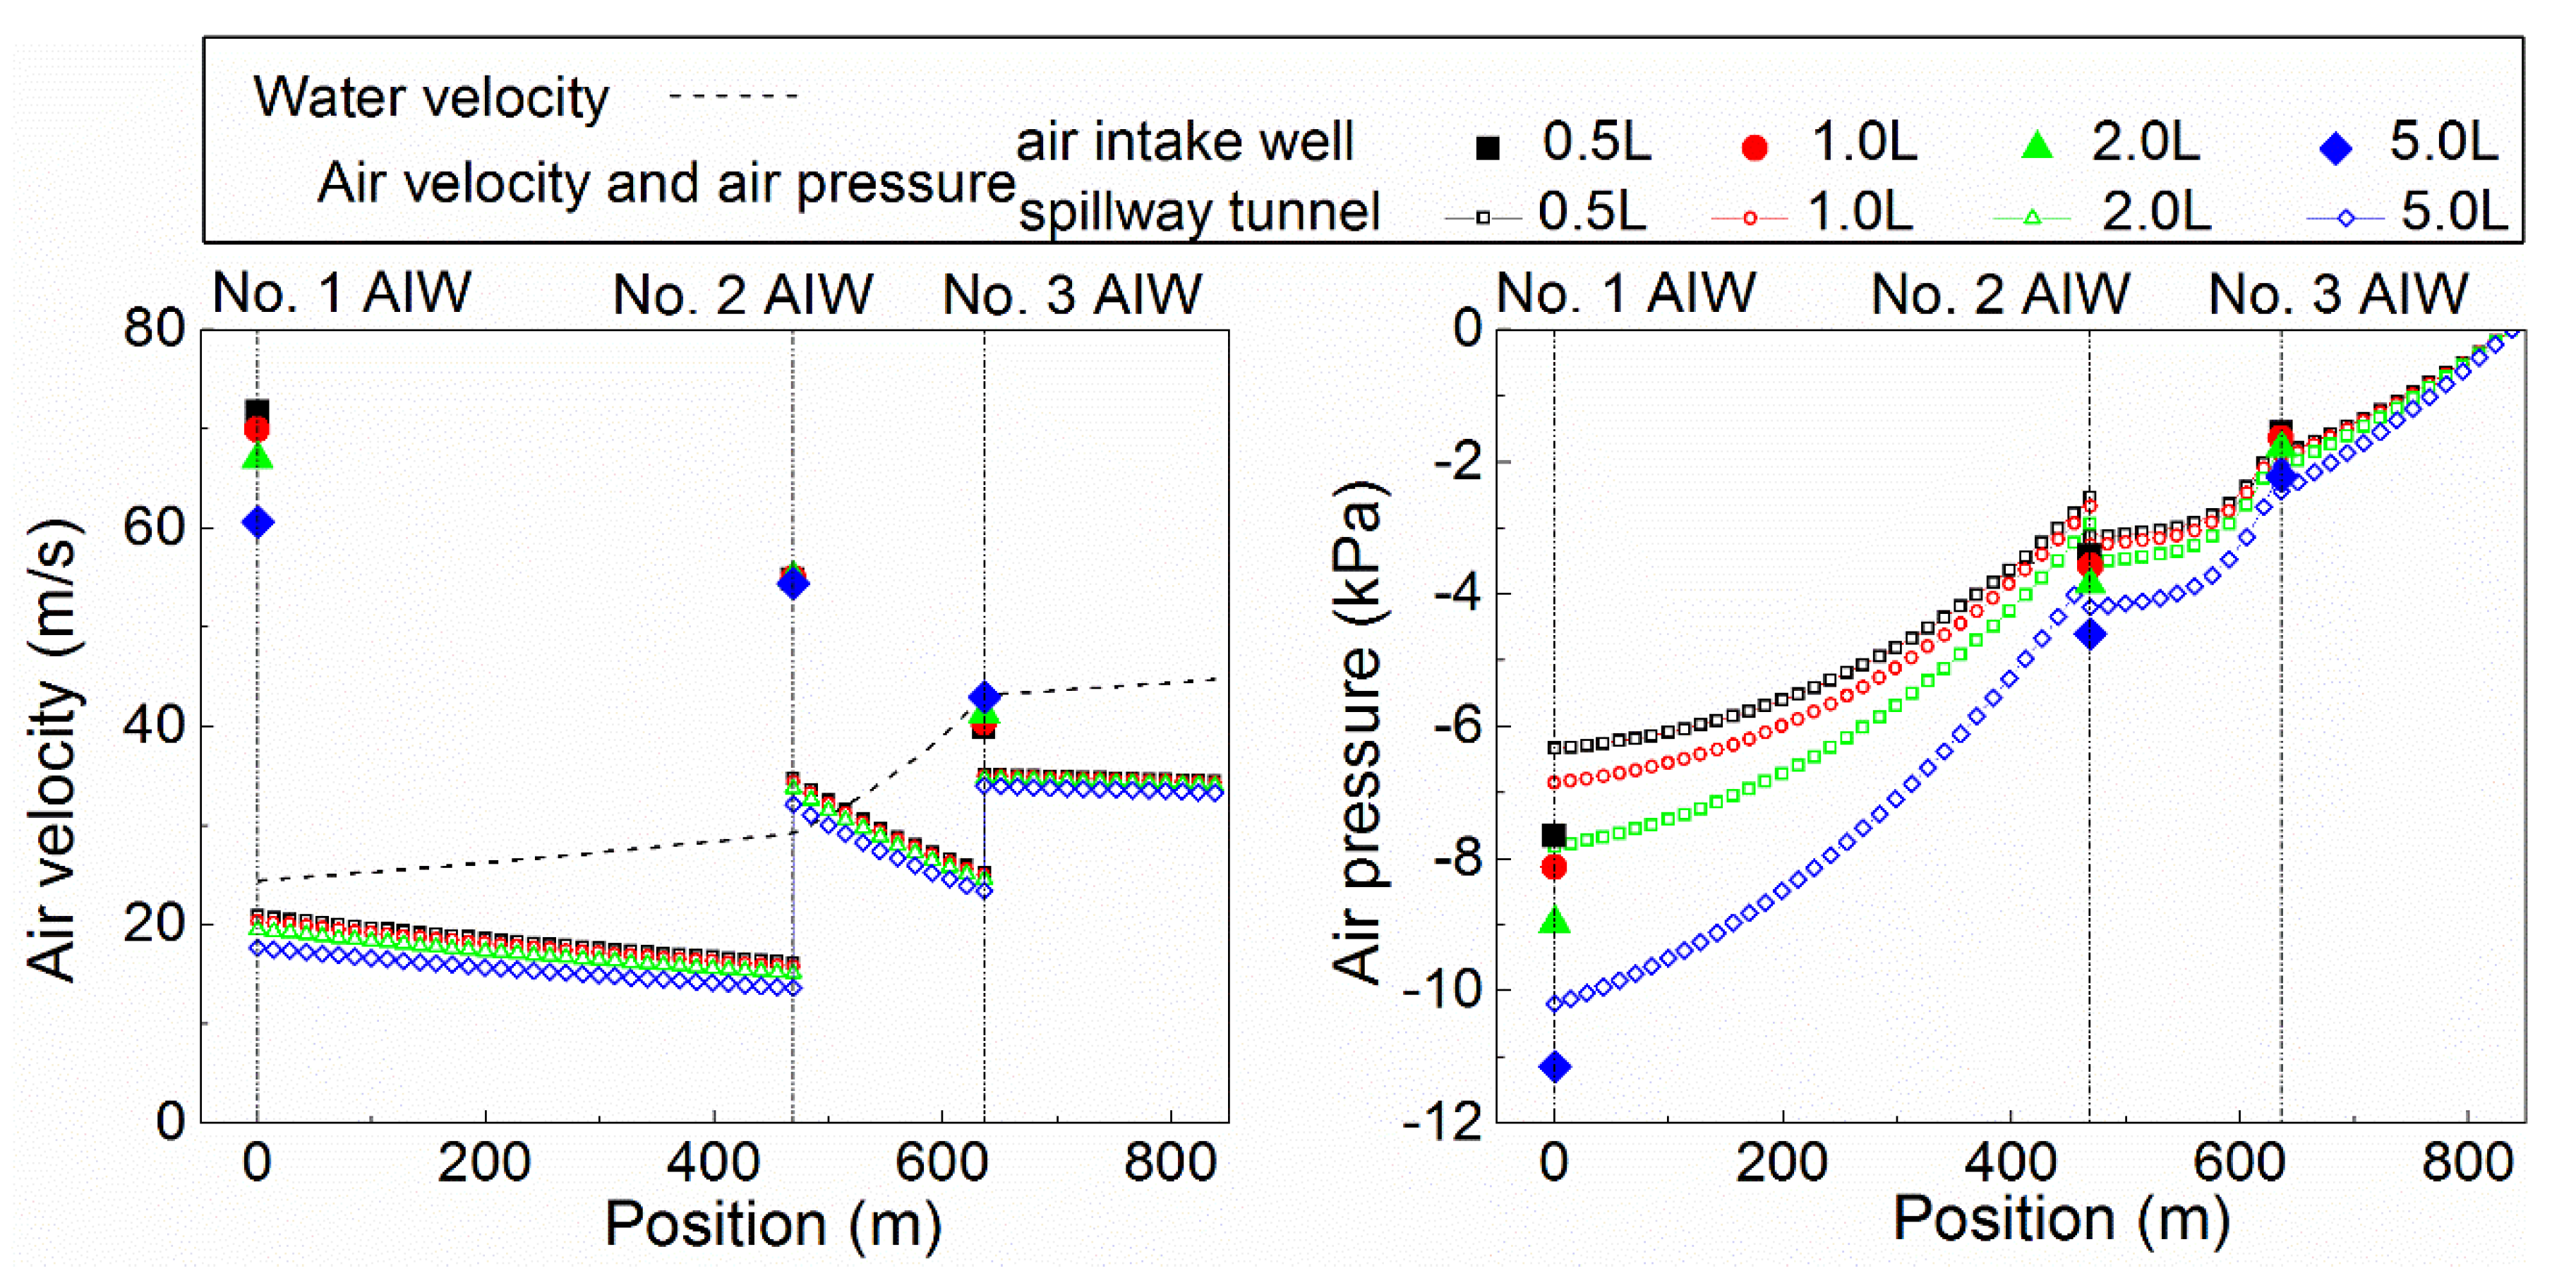
4.5. Influence of the Length of the Air Intake Wells
The influence of the length of the air intake wells is studied in four cases, in which the length is 0.5 times, 1.0 times, 2.0 times and 5.0 times the original length. The air velocity and air pressure in the different cases are shown in
Figure 13. The corresponding total ventilation rates of the air supply system are 4555, 4537, 4502 and 4405 m
3/s, respectively.
The ventilation rate of the air supply system decreases slightly, and the air velocity in the air intake well and spillway tunnel decrease as well. Furthermore, with the increase in the air intake well length, the sub-pressure in the air intake well and spillway tunnel increase slightly. This result is because the influence of the air intake well length on the ventilation characteristics is mainly reflected by the frictional resistance. In hydraulic engineering, the ratio of length to area of the air intake well is very large, causing a small ratio of the frictional resistance to the sum of frictional resistance and local resistance in the air intake well.
The analysis indicates that the air intake well length has a slight effect on the ventilation rate, air velocity and pressure in the air intake well and spillway tunnel. If possible, the selection of a straight air intake well will decrease the local resistance of the airflow, making air flow smoothly and decreasing the air velocity and sub-pressure.
4.6. Brief Summary
The influences of the structural factors on the air velocity and pressure in the spillway tunnel are summarized in
Table 2. Since the air velocity and air pressure are the main indicators to evaluate the ventilation characteristics of the air supply system, then the influences of the structural factors on the ventilation characteristics could be qualitatively evaluated. Generally, the structural factors of spillway tunnels and air intake wells influence the ventilation characteristics to different degrees. The factors of air intake wells (including the cross-sectional area, location and number) have large influences, while the factor of air intake well length has a slight influence on the ventilation characteristics. Moreover, the factor of spillway tunnel height also greatly influences the ventilation characteristics.
5. Conclusions
In this study, a brief theoretical analysis method on evaluating the ventilation characteristics of the multi-intake-well air supply system is established. This method is derived from the Bernoulli equation and the mass conservation equation at the steady state, and it takes into account the confluence and diversion of the air flow. By this method, the air velocity and air pressure, and their spatial distribution features in each air intake well and in the spillway tunnel can be obtained. Verification is conducted on the brief theoretical analysis method by taking the spillway tunnel of Jinping-I project as a typical example. The comparison of the theoretical results with prototype data indicates that the proposed method is applicable to analyze the ventilation characteristics of multi-intake-well air supply systems. And it is found that the drag coefficient at the air-water interface is essential to estimate the ventilation characteristics by the proposed method, and further research is needed on deamination of this parameter value, especially when the water velocity is very high.
Besides, the influences of structural factors of the spillway tunnel and air intake well on the ventilation characteristics are thoroughly studied with this theoretical analysis method. The results of theoretical analysis indicate that the changes in cross-sectional area, position and number of air intake wells have large influences on the ventilation characteristics. The change in the height of the spillway tunnel has a large influence on the ventilation characteristics, too. However, the influence of the change in the length of the air intake well on the ventilation characteristics is slight. In order to effectively improve the operating condition in the air supply system, it is better to apply a multi-intake-well air supply system, arrange a reasonable position of the air intake well and adopt a larger cross-sectional area of air intake well as well as a suitable height of the spillway tunnel. The proposed theoretical analysis is helpful for structural optimization of the multi-intake-well air supply system from the perspective of ventilation characteristics.


