Article

A New Diffuse Optics Emitter for High Visual Diffuse Transmission Density Measurement

1
Div. of Optics, National Institute of Metrology, Beijing 100029, China
2
Photonics and Sensors Group, Department of Engineering, University of Cambridge, Cambridge cb3 0fa, UK
3
School of Printing and Packaging Engineering, Beijing Institute of Graphic Communication, Beijing 102600, China
4
State Grid Beijing Electric Power Company Training Center, Beijing 100041, China
*
Author to whom correspondence should be addressed.
Appl. Sci. 2019, 9(14), 2774; https://doi.org/10.3390/app9142774
Submission received: 6 June 2019 / Revised: 24 June 2019 / Accepted: 6 July 2019 / Published: 10 July 2019
(This article belongs to the Section Optics and Lasers)

Abstract

:

Featured Application

This technology can be used to evaluate photographs and achieve optical density (OD) calibration, including non-destructive testing (NDT), DNA microarrays in Biosensors and Bioelectronics, human bone image, fMRI cortical mapping, etc.

Abstract

In visual diffuse transmission density measurement, it is hard to measure optical density (OD) up to 6.0 because the signal to noise is more than 10E-06. Thus, there are only two methods to find the measurement. One is using a highly sensitive detector with low background noise, and the other is improving the incident light flux with a wide spectrum, including visual scope. A new diffuse optics emitter was designed to realize OD measurements up to 6.0. It uses 235 optical fibers on a hemisphere to collect and feed in the incident flux, then emits this flux by a diffuse opal. Thus, an incident light with a high diffuse coefficient and high incident flux was realized for high OD measurement. This emitter has been used in the new national reference of National Institute of Metrology, China (NIM) for diffuse transmission optical density. According to the measurement result in this reference, the OD can be measured up to 6.6.

1. Introduction

Diffuse transmission optical density is an important optical property of many materials, such as exposed films, special filters, etc. [1,2,3,4]. It is widely used for quality control in many advanced applications in diffuse optical spectroscopy [5,6,7,8,9,10]. For example, it is used to evaluate photographs and achieve optical density (OD) calibration, including non-destructive testing (NDT), DNA microarrays in Biosensors and Bioelectronics, human bone image, fMRI cortical mapping, etc. [11,12,13,14,15,16]. With the rapid development of Biosensors and Bioelectronics and fMRI, the precise request for OD measurement is changing. The measurement range has expanded and the precision has improved at the same time [17,18,19,20,21,22]. In many requirements, it should be measurable up to 6.0. Many old diffuse optical instruments, including most national standard density instruments in many countries, cannot satisfy these new measurement demands. Therefore, how to expand the measurement range and decrease uncertainty at the same time is the new challenge in diffuse optical spectroscopy [23,24,25].
According to the definition of visual diffuse transmission density D T as shown in Equation (1), where ϕ i is the incident diffuse light flux and ϕ τ is the transmission light flux [26], the key step of the method to solve the question is how to improve the diffuse transmission property. Typically, there are only two methods to find the measurement. One is using a highly sensitive detector with low background noise, whereby a high transmission light flux ϕ τ can be achieved. But this method depends on the development of detector technology, and only reducing the background noise of measurement equipment does not have a significant effect. The other method is improving the incident light flux ϕ i . Perhaps, it is relatively easy to use for a high power light source. But the challenges are that the incident flux should have a high diffuse coefficient β up to 9.1, according to the ISO 5 standard, and that the wide spectrum includes the visual scope at the same time.
D T = log 10 ( ϕ τ / ϕ i )
How to comply with these three conditions is difficult in diffuse optical spectroscopy design. A new diffuse optics emitter (DOE) is designed to satisfy these three conditions in our research and is used in the new national reference densitometer of NIM (National Institute of Metrology, China) for visual diffuse transmission density. This new diffuse optics emitter enables the reference to improve the measurement range highly. And it can be used in other diffuse optical spectroscopy as a new light source with a high diffuse coefficient, high flux, and wide spectrum range.

2. Materials and Methods

The diffuse optics emitter is designed as a hemisphere structure with 235 optical fibers, as shown in Figure 1. The main component of DOE is a hemisphere (diameter is 25 mm), and there are 235 optical fibers connecting to the back surface of the hemisphere. One end of these 235 optical fibers is inserted in the hemisphere. The distance, in terms of solid angles, between adjacent optical connection fibers is constant. The other end of these optical fibers is combined in one point to generate a plane called the “incident plane of DOE”. An idea diffuse transmit glass named “opal” is attached at the hemisphere center. That means the hemisphere center is in the upper surface of opal. When the light is emitted at the bottom surface, the light is diffused twice. The whole device is shown in Figure 1b. This diffuse optics emitter corresponds with the geometric conditions of ISO 5, and it can improve the light flux and diffuse property all in the visual spectrum range.
In detail, the output ends of the optical fibers are arranged on the hemisphere in an equal solid angle, and the end planes of each optical fiber are on the same surface with the hemisphere’s inner surface. The geometric extension lines of all optical fibers exit and intersect at the hemisphere center, and the upper surface center of the opal coincides with the hemisphere center. According to these conditions, the number of these optical fibers n is decided by Equation (2), where k is the attenuation coefficient, M is the radius of the hemisphere, m is the diameter of the optical fiber, and u is the spectrum attenuation coefficient of the optical fiber. Trunk means taking the integer of the result.
n = t r u n k ( k M m u )
In this work, M is 25 mm, k is 14.5 dB, m is 8.1 mm, and u is 0.1 dB in 380 nm–780 nm. Thus, the result is 235.
Under these conditions, the parameters of these optical fiber are numerical aperture (NA): 0.15, core diameter: 0.1 mm, outer diameter: 2.5 mm, disperse angle: less than 100 mrad, and materials: quartz.
Furthermore, this diffuse optics emitter is used in the new national reference densitometer of NIM. The diffuse light source of this reference based on DOE is shown in Figure 2. A compressed air channel is attached in this device. So that the sample can be placed on the surface of the opal closely and moved harmlessly.
In this structure, 1 is DOE, 2 is opal, 3 is the mechanical components, 4 is the compressed air channel, and 5 is the sample for measurement. The compressed air is used to fix the sample on the opal; thus, the measurement is precise.
The whole structure of the new densitometer is shown in Figure 3. All components in the figure are not to strict size relation. Label 1 is the diffuse light source based on DOE, 2 is the sample, 3 is the light lamp, 4 is an off-axis elliptical reflector, 5 is a bandpass filter, 6 is a flat reflect mirror, 7 is the optical fiber bundle, 8 is an imaging optics system, and 9 is the detector.
The off-axis elliptical reflector 4 has two focuses at the light axis, and the lamp 3 is placed on the first focus. The bandpass filter 5 selects the visual spectrum of the light. The flat reflecting mirror rotates the light to the vertical axis. The incident plane of DOE is on the second focus of the off-axis elliptical reflector 4. It must be pointed out that this focus is on the vertical axis, relatively.
The detector system collects the flux from the sample or the opal (when there is no sample). The system is an imaging optics system. When the measurement starts, the sample is moved by a movement component to the measurement point. The movement component has another compressed air channel. This channel works with the corresponding compressed air channel on the diffuse light source. Thus, the sample can be absorbed or separated harmlessly. That means the sample can be placed closely on the opal when it is measured and can be moved harmlessly when the measurement is finish.

3. Results

The two main properties of DOE are measured, including diffuse coefficient and light flux [27,28,29,30]. Then a sample that has a diffuse transmit property is measured on this new densitometer.

3.1. The Diffuse Coefficient β

The diffuse coefficient β of the diffuse light source based on DOE is calculated by the radiance distribution L i ( θ , φ , λ ) of the bottom surface of the opal, which is shown in Figure 1. β can be given by
β = ϕ i / ϕ 0 = λ 2 π A i L i ( θ , φ , λ ) cos θ d Ω d λ / λ 2 π A 0 L 0 ( θ , φ , λ ) cos θ d Ω d λ
where L 0 ( θ , φ , λ ) is the radiance distribution of Lambert radiance, A i is the area of the bottom surface of opal, A 0 is the area of Lambert radiance, Ω is the solid angle of detector, θ is the Zenith angle of detector, and φ is the azimuth angle of detector. The integration range of d Ω is the radiance hemisphere, and A i = A 0 . In this integration range, the Lambert radiance L 0 ( Ω ) is a constant. Therefore, the value of L 0 ( Ω ) can be achieved by L 0 ( θ = 0 ) .Thus, β can be given by
β = 2 π L i ( θ ) sin θ cos θ d θ / 2 π L 0 ( θ ) sin θ cos θ d θ = L i ( θ ) sin 2 θ d θ / L 0 ( θ = 0 )
After measuring L i ( θ ) , and the radiance distribution L i ( θ , φ , λ ) of the bottom surface of the opal (which can be measured by the bi-directional transmit distribution function (BTDF) reference of NIM), β can be calculated using Formula (4) to estimate the diffuse property of the light source based on DOE. The L i ( θ , φ , λ ) measurement result is shown in Figure 4. The two-measurement angle range of the XY axis is ±85°, and the interval step is 5°. Thus, β can be calculated by Equation (5) as below:
β = 0.951

3.2. The Light Flux Relative Range (Including Linearity)

The light flux of the new densitometer (using DOE) is measured in a linearity measurement facility in NIM. The facility has a moving component that can divide the whole light flux into half. Using this facility, the light flux can be measured from the maximum to the minimum, step by step. At every step, the light flux is half of that at the prior step. Thus, the linearity of the system can be achieved by measuring the light flux at the same time. The result of these properties is shown in Figure 5. In this result, we can find the light flux range cover 106 when the linearity is less than 0.002, which means that this densitometer has a measurement ability of high diffuse optical density up to 6.

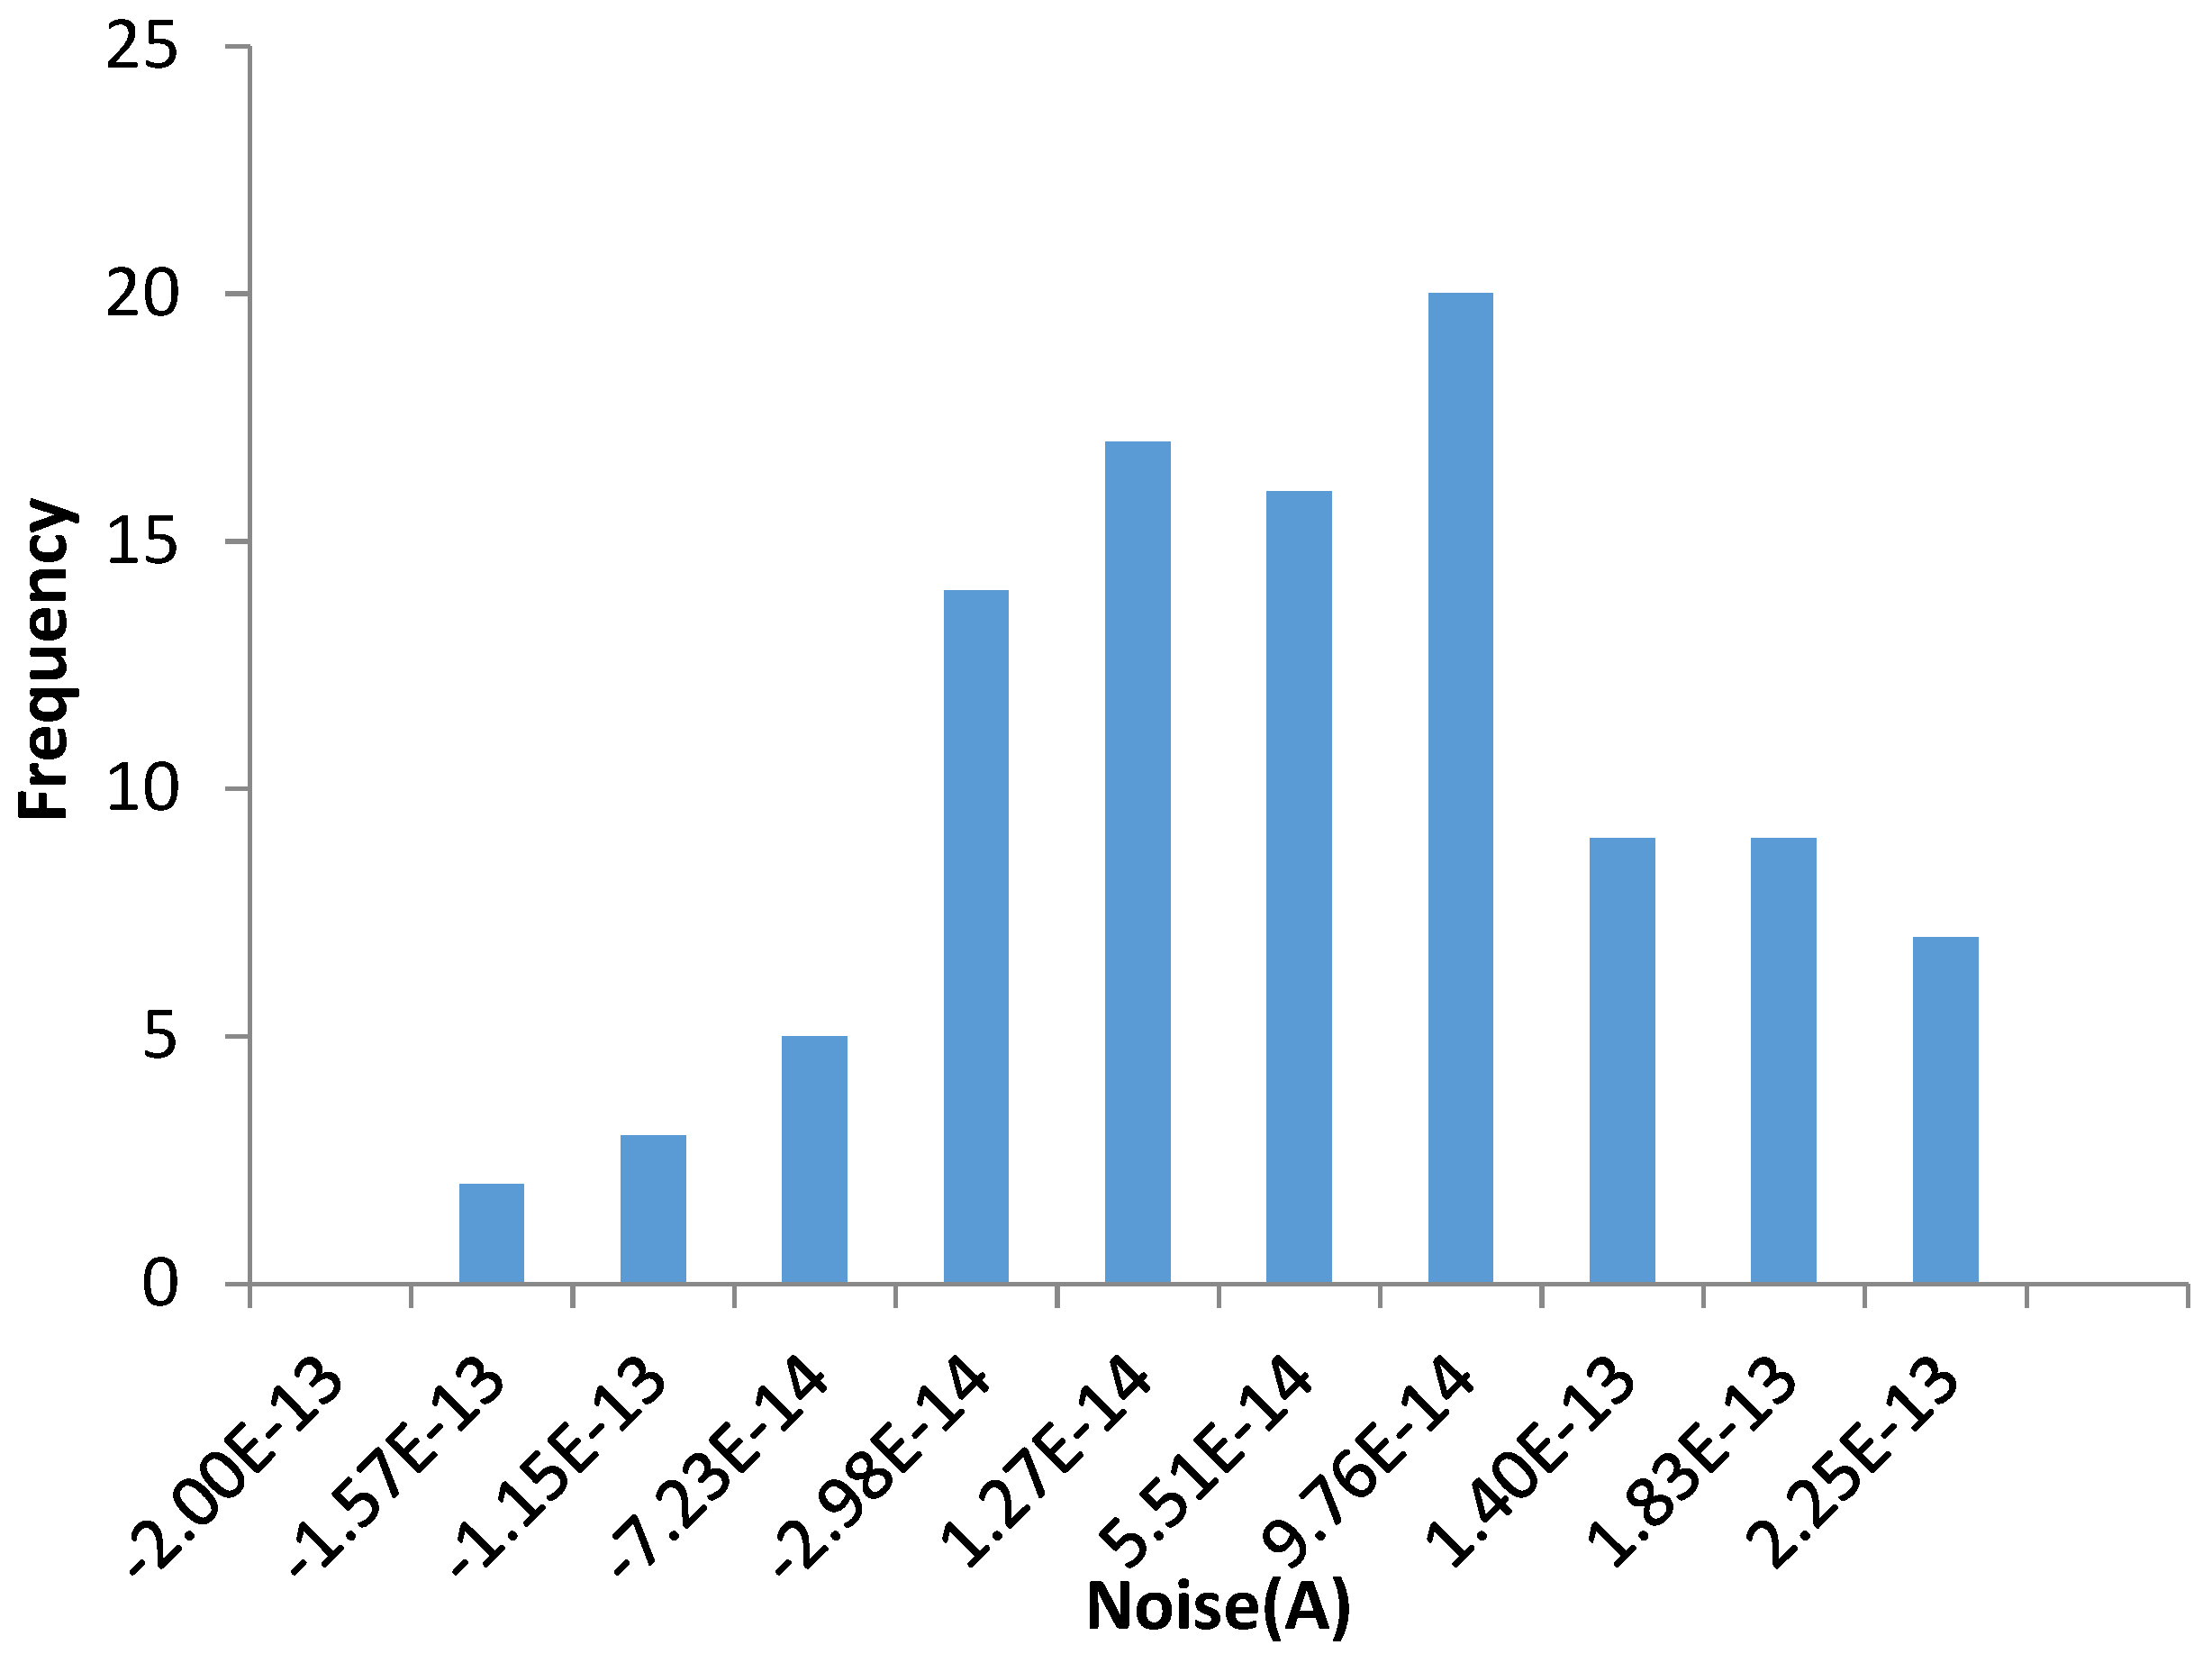
3.3. The Full Light Flux and the Noise

The stability of the full light flux and the noise are the key influence factors of the diffuse optical density measurement, especially for the high diffuse OD up to 6 [31]. We measured these two parameters in 1 h for all, because the sample measurements likely continue in 1 h, maximally. The result of these two parameters is analyzed as shown in Figure 6 and Figure 7. These two parameter approaches to the Gauss distribution show that the densitometer can be used to measure the diffuse OD.

3.4. A High OD Sample

A diffuse film with high OD up to 6.0 is measured using this densitometer to examine the property of this DOE. The diffuse film has six step areas, which are noted as No. 1 to No. 6. The diffuse OD measurement result of these six areas are shown in Table 1. The measurement uncertainty (u) of each OD is analyzed at the same time. The expanded uncertainty equals the standard uncertainty multiplied by the expanded coefficient.

4. Discussion

From the measurement result and corresponding analysis of the property of the new densitometer and the sample, the DOE is examined has a high diffuse coefficient with high light flux. The OD measurement range of densitometer based on the DOE approach is up to 6.7 with a high uncertainty level.

5. Conclusions

A new diffuse optics emitter is described in this paper, and it is proven to be a high diffuse and flux light source in the visual spectrum. It can be used in many diffuse optics systems, for highly precision measurement, image project, image analysis, or other usages [32,33,34,35].

Author Contributions

Conceptualization, Z.L. and J.L.; Data curation, J.L.; Formal analysis, R.L.; Funding acquisition, Z.L. and R.L.; Investigation, Y.J.; Methodology, Z.L. and Y.J.; Resources, Y.L.; Software, Y.L.; Supervision, J.L.; Validation, S.Z., Q.Z., and R.C.; Writing—original draft, Z.L.; Writing—review and editing, J.L.

Funding

This research was funded by the National Natural Science Foundation of China (NSFC), grant number 61875180; the National Key R and D Program of China, grant number 2017YFF0205103; the National Natural Science Foundation of China, grant number 61501039; the Beijing Natural Science Foundation, grant number 2162017; the Research and Development Program of Beijing Institute of Graphic Communication, grant number Ec201808; the Beijing Municipal Science and Technology Commission, grant number Z181100004418004.

Conflicts of Interest

The authors declare no conflict of interest.

References

  1. Miedzinski, R.; Fuks-Janczarek, I. Non-linear optics study of the samples which strongly diffuse the Gaussian beam. Opt. Laser Technol. 2019, 115, 193–199. [Google Scholar] [CrossRef]
  2. Sekar, S.K.V.; Pacheco, A.; Martella, P.; Li, H.; Lanka, P.; Pifferi, A.; Andersson-Engels, S. Solid phantom recipe for diffuse optics in biophotonics applications: A step towards anatomically correct 3D tissue phantoms. Biomed. Opt. Express 2019, 10, 2090–2100. [Google Scholar] [CrossRef] [PubMed]
  3. Marongiu, D.; Lai, S.; Sarritzu, V.; Pinna, E.; Mula, G.; Mercuri, M.L.; Saba, M.; Quochi, F.; Mura, A.; Bongiovanni, G. Bifacial Diffuse Absorptance of Semitransparent Microstructured Perovskite Solar Cells. ACS Appl. Mater. Interfaces 2019, 11, 10021–10027. [Google Scholar] [CrossRef] [PubMed]
  4. Shokoufi, M.; Golnaraghi, F. Handheld diffuse optical breast scanner probe for cross-sectional imaging of breast tissue. J. Innov. Opt. Health Sci. 2019, 12. [Google Scholar] [CrossRef]
  5. Raj, D.R.; Prasanth, S.; Vineeshkumar, T.V.; Sudarsanakumar, C. Surface Plasmon Resonance based fiber optic sensor for mercury detection using gold nanoparticles PVA hybrid. Opt. Commun. 2016, 367, 102–107. [Google Scholar]
  6. Chang, T.C. Exploiting Optical Contrasts for Cervical Precancer Diagnosis via Diffuse Reflectance Spectroscopy. Ph.D. Thesis, Duke University, Durham, NC, USA, 2010. [Google Scholar]
  7. Jiao, S. A Novel Leakage Detection Method for Long Distance Gas Pipelines Based on Optic Fiber Sensor and Optical Multiplexing. In International Conference on Pipelines & Trenchless Technology; ASCE: Reston, VA, USA, 2012. [Google Scholar]
  8. Kim, K.H.; Jheon, S.; Kim, J.K. In vivo skin absorption dynamics of topically applied pharmaceuticals monitored by fiber-optic diffuse reflectance spectroscopy. Spectrochim. Acta Part A Mol. Biomol. Spectrosc. 2007, 66, 768–772. [Google Scholar] [CrossRef] [PubMed]
  9. Yu, B.; Burnside, E.S.; Sisney, G.A.; Harter, J.M.; Zhu, C.; Dhalla, A.H.; Ramanujam, N. Feasibility of near-infrared diffuse optical spectroscopy on patients undergoing image-guided core-needle biopsy. Opt. Express 2007, 15, 7335–7350. [Google Scholar] [CrossRef] [Green Version]
  10. Joseph. Balloon Catheter for Photodynamic Therapy. U.S. Patent 6,013,053, 11 January 2000. [Google Scholar]
  11. Epstein, J.R.; Leung, A.P.; Lee, K.H.; Walt, D.R. High-density, microsphere-based fiber optic DNA microarrays. Biosens. Bioelectron. 2003, 18, 541–546. [Google Scholar] [CrossRef]
  12. Binzoni, T.; Sanguinetti, B.; Van De Ville, D.; Zbinden, H.; Martelli, F. Probability density function of the electric field in diffuse correlation spectroscopy of human bone in vivo. Appl. Opt. 2016, 55, 757. [Google Scholar] [CrossRef]
  13. Eggebrecht, A.T.; White, B.R.; Ferradal, S.L.; Chen, C.; Zhan, Y.; Snyder, A.Z.; Dehghani, H.; Culver, J.P. A quantitative spatial comparison of high-density diffuse optical tomography and fMRI cortical mapping. Neuroimage 2012, 61, 1120–1128. [Google Scholar] [CrossRef] [Green Version]
  14. Wu, X.; Eggebrecht, A.T.; Ferradal, S.L.; Culver, J.P.; Dehghani, H. Quantitative evaluation of atlas-based high-density diffuse optical tomography for imaging of the human visual cortex. Biomed. Opt. Express 2014, 5, 3882. [Google Scholar] [CrossRef] [PubMed]
  15. Bergholt, M.S.; Albro, M.B.; Stevens, M.M. Online quantitative monitoring of live cell engineered cartilage growth using diffuse fiber-optic Raman spectroscopy. Biomaterials 2017, 140, 128–137. [Google Scholar] [CrossRef] [PubMed]
  16. Murphy, B.W.; Webster, R.J.; Turlach, B.A.; Quirk, C.J.; Clay, C.D.; Heenan, P.J.; Sampson, D.D. Toward the discrimination of early melanoma from common and dysplastic nevus using fiber optic diffuse reflectance spectroscopy. J. Biomed. Opt. 2005, 10, 064020. [Google Scholar] [CrossRef] [PubMed]
  17. Van Zeeland, M.A.; Boivin, R.L.; Carlstrom, T.N.; Deterly, T.; Finkenthal, D.K. Fiber optic two-color vibration compensated interferometer for plasma density measurements. Rev. Sci. Instrum. 2006, 77, 919–1157. [Google Scholar] [CrossRef]
  18. Pires, L.; Demidov, V.; Vitkin, I.A.; Bagnato, V.S.; Kurachi, C.; Wilson, B.C. Optical clearing of melanoma in vivo: Characterization by diffuse reflectance spectroscopy and optical coherence tomography. J. Biomed. Opt. 2016, 21, 81210. [Google Scholar] [CrossRef]
  19. Biswas, S.K.; Rajan, K.; Vasu, R.M. Flux density calibration in diffuse optical tomographic systems. J. Biomed. Opt. 2013, 18, 026023. [Google Scholar] [CrossRef]
  20. Li, C.; Wei, H.J.; Zhao, Y.; Wu, G.; Gu, H.; Guo, Z.; Yang, H.; He, Y.; Xie, S. Laser-assisted Permeation and Accumulation of Titanium Dioxide Nanoparticles in Ex Vivo Human Endometrium Tissues Monitored by OCT and Diffuse Reflectance Spectra. IEEE J. Sel. Top. Quantum Electron. 2019, 25, 1–9. [Google Scholar]
  21. Hassanpour, M.S.; White, B.R.; Eggebrecht, A.T.; Ferradal, S.L.; Snyder, A.Z.; Culver, J.P. Statistical analysis of high density diffuse optical tomography. Neuroimage 2014, 85, 104–116. [Google Scholar] [CrossRef]
  22. Sujatha, N. Optimal Source to Detector Separation for Extracting Sub-Dermal Chromophores in Fiber Optic Diffuse Reflectance Spectroscopy: A Simulation Study; SPIE Photonics Europe: Brussels, Belgium, 2014. [Google Scholar]
  23. Mourant, J.R.; Marina, O.C.; Hebert, T.M.; Kaur, G.; Smith, H.O. Hemoglobin parameters from diffuse reflectance data. J. Biomed. Opt. 2014, 19, 037004. [Google Scholar] [CrossRef] [Green Version]
  24. Canpolat, M. Variation of photon density distribution with system component within Intralipid emulsion. Opt. Int. J. Light Electron Opt. 2011, 122, 887–890. [Google Scholar] [CrossRef]
  25. Kuzmin, V.L.; Neidrauer, M.T.; Diaz, D.; Zubkov, L.A. Diffuse photon density wave measurements and Monte Carlo simulations. J. Biomed. Opt. 2015, 9325, 105006. [Google Scholar] [CrossRef] [PubMed]
  26. GB/T 12823.1-2008/ISO5-1:2008; Standard Administration Committee: Beijing, China, 2008.
  27. Thomas, J.C. Fiber optic dynamic light scattering from concentrated dispersions. 2. Concentration dependence of the apparent diffusion coefficient for small spheres. Langmuir 2002, 5, 1350–1355. [Google Scholar] [CrossRef]
  28. Baker, S.F.; Walker, J.G.; Hopcraft, K.I. A dual thickness spatial system for determining optical coefficients from scattering media. Meas. Sci. Technol. 2004, 15, 501. [Google Scholar] [CrossRef]
  29. Norris, A.N. Diffuse wave density and directionality in anisotropic solids. J. Acoust. Soc. Am. 2008, 123, 1399. [Google Scholar] [CrossRef] [PubMed]
  30. Matvienko, A.; Mandelis, A.; Jeon, R.J.; Abrams, S.H. Theoretical analysis of coupled diffuse-photon-density and thermal-wave field depth profiles photothermally generated in layered turbid dental structures. J. Appl. Phys. 2009, 105, 102022. [Google Scholar] [CrossRef]
  31. Zhang, E.Z.; Vakoc, B.J. Polarimetry noise in fiber-based optical coherence tomography instrumentation. Opt. Express 2011, 19, 16830–16842. [Google Scholar] [CrossRef] [PubMed] [Green Version]
  32. Pinkel, D.; Gray, J. High Density Array Fabrication and Readout Method for a Fiber Optic Biosensor. Biosensors & Bioelectronics. U.S. Patent 6,417,506, 9 July 2002. [Google Scholar]
  33. Dastgeer, S.; Zank, G.P. Density Spectrum in the Diffuse Interstellar Medium and Solar Wind. Astrophys. J. 2008, 602, L29. [Google Scholar] [CrossRef]
  34. Li, J.; Liu, Z. Multispectral Transforms Using Convolution Neural Networks for Remote Sensing Multispectral Image Compression. Remote Sens. 2019, 11, 759. [Google Scholar] [CrossRef]
  35. Gregg, N.M.; White, B.R.; Culver, J.P. High-density diffuse optical imaging improves brain-specificity and resolution of functional neuroimaging. Neuroimage 2009, 47, S141. [Google Scholar] [CrossRef]
Figure 1. The diffuse optics emitter (DOE). (a) The prototype of DOE; (b) the structure diagram of DOE (cross-section), where 1 is the hemi-sphere, 2 are the fiber heads (235 in total), 3 are the light rays, 4 is the opal, and 5 is the light emitting surface.
Applsci 09 02774 g001
Figure 2. The structure diagram of the diffuse light source based on DOE.
Applsci 09 02774 g002
Figure 3. Full diagram of the new densitometer.
Applsci 09 02774 g003
Figure 4. The distribution of the diffuse coefficient β .
Applsci 09 02774 g004
Figure 5. The light flux relative range (including linearity).
Applsci 09 02774 g005
Figure 6. Frequency distribution of light flux in one hour.
Applsci 09 02774 g006
Figure 7. Frequency distribution of noise in one hour.
Applsci 09 02774 g007
Table 1. Diffuse optical density (OD) measurement result.
NoODStandard uExpand CoefficientExpand u
16.6640.0122.090.024
26.5140.0102.030.020
36.2950.0052.010.011
46.0420.0052.180.010
55.7940.0042.200.008
65.5550.0042.160.008

