Article

Numerical Modeling of the Melting Process in a Shell and Coil Tube Ice Storage System for Air-Conditioning Application

by
Seyed Soheil Mousavi Ajarostaghi
1,
Sébastien Poncet
2,*,
Kurosh Sedighi
1 and
Mojtaba Aghajani Delavar
1
1
Mechanical Engineering Department, Babol Noshirvani University of Technology, Babol 47148-71167, Iran
2
Mechanical Engineering Department, Université de Sherbrooke, Sherbrooke, QC J1K 2R1, Canada
*
Author to whom correspondence should be addressed.
Appl. Sci. 2019, 9(13), 2726; https://doi.org/10.3390/app9132726
Submission received: 9 February 2019 / Revised: 25 May 2019 / Accepted: 2 July 2019 / Published: 5 July 2019
(This article belongs to the Special Issue Advanced Applications of Phase Change Materials)

Abstract

:
Cold thermal energy storage, as a promising way of peak-shifting, can store energy by using cheap electricity during off-peak hours and regenerate electricity during peak times to reduce energy consumption. The most common form of cold storage air conditioning technology is ice on the coil energy storage system. Most of the previous studies so far about ice on coil cold storage system have been done experimentally. Numerical modeling appears as a valuable tool to first better understand the melting process then to improve the thermal performance of such systems by efficient design. Hence, this study aims to simulate the melting process of phase change materials in an internal melt ice-on-coil thermal storage system equipped with a coil tube. A three-dimensional numerical model is developed using ANSYS Fluent 18.2.0 to evaluate the dynamic characteristics of the melting process. The effects of operating parameters such as the inlet temperature and flowrate of the heat transfer fluid are investigated. Also, the effects of the coil geometrical parameters—including coil pitch, diameter, and height—are also considered. Results indicate that conduction is the dominant heat transfer mechanism at the initial stage of the melting process. Increasing either the inlet temperature or the flowrate shortens the melting time. It is also shown that the coil diameter shows the most pronounced effect on the melting rate compared to the other investigated geometrical parameters.

1. Introduction

Thermal energy storage (TES) is the most common method to store energy and shift the electricity peak load. The main advantage of TES systems is to reduce installation and maintenance costs, and also to reduce environmental impacts over the chemical-based technologies. Energy storage allows extra thermal energy to be used for future consumption. For instance, energy demand can be balanced between day and night or heat can be stored in summer for using in winter or vice versa. Generally, thermal energy storage can be applied in two different ways including sensible heat and latent heat. The energy density is much higher for energy storage by latent heat and the efficiency of such systems is generally higher too. A detailed description of different ways to store thermal energy has been proposed by Sarbu and Sebarchievici [1].
Conventional central air-conditioning systems of commercial building represent about 50% of the electrical demand, leading to a high electricity price. Air-conditioning using TES is currently considered as an efficient way to solve this issue. Cooling load demand during the warmest hours of summer days leads to an increase in the electrical energy request, intensifying the peak load. Thus, to reduce electrical energy consumption during peak hours, cold energy storage systems are used. One of the most common adopted methods is using ice on coil energy storage system. Ice thermal storage systems for office building applications have received great interest over recent decades due to their lower first cost, lower operating cost, and their ability to eliminate CFC (chlorofluorocarbons) refrigerants. Low electrical rates during nighttime (6 times lower than during daytime in average) results in designing a system operated at night which significantly decreases the operating costs and provides flexibility to control the peak of electrical rates [2].
Ice storage systems are divided into two different types including static type and dynamic type. External melt ice-on-coil type, internal melt ice-on-coil type, and encapsulated ice type are static systems while dynamic type includes ice slurry type and ice harvesting type. Internal melt ice-on-coil cold storage system are currently widely available in heating, ventilation, and air-conditioning (HVAC) applications. In internal melt ice-on-coil cold storage systems, the heat transfer fluid (HTF), which is usually a glycol solution, flows through coils in both charging (solidification) and discharging (melting) modes. Analyzing these two processes is crucial to design properly HVAC cold storage systems.
Although extensive research has been conducted on the thermal characteristics of ice-on-coil cold storage systems, especially in the field of external melt, few studies have considered the internal melt ice-on-coil tanks. In this field, Jannesari and Abdollahi [3] investigated the thermal performance of an internal melt ice-on-coil ice storage system by both experimental and numerical studies. Two different heat transfer enhancement methods including thin rings and annular fins around tubes were utilized to increase the ice formation and melting and accordingly increase the performance of the cold storage system. Three different types of tube including tube without rings, tube with diagonal rings, and tube with fins were considered. Their results indicated that tube with annular fins offers the best overall performance. At a specific distance between annular fins, the maximum ice formation was achieved. A novel paraffin-based cold storage system was investigated experimentally by Torregrosa-Jaime et al. [4]; 1450 kg of paraffin were placed in a shell around 18 spiral-shaped coils. The results showed that during the melting process, the natural convection within the phase change material (PCM) is the dominant heat transfer mechanism. The better overall efficiency was obtained at the lowest supplied temperatures and mass flow rates. Lopez-Navarro et al. [5,6] performed an experimental analysis of an internal melt-ice-on-coil system. The total refrigeration capacity of the installed set-up was 172 kWh. The solidification process (charging) has been investigated for different inlet temperatures and mass flow rates of the heat transfer fluid. Fastest charging tests showed the lowest energy consumption. A comprehensive experimental study was presented about both solidification and melting processes in an internal melt ice-on-coil cold storage system by Ezan et al. [7]. The influence of some operational parameters including the inlet temperature and mass flowrate of the heat transfer fluid were investigated in both charging and discharging processes. A shell and tube type latent cold storage system was considered: liquid water flows in the shell, while ethylene glycol is the HTF in the tube side. An electronic ice thickness measurement method was used to monitor the solid–liquid interface variations during the phase change. Experimental results showed that, for both solidification and melting processes, natural convection was the dominant heat transfer mechanism after a short heat conduction dominated period.
Fertelli et al. [8] studied the phase change phenomena around a horizontal tube in a cold thermal storage system and based on the experimental results, investigated the effects of different heat transfer fluid (HTF) inlet temperatures on the ice formation. Habeebullah [9] experimentally investigated the growth rate of ice on cooled copper tubes. He found that the axial growth rate of ice is different at low values of the coolant Reynolds number and small freezing times. Also, he found that ice on the bends is thicker, that is attributed to internal flow disturbances of the coolant, and the formation of local eddies inside the bends. Attia et al. [10] compared experimentally the influence of adding Al2O3 nanoparticles to either distilled water as PCM or to a mixture of aqua ethylene glycol (50 wt.%) as an HTF on the performance of the cold storage system. Results concluded that adding the nanoparticles as nucleation agent to PCM alone is much more beneficial to cool the storage system than adding it to the HTF alone.
Yan et al. [11] presented a compound cold storage system that combines a heat pipe-based seasonal ice storage system with a chilled water storage system. The seasonal ice storage system automatically charges winter cold energy in the form of ice. In summer, the stored ice is extracted for cooling, and then the melting ice is used as a chilling medium for chilled water storage. Results showed that the appropriate combination of the two types of cold storage can greatly improve the applicability of the seasonal cold storage and reduce the life-cycle cost of a building cooling system by 40%. In the experimental and numerical research conducted by Erek and Ezan [12], the influence of different coolant flowrates and temperatures were studied during the charging process of an ice-on-coil ice storage system. Their investigations showed that for the ice formation, the temperature changes in the coolant is much more influential compared to the flow rate variations.
Besides the experimental studies, there are some numerical works, which analyzed the charging or discharging process of the ice storage system. Zheng et al. [13] simulated the charging and discharging processes of an internal melt ice-on-coil thermal storage system using Simulink. Their relatively simple model provided acceptable qualitative results about the heat transfer. The results indicated that by increasing the coil diameter, heat transfer, and accordingly the thermal efficiency increases. However, the heat resistance increases simultaneously. Xie and Yuan [14,15] performed numerical simulations to study the influence of the material, thickness, and arrangement of the thin layer ring on the performance of an ice storage system. The Taguchi method was used to achieve the optimal results. The results indicated that the type of material and the arrangement of the thin layer ring have the most significant effect on the ice formation. However, their results indicate that the thickness of the thin layer ring has no significant effect on the ice formation.
Buyruk et al. [16] calculated the influence of geometrical effects on the ice formation in a rectangular water-filled tank. The results showed that the solid fraction for the aligned cylinder case is smaller than for staggered ones. Ismail et al. [17] simulated in 2D the solidification of water around a bent tube with a cooling fluid flow inside it. They revealed that an increase of the wall temperature, an increase of the initial liquid PCM temperature, or an increase of the curvature radius would reduce the interface position and consequently reduce the solidified mass and decrease the interface velocity. Yang et al. [18] numerically investigated the thermal effects of the coolant inlet temperature on the charging process in an ice storage system. Their results showed that a lower coolant temperature enhances the thermal efficiency as well as the ice formation rate. Kim et al. [19] numerically studied the melting process in a cold storage system containing a phase change material (PCM). They examined the effects of some parameters like the length and number of fins on the thermal performance of the storage. Their observations indicated that, with larger fins, the area influenced by these fins is enlarged and the discharge process occurred with a higher speed.
According to above literature review, although extensive research has been accomplished ice-on-coil storage tanks, little research has been devoted to the shell and coil tube ice storage systems especially the effect of HTF (heat transfer fluid) channel geometry in horizontal ice storage systems [20].
Hence, as there is no specific numerical study on the melting process in a shell and coil tube ice storage system, the present work intends to determine the effects of the main geometrical and operational parameters on the melting process in a shell and coil tube ice storage system by a 3D numerical flow solver. A parametric study covering the influence of the inlet temperature and flowrate of the HTF is performed with a particular attention paid on the effect of natural convection on the melting process. The influences of the coil geometrical parameters including coil pitch, diameter, and height are presented and discussed in details.
The novelty of the present study is that, according to the comprehensive literature review performed, few significant studies about the discharge process (melting) in ice-on-coil ice storage system with horizontal coil tube have been published so far. The benefit from using horizontal coil tube instead of straight tube to increase the melting rate was not also considered completely in previous researches. On the other hand, the melting process in a horizontal shell and coil tube ice storage system has not been studied numerically in previous published studies. Also, in this paper, a comprehensive study is presented by considering the influence of both operational and geometrical parameters numerically.

2. Mathematical Modeling

The governing equations of the melting process of the ice in a shell and coil tube ice storage are solved for laminar, unsteady and three-dimensional flow configurations using the enthalpy-porosity method [21]. The viscous dissipation term is considered as negligible [21]. The enthalpy-porosity method has proven to be an efficient method to simulate the melting and solidifications of PCMs (like ice) [3,13,20]. In order to include the effects of buoyancy on the natural convection in the storage system, the Boussinesq approximation was applied to the problem [22]
ρ = ρ 0 [ β ( T T l i q u i d ) + 1 ] 1
Continuity:
. V = 0
Momentum:
V t + V . V = 1 ρ ( ρ + μ 2 V + ρ β ( T T r e f ) ) + S
Energy:
h s e n s t + h l a t t + . ( V h s e n s ) = . ( k ρ c p h s e n s ) .
The material total enthalpy, which can be computed by the sum of sensible and latent heat is
h t o t = h s e n s + h l a t
where
h s e n s = h r e f + T r e f T c p d T = h r e f + c p T r e f T d T
h l a t = i = 1 n λ i L .
in which hlat can vary from zero (for solid phase) to L (for the liquid phase) and λ is the liquid fraction. According to the correlation, the total latent heat can be computed by the summation of the latent heat from every cell in the computational domain at each time step. After that, the sensible heat can be obtained from
h s e n s = h t o t h l a t .
and the liquid fraction, λ, can be defined as [23,24]
λ = { h l a t L = 0 i f T < T s h l a t L = 1 i f T < T l i q h l a t L = T T s T l i q T s i f T s < T < T l i q } .
Darcy’s law damping term is usually added to the momentum equation to consider the influence of the phase change on the convective heat transfer. Generally, the solidus temperature is the highest temperature at which a solid material starts melting. The liquidus is the temperature at which a material is completely melted. The mushy zone corresponds to intermediate temperatures between the solidus and liquidus temperatures. According to [24,25], the temperature span in the mushy layer remains around 0.1 K. Also, Ashby et al. [26] noted that for pure material (like water), the difference between the solidus and liquidus temperatures is below 0.5 K and can be set to zero without introducing a noticeable error when simulating phase change processes.
The term S in Equation (3) is the source term representing the Darcy’s law damping term. It can be defined as
S = ( 1 λ ) 2 λ 3 A m u s h V
where Amush is the mushy zone constant. This constant is usually fixed to values within the range 104–107. In this study, Amush is assumed to be constant and its value was set to 105.

3. Numerical Model

The set of equations previously defined is solved using the commercial software ANSYS FLUENT 18.2. The quadratic upwind differencing (QUICK) method is used for the discretization of the convective terms in the momentum and energy equations. Also, semi-implicit pressure-linked equation (SIMPLE) scheme is employed to overcome the velocity-pressure coupling. The pressure staggering option (PRESTO) algorithm is also used for pressure correction equation. The enthalpy-porosity formulation is used to solve the mass, velocity, and energy equations. The green-Gauss cell-based method is used to evaluate all gradients. In order to improve the convergence stability, the under-relaxation factors have been fixed to 0.3, 0.2, 1, and 0.9 for pressure, velocity, energy, and liquid fraction, respectively. The residuals for the continuity, momentum, and energy equations are adjusted to be less than 10−3, 10−3, and 10−6, respectively.
In the present study, the effects of operational and geometrical parameters on the melting process are investigated numerically in the shell and coil tube ice storage. The investigated operational parameters are the inlet mass flowrate and temperature of the heat transfer fluid (HTF), ethylene glycol. The analyzed geometrical parameters are the pitch, the diameter and the height of the coil. The melting process is simulated in the ice storage system put horizontally.
The geometry considered now is a shell and coil tube ice storage tank as displayed in Figure 1. The length of the tank, coil tube diameter, and pitch are 400, 10, and 80 mm, respectively. Ethylene glycol is used as HTF fluid within the coil tube.
For the grid sensitivity analysis, four different mesh grids have been considered with a total of 436,400, 584,300, 1,391,200, and 1,631,500 cells, respectively. No noticeable difference was obtained for the three thinnest grids such that all the results presented hereafter have been obtained using the grid with 584,300 cells (248,304 cells in the shell and 335,996 cells in the coil tube). The mesh is unstructured and based on tetrahedral elements. A mesh refinement close to the walls is applied through 10 prismatic layers to guarantee the good resolution in the boundary layers where the highest gradients are usually observed. The time step is fixed to 0.5 s for all simulations. The shell is full of ice at the initial condition.

4. Results and Discussion

Present section includes results of validation study, mesh independent study, and melting process in the considered geometries. Two different validation studies were conducted and the results are presented in the first part of this section.

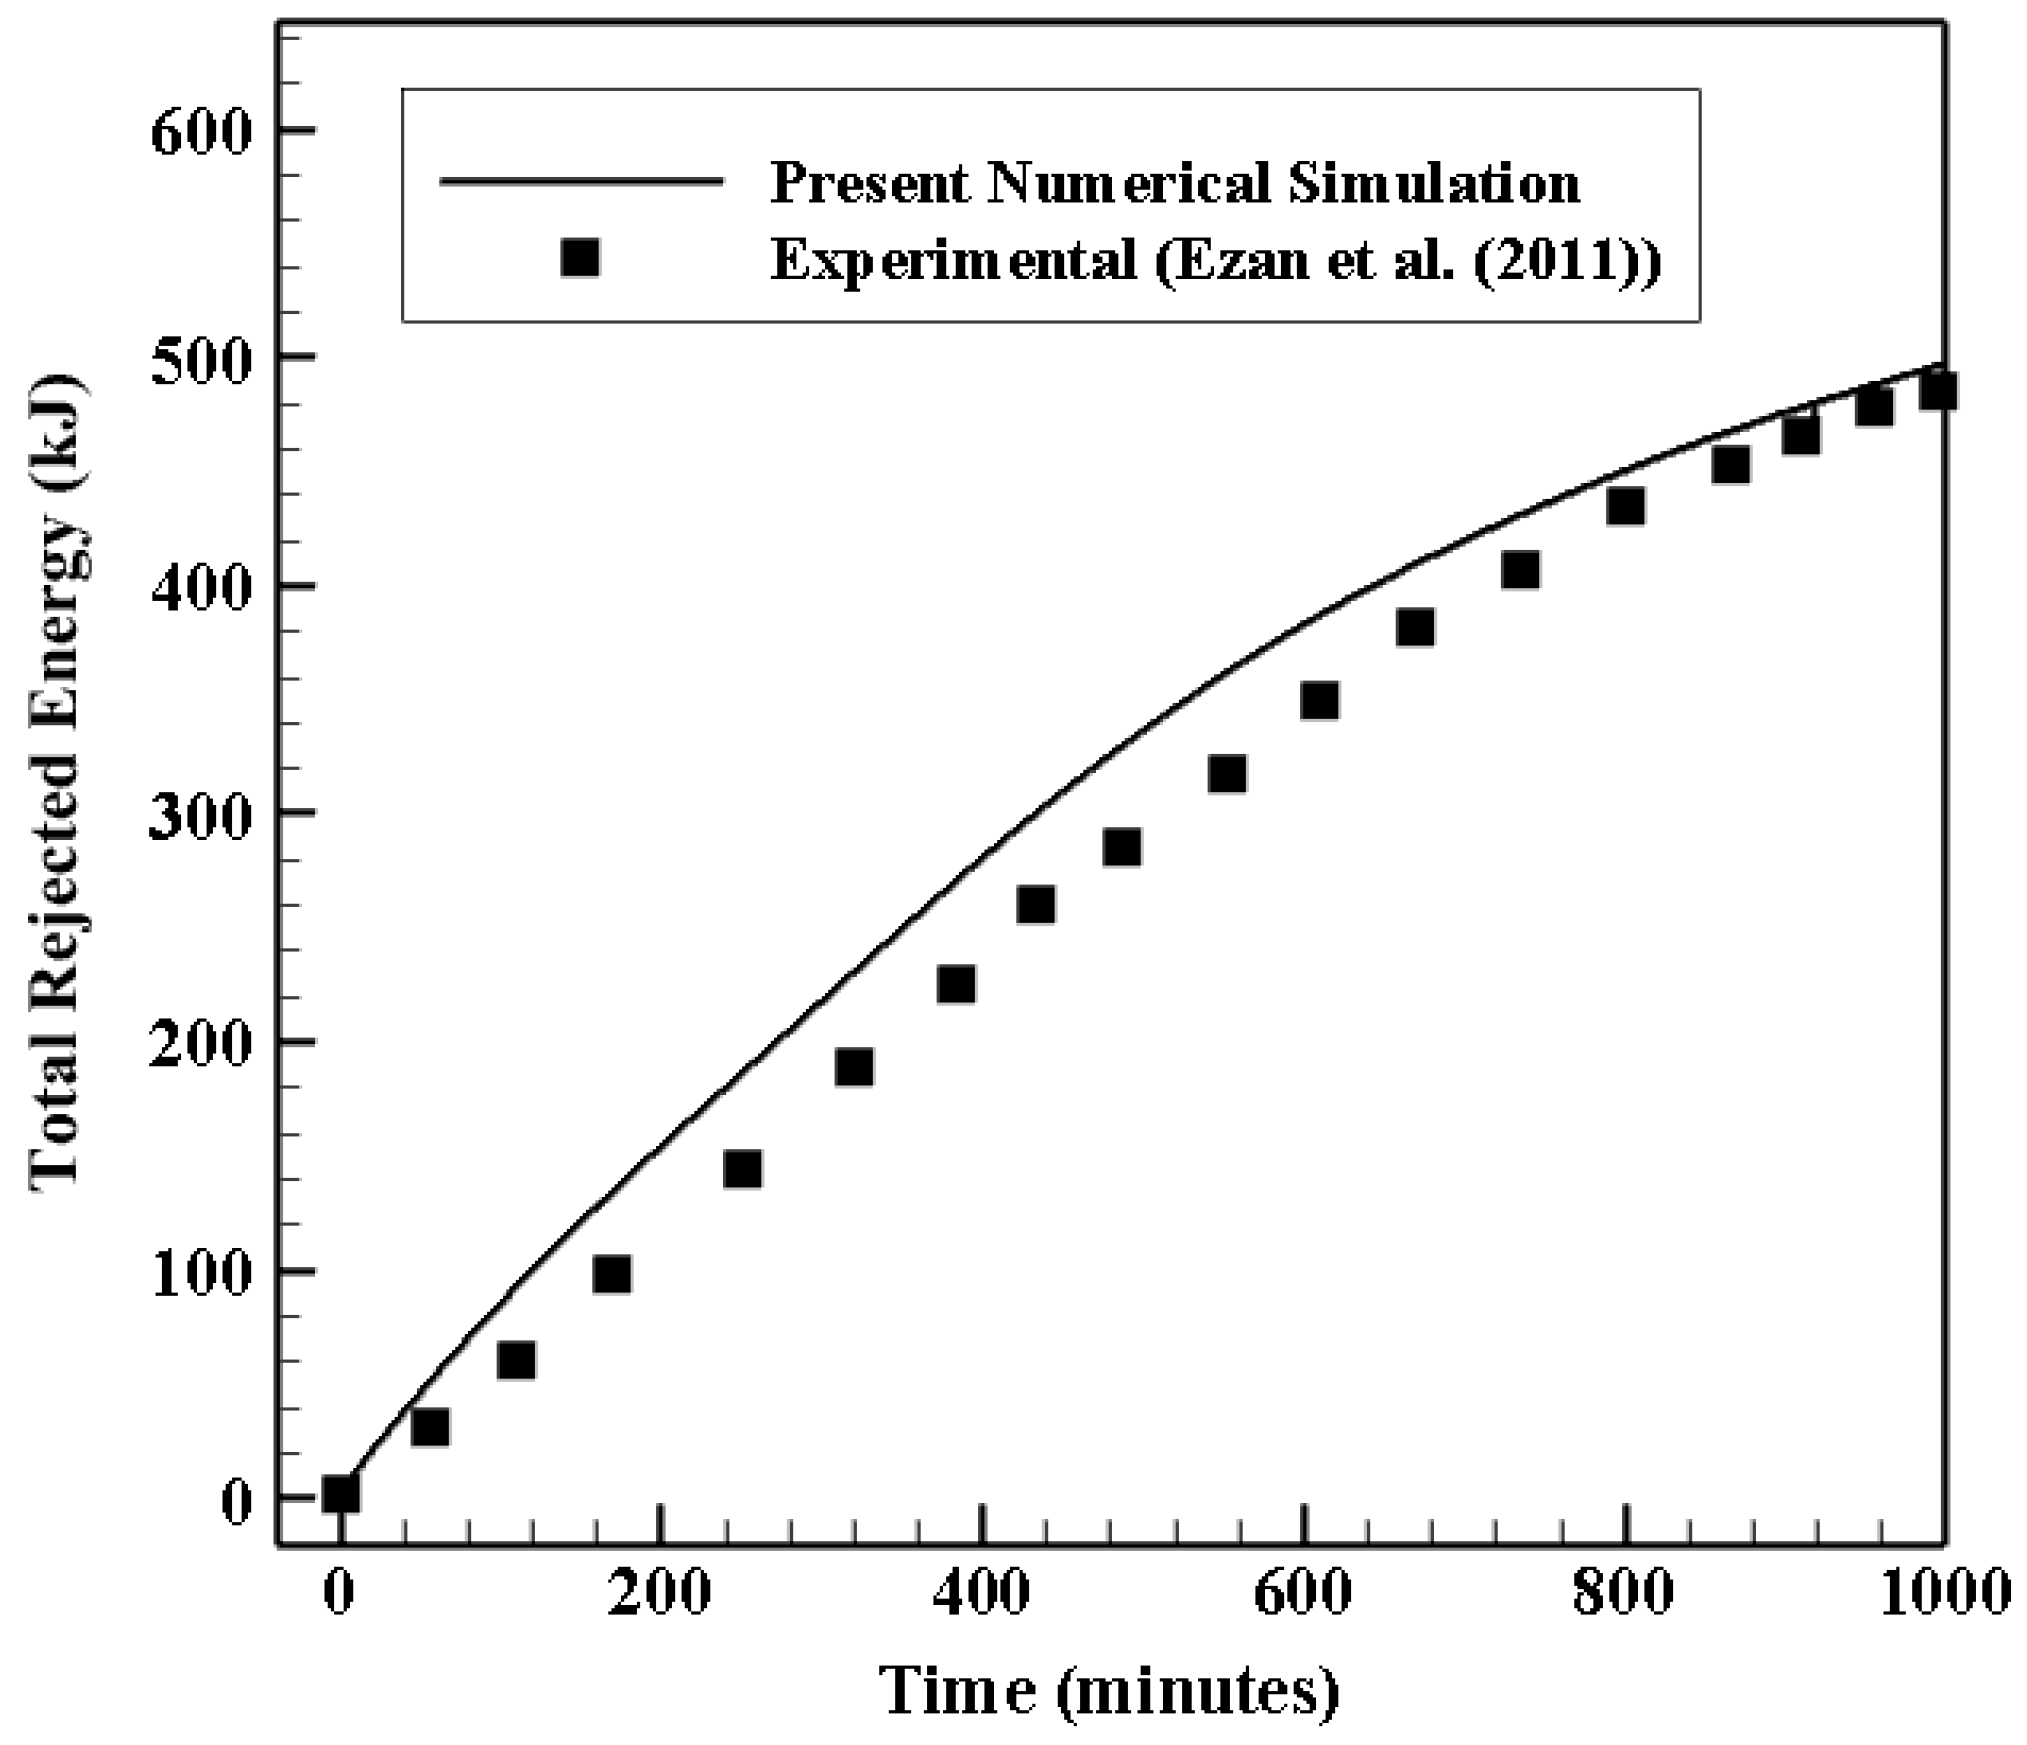
4.1. Validation Study

Two different cases are considered for validation purpose. For the first case, the heat transfer process in a shell and coil tube heat exchanger is investigated numerically and the obtained results are compared with the experimental results reported by Jamshidi et al. [27]. For the second case, the ice melting process in a double tube heat exchanger is investigated by numerical simulations and the obtained results are compared with the experimental results of the Ezan et al. [7].

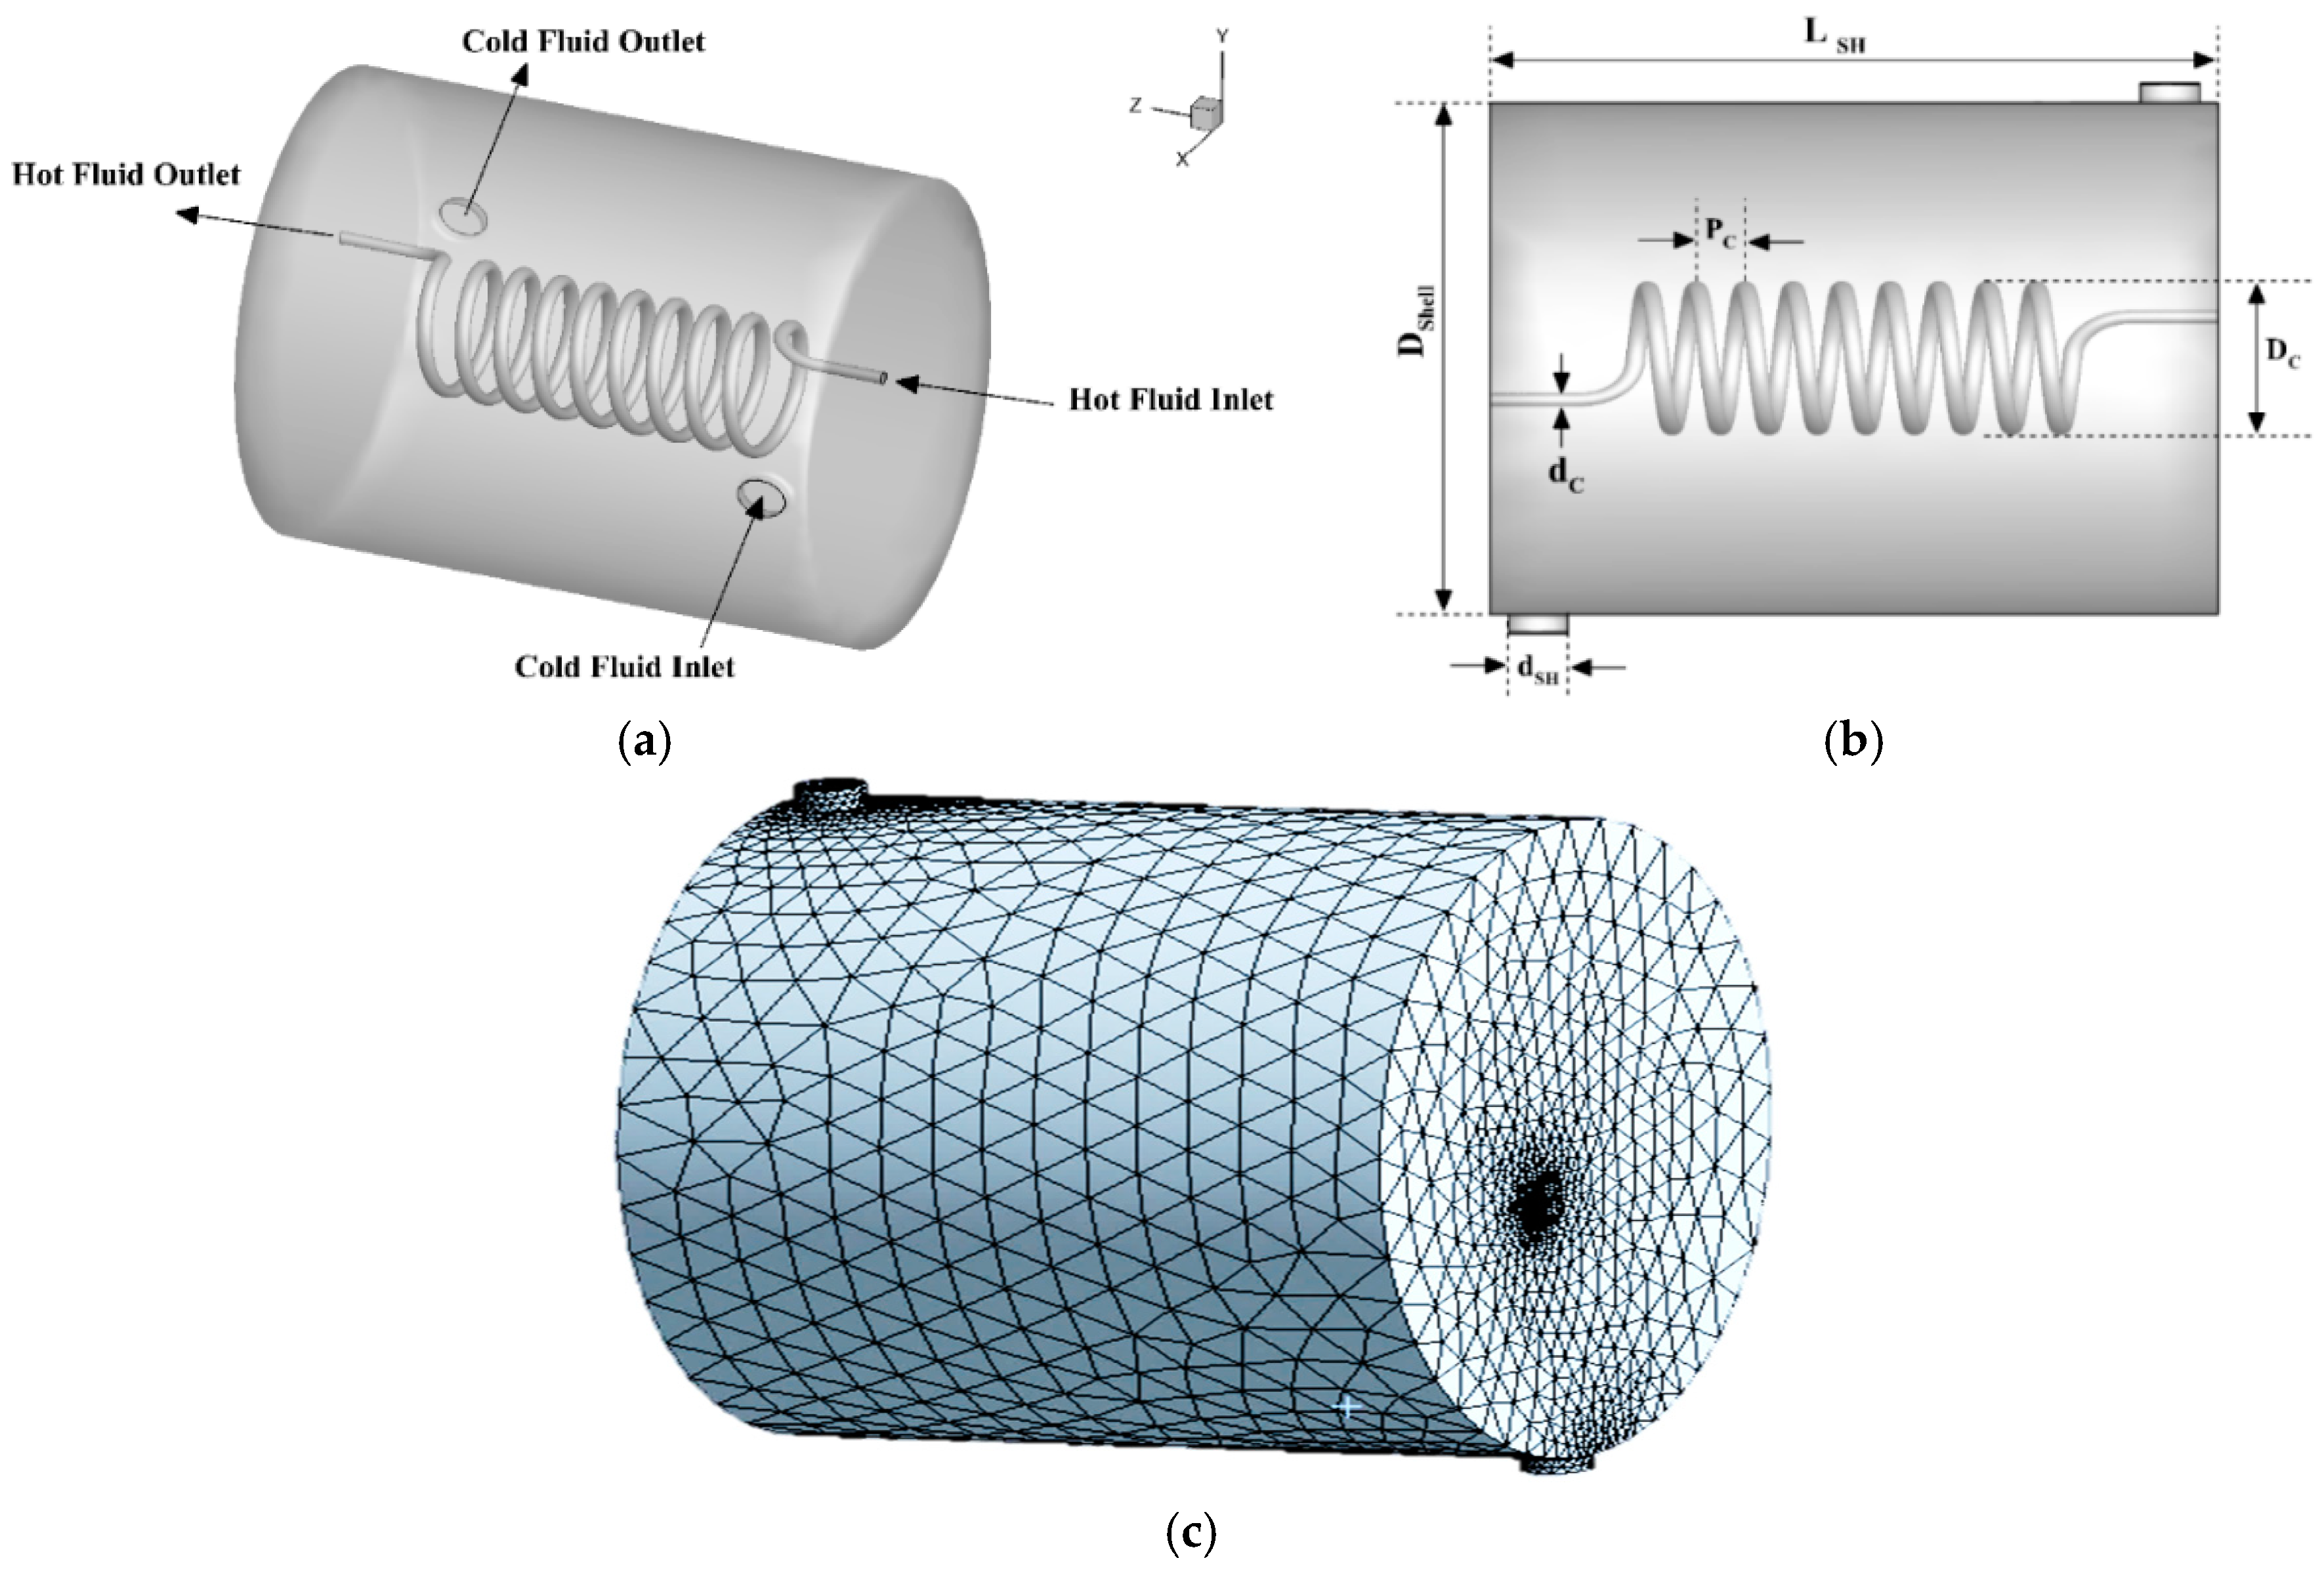
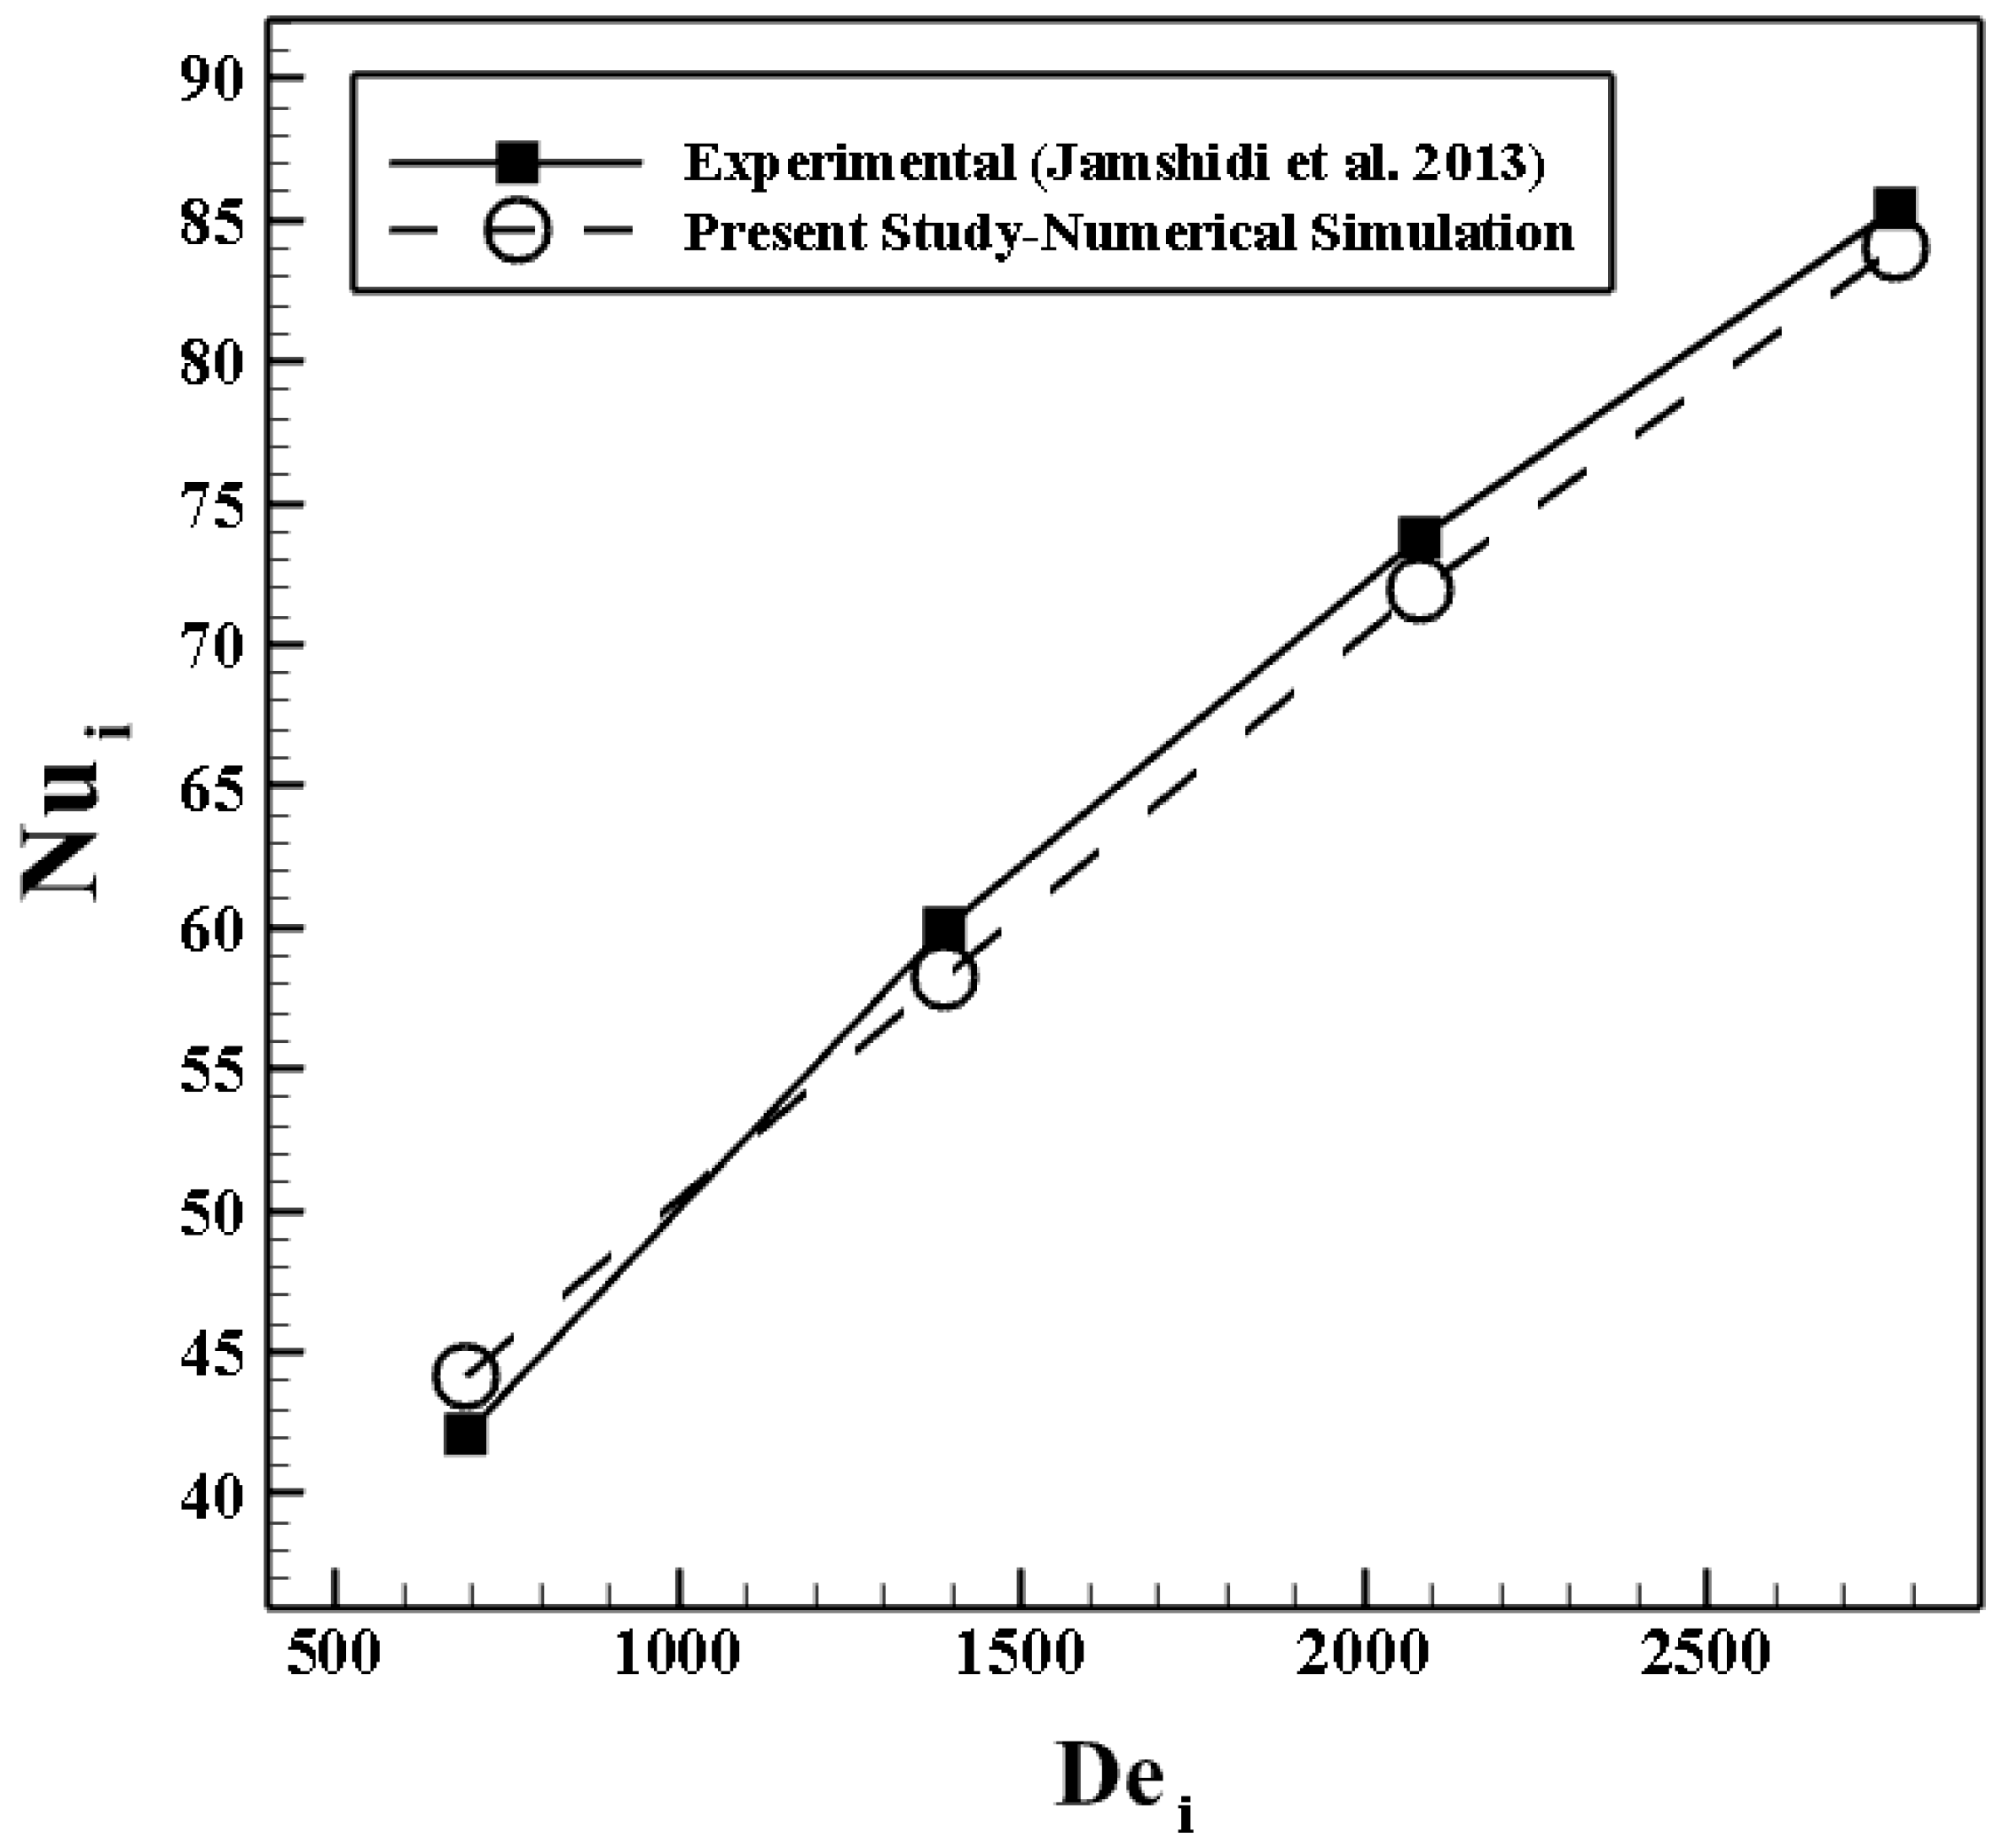
4.1.1. Validation of the Heat Transfer Process in a Shell and Coil Tube Heat Exchanger

In order to model the melting process in the shell and coil tube PCM storage, the heat transfer process in a shell and coil tube heat exchanger should be modeled and validated first. The experimental results of Jamshidi et al. [27] are then used for comparison purpose with the predictions of the present flow solver. The computational domain and geometrical parameters are illustrated in Figure 2a. The hot and cold fluids flow in the tube and shell, respectively. The working fluid for both channels is water. Both flows are considered as steady-state and both fluids are assumed to be incompressible and in a single-phase. A tetrahedral unstructured mesh grid is applied for the simulation. To account for the larger temperature gradients, close to the coil wall, 10 prismatic layers are used near the coil for both sides (tube and shell) as shown in Figure 2b. The operational and geometrical parameters are listed in Table 1. The inlet temperatures of the hot and cold fluids are 50 and 20 °C, respectively. The coil tube is inserted at the center of the shell.
For the boundary conditions, a mass flowrate is imposed at both inlets (coil tube and shell), whereas a pressure outlet condition is imposed at both outlets. The outer wall of the shell is adiabatic. The governing equations are computed initially from the coil tube inlet.
Figure 3 displays the variations of the averaged Nusselt number within the inner side coil tube (hot side) with the Dean number based on the inner coil tube characteristics. Four different Dean numbers including 700, 1400, 2100, and 2800 are considered. As it can be clearly seen, the present results compare fairly well with the measurements of Jamshidi et al. [27] with a maximum difference of 4.8% at Dei = 700 and an averaged error of 2.5% over the whole range of Dean number considered here.

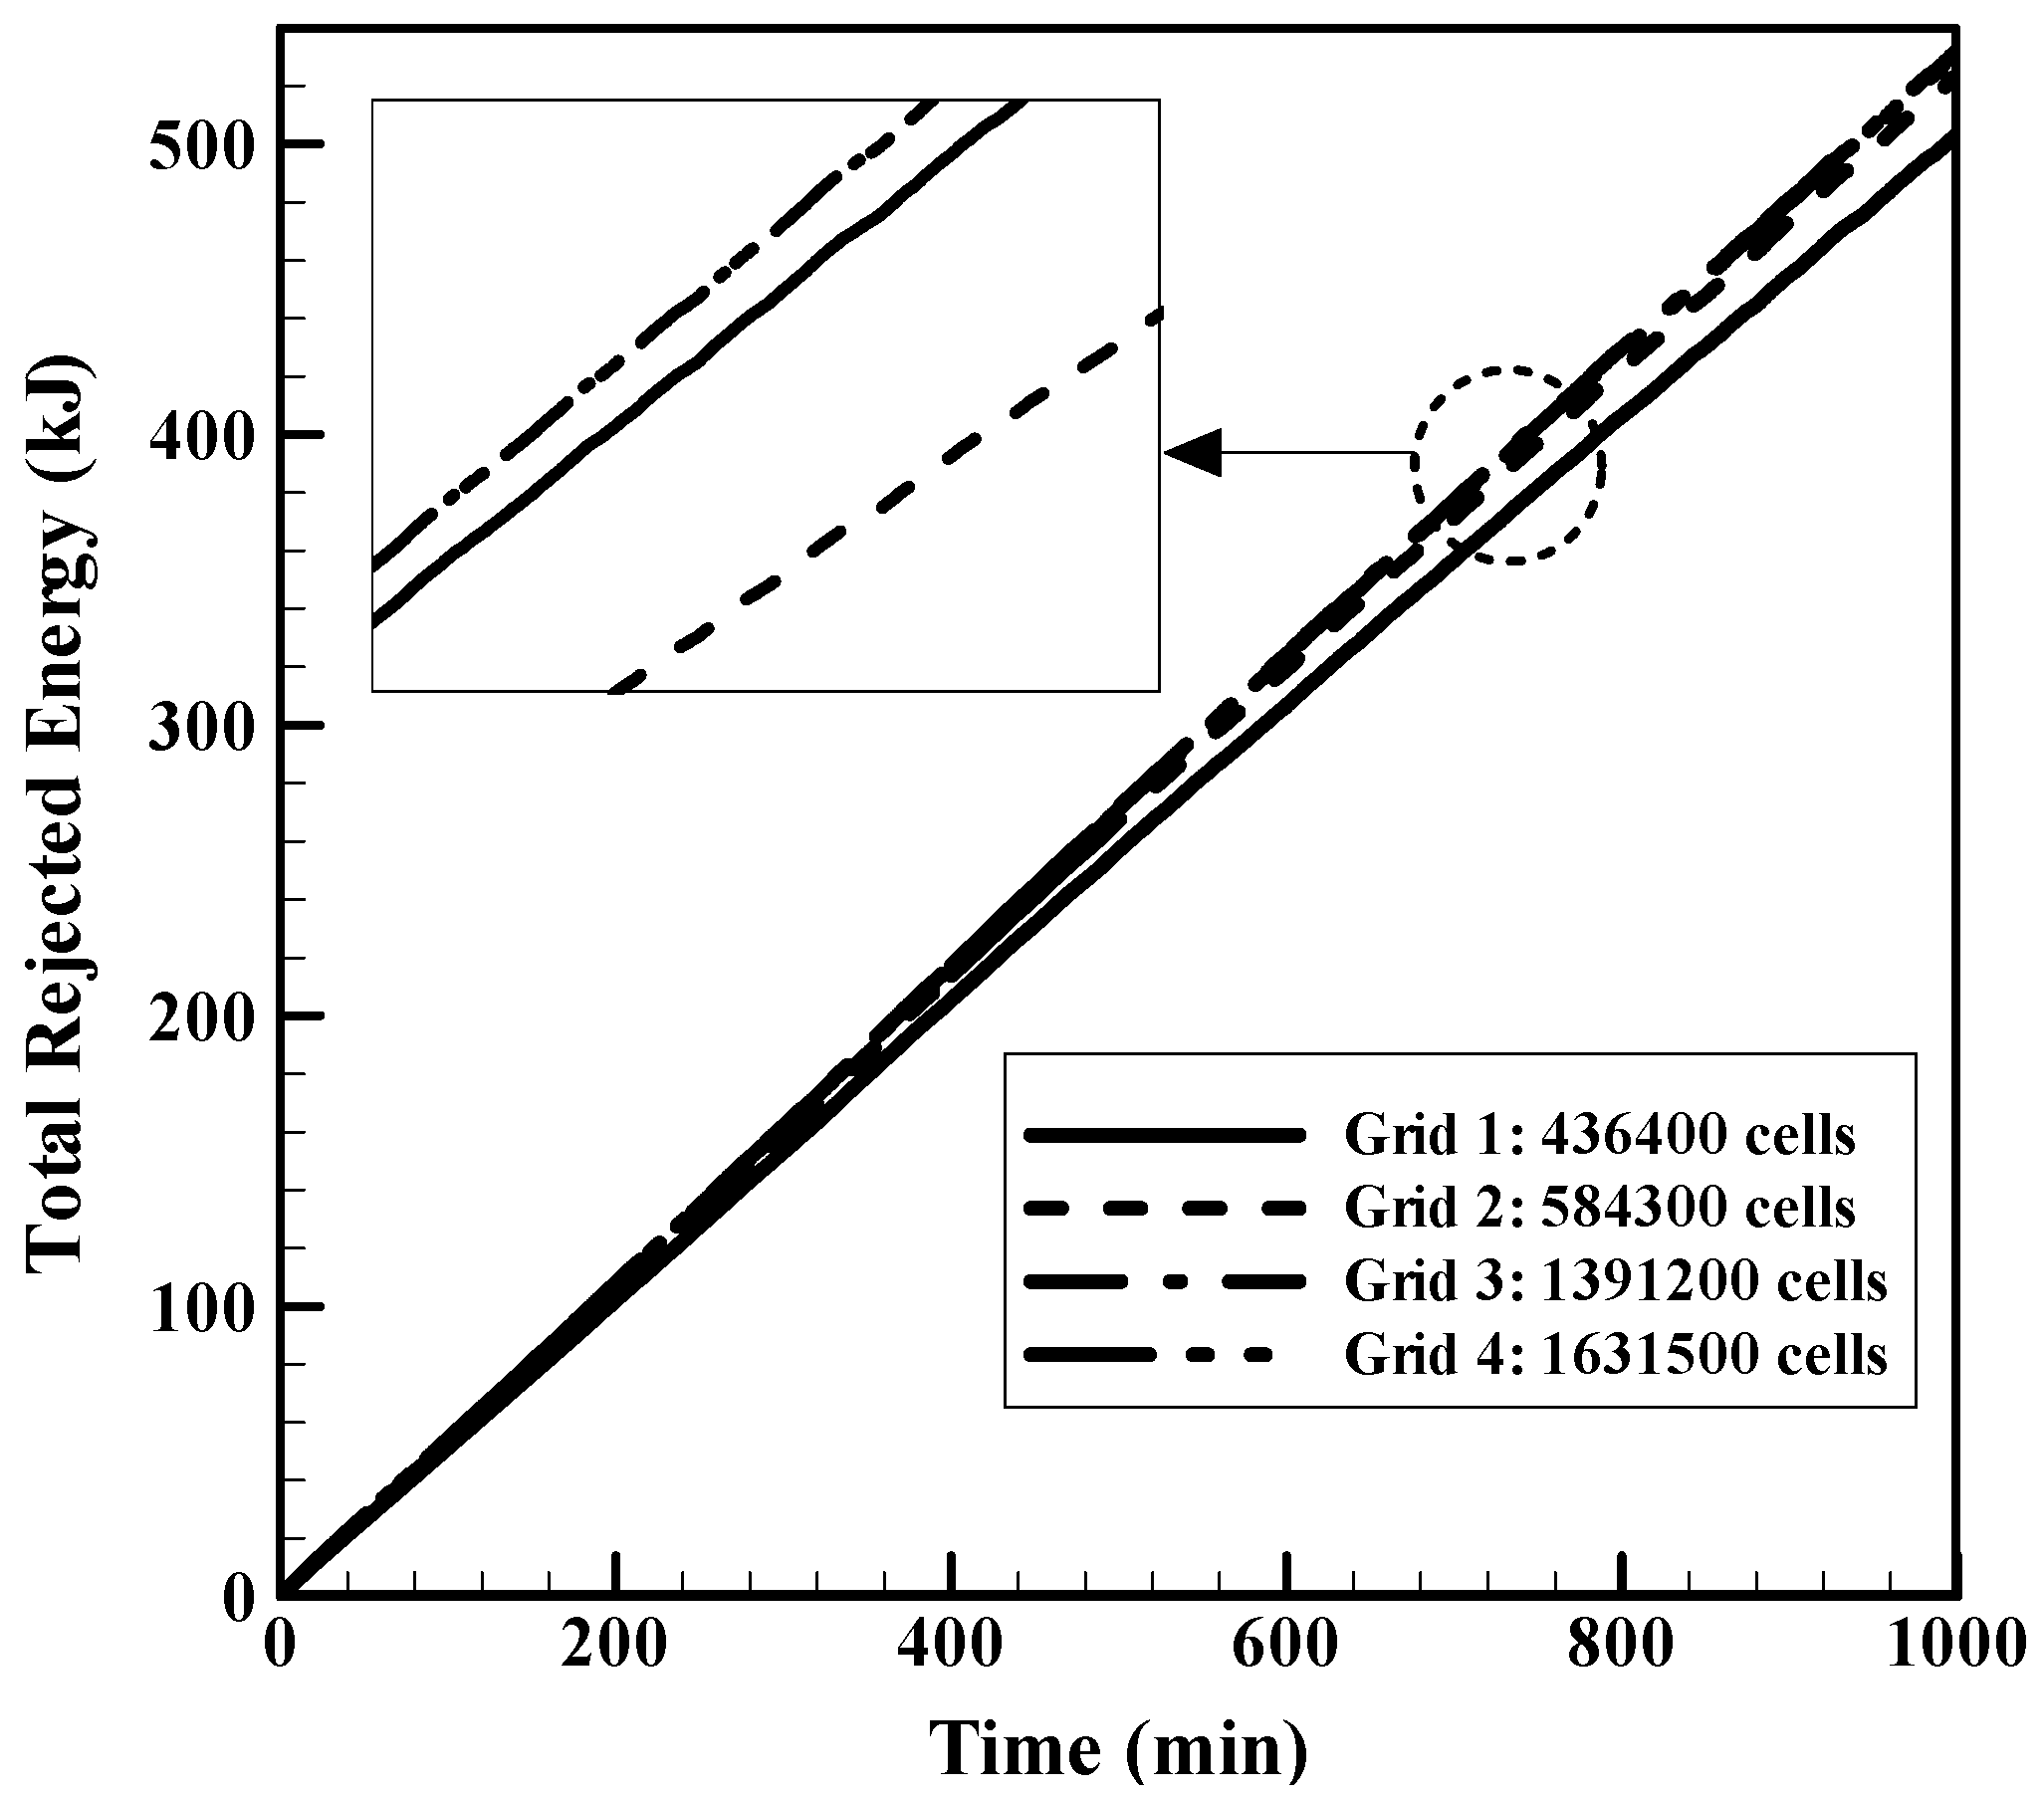
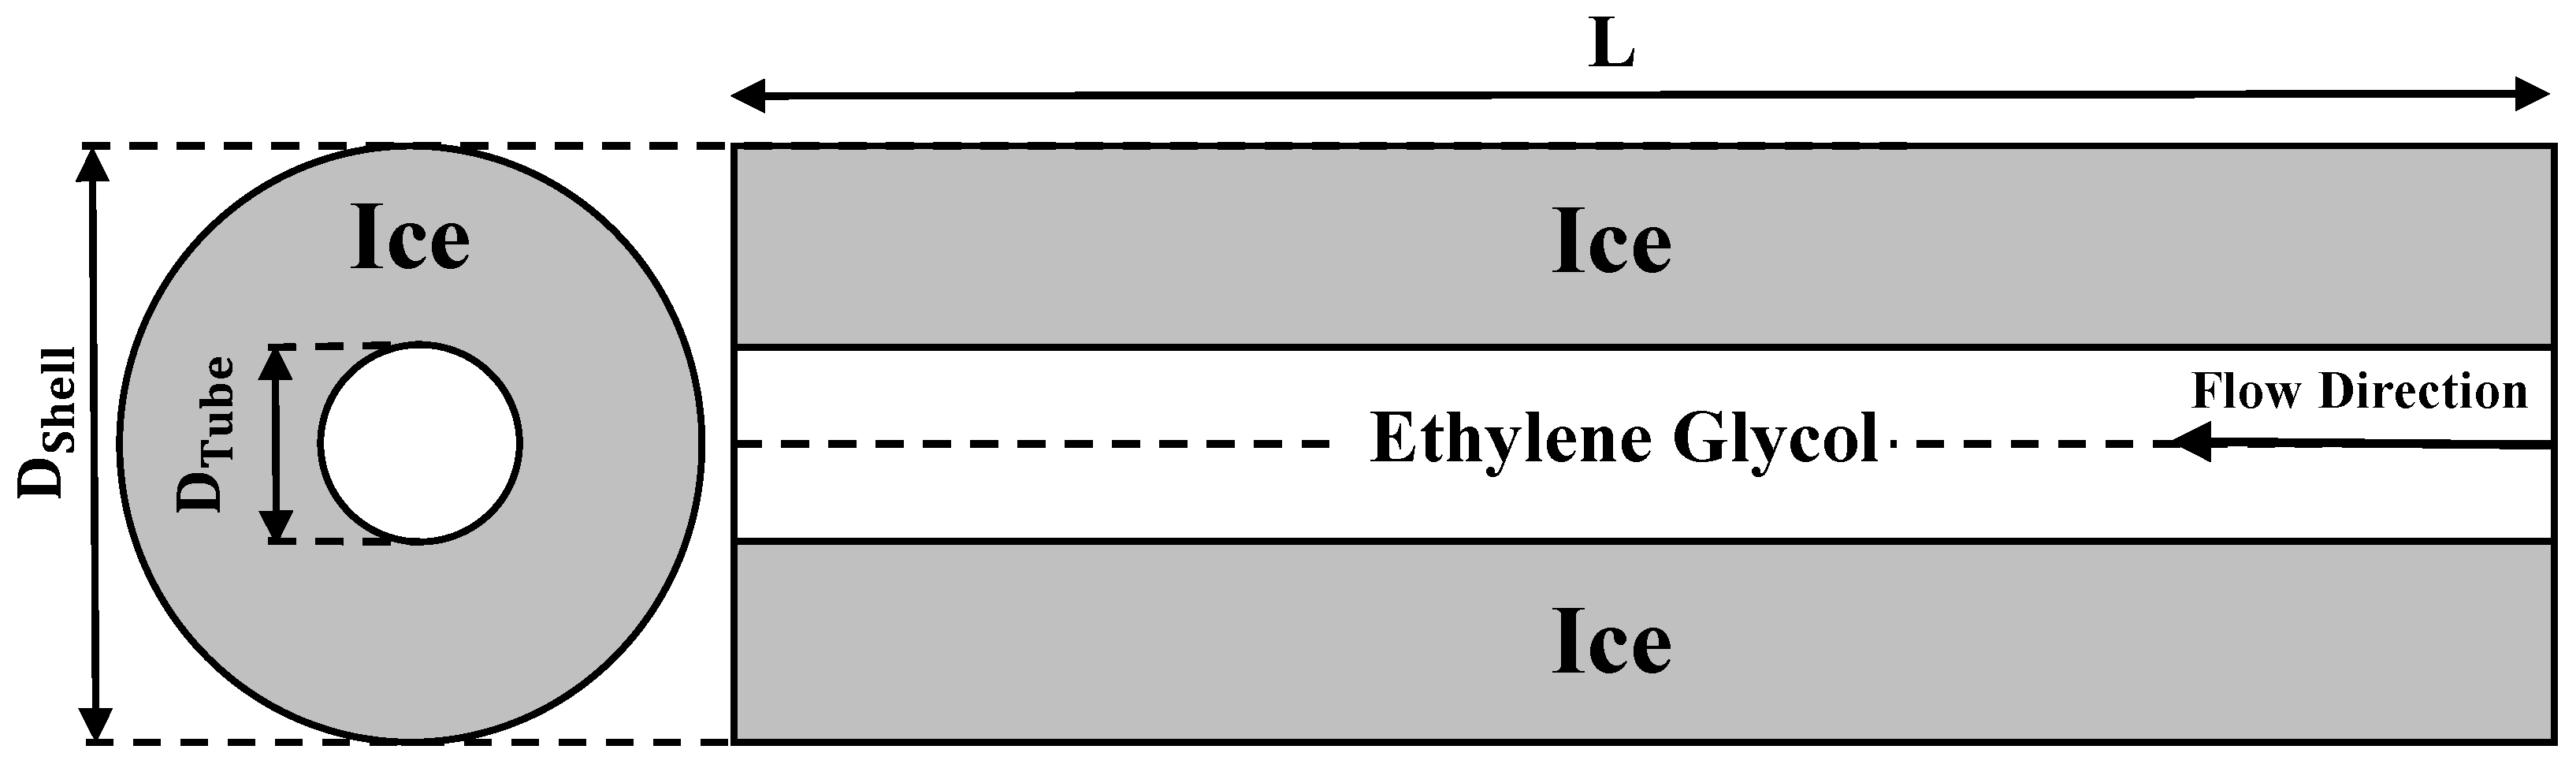
4.1.2. Validation and Mesh Independent Study of the Ice Melting Process in a Double Tube Heat Exchanger

The experimental study of Ezan et al. [7] is used for this second validation of the flow solver. Ethylene glycol flows within the inner tube while the shell is full of ice. The length of the tank, tube diameter, and shell diameter are 400, 15, and 180 mm, respectively (Figure 4). Because of the temperature difference between the tube and the tank at the initial conditions, heat transfers from the HTF wall (tube wall) to ice by both convection and conduction. Radiation heat transfer is neglected. The outer walls of all investigated models are well insulated. The inlet mass flowrate and temperature of ethylene glycol are fixed to 2 L/min and 5 °C, respectively.
A quadrilateral structured mesh grid with 52,800 cells and a minimum orthogonal quality equal to 0.94 is applied for the simulation. Because of the larger temperature gradients near the inner tube containing ethylene glycol channel, 10 prismatic layers are used near the inner tube on both sides (tube and shell). Initially, temperatures in the inner and outer tubes (ethylene glycol and ice) are fixed to the melting temperature of ice. The inlet mass flowrate and temperature of the heat transfer fluid (ethylene glycol) are 2 L/min and +5 °C, respectively. The thermo-physical properties of water, ice and ethylene glycol [9] are listed in Table 2. The buoyancy effect is modeled by using the Boussinesq approximation.
As shown in Figure 5, the numerical results of the ice melting process are compared with the experimental results reported by Ezan et al. [7] with respect to the total rejected energy versus time. The total energy of the system for a given time can be defined as the integration of specific energies for each control volume, over the whole domain. The total rejected energy can be calculated as
E(t) = ESensible (t) + ELatent (t)
Sensible and latent components can be defined for the melting process as
E Sensible ( t )   =   { C Water T   :   Liquid   Phase C Ice T   :   Solid   Phase
E Latent ( t )   =   ρ Ice   ×   f ( t )   ×   L
where L is the latent heat and f(t) is the fraction of ice volume in each control volume.
As show in Figure 5, the present solver predicts fairly well the temporal evolution of the total rejected energy measured by Ezan et al. [7]. The maximum difference with the experimental data reaches 7.1% at t = 440 min. For the mesh independent study, the results of the validated model were investigated for four different grids composed of 436,400; 584,300; 1,391,200; and 1,631,500 cells. The obtained results are displayed in Figure 6. There is no significant difference between the 584,300; 1,391,200; and 1,631,500 grids. To save computational resources, the grid composed of 584,300 cells associated with a 0.5 s time step is selected in the following.

4.2. Influence of the Operational Parameters

To observe the effects of HTF inlet temperature and flow rate on total rejected energy, numerical investigations are performed for Tinlet = 5, 7.5, 10, and 12.5 °C with V ˙ = 2, 4, 6, and 8 L/min. Before performing a parametric study to quantify the influence of both parameters on the melting process, the case for Tinlet = 5 °C and V ˙ = 4 L/min is considered first on Figure 7, which shows the contours of liquid fraction after 250 and 500 min for the shell and coil tube ice storage tank.
At t = 0 min, a very thin layer of liquid forms around the hot inner coil tube. This layer expands progressively with time. Ice is clearly more melted in the top region of the ice storage tank. Natural convection plays a crucial role in this zone where warm liquid rises to the top and cooler liquid goes down by the conservation of mass. At the bottom region of the shell, which is full of ice, heat is transferred between the hot surface of the inner coil tube and the cold ice by conduction. Accordingly, the results show an unstable structure near the top region of the tank that leads to the formation of a wavy solid–liquid interface. As time passes, the liquid water layer reaches the outer surface. Also, results indicate that the melting process starts from the inner wall surface (Figure 7). A thin layer of liquid is formed around the hot inner coil tube. The heat transfer process is only governed by the conduction. After several minutes, this layer is spread and convection becomes the dominant mechanism.

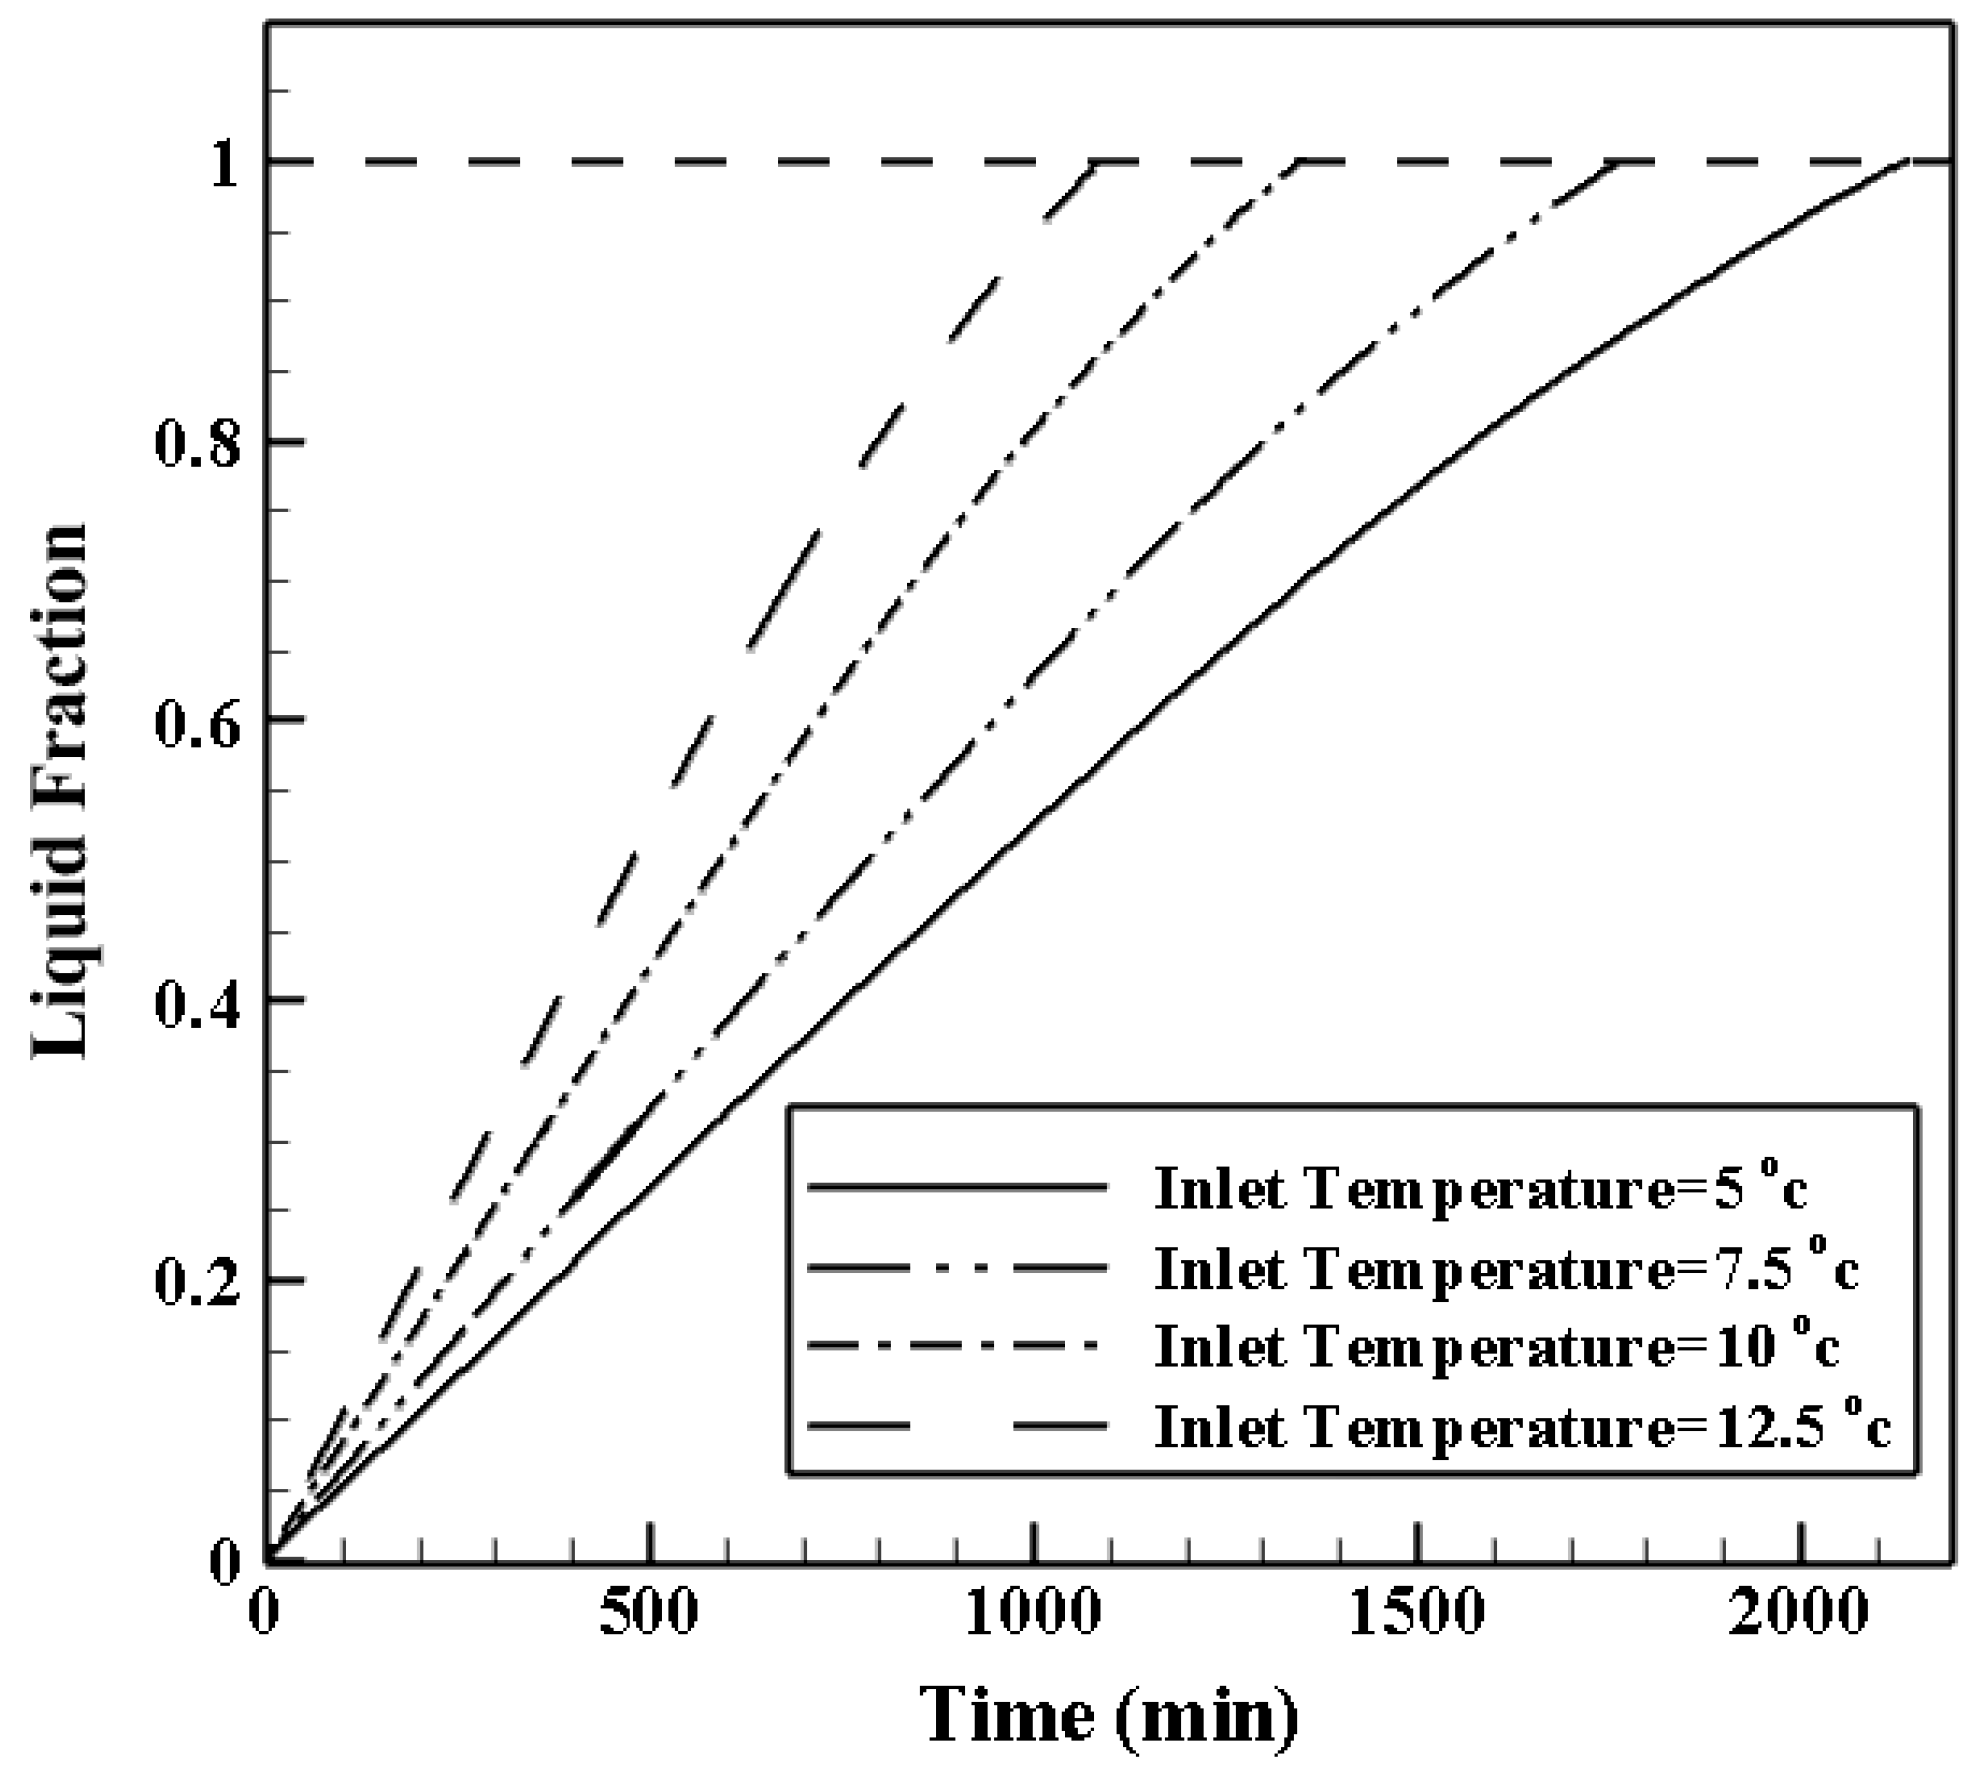
4.2.1. Effects of HTF (Heat Transfer Fluid) Inlet Temperature

The temporal evolution of the liquid fraction within the shell and coil tube ice storage tank is plotted in Figure 8 for four different HTF inlet temperatures of ethylene glycol, namely 5, 7.5, 10, and 12.5 °C for a volumetric flowrate V ˙ = 2 L/min. As it can be clearly seen, by increasing the inlet temperature from 5 to 7.5 °C, the melting time decreases intensely, by about 25%. By increasing it further from 7.5 to 10 °C, the melting time reduction is about 33%. The melting time continues to decrease by about 23% when Tinlet increases from 10 to 12.5 °C.
To understand the effect of the HTF inlet temperature on the melting process, the contours of liquid fraction for the shell-and-tube ice storage with two different inlet temperature (7.5 and 10 °C) are depicted in Figure 9. As illustrated, for melting of 25% of PCM, the heat transfer process is only governed by the conduction mechanism so that the contours of the both models are the same. After some time, the effect of natural convection in the PCM plays an important role (melting of 50–100% PCM) so that the differences between the models appears obviously. Finally, the system with higher inlet temperature melts faster.

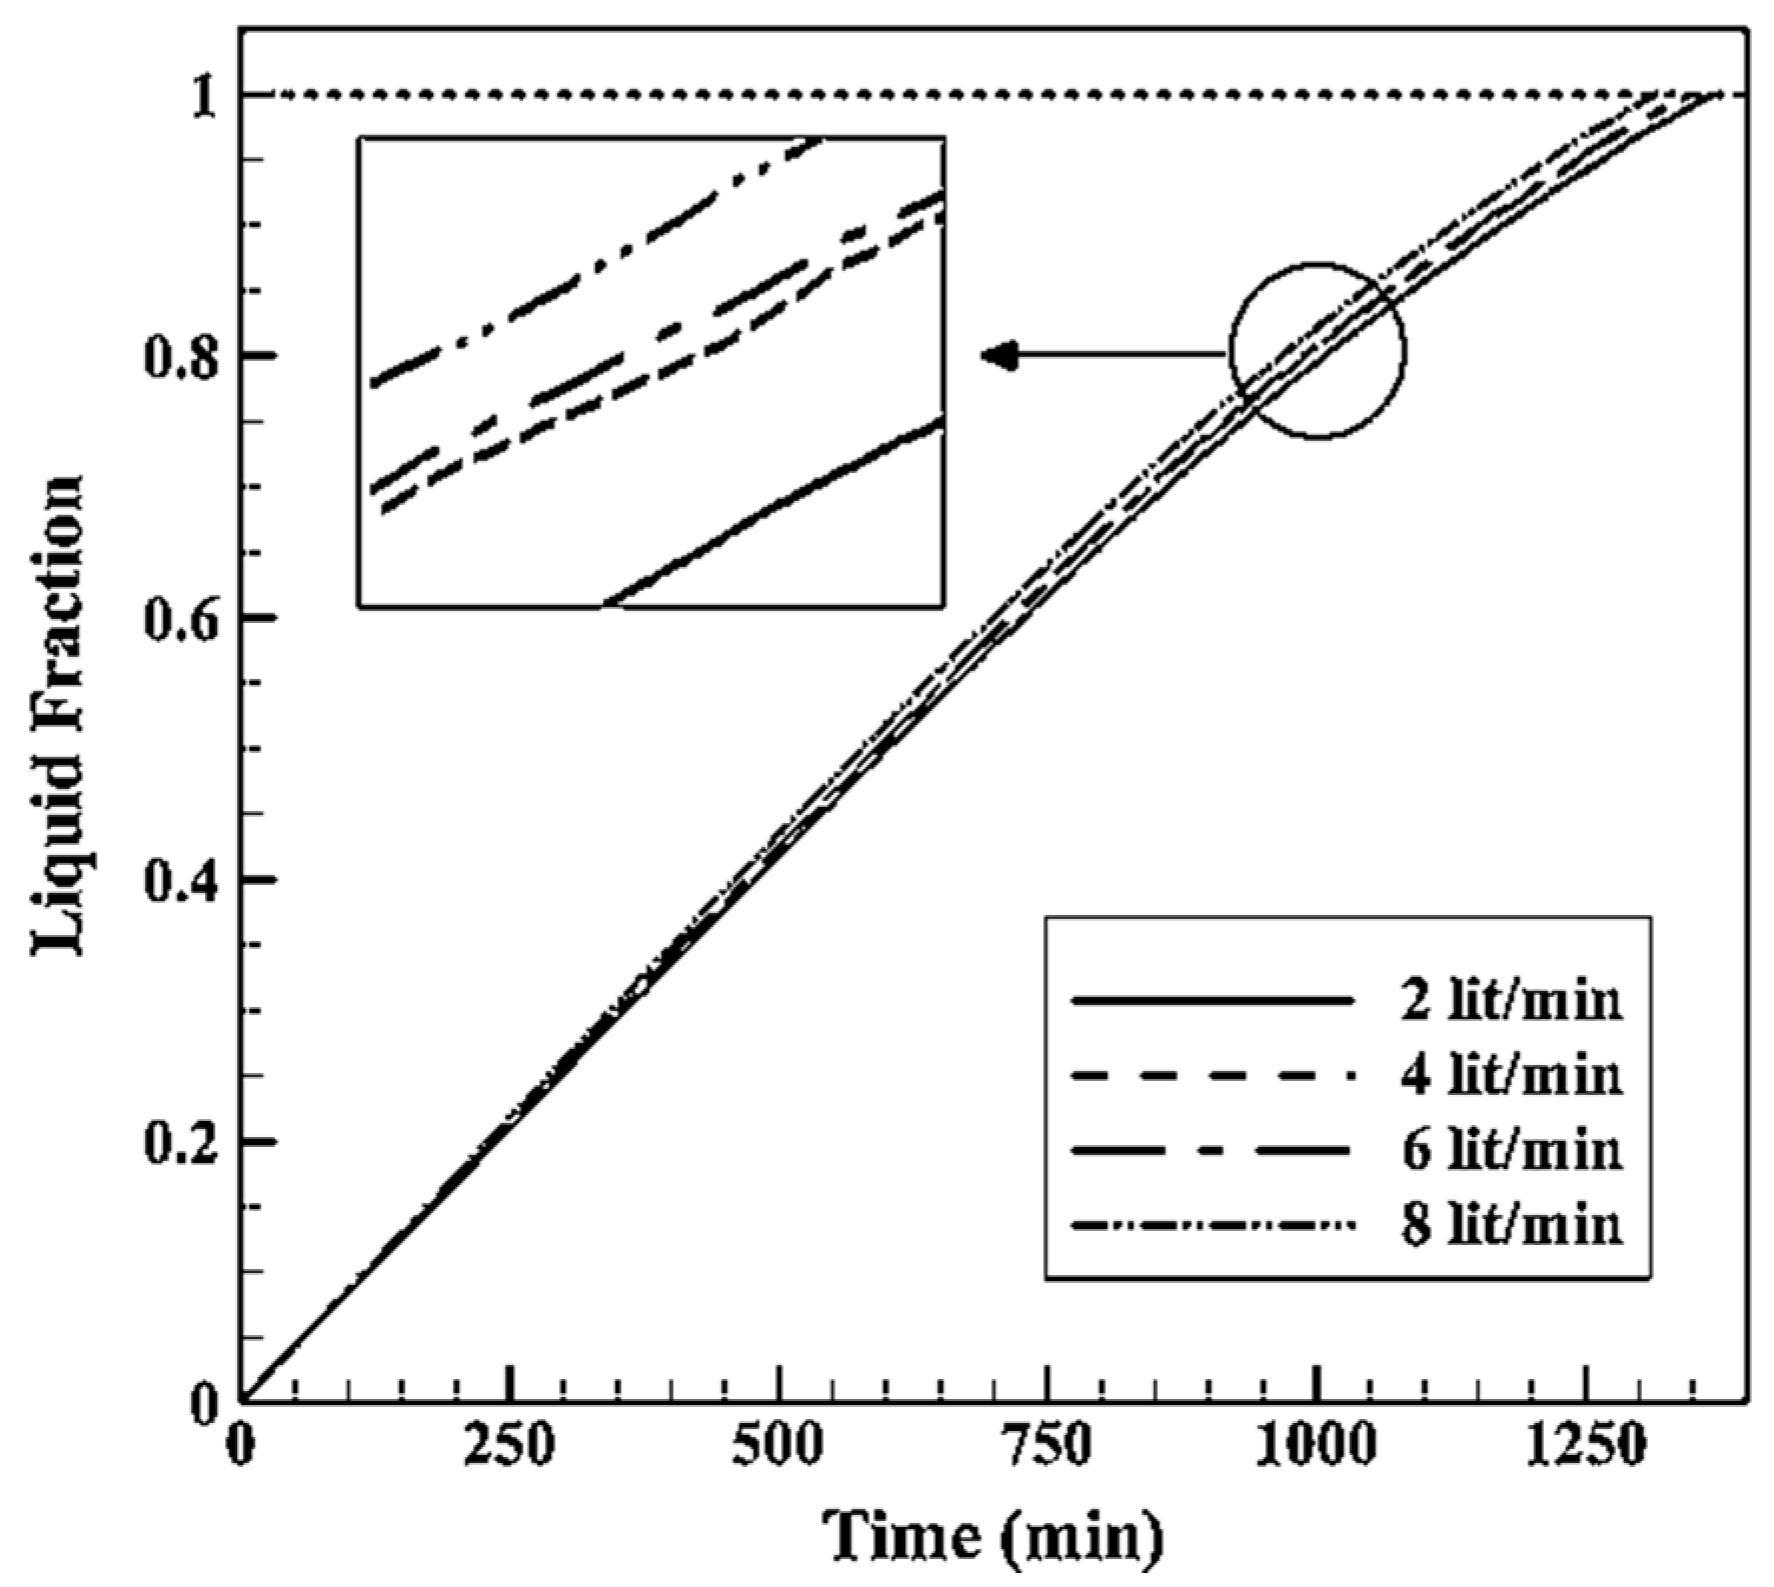
4.2.2. Effects of HTF Inlet Mass Flowrate

Figure 10 shows the effect of the HTF mass flowrate of ethylene glycol on the liquid fraction for the shell and coil tube ice storage system. Four different mass flowrates including 2, 4, 6, and 8 L/min are considered. As it can be seen, increasing the mass flowrate from 2 to 8 L/min decreases the melting time by about 2% at long times (typically t = 1250 min). The influence is even less significant at short times.

4.3. Influence of the Geometrical Parameters

In this section, a parametric study is performed to determine the effects of geometrical parameters including coil pitch (P), coil diameter (d), and coil height (HC) on melting process. In each model, two cases are considered. For instance, to study the effect of coil pitch (P), cases A and B are considered to simulate the melting process of ice in the shell and coil tube ice storage system. To compare logically the cases, the heat transfer area that is the lateral area of the coil, is kept constant in the cases which should be compared with together (A with B, C with D, and E with F). Accordingly, in order to keep the heat transfer area constant, one of the geometrical parameters is considered as a free parameter. Here, helix diameter (DC) is the free parameter. On the other hand, to study the effect one parameter, the helix diameter (DC) changes for keeping constant the heat transfer.
The coil geometrical parameters for all investigated models are listed in Table 3. Number of six models are studied which accordingly evaluates the effects of three different coil geometrics. The helix diameter (DS) and the heat transfer area (A) are kept constant to compare all models. The shell geometrical parameters are listed in Table 4. The dimensions of the shell are kept constant in all simulation. Also, L is the spiral coil length and A is the heat transfer area which are defined by the Equations (14) and (15), respectively. HC is helix height, P is coil pitch, DC is helix diameter, and d is the coil diameter. The schematic view of all considered models (case A–F) are illustrated in Figure 11.
L   =   H C P   ( π D C ) 2 + P 2
A   =   L   π   d

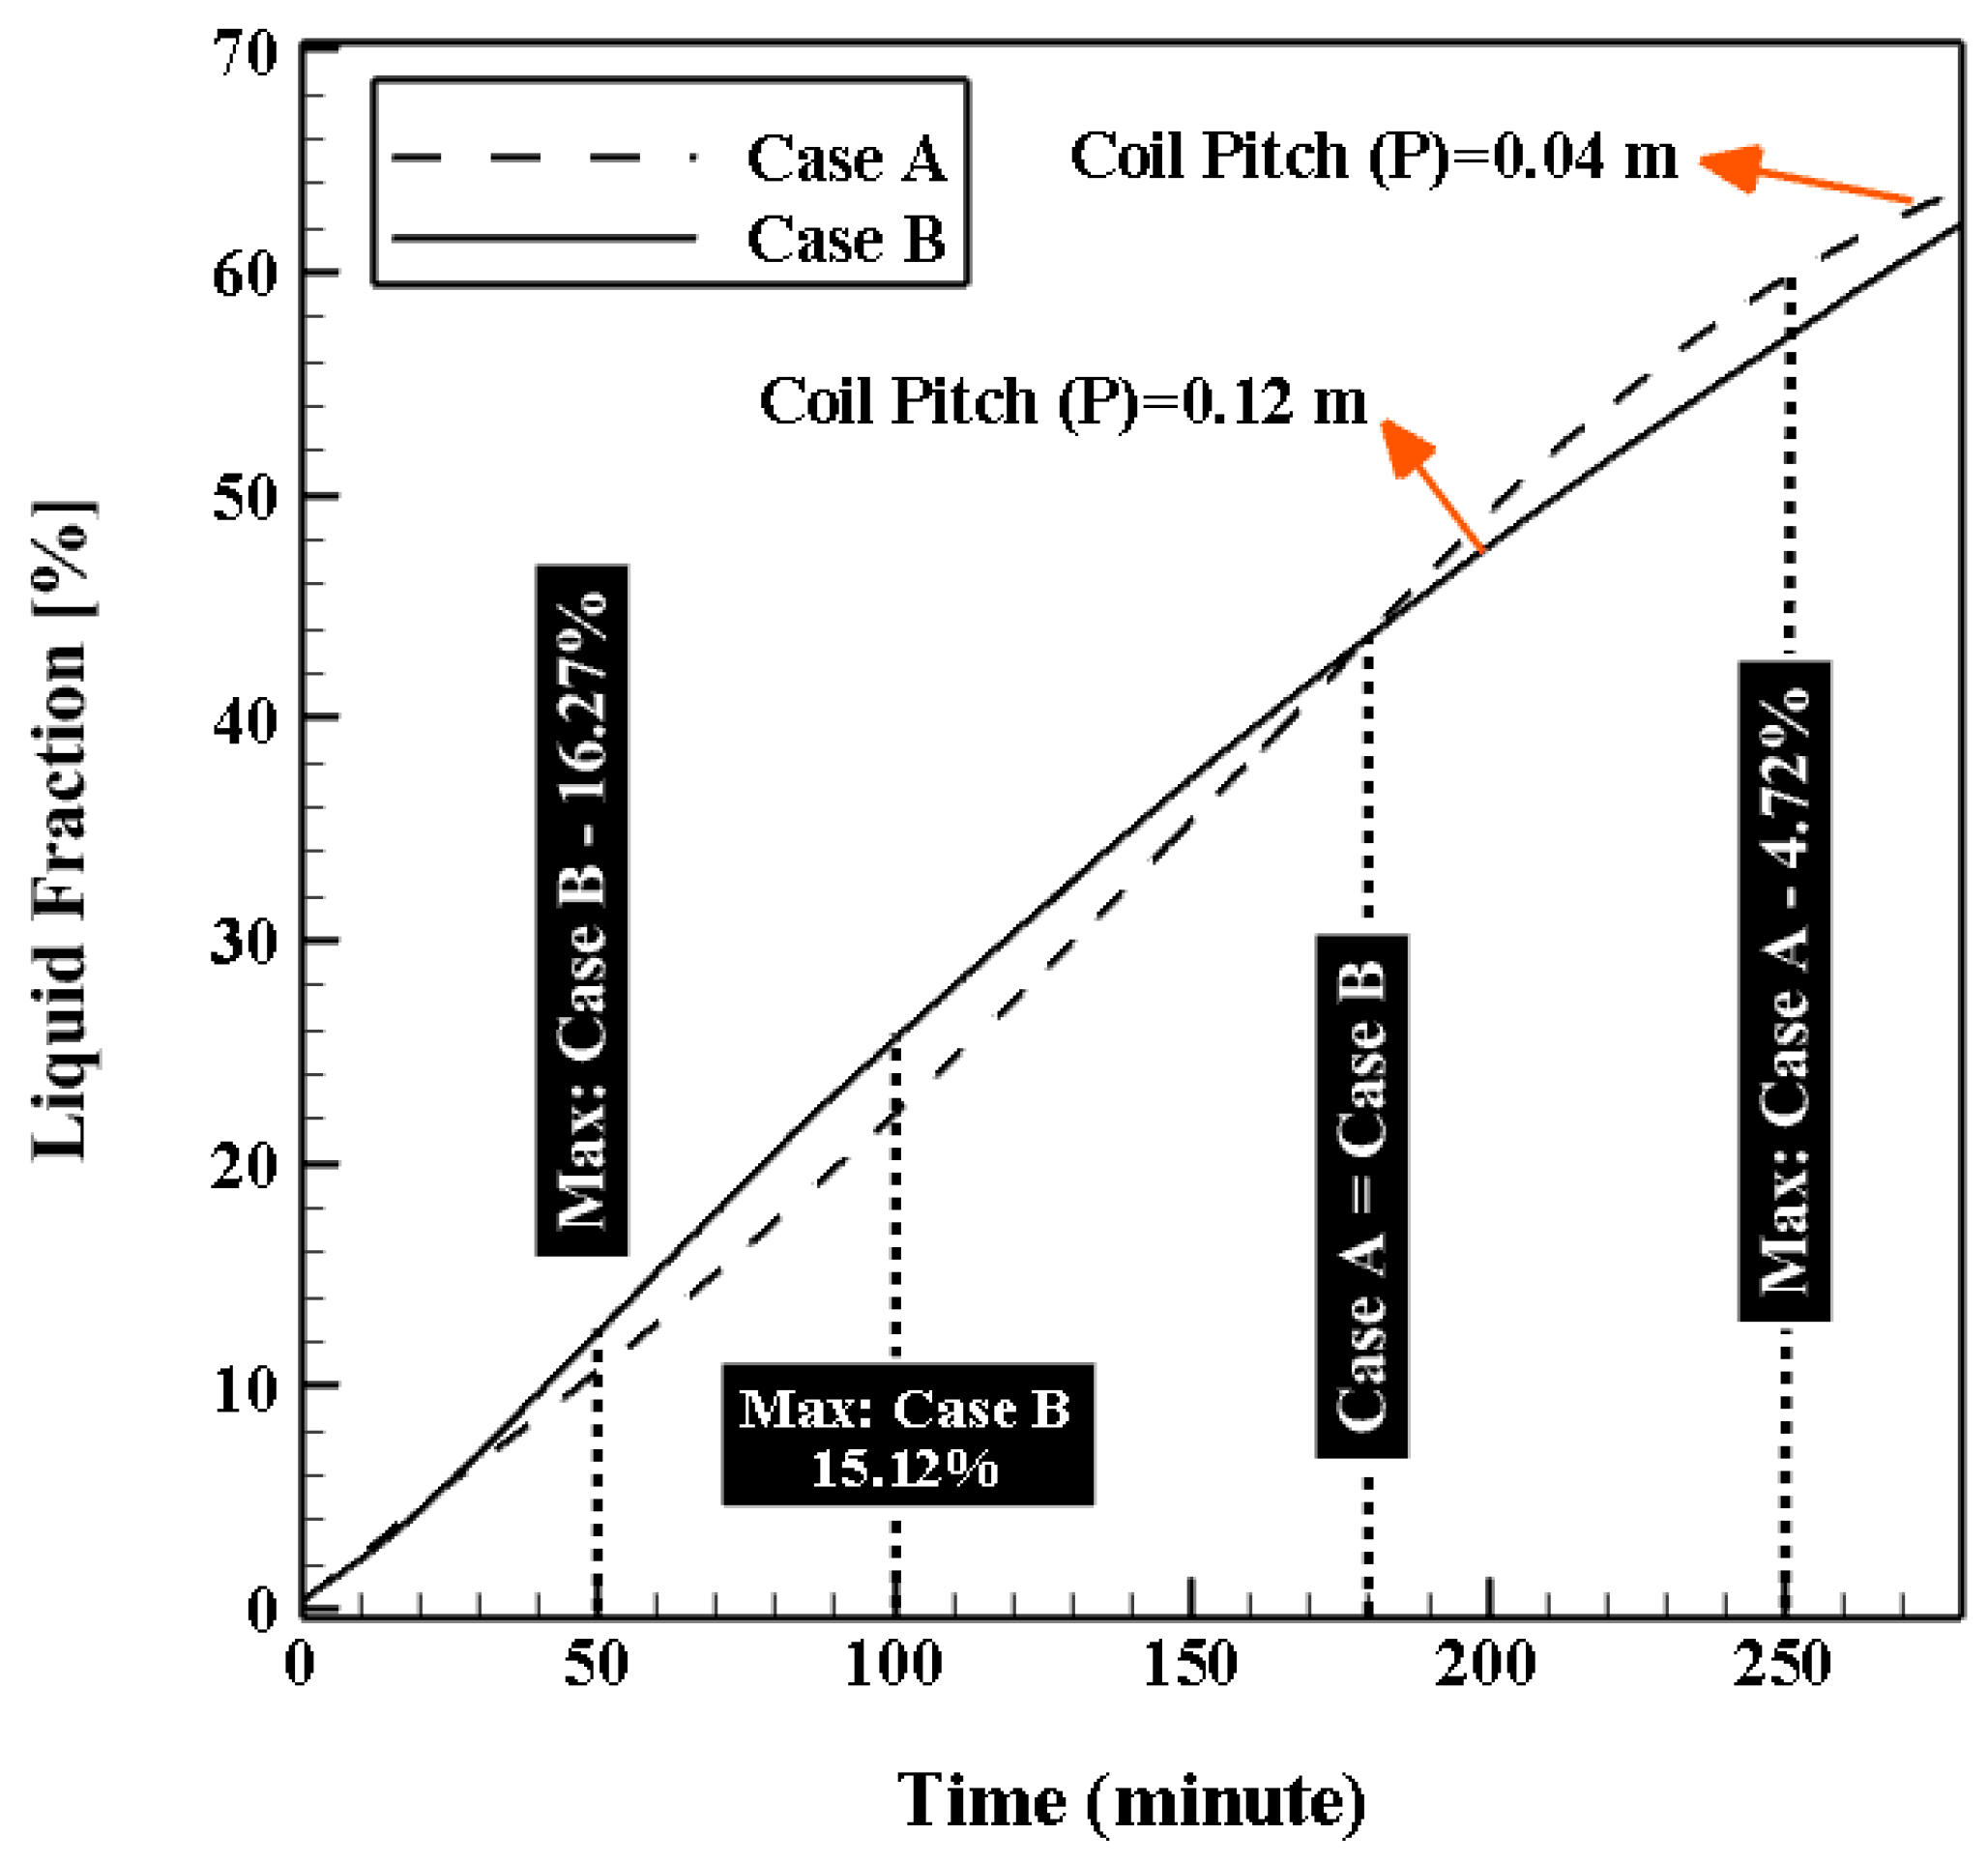
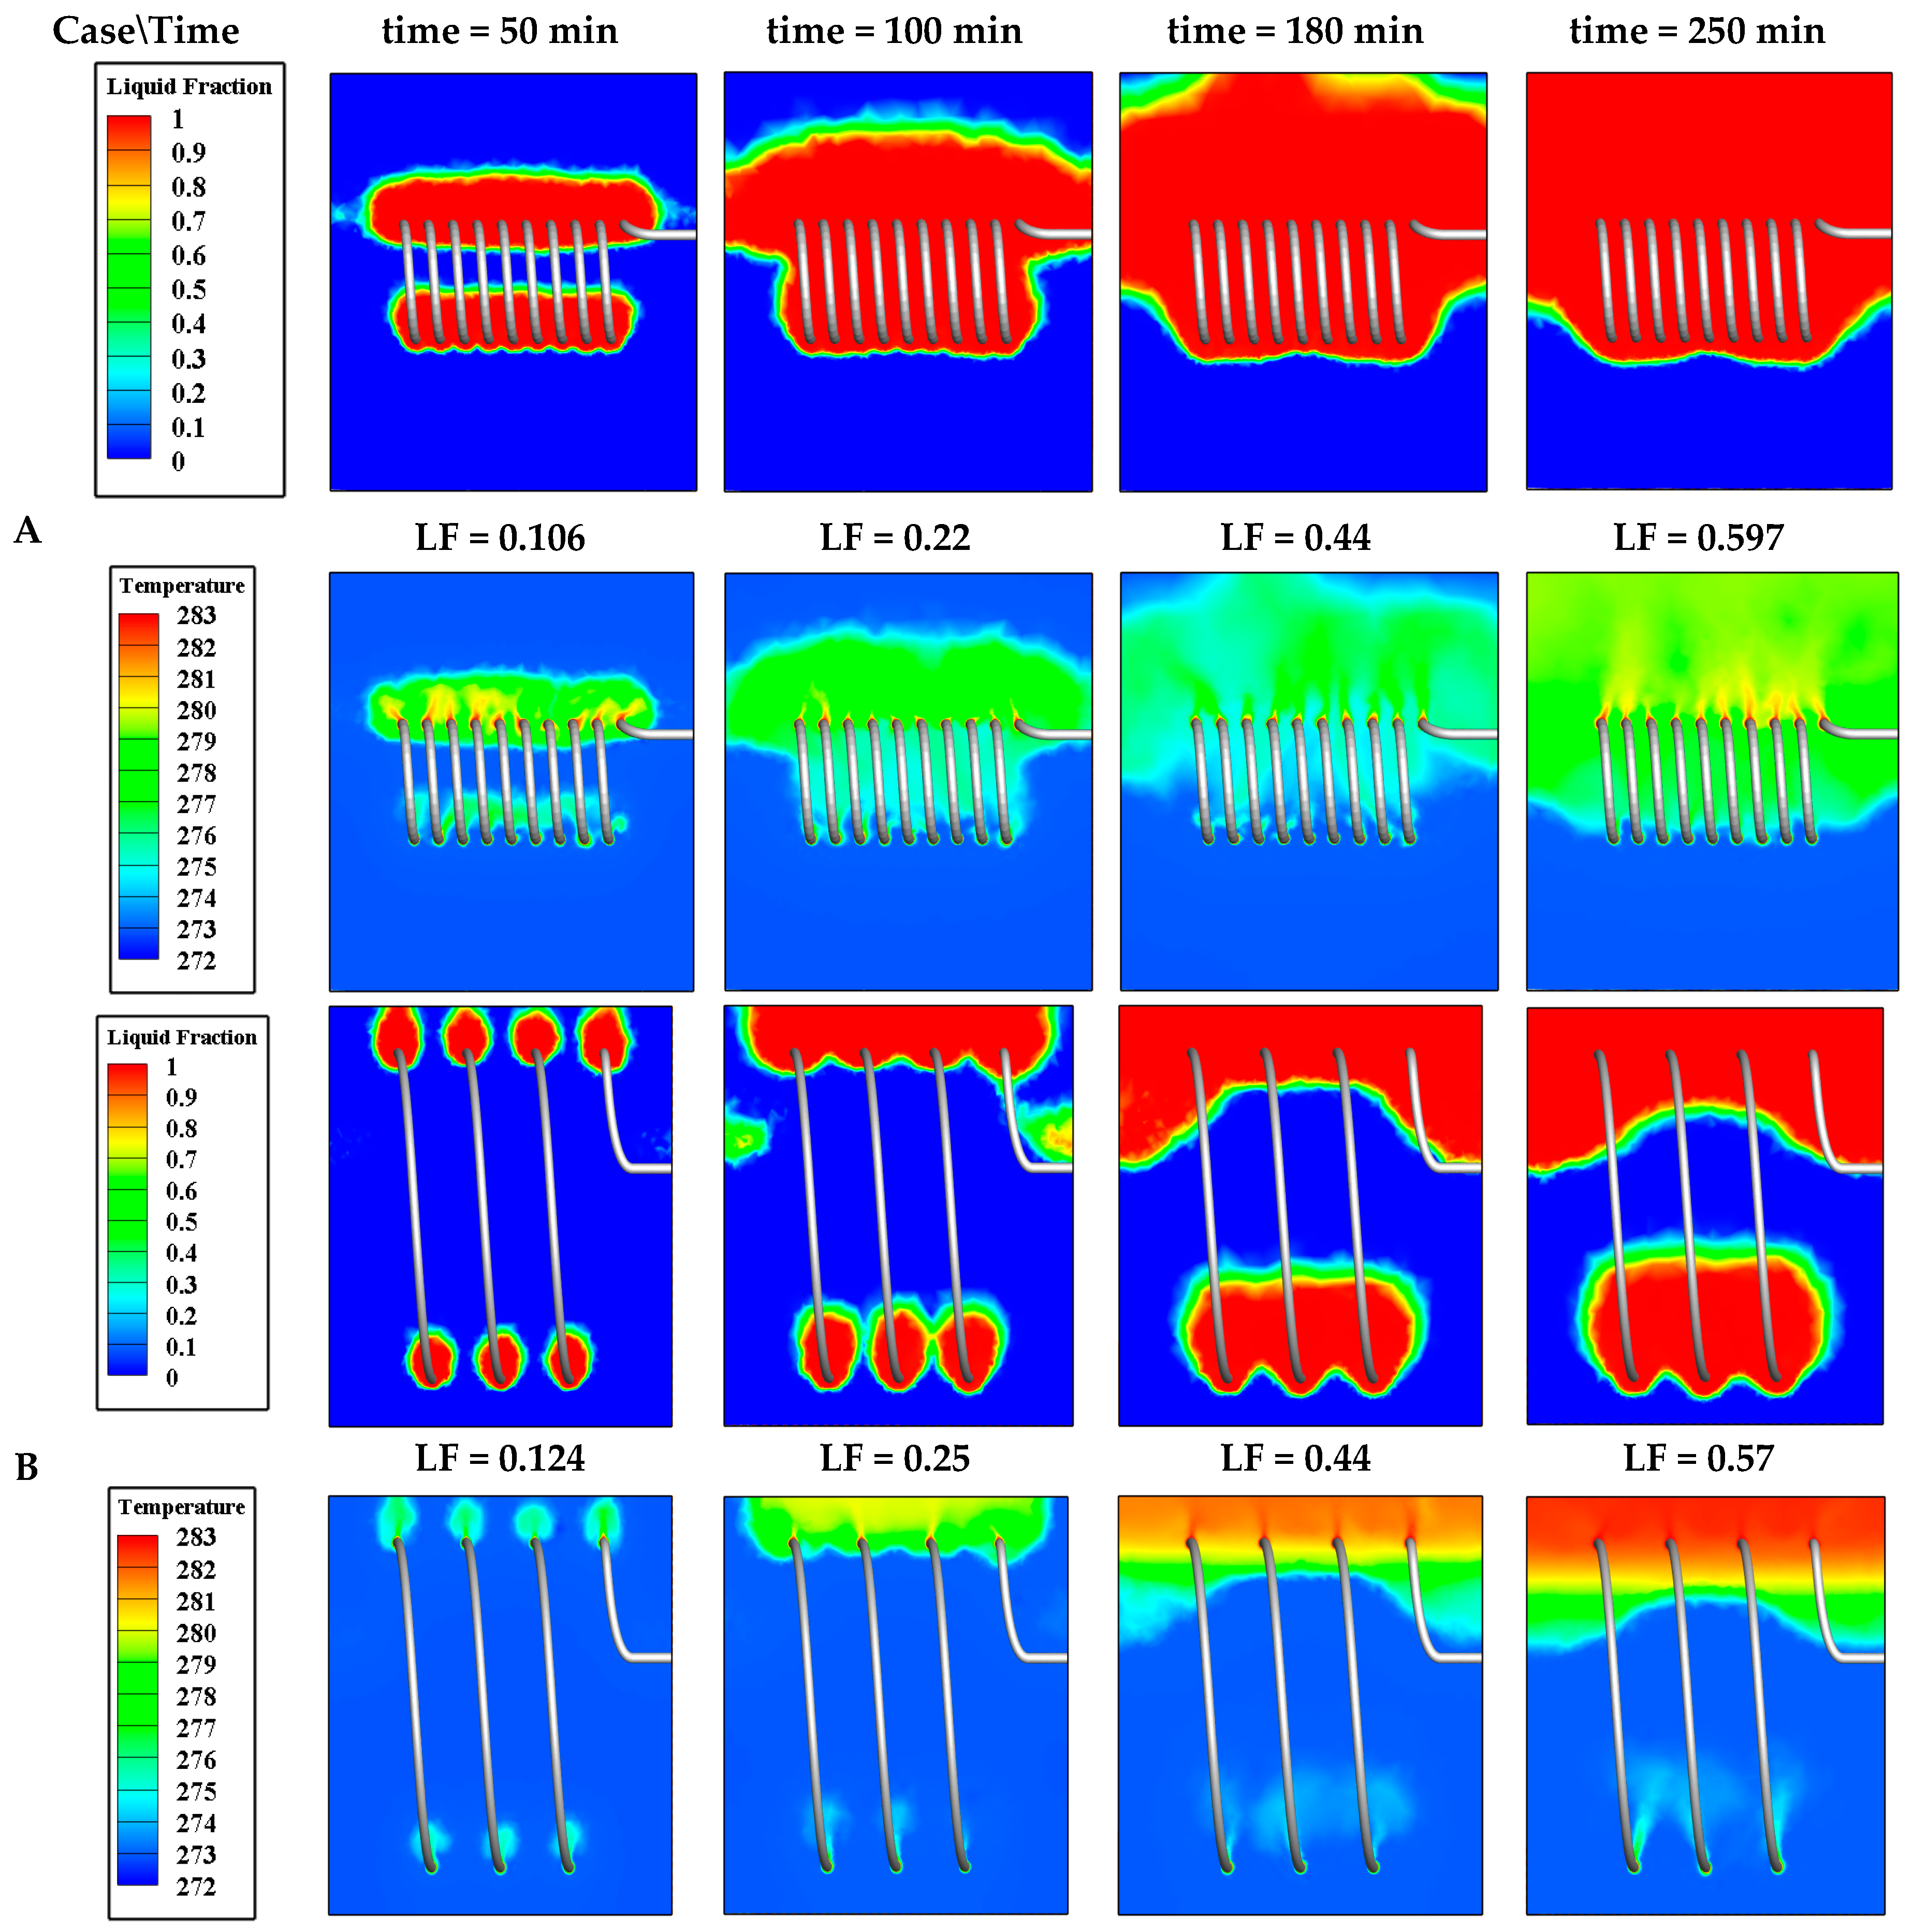
4.3.1. Effect of Coil Pitch (P)

In this section, the effect of coil pitch is investigated numerically. Accordingly, two cases including case A and case B are considered for numerical simulation. The geometrical parameters of these cases (coils and shell) are listed in Table 3 and Table 4. Two different coil pitches including 0.04 and 0.12 m and two calculated helix diameters as free parameter (in order to keep constant the heat transfer area) including 0.17 and 0.48 m are selected for cases A and B, respectively. The height of spiral coil and the coil diameter are considered 0.36 and 0.016 m, respectively. The dimensions of the shell are kept constant as listed in Table 4. The configurations of the two investigated cases (A and B) are illustrated in Figure 11. The liquid fraction (LF) of two cases of A and B are depicted in Figure 12. The LF is drawn for 280 min. These cases are compared in four points including 50, 100, 180, and 250 min.
As illustrated in Figure 12, at time = 50 min, case B has the best performance with LF improvement of 16.3%. At time = 100 min, case B has a better thermal performance in comparison with the case A with LF improvement of 15.1%. Case B has a better thermal performance compared to the case A until time = 180 min. After that, the melting rate changes and case A shows a better performance. For instance, at time = 250 min, case A has a better thermal performance with melting rate improvement of 4.3%. The liquid fraction and temperature contours for these two cases at different time are illustrated in Figure 13. According to Figure 13, until time = 180 min, as the case A is placed at the center of the shell, the melting rate of the ice is more than the case B. However, after that, because of the coil geometry of the case B, case B covers the bottom of the shell more than case A. Also, because of the buoyancy effect, the melting rate of the bottom region of the shell is lower than that of the top region.
Considering the melting rate in the top region, the results for cases A and B exhibit the same trend due to buoyancy effects. The melting rate is higher for case A compared to case B, but the results are opposite in the bottom region of the shell. Finally, at time = 180 min, the LF of both cases are equal. Although the melting region of the shell bottom region for case B is more than case A, the melting rate of the top region for case A is significantly more than case B, which can be attributed to the fact that the coil pitch of the case A is lower than case B. The melting rate in the shell for case A is more important than for case B but the difference gets low after 250 min (about 4.72%).

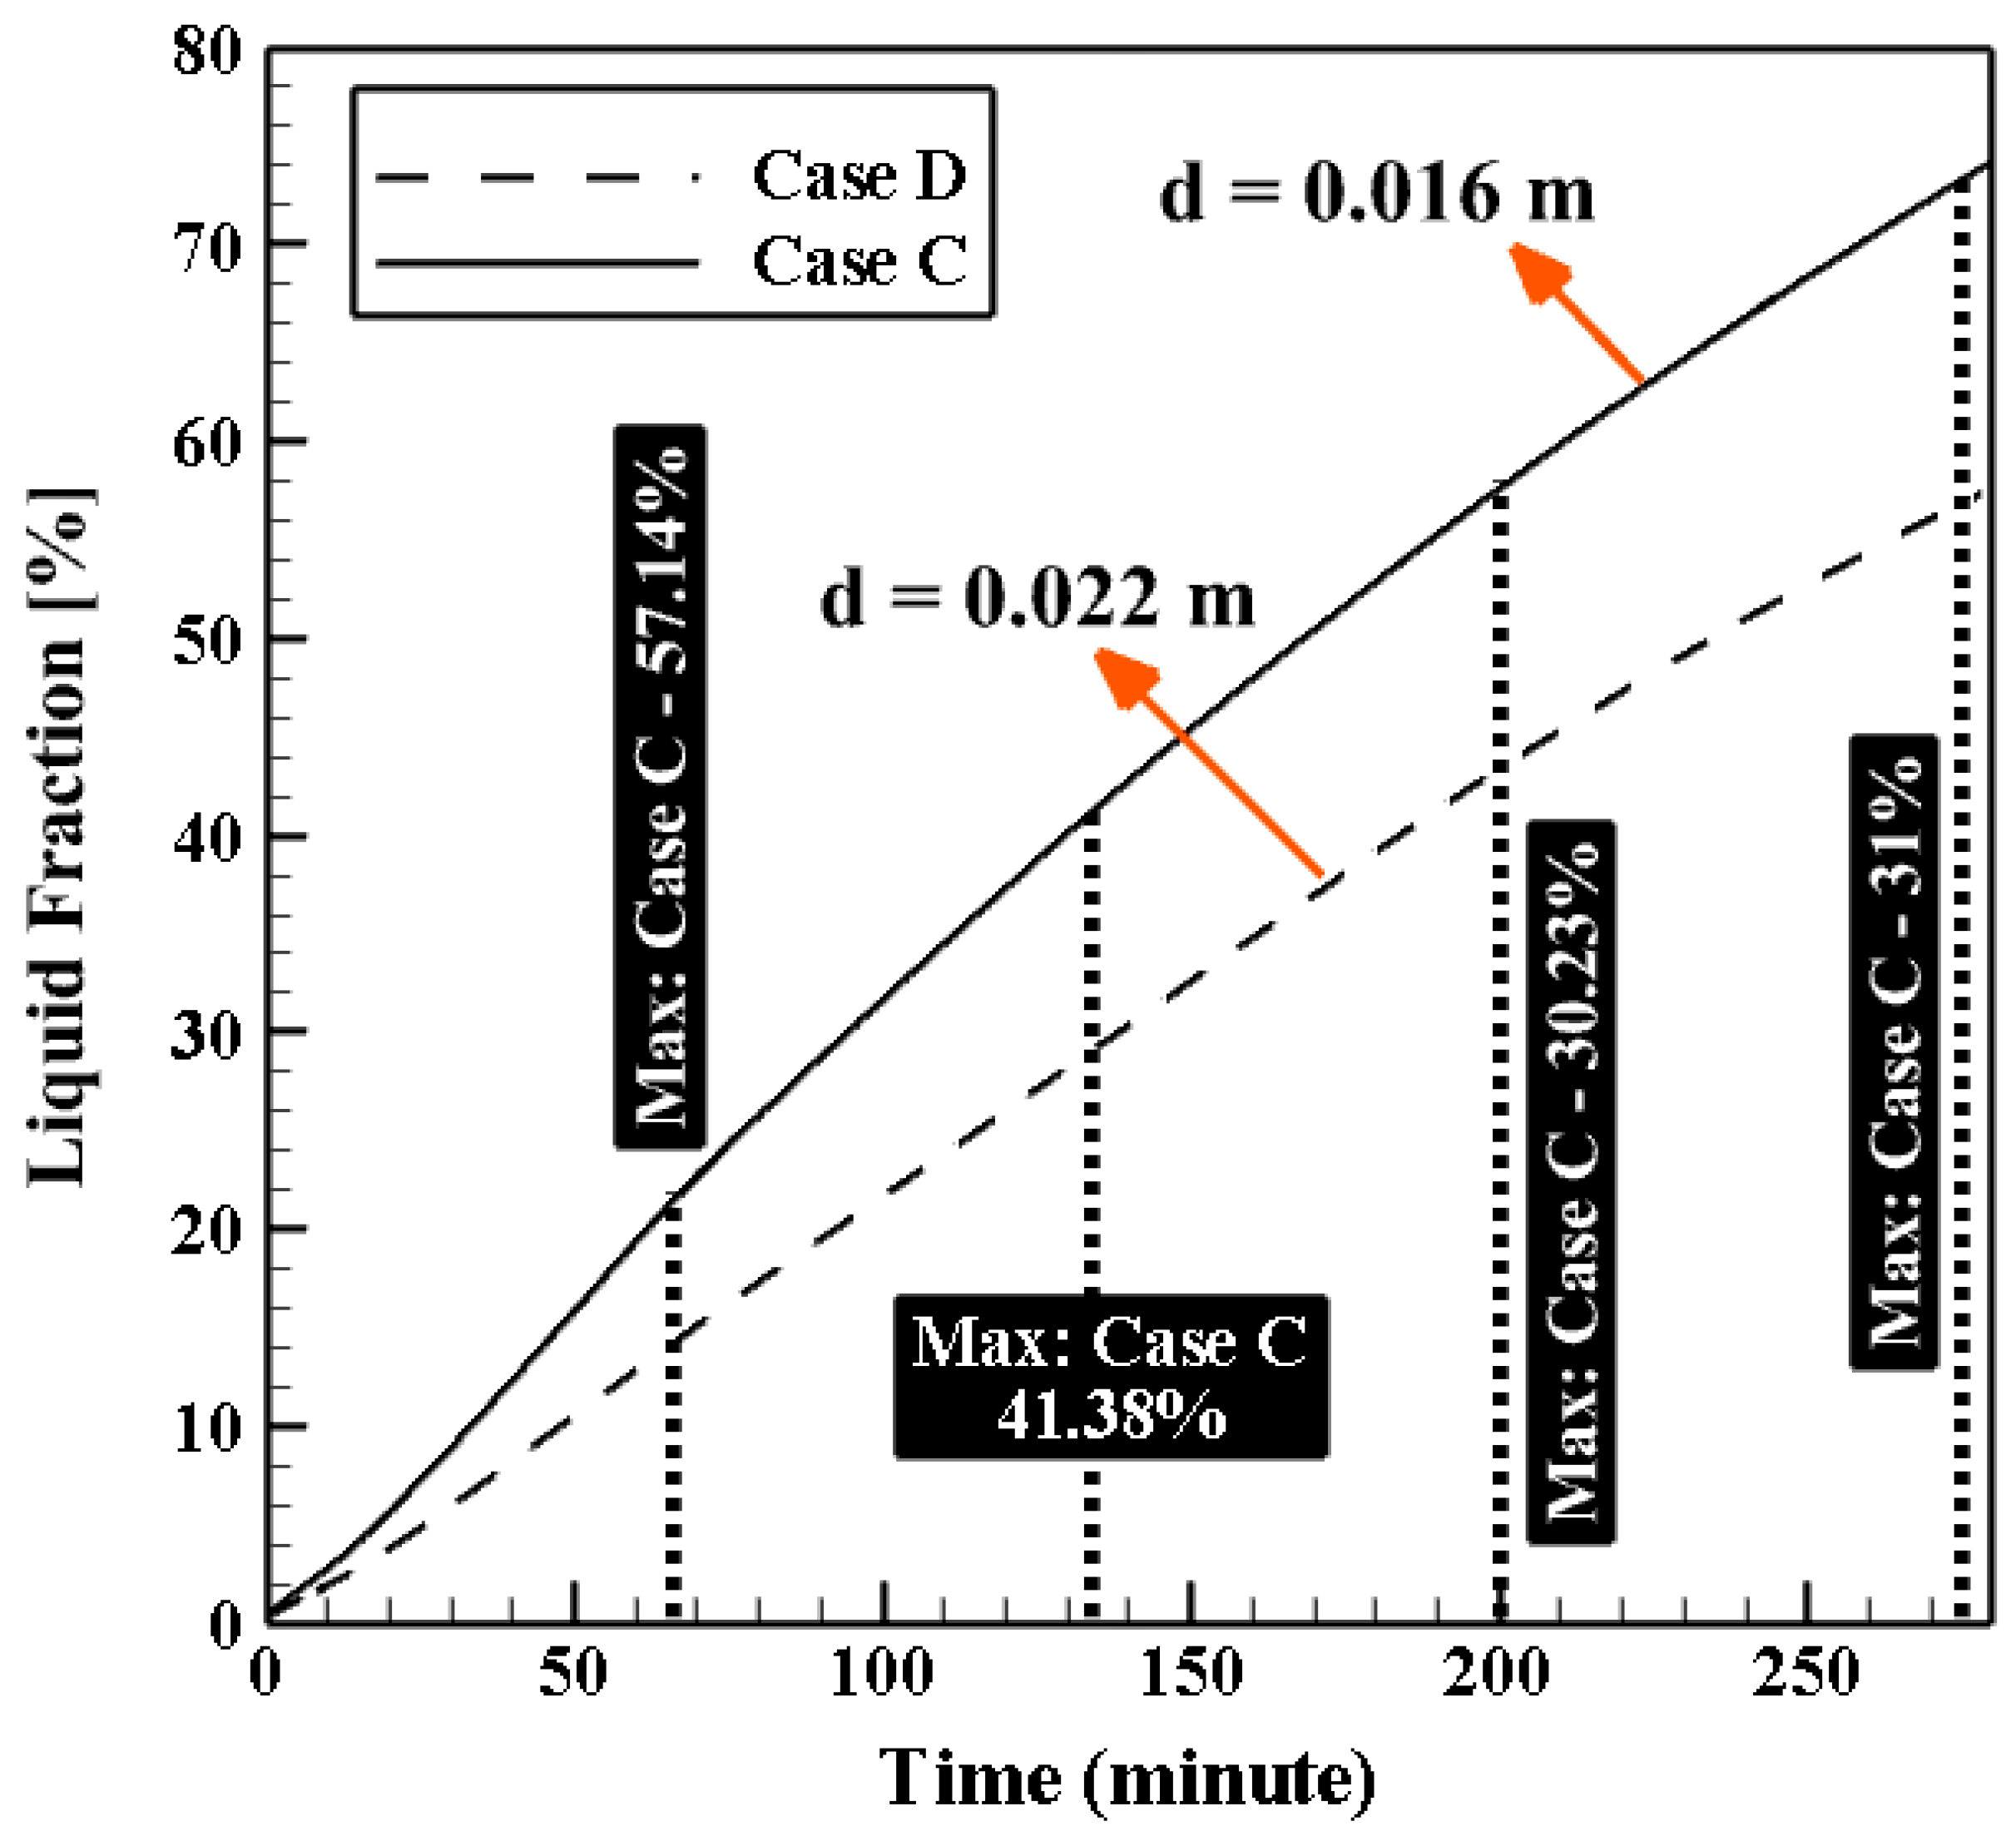
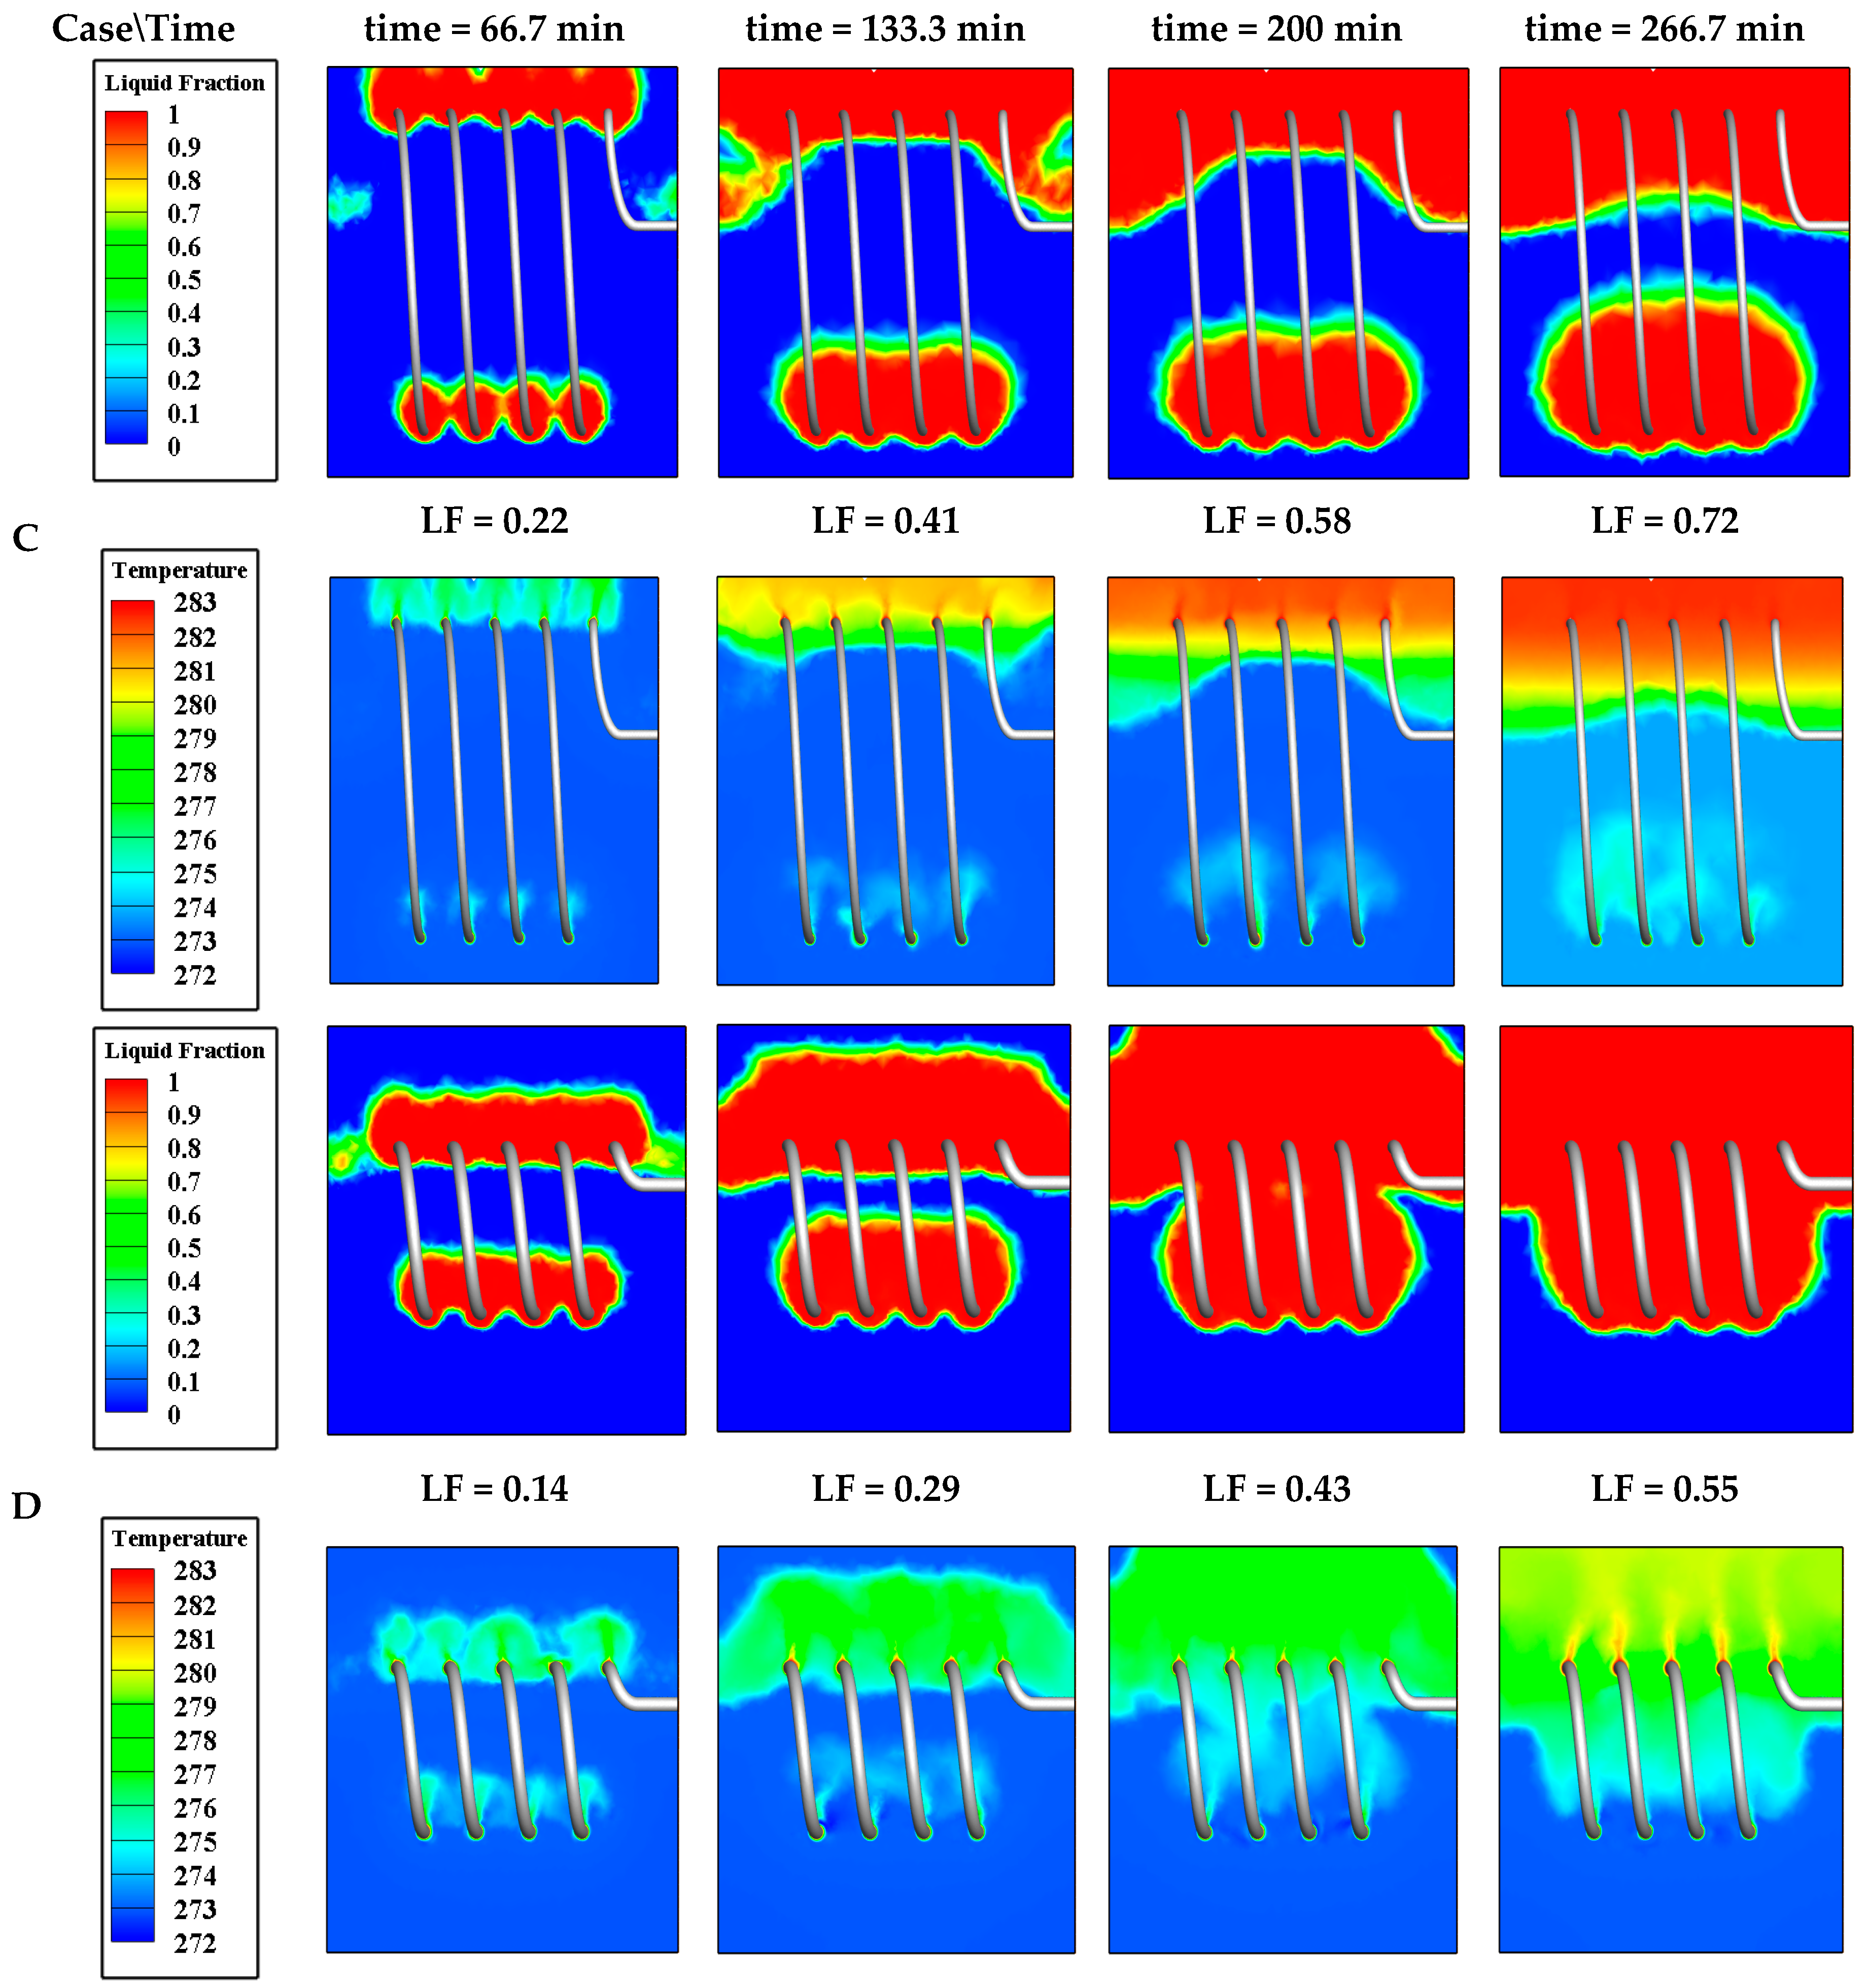
4.3.2. Effect of Coil Diameter (d)

In this section, the effect of coil diameter is investigated. Accordingly, two cases including case C and case D are considered for numerical simulation. The geometrical parameters of these cases (coils and shell) are listed in Table 3 and Table 4. Two different coil diameters including 0.016 and 0.022 m and two calculated helix diameters as free parameters (in order to keep constant the heat transfer area) including 0.48 and 0.25 m are selected for cases C and D, respectively. The height of spiral coil and the coil pitch are considered 0.36 and 0.09 m, respectively. The dimensions of the shell are kept constant as listed in Table 4. The configurations of the two investigated cases (C and D) are illustrated in Figure 11. The liquid fraction (LF) of two cases of C and D are depicted in Figure 14. The LF is drawn for 280 min. These cases are compared with together in four point including 66.67, 133.34, 200, and 266.67 min.
As illustrated in Figure 14, at time = 66.67 min, case C exhibits the best performance with a LF improvement of 57.1% compared to case D. At time = 133.34 min (resp. 200 min), case C has a better thermal performance in comparison with case D with a LF improvement of 41.4% (resp. 30.2%). Totally, after 266.67 min, the LF of case C is significantly higher than for case D (+31%). The liquid fraction and temperature contours for these two cases at different time are illustrated in Figure 15. Because of the geometry of the coil utilized in case C, the used coil covers both top and bottom regions of the shell (Figure 15). Also, generally, the melting rate of the shell bottom region is lower than the top region. Therefore, case C has a better melting rate than case D. At time = 66.67 min, bottom region of the shell covers by the case C, so the LF of the case C is more than case D (about 57.1%). Generally, the melting rate of the top region of the shell is independent of the coil geometry and covering the bottom region of the shell has a significant effect on the LF improvement. Therefore, the trend of melting rate until the time = 266.67 min is the same. By considering the time = 266.67 min, the effect of covering the bottom region of the shell on LF improvement is shown clearly (Figure 15). Therefore, the LF significantly improves for case C about 31.0% compared to the case D.
The effect of coil geometry on temperature distribution is shown clearly in Figure 15 especially after time = 200 min. It can be seen clearly that the temperature significantly increases in the domain of case C in comparison with the case D. At time = 266.67 min, the red region appears which shows the effect of covering the bottom region of the shell in the melting process by coil geometry.

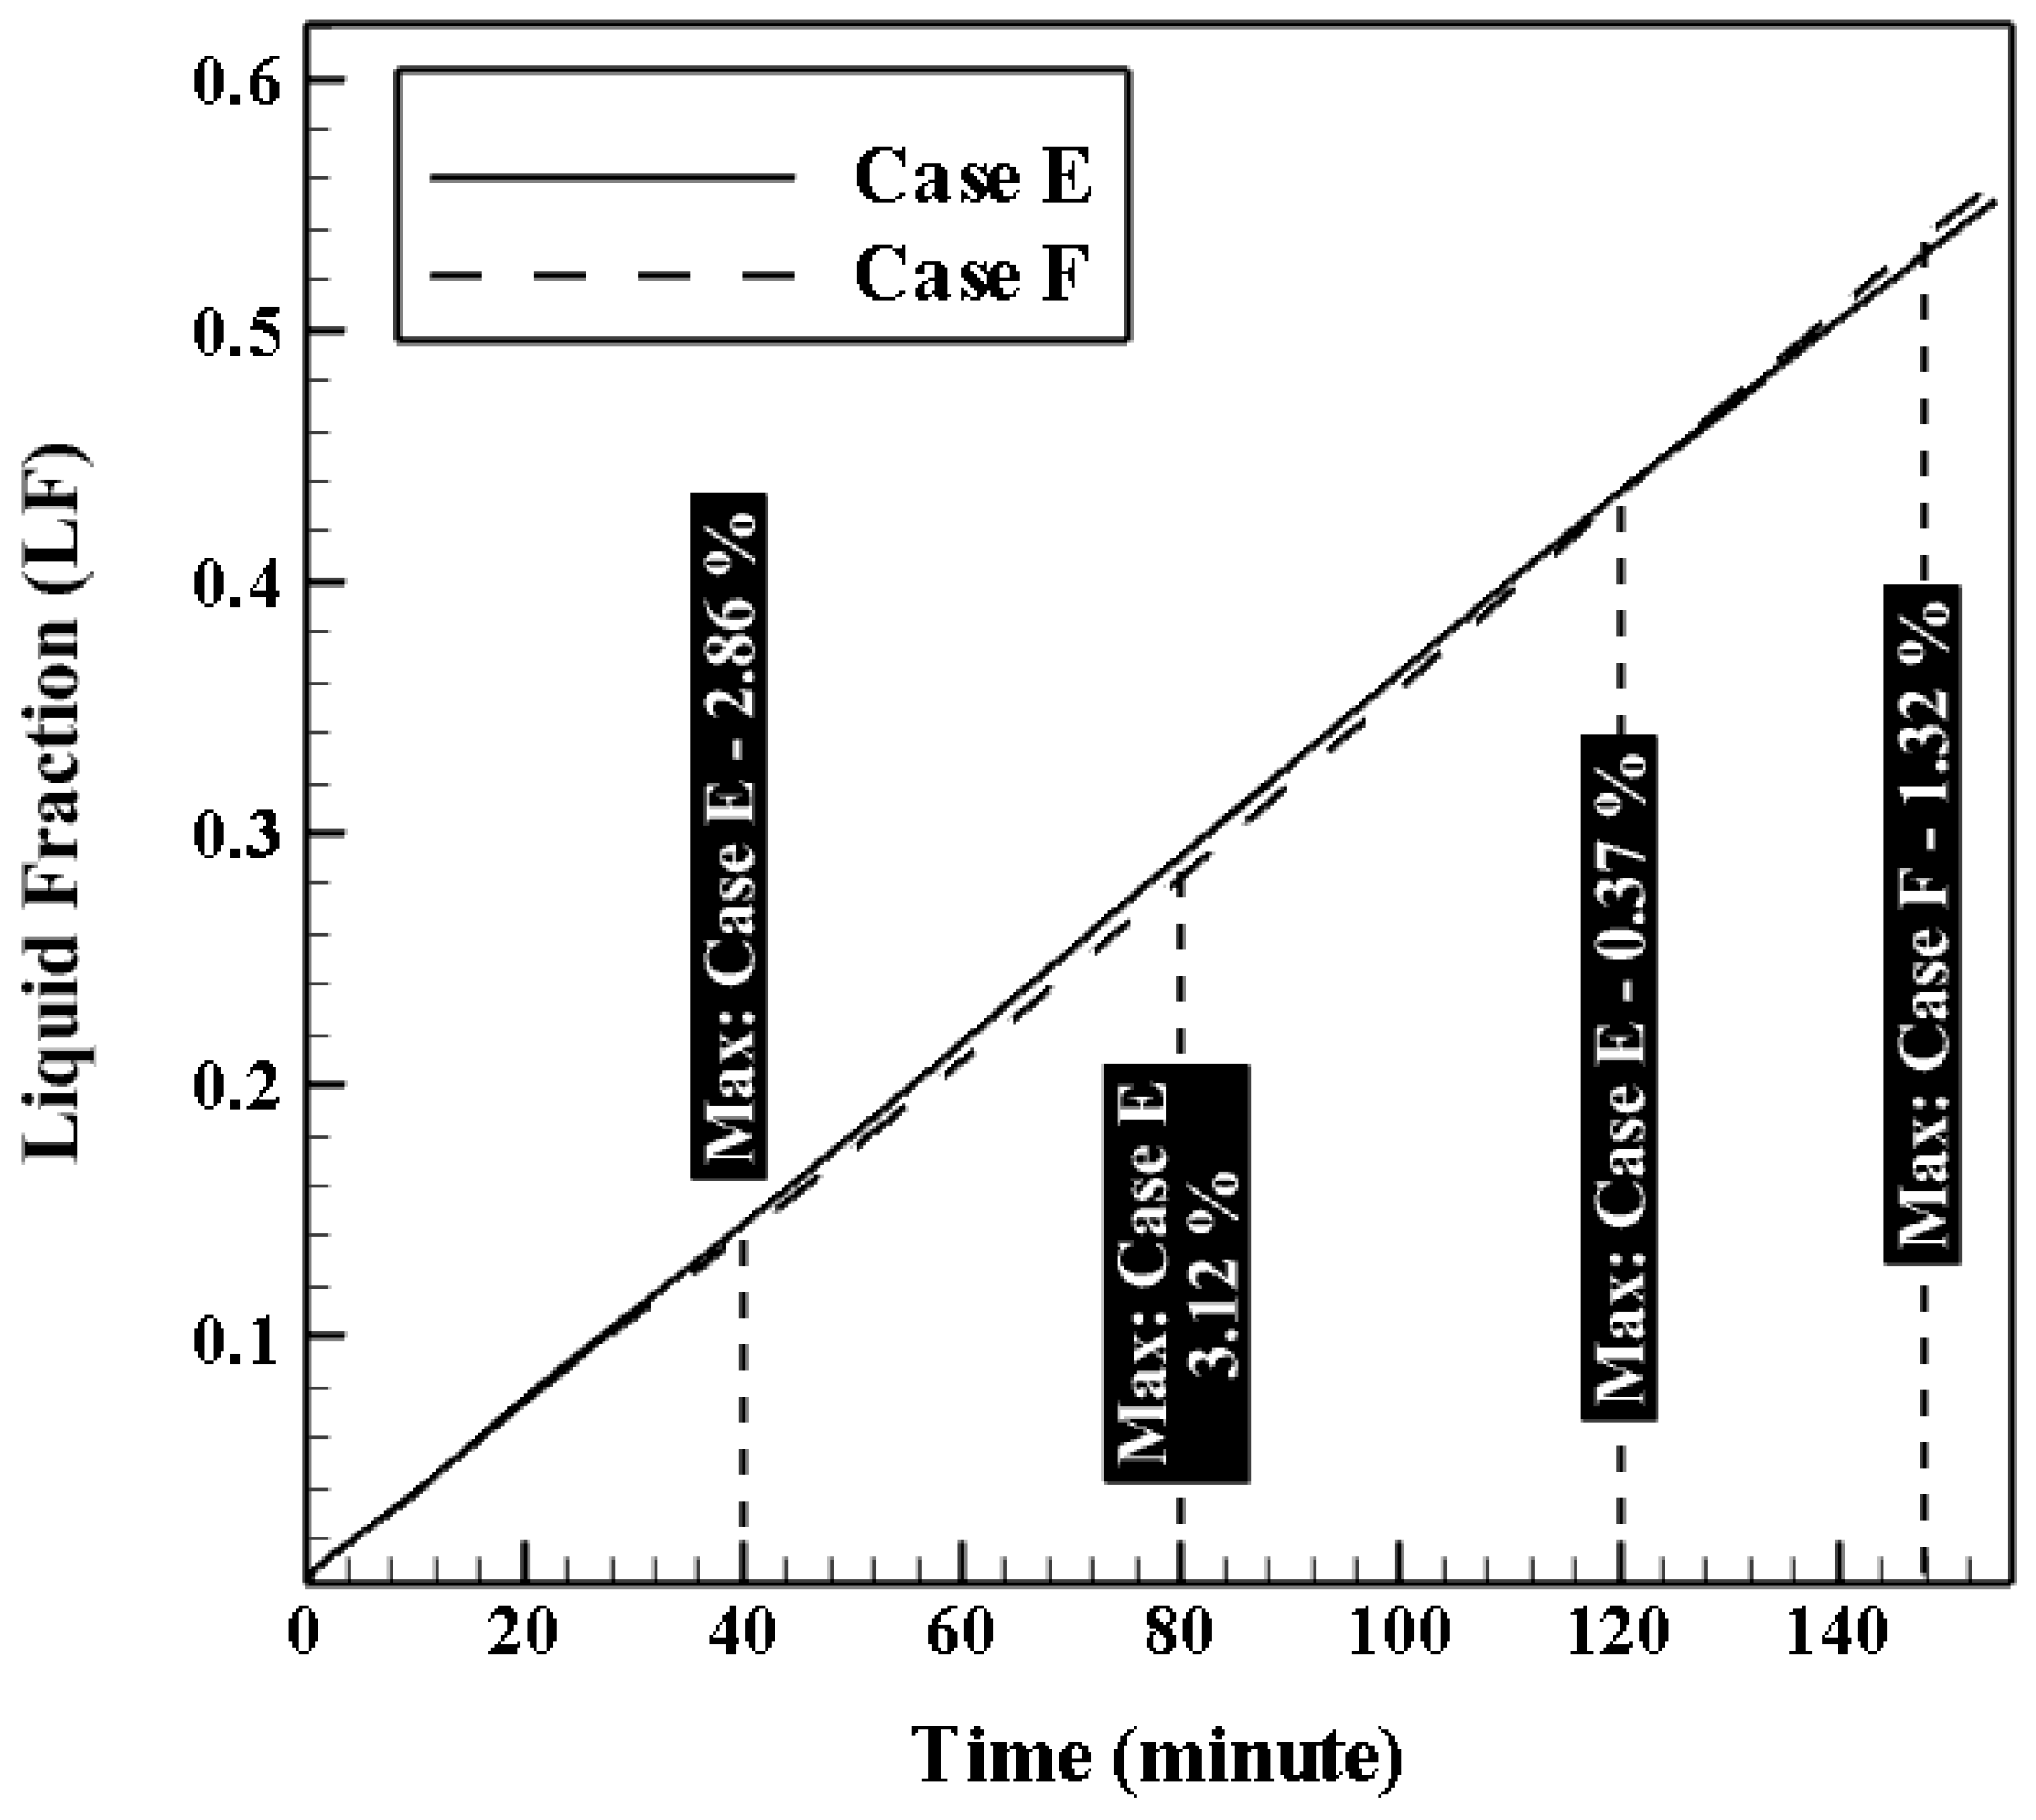
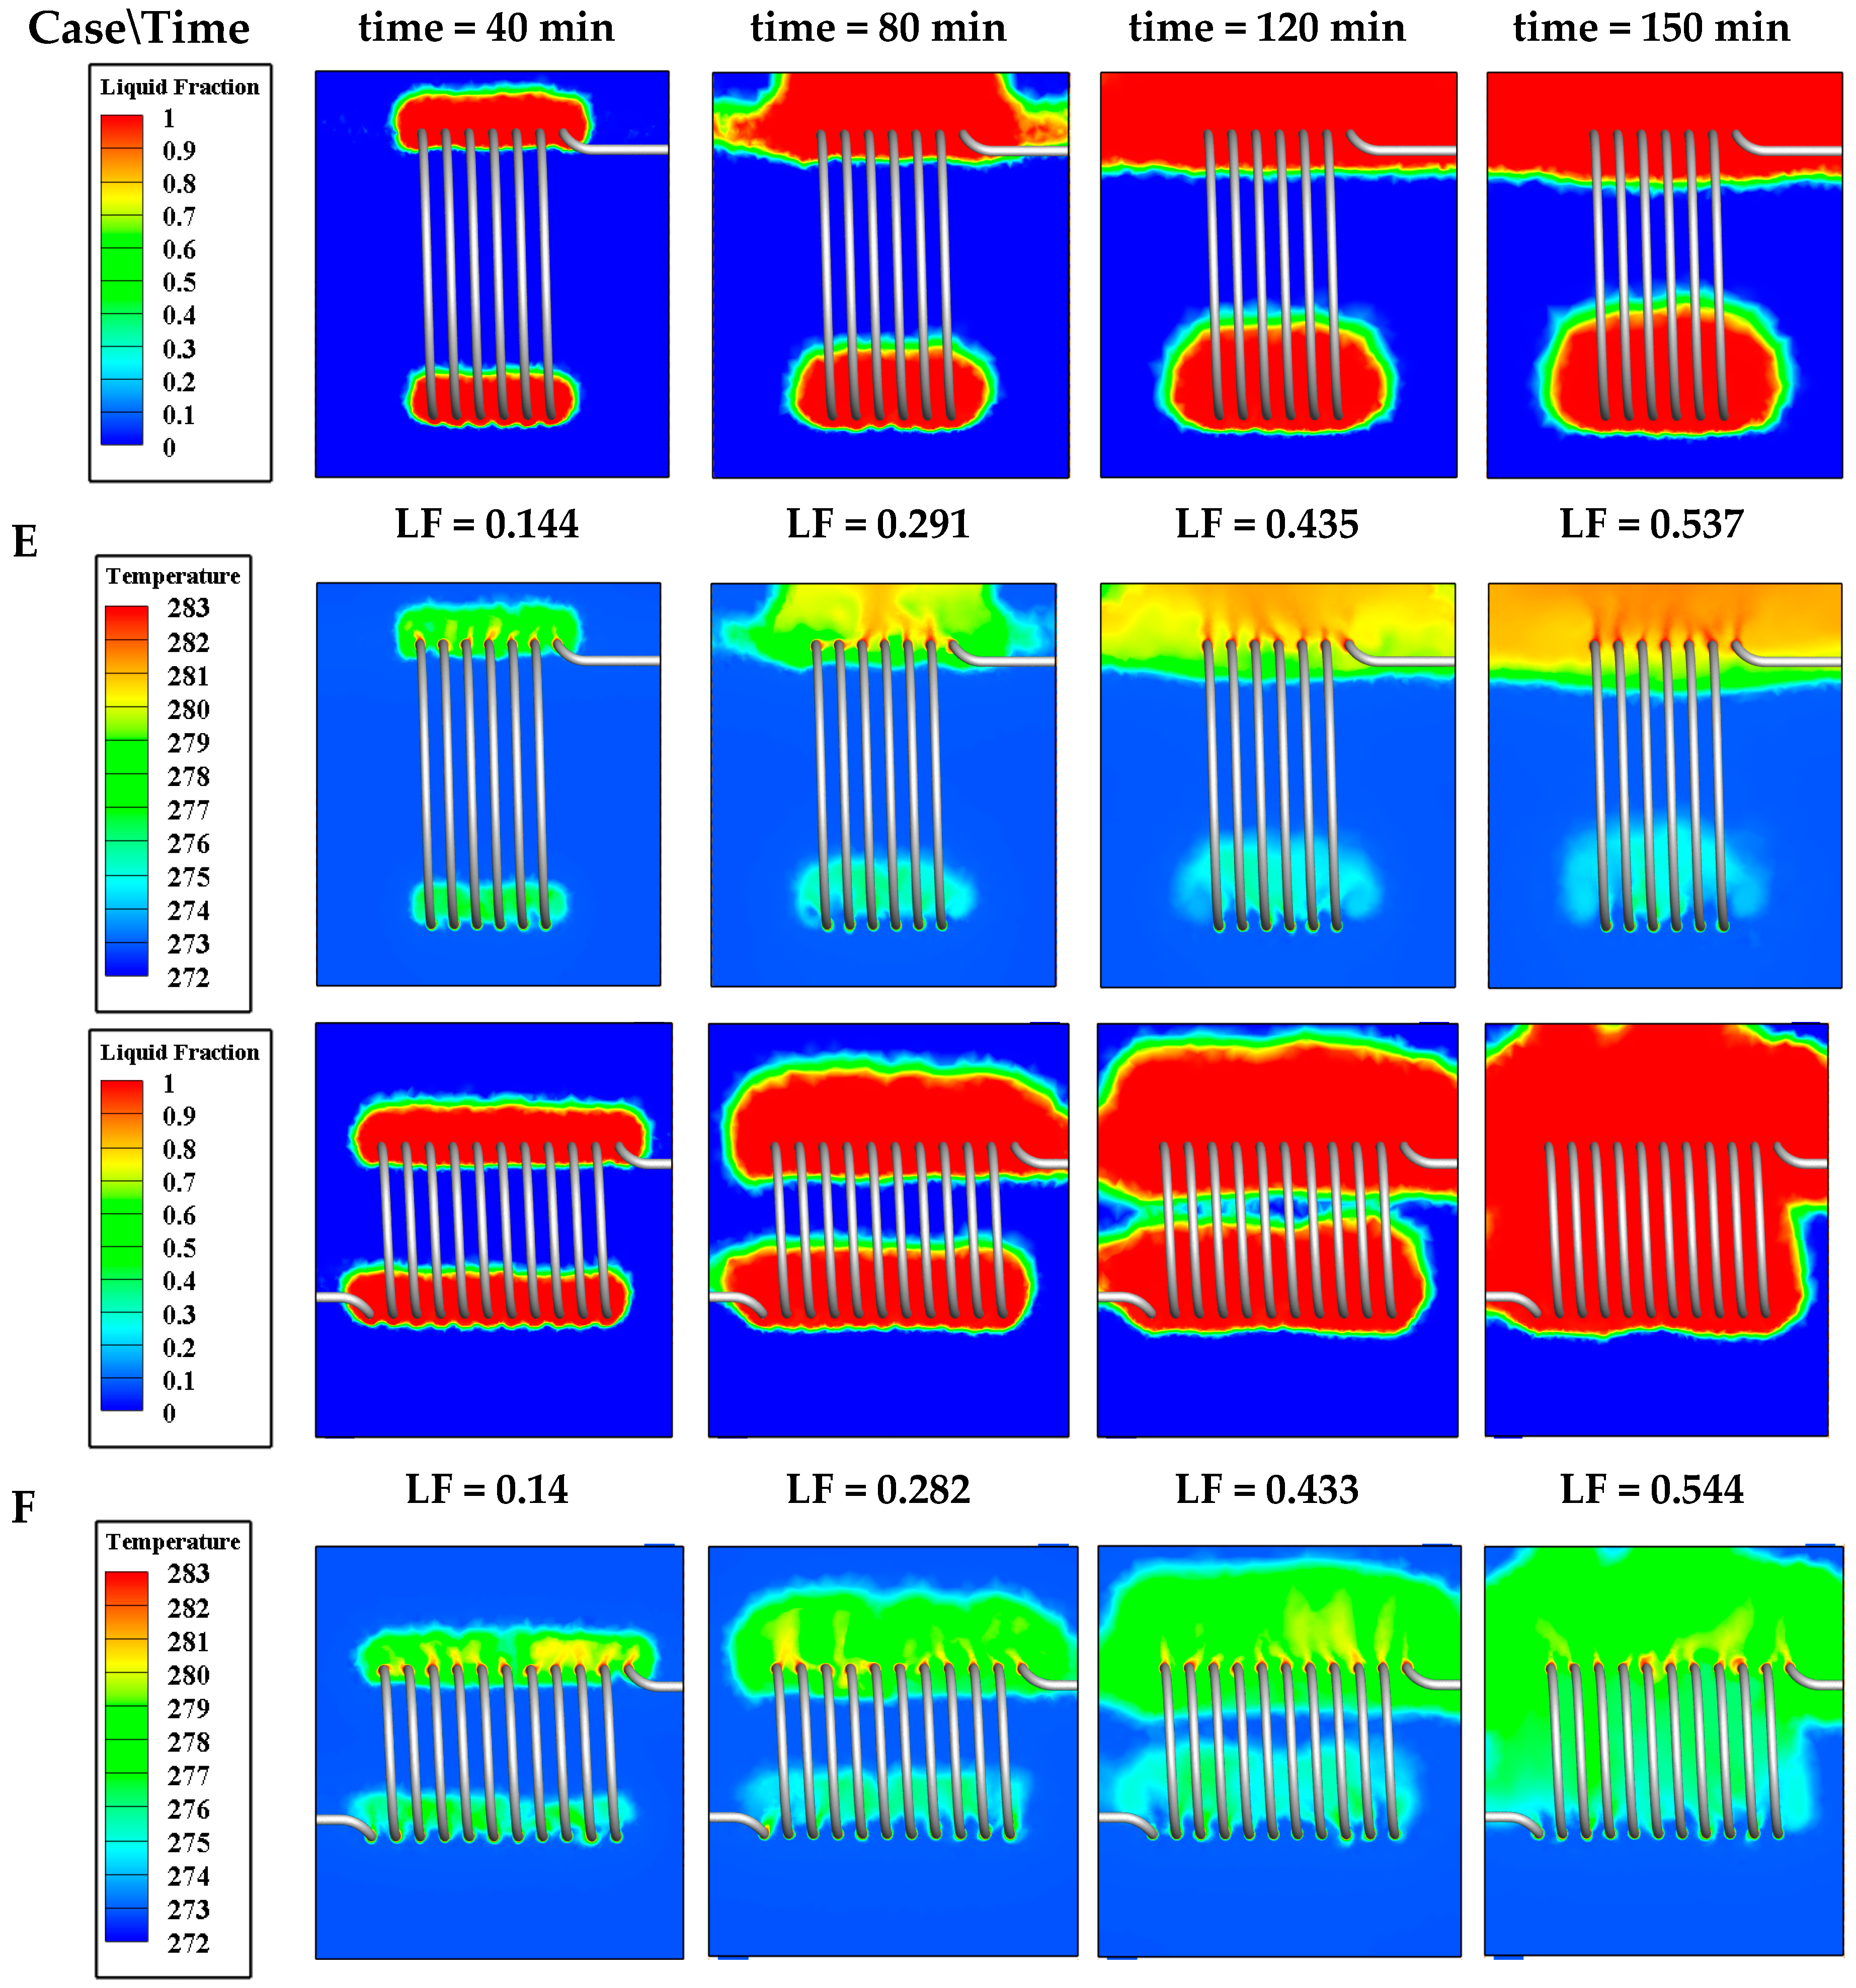
4.3.3. Effect of Coil Height (HC)

In this section, the effect of coil height is investigated. Accordingly, two cases including case E and case F are considered for numerical simulation. The geometrical parameters of these cases (coils and shell) are listed in Table 3 and Table 4. Two different coil heights including 0.24 and 0.42 m and two calculated helix diameters as a free parameter (in order to keep constant the heat transfer area) including 0.43 and 0.25 m are selected for cases E and F, respectively. The coil diameter and coil pitch are considered 0.016 and 0.04 m, respectively. The dimensions of the shell are kept constant as listed in Table 4. The configurations of the two investigated cases (E and F) are illustrated in Figure 11. The liquid fraction (LF) of two cases of E and F are depicted in Figure 16. The LF is drawn for 180 min. These cases are compared with together in four point including 40, 80, 120, and 150 min.
According to Figure 16, there is no significant difference between cases E and F. As illustrated, at time = 40 min, case E has the best performance with LF improvement of 2.9%. At time = 80 min, case E has a better thermal performance in comparison with the case F with LF improvement of 3.1%. At time = 120 min, cases E and F have the same value of LF. After that, the melting rate changes and case F has a better thermal performance in comparison with case E. At time = 150 min, case F has a better melting rate with LF improvement of 1.3%. Generally, the difference between the cases E and F is low, but the melting rate of case F after 150 min is to some extent better than case E with 1.3% difference.
The liquid fraction and temperature contours for these two cases at different time are illustrated in Figure 17. The contours are shown at a slice of x = 0. As it can be seen, because of the buoyancy effect and natural convection, the melting rate of shell top region is faster than bottom region. By increasing the coil height, the helix diameter decreases which can be attributed to the fact that at the start point of the melting process, the melting rate of the case E with low coil height (high helix diameter) is more than case F with high coil height (low helix diameter). Before about the time = 40 min, the LF trend is the same because the melting rate is under effect of the conduction and the melting region is a small region near the coil walls, which is the same in both cases. After time = 40 min, the small difference appears and case E has a better melting rate because of the geometry of the case E that covers the top and bottom regions of the shell so that the natural convection shows its influence on the melting rate. At time = 40 min, the LF is the same for both cases (E and F).
It can be deduced from the results that the melting process depends on the conduction mechanism near the high temperature (in comparison with the melting temperature) walls of the coil tube (Figure 17). At time = 80 min, the melted region of the shell top region for case E is more than case F. The case E covers the bottom region of the shell more than case F so that the LF of the case E is more than case F. At time = 120 min, the LF of both cases (E and F) are the same while the melted regions of both cases are different. In case E, the top and bottom regions of the shell are almost completely melted. However, in case F, although the center region of the shell is significantly melted, a small region of top and a huge region of the bottom is in solid phase yet. After time = 120 min, the melting rate changes so that at time = 150 min, the LF of the case F is more than case E with small difference (about 1.3%). According to Figure 17, the temperature distribution difference between the cases (E and F) has the same trend with LF. However, in the case E, the top region of the shell melts faster. For instance, after 120 min, the temperature distribution in the top region of shell is more than case F so that the red region appears in the top region of case E.

5. Conclusions

In the present paper, internal discharge process (melting) in a horizontal shell and coil tube ice-on-coil type ice storage system was investigated numerically. Six models were considered by numerical simulations to study the influences of three different geometrical parameters regarding the coil including the coil pitch, its diameter, and height on the melting process. Also, the operational parameters of the HTF flow (inlet temperature and mass flowrate) were analyzed. The flow solver based on the enthalpy-porosity method has been first carefully validated against two sets of experimental data including the heat transfer process in a shell and coil tube heat exchanger, and the ice melting process in a double tube heat exchanger.
Overall results indicate that increasing the HTF inlet temperature leads to a reduction of the melting time in the range of 23–33%; while, by increasing the mass flowrate, the melting time decreases very slightly by about 2%. This can be generalized to any combinations of the operational and geometrical parameters considered here. Regarding the influence of the geometrical parameters, after 280 min, by increasing the coil pitch from 0.04 to 0.12 m (by 200%), the melting rate decreases by 4.7%. In the same way, keeping all the other parameters constant, by increasing the coil diameter from 0.016 to 0.022 m (37.5%), the melting rate decreases by 31.0% after 266.7 min. The coil height has an opposite effect on the melting rate so that by increasing it from 0.24 to 0.42 m (75%), at t = 160 min, the melting rate is increased only by 1.32%. Generally, the coil diameter exhibits the most significant effect on the melting rate among the other parameters.
It is worth mentioning that more numerical studies are necessary to extend the flow solver to model the condensation and the frost formation in air/air counter flow plate heat exchangers. In Nordic climates, the ice formation at the exhaust of such heat exchangers may drastically reduce the air flow and some strategies to reduce it need to be indeed developed.

Author Contributions

S.S.M.A. performed all the calculations, analyzed the results, and prepared the original draft. S.P. reviewed and edited the paper. M.A.D. and K.S. are the supervisors of S.S.M.A.

Funding

This research received no external funding.

Acknowledgments

S.P. would like to thank the support of the NSERC chair on industrial energy efficiency established in 2014 at Université de Sherbrooke and founded by NSERC, Hydro-Québec, Natural Resources Canada (CanmetEnergy) and Rio Tinto Alcan. The authors also would like to appreciate the faculty members of Mechanical Engineering Department of Babol Noshirvani University of Technology in Iran for their helpful assistances.

Conflicts of Interest

The authors declare no conflict of interest.

Nomenclature

Amushy zone constant (kg × m3 × s)
CPspecific heat (J × kg−1 × K−1)
ggravitational acceleration (m × s−2)
hsensible enthalpy (J × kg−1)
Henthalpy (J × kg−1)
kthermal conductivity (W × m−1 × K−1)
Llatent heat fusion (J × kg−1)
Ttemperature (K)
uvelocity (m × s−1)
NuNusselt number, Nu = hd/K
DeDean number, De   =   Re d / D c
ReReynolds number, Re = 4 m ˙ / π d
Greek symbols
µdynamic viscosity of the fluid (kg × m−1 × s−1)
ρdensity (kg × m−3)
νkinematic viscosity (m2 × s−1)
λliquid fraction (-)

References

  1. Sarbu, I.; Sebarchievici, C. A comprehensive review of thermal energy storage. Sustainability 2018, 10, 191. [Google Scholar] [CrossRef]
  2. Jang, M.C. Characteristics of electric power demand and promotion of the distribution of ice storage cooling system. In Proceedings of the SAREK 2000 Summer Annual Conference (I), Pyeongchang, Korea, 20 June 2000; pp. 795–804. [Google Scholar]
  3. Jannesari, H.; Abdollahi, N. Experimental and numerical study of thin ring and annular fin effects on improving the ice formation in ice-on-coil thermal storage systems. Appl. Energy 2017, 189, 369–384. [Google Scholar] [CrossRef]
  4. Torregrosa-Jaime, B.; López-Navarro, A.; Corberán, J.M.; Esteban-Matías, J.C.; Klinkner, L.; Payá, J. Experimental analysis of a paraffin-based cold storage tank. Int. J. Refrig. 2013, 36, 1632–1640. [Google Scholar] [CrossRef] [Green Version]
  5. López-Navarro, A.; Biosca-Taronger, J.; Torregrosa-Jaime, B.; Martínez-Galván, I.; Corberán, J.M.; Esteban-Matías, J.C.; Payá, J. Experimental investigation of the temperatures and performance of a commercial ice-storage tank. Int. J. Refrig. 2013, 36, 1310–1318. [Google Scholar] [CrossRef] [Green Version]
  6. López-Navarro, A.; Biosca-Taronger, J.; Torregrosa-Jaime, B.; Corberán, J.M.; Bote-García, J.L.; Payá, J. Experimental investigations on the influence of ice floating in an internal melt ice-on-coil tank. Energy Build. 2013, 57, 20–25. [Google Scholar] [CrossRef] [Green Version]
  7. Ezan, M.A.; Ozdogan, M.; Erek, A. Experimental study on charging and discharging periods of water in a latent heat storage unit. Int. J. Therm. Sci. 2011, 50, 2205–2219. [Google Scholar] [CrossRef]
  8. Fertelli, A.; Büyükalaca, O.; Yilmaz, A. Ice formation around a horizontal tube in a rectangular vessel. J. Therm. Sci. Technol. 2009, 29, 75–87. [Google Scholar]
  9. Habeebullah, B.A. An experimental study on ice formation around horizontal long tubes. Int. J. Refrig. 2007, 30, 789–797. [Google Scholar] [CrossRef]
  10. Attia, A.A.; Altohamy, A.A.; Rabbo, M.A.; Sakr, R.Y. Comparative study on Al2O3 nanoparticle addition on cool storage system performance. Appl. Therm. Eng. 2016, 94, 449–457. [Google Scholar] [CrossRef]
  11. Yan, C.; Shi, W.; Li, X.; Zhao, Y. Optimal design and application of a compound cold storage system combining seasonal ice storage and chilled water storage. Appl. Energy 2016, 171, 1–11. [Google Scholar] [CrossRef]
  12. Erek, A.; Akif Ezan, M. Experimental and numerical study on charging processes of an ice-on-coil thermal energy storage system. Int. J. Energy Res. 2007, 31, 158–176. [Google Scholar] [CrossRef]
  13. Zheng, Z.H.; Ji, C.; Wang, W.X. Numerical simulation of internal melt ice-on-coil thermal storage system. Energy Procedia 2011, 12, 1042–1048. [Google Scholar] [CrossRef]
  14. Xie, J.; Yuan, C. Numerical study of thin layer ring on improving the ice formation of building thermal storage system. Appl. Therm. Eng. 2014, 69, 46–54. [Google Scholar] [CrossRef]
  15. Xie, J.; Yuan, C. Parametric study of ice thermal storage system with thin layer ring by Taguchi method. Appl. Therm. Eng. 2016, 98, 246–255. [Google Scholar] [CrossRef] [Green Version]
  16. Buyruk, E.; Fertelli, A.; Sonmez, N. Numerical investigation for solidification around various cylinder geometries. CSIR 2009, 68, 122–129. [Google Scholar]
  17. Ismail, K.A.; Sousa, L.M.; Lino, F.A. Solidification of PCM around curved tubes including natural convection effects. Int. J. Energy Eng. 2015, 5, 57–74. [Google Scholar] [CrossRef]
  18. Yang, T.; Sun, Q.; Wennersten, R. The impact of refrigerant inlet temperature on the ice storage process in an ice-on-coil storage plate. Energy Procedia 2018, 145, 82–87. [Google Scholar] [CrossRef]
  19. Kim, M.H.; Duong, X.Q.; Chung, J.D. Performance enhancement of fin attached ice-on-coil type thermal storage tank for different fin orientations using constrained and unconstrained simulations. Heat Mass Transf. 2017, 53, 1005–1015. [Google Scholar] [CrossRef]
  20. Seddegh, S.; Wang, X.; Henderson, A.D. A comparative study of thermal behaviour of a horizontal and vertical shell-and-tube energy storage using phase change materials. Appl. Therm. Eng. 2016, 93, 348–358. [Google Scholar] [CrossRef]
  21. Brent, A.D.; Voller, V.R.; Reid, K.T.J. Enthalpy-Porosity technique for modeling convection-diffusion phase change: Application to the melting of a pure metal. Numer. Heat Transf. A Appl. 1988, 13, 297–318. [Google Scholar]
  22. Faghri, A.; Zhang, Y. Transport Phenomena in Multiphase Systems; Elsevier Academic Press: Cambridge, MA, USA, 2006. [Google Scholar]
  23. Mousavi Ajarostaghi, S.S.; Aghajani Delavar, M.; Dolati, A. Numerical investigation of melting process in phase change material (PCM) cylindrical storage considering different geometries. Heat Transf. Res. 2017, 48, 1515–1529. [Google Scholar] [CrossRef]
  24. Shih, Y.C.; Chou, H. Numerical study of solidification around staggered cylinders in a fixed space. Numer. Heat Transf. A Appl. 2005, 48, 239–260. [Google Scholar] [CrossRef]
  25. Sugawara, M.; Beer, H. Numerical analysis for freezing/melting around vertically arranged four cylinders. Heat Mass Transf. 2009, 45, 1223–1231. [Google Scholar] [CrossRef]
  26. Ashby, M.F.; Shercliff, H.; Cebon, D. Materials: Engineering, Science, Processing and Design; Butterworth-Heinemann: Oxford, UK, 2018. [Google Scholar]
  27. Jamshidi, N.; Farhadi, M.; Ganji, D.D.; Sedighi, K. Experimental analysis of heat transfer enhancement in shell and helical tube heat exchangers. Appl. Therm. Eng. 2013, 51, 644–652. [Google Scholar] [CrossRef]
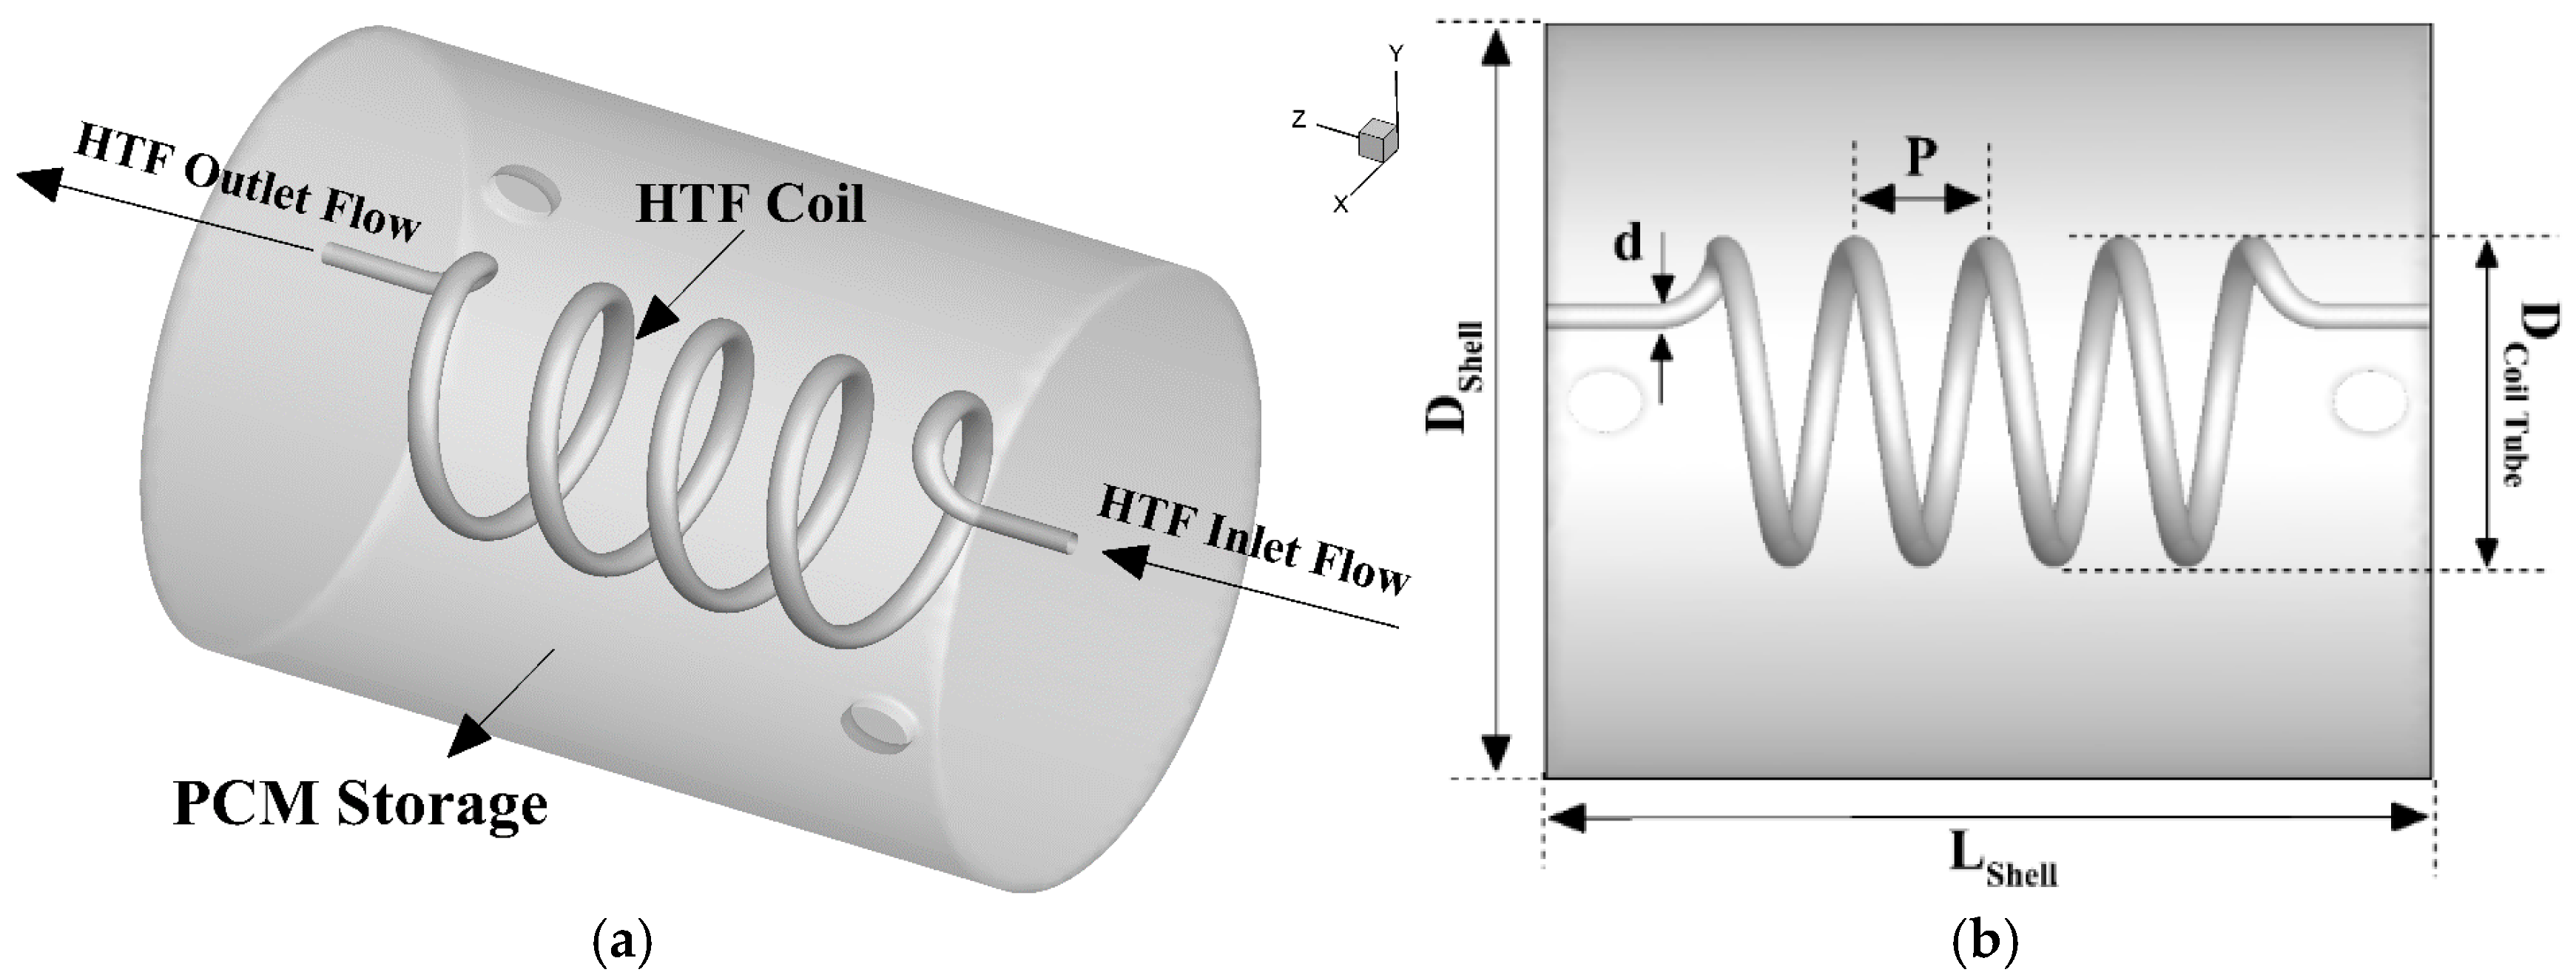
Figure 1. Schematic of the shell and coil tube PCM storage with relevant geometrical parameters.
Applsci 09 02726 g001
Figure 2. (a) Computational domain with inlet and outlet positions of the hot and cold flows; (b) Computational domain with the relevant geometrical parameters of the shell and coil tube heat exchanger; (c) corresponding mesh grid.
Applsci 09 02726 g002
Figure 3. Comparison in terms of the averaged Nusselt number versus the Dean number between the present study and the experimental data of Jamshidi et al. [27].
Applsci 09 02726 g003
Figure 4. Schematic of validation model of the melting process of the ice storage system.
Applsci 09 02726 g004
Figure 5. Comparison in terms of total rejected energy between the present study and the experimental work of Ezan et al. [7].
Applsci 09 02726 g005
Figure 6. Effect of different grids on the total rejected energy (kJ).
Applsci 09 02726 g006
Figure 7. Stable and unstable structures of thermal layers developed around the coil tube for Tinlet = 5 °C and V ˙ = 4 L/min at t = 250 min (a) and 500 min (b).
Applsci 09 02726 g007
Figure 8. Temporal evolution of the liquid fraction for four different HTF (heat transfer fluid) inlet temperatures of ethylene glycol.
Applsci 09 02726 g008
Figure 9. Contours of the liquid fraction at four different times and two HTF inlet temperature of ethylene glycol: (a) Tinlet = 7.5 °C and (b) Tinlet = 10 °C.
Applsci 09 02726 g009
Figure 10. Temporal evolution of the liquid fraction for different inlet flowrates of ethylene glycol.
Applsci 09 02726 g010
Figure 11. Geometries of the coils used in Cases A to F. (a) Case A; (b) Case B; (c) Case C; (d) Case D; (e) Case E; (f) Case F.
Applsci 09 02726 g011
Figure 12. Temporal evolution of the liquid fraction (LF) for cases A and B.
Applsci 09 02726 g012
Figure 13. Contours of the liquid fraction and temperature for cases A and B at four different times in the plane x = 0.
Applsci 09 02726 g013
Figure 14. Temporal evolution of the liquid fraction (LF) for cases C and D.
Applsci 09 02726 g014
Figure 15. Contours of the liquid fraction and temperature for cases C and D at four different times in the plane x = 0.
Applsci 09 02726 g015
Figure 16. Temporal evolution of the liquid fraction (LF) for cases E and F.
Applsci 09 02726 g016
Figure 17. Contours of the liquid fraction and temperature for cases E and F at four different times in the plane x = 0.
Applsci 09 02726 g017
Table 1. Operational and geometrical parameters for the validation case of Jamshidi et al. [27].
ParameterNotationValue
Helix DiameterDC81.3 mm
Coil DiameterdC9 mm
Coil PitchPC15 mm
Shell LengthLSH250 mm
Shell DiameterDSH140 mm
Hot Flow Inlet TemperatureTHot-Inlet50 °C
Cold Flow Inlet TemperatureTCold-Inlet20 °C
Cold Flow Inlet Velocity (Shell)VCold-Inlet0.008 m/s
Hot Flow Inlet Velocity (Tube)VHot-Inlet0.08, 0.165, 0.248 and 0.331 m/s
Table 2. Thermo-physical properties of water, ice, and ethylene glycol [9].
ParameterSymbolValue
Density of Fluid (kg/m3)ρf999.833
Specific Heat of the Fluid (J/(kg·K))Cl4180
Specific Heat of the Solid (J/(kg·K))CS2217
Thermal conductivity of liquid water (W/(m·K))KS1.918
Thermal conductivity of ice (W/(m·K))Kl0.578
Viscosity of the fluid (kg/(m·s))µf0.00162
Latent Heat of Phase Change (J/kg)L334,000
Melting Temperature (K)Tf273.15
Density of Ethylene Glycol (kg/m3)ρEG1111.4
Specific Heat of Ethylene Glycol (J/(kg·K))CEG2415
Thermal conductivity of Ethylene Glycol (W/(m·K))KEG0.252
Viscosity of Ethylene Glycol (kg/(m·s))µEG0.0157
Table 3. Coil geometrical parameters of the investigated models.
ModelsHeight of Spiral CoilCoil PitchHelix DiameterSpiral Coil LengthCoil DiameterHeat Transfer Area
HC (m)P (m)DC (m)L (m)d (m)A (m2)
Effect of PCase A0.360.040.174.830.0169.7 × 10−4
Case B0.360.120.484.550.0169.7 × 10−4
Effect of dCase C0.360.090.486.050.0161.2 × 10−3
Case D0.360.090.253.170.0221.2 × 10−3
Effect of HCCase E0.240.040.438.130.0161.6 × 10−3
Case F0.420.040.258.270.0161.6 × 10−3
Table 4. Shell geometrical parameters.
ParametersSymbolValue (mm)
Height of the shellL700
Shell diameterDSh620
Shell inlet and outlet diameterdSh25

