Review

Laser Absorption Sensing Systems: Challenges, Modeling, and Design Optimization

1
Center for Combustion Energy, Department of Energy and Power Engineering and Key Laboratory for Thermal Science and Power Engineering of Ministry of Education, Tsinghua University, Beijing 100084, China
2
School of Aerospace Engineering, Tsinghua University, Beijing 100084, China
*
Author to whom correspondence should be addressed.
Appl. Sci. 2019, 9(13), 2723; https://doi.org/10.3390/app9132723
Submission received: 31 May 2019 / Revised: 28 June 2019 / Accepted: 3 July 2019 / Published: 5 July 2019
(This article belongs to the Special Issue State-of-the-art Laser Gas Sensing Technologies)

Abstract

:
Laser absorption spectroscopy (LAS) is a promising diagnostic method capable of providing high-bandwidth, species-specific sensing, and highly quantitative measurements. This review aims at providing general guidelines from the perspective of LAS sensor system design for realizing quantitative species diagnostics in combustion-related environments. A brief overview of representative detection limits and bandwidths achieved in different measurement scenarios is first provided to understand measurement needs and identify design targets. Different measurement schemes including direct absorption spectroscopy (DAS), wavelength modulation spectroscopy (WMS), and their variations are discussed and compared in terms of advantages and limitations. Based on the analysis of the major sources of noise including electronic, optical, and environmental noises, strategies of noise reduction and design optimization are categorized and compared. This addresses various means of laser control parameter optimization and data processing algorithms such as baseline extraction, in situ laser characterization, and wavelet analysis. There is still a large gap between the current sensor capabilities and the demands of combustion and engine diagnostic research. This calls for a profound understanding of the underlying fundamentals of a LAS sensing system in terms of optics, spectroscopy, and signal processing.

1. Introduction

1.1. Overview of Laser Absorption Sensor Developments and Applications

Laser absorption spectroscopy (LAS) has served as a useful tool for both fundamental and practical studies in energy and power systems since its earliest demonstration as a species diagnostic method in combustion-related environments over forty years ago [1,2]. In addition to the non-contact characteristics of most optically based methods (e.g., emission, Schlieren imaging, laser-induced fluorescence, particle image velocimetry), LAS benefits from the species-specific nature of molecular spectroscopy, therefore is capable of achieving highly quantitative and selective measurements of a number of important species parameters including gas composition, temperature, pressure, and velocity. The use of narrow-linewidth, tunable, low-power semiconductor lasers, on the other hand, offers the opportunity for real-time, time-resolved, and long-term stable field monitoring systems that can be realized under various measurement scenarios.
Up towards the early 2000s, gas sensors based on tunable diode laser absorption spectroscopy (TDLAS) were extensively applied in continuous emission monitoring and process controls and diffused in process industries as an accepted technique [3,4]. The maturity and commercialization of opto-electronic devices, thanks to the booming telecommunication industry, has allowed TDLAS sensors to evolve from laboratory-scale benchtop experimental tools to a robust industrial technology. With further reduction in cost and size, portable and field-deployable systems can be made. Using smart optical–mechanical designs and sophisticated signal processing schemes, some of these sensors are able to operate in the field without operator intervention for over 10 years [5].
Today, the design, control, and optimization of complex energy and propulsion systems poses unprecedented challenges for sensor technology. The extreme conditions associated with combustion that are typically unfriendly for optical systems, such as high temperature, pressure, and velocity, mechanical vibrations, high dust levels, and corrosiveness, make LAS still one of the best available contactless sensor techniques for harsh environments. However, extraction and interpretation of high-quality, quantitative information under such complicated, demanding conditions requires deeper understanding of the target environments and tailoring the sensor design to specific measurement goals. While state-of-the-art laser technology for novel single-mode mid-infrared and hyperspectral laser sources continues to offer much more freedom in choosing the spectral features and designing LAS sensors, much remains to be studied in improving their reliability, accuracy, and precision.

1.2. Scope and Organization of the Paper

There has been a number of excellent reviews and books on the development and application of LAS sensor technology. Even as early as in the late 1990s, several papers reviewed the fundamental theories and early successes of laser-based spectroscopic methods in gas dynamics and combustion flow measurements [6,7,8]. Nasim et al. illustrated the evolution of and confinement methods used in semiconductor diode lasers and discussed different techniques used to convert free-running diode lasers into true narrow linewidth tunable diode laser sources [9]. As lasers were much less mature at that time, these papers also reviewed the available laser light sources as an important part of the diagnostics development. More recently, several reviews reported the advances of the LAS technique and its demonstration in various disciplines. Hanson et al. presented an overview of combustion kinetics, propulsion, and combustion in practical systems and documented the impact of quantitative laser diagnostics methods [10]. Bolshov et al. highlighted the temperature, concentrations, and flow velocities in different combustion zones and emphasized the strategies and data processing algorithms for LAS measurements [11]. Goldenstein et al. provided a thorough review of the underlying fundamentals, design, and use of infrared LAS sensors for combustion gases and highlighted recent findings and some of the remaining measurement opportunities, challenges, and needs [12]. Liu et al. summarized the key principles and recent advances of line-of-sight (LOS) LAS techniques and then focused on spatially resolved gas sensing with LAS tomography [13].
More specifically, a few papers have focused on reviewing signal-to-noise-ratio (SNR) enhancement techniques to improve TDLAS performance. Li et al. summarized several commonly employed noise reduction schemes including signal averaging, modulation techniques, balanced detection, zero-background subtraction, and adaptive filtering [14]. Zhang et al. focused on the various mathematical algorithms applied in TDLAS signal processing to enhance the accuracy and resolution of the sensor [15].
As discussed above, sensing challenges vary largely with measurement targets and conditions. The maturity of semiconductor lasers and photodetectors allows many researchers in relevant fields to simply use LAS sensor as an established tool, whereas diagnosticians still strive to push the limit of this technique. While previous papers have provided comprehensive reviews on all major elements of LAS sensor systems including fundamental molecular spectroscopy, the development of opto-electronic devices, and various measurement schemes and applications, we refer the readers to other works for the fundamentals and will address the design perspectives of a LAS sensing system. Section 2 will start by summarizing and identifying the measurement challenges and design targets under different measurement conditions; Section 3 will follow by outlining the fundamentals of different diagnostic strategies and their underlying models and control factors; Section 4 will then provide a systematic analysis of approaches for noise reduction and signal optimization, so to extend the use of the LAS sensing technique to much more difficult measurement scenarios. In view of the urging demands in both the use and development of this sensor technology, a goal of this manuscript is to provide understanding and an overview of the key factors and considerations in the measurement targets, as well as a reference and guidelines to a strategic design procedure appropriate for obtaining optimized sensing results.

2. Sensor Design Targets and Measurement Challenges

The fundamental theory lying behind absorption spectroscopy is the Beer–Lambert law, presented in Equation (1), with multiple forms of expressions. The fractional transmission of light, given by the ratio between transmitted and incident light intensity, It [W/cm2] and I0 [W/cm2], can be expressed as an exponential function of absorbance αν, with kν [1/cm] being the spectral absorption coefficient, L [cm] the absorption pathlength, n [molecule/cm3] the number density of the absorbing species, σν [cm2/molecule] the absorption cross section, S [cm−2/atm] the absorption linestrength of an individual transition line, ϕν [cm] the frequency-dependent lineshape function, P [atm] the total pressure, and Xi the mole fraction of the absorbing species i. The subscript ν is used to signify the spectral dependence of the parameter on the light frequency ν:
( I t / I 0 ) ν = exp ( α ν ) = exp ( k ν L ) = exp ( n σ ν L ) = exp ( S ϕ ν P X i L )
This rather simple but nontrivial relationship roots from the energy balance derivation in the equation of radiative transfer. In a typical absorption measurement, the total absorbance αν is the ultimate “signal” to optimize, and the performance of LAS species sensor is commonly evaluated through detection limits and detection bandwidth. The limits of detection can be quantified as the noise-equivalent absorbance (NEA) or the minimal detectable concentration (e.g., in ppm), and the measurement bandwidth (Hz) can be defined as half of the measurement temporal resolution taking into account the Nyquist criterion.
To directly compare the detectivity of LAS sensors under different measurement conditions, the pathlength-normalized detection limit (e.g., in ppm⋅m) is often used, on the basis of the fact that the absorbance is linearly proportional to the absorption pathlength. Further normalization with bandwidth renders a detection limit in the unit of ppm⋅m⋅Hz−1/2 to account for the improvement of signal-to-noise ratio (SNR) with averaging. However, it needs to be noted that this inverse square-root dependence on averaging time can be applied if the signal carries only white noise. A more rigorous assessment of the validity of such normalization can be done with Allan variance analysis, which analyzes a sequence of data in the time domain. Although traditionally used as a measure of frequency stability of clocks and oscillators in metrology, the Allan variance analysis can also be adopted as a useful tool to identify and quantify different noise terms and indicate signal stability. As shown in the schematic of Figure 1, the root Allan variance, aka Allan deviation, of a time domain signal is computed as a function of different averaging times τ. By analyzing the characteristic regions and log–log scale slopes of the Allan deviation curve, different noise processes and modes may be identified.
Even limiting our discussion to combustion-related LAS diagnostic studies, the demands and achieved performance of the laser sensors vary over a wide range. Figure 2 summarizes some representative results from a number of sensor development and implementation studies in terms of detection limits and bandwidths. It compares species concentration measurements in a variety of combustion systems including laboratory environments [1,16,17,18,19,20,21,22], shock tube studies [23,24,25,26,27,28], industry processes [29,30,31,32,33], and engines [34,35,36,37,38,39,40,41,42,43,44,45,46]. For the purpose of making a direct comparison between different studies, the reported absolute minimal detection limits for several commonly probed species in combustion, including CO, CO2, H2O, and C2H2, are plotted on the same diagram against detection bandwidths. It can be clearly observed that results from different applications naturally separate into different regimes: the well-controlled laboratory environments allow lower absorbance to be detected, where chemical kinetics studies in shock tubes typically demand for a much higher detection bandwidth than stabilized laboratory flames or gas cell; larger scale, more “realistic” environments such as industrial burners and engines present harsher conditions that lead to higher achievable minimal detection limits, but industrial process monitoring typically involves stringent emission control targets and trace species detection over continuous, long-term monitoring periods, whereas engine diagnostics are usually associated with high-velocity or turbulent flow and reaction conditions.
Despite its versatility in measuring temperature, pressure, and velocity, LAS is ultimately a species diagnostic method. It utilizes the “fingerprint” molecular spectra and infer the parameters to be measured on the basis of a correct interpretation of the recorded spectral feature. Figure 3 plots the absorption linestrengths over the infrared wavelength range of 0.5–6 μm of several of the representative C–O, C–H, N–O, N–H, and H–O compound gaseous species commonly studied in combustion. Today, with semiconductor laser technology, we are able to access almost any wavelength within this region, so that there is no longer much constraint in making an optimized selection of absorption transition, which can be solely based on appropriate strength level and minimal cross interference. For fairly harmonic molecules such as CO, the advantage of using a lower-order vibrational band at longer wavelength is more prominent in achieving lower detection limits as compared with a less harmonic molecule such as NH3. One can also make the observation that high temperatures, often associated with combustion-related sensing, would by themselves present greater challenges for LAS sensors. The reasoning is twofold from the point of view of molecular spectroscopy: (1) the overall band strength is approximately inversely proportional to temperature, so that absorption is generally weaker at high temperatures, and (2) higher energy levels get more populated at higher temperatures, so that the spectra may get more crowded with hot bands and high J-number lines, especially when a multicomponent gas mixture is being studied. As will be reviewed in the following, many efforts have been devoted to reducing a correct absorption-free background and discriminate the molecular absorption by target species from a medley of various cross interference and noise processes.

3. Fundamentals of Different LAS Measurement Schemes

Absorption is based on signal difference between the light intensities before and after propagation through a medium. When the incident light source has a spectral linewidth much narrower than the absorption transition feature, the so-gained spectral information can be regarded as single-wavelength without the need for light dispersion elements which can potentially introduce a reduction in spectral resolution. The use of semiconductor lasers which can be easily and fast tuned with injection current and temperature also allows the access to a range of wavelengths and absorption feature profiles with a single laser device. A detailed description of typical laser sources employed in LAS including distributed feedback lasers (DFBs), vertical-cavity surface-emitting lasers (VCSELs), Fourier-domain mode-locked lasers (FDML), quantum cascade lasers (QCLs), interband cascade lasers (ICLs), and their corresponding features, such as linewidth, power, and tunability has been presented by Goldenstein et al. [12] and Liu et al. [13].
The two most commonly employed schemes in realizing a LAS sensor with wavelength-tunable, narrow-linewidth lasers include direct absorption spectroscopy (DAS) and wavelength modulation spectroscopy (WMS), and each can be further associated with fixed- or scanned-wavelength schemes. For fixed-wavelength DAS, as the laser wavelength is not tuned or modulated, the detection bandwidth is solely limited by the detector bandwidth and the sampling rate of the data acquisition system. Therefore, this scheme is often used in applications where an extremely high temporal resolution at levels of 1 MHz or above is needed. However, it requires the absolute laser wavelength to be accurately known and precisely controlled. In contrast, the scanned-wavelength scheme is widely used for its higher robustness and better immunity against fluctuations in practical combustion system monitoring.
The basic principles of DAS and WMS have been detailed elsewhere [48]. Here, from a different perspective, we will give a brief summary of each technique and elucidate the fitting algorithms used to infer gas conditions.

3.1. Direct Absorption Spectrocopy

The direct absorption method infers gas properties directly from the fractional transmission of light It/I0 using the Beer–Lambert relation. One of the key problems to solve in DAS is thus to determine the baseline, i.e., the light intensity I0 before absorption by the medium. Certain sensor systems incorporate an additional reference signal with a non-resonant laser or a broadly tunable light source to correct for the baseline [12]. However, this is at the expense of added components and may introduce potential errors from additional optical etalons. The more commonly adopted approach is to mathematically fit the baseline using non-absorbing portions within a scan.
Two background correction strategies are often adopted, namely, the Levenberg–Marquardt (LM) fitting algorithm [49,50,51], and the advanced integrative (AI) fitting algorithm [52]. Both fitting algorithms involve an iterative process, and the major difference lies in the fitting speed and multi-line fitting capability. More details are summarized in Table 1 below, and here we illustrate a typical fitting procedure with an example of AI fitting algorithm.
AI fitting process:
Step 1: Background correction: a polynomial fit is applied to infer the background from the non-absorbing portions;
Step 2: Retrieval of line center position ν0, which is estimated from the two symmetrical intervals from the maximum of background-corrected absorbance curve, thus no explicit initialization is needed;
Step 3: Retrieval of absorbance area: absorption linewidth is predetermined, and then the Voigt function is calculated;
Step 4: Voigt fit: several numerical approaches can be used to approximate the Voigt function [53,54] as no analytical form is available.
Most commonly, by using a low-order (order two to four) polynomial to fit the baseline and subsequently fitting the absorbance curve with a Voigt profile through an iterative process, the gas properties can be inferred. This works well for isolated or slightly overlapped features and if the baseline is reasonably smooth and the raw spectrum has a good SNR. However, when noises from harsh environments causing severe beam steering and baseline fluctuation carry frequency components comparable to the scanning/detection bandwidth, uncertainties in the DAS detection will significantly grow. Efforts to deal with such background drift will be detailed in Section 4.

3.2. 2f-WMS Method

By adding a high-frequency modulation to the laser injection current, the WMS scheme raises the signal detection band to a designated frequency range and later extracts the signal with band-pass filtering processes. This allows the method to have better noise rejection capability, and a 2~100 improvement in SNR has been demonstrated over DAS [55].
When the absorption features introduce distortions to the sinusoidally modulated laser intensity, harmonic components at integer multiples of the modulation frequency would appear. Due to the symmetry of an absorption feature about its line center, even orders of harmonic signals would peak near the line center position. For small modulation depths, the nonlinear laser intensity modulation can be neglected, and the peak of the second harmonic signal, or the 2f peak height, is a function of species concentration, pressure, and temperature and therefore can be taken as the target signal to measure [56,57]. The dependence on multiple non-precalibrated parameters is the major limitation of 2f-WMS method, however, for two-line thermometry, the 2f peak height ratio of the two selected lines can be directly reduced to linestrength ratio with the use of suitable modulation depth and line pair. Figure 4 shows the flow chart of the fitting procedure of the 2f-WMS method, including 2f peak ratio thermometry and species concentration extraction. To account for the unknown proportionality to environmentally dependent factors such as transmission losses and instantaneous laser intensity, the 2f peak magnitudes need to be pre-calibrated on the basis of HITRAN/HITEMP database line parameters with known pressure and temperature conditions and a nominal value of gas concentration.

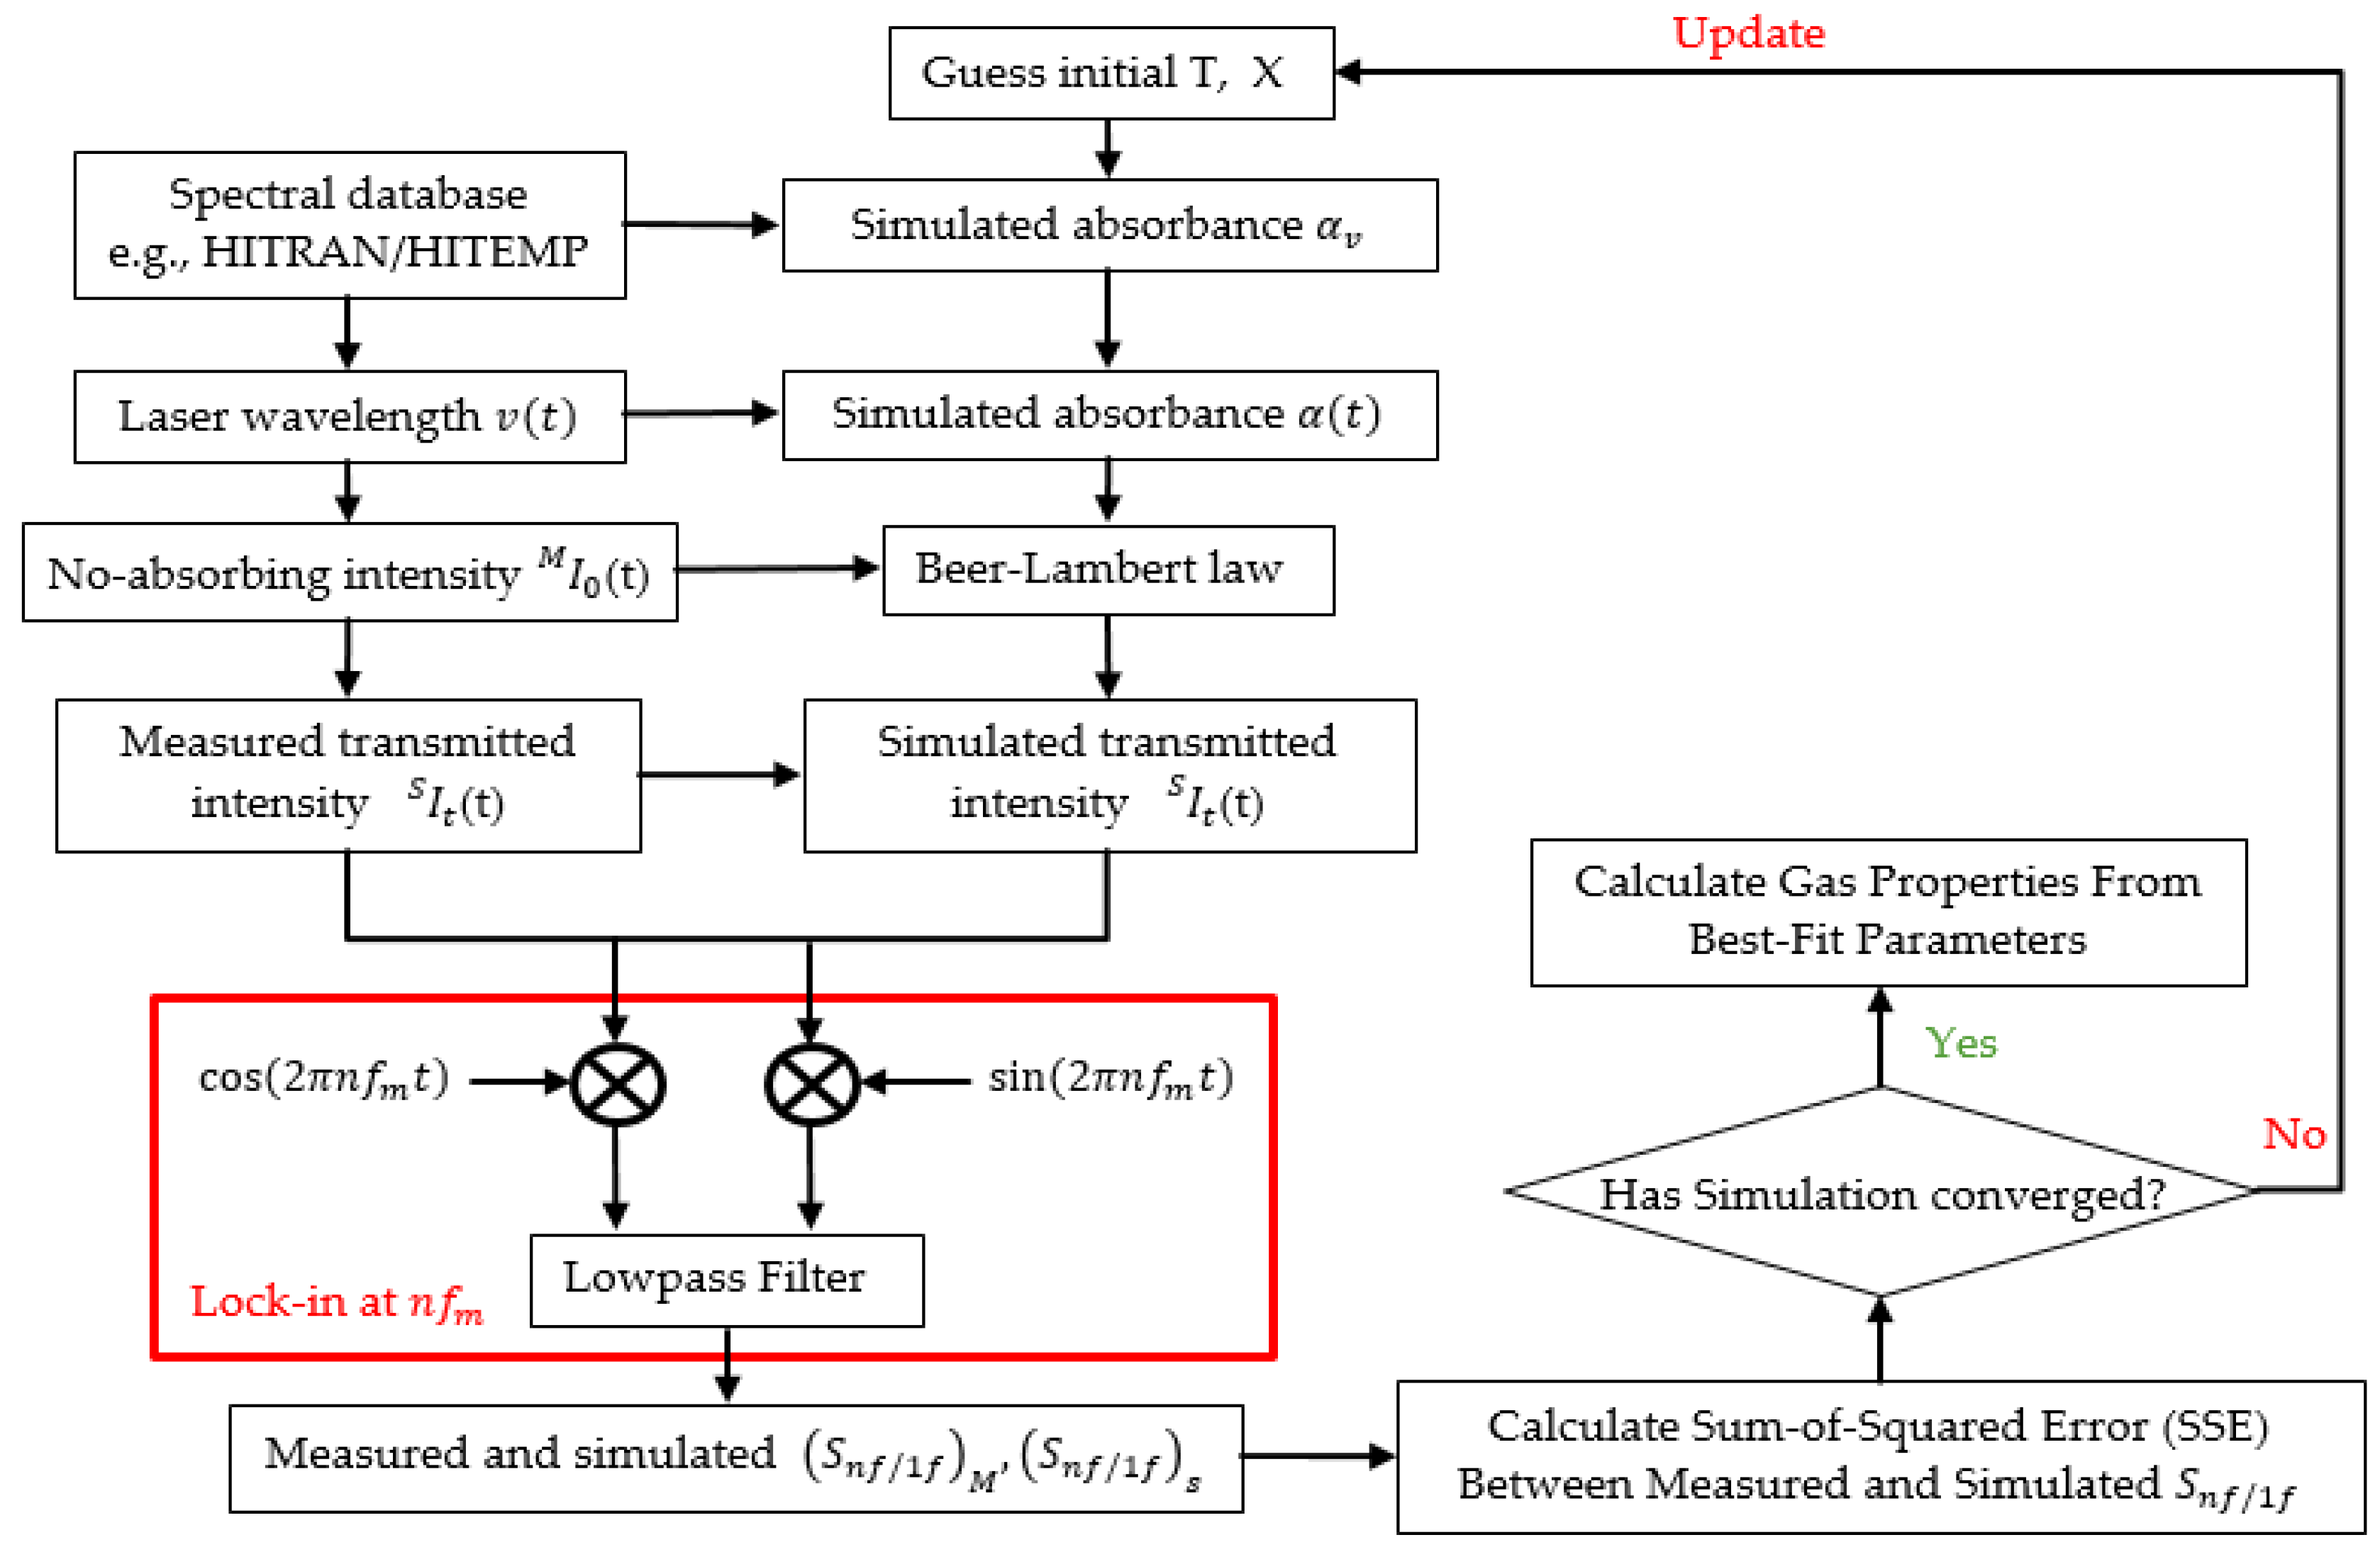
3.3. Calibration-Free WMS-2f/1f Method

The calibration process needed for the WMS-2f method requires all environmental conditions to remain the same between the calibration stage and the actual measurement stage. Apparently, this luxury of having stable and known conditions is not always available, especially in practical applications where laser transmission fluctuations are much more difficult to predict or monitor. One solution is to normalize the 2f signal with the 1f component, referred to as the calibration-free WMS-2f/1f method.
The normalization process cancels out the unknown or changing laser intensity. However, to directly associate the measured WMS-2f/1f value with absolute gas conditions, laser intensity and frequency tuning parameters need to be accurately characterized. Typically, this laser characterization process identifies the first- and second-order laser intensity modulation indices (i1, i2) and intensity–frequency modulation phase shifts (φ1, φ2) at a specific center frequency ν0, which are sufficient to describe the intensity and frequency modulation behavior of a DFB semiconductor laser.
Rieker et al. summarized potential sources of uncertainty in calibration-free WMS, with particular emphasis on the influence of pressure and optical depth in harsh environments [55]. Under such conditions, measurement uncertainties induced by pressure deviation between the simulation and the experimental conditions become more significant, and preference for stronger absorption features voids the optical-thin assumption so that larger measurement errors may result.
In view of such problems, scanned-wavelength WMS with larger scan ranges and modulation depths may be used. A modified calibration-free WMS scheme with an entirely different laser characterization strategy is proposed to account for the time-variant and wavelength-dependent change of the laser characteristic parameters [16,58,59]. The flow chart of this method is shown in Figure 5. This analysis scheme differs from previous WMS strategies in two apparent ways: (1) the use of measured intensity in real time avoids the need for a pre-determined analytic model to describe laser intensity, and can at the same time account for the wavelength-dependent transmission of optical components in the beam path, and (2) using the same data processing procedure for both simulation and measurement introduces equal contributions from any potential non-ideal performance of the lock-in and low-pass filter.
This method is applicable without constraints on optical depth or modulation index, so that pressure-broadened and blended absorption features can also be studied. However, nonlinear variations in laser characteristics due to calibration drift, temperature variations, and laser aging that add to the residual amplitude modulation (RAM) at different harmonic orders may introduce errors that mostly occur over longer terms.

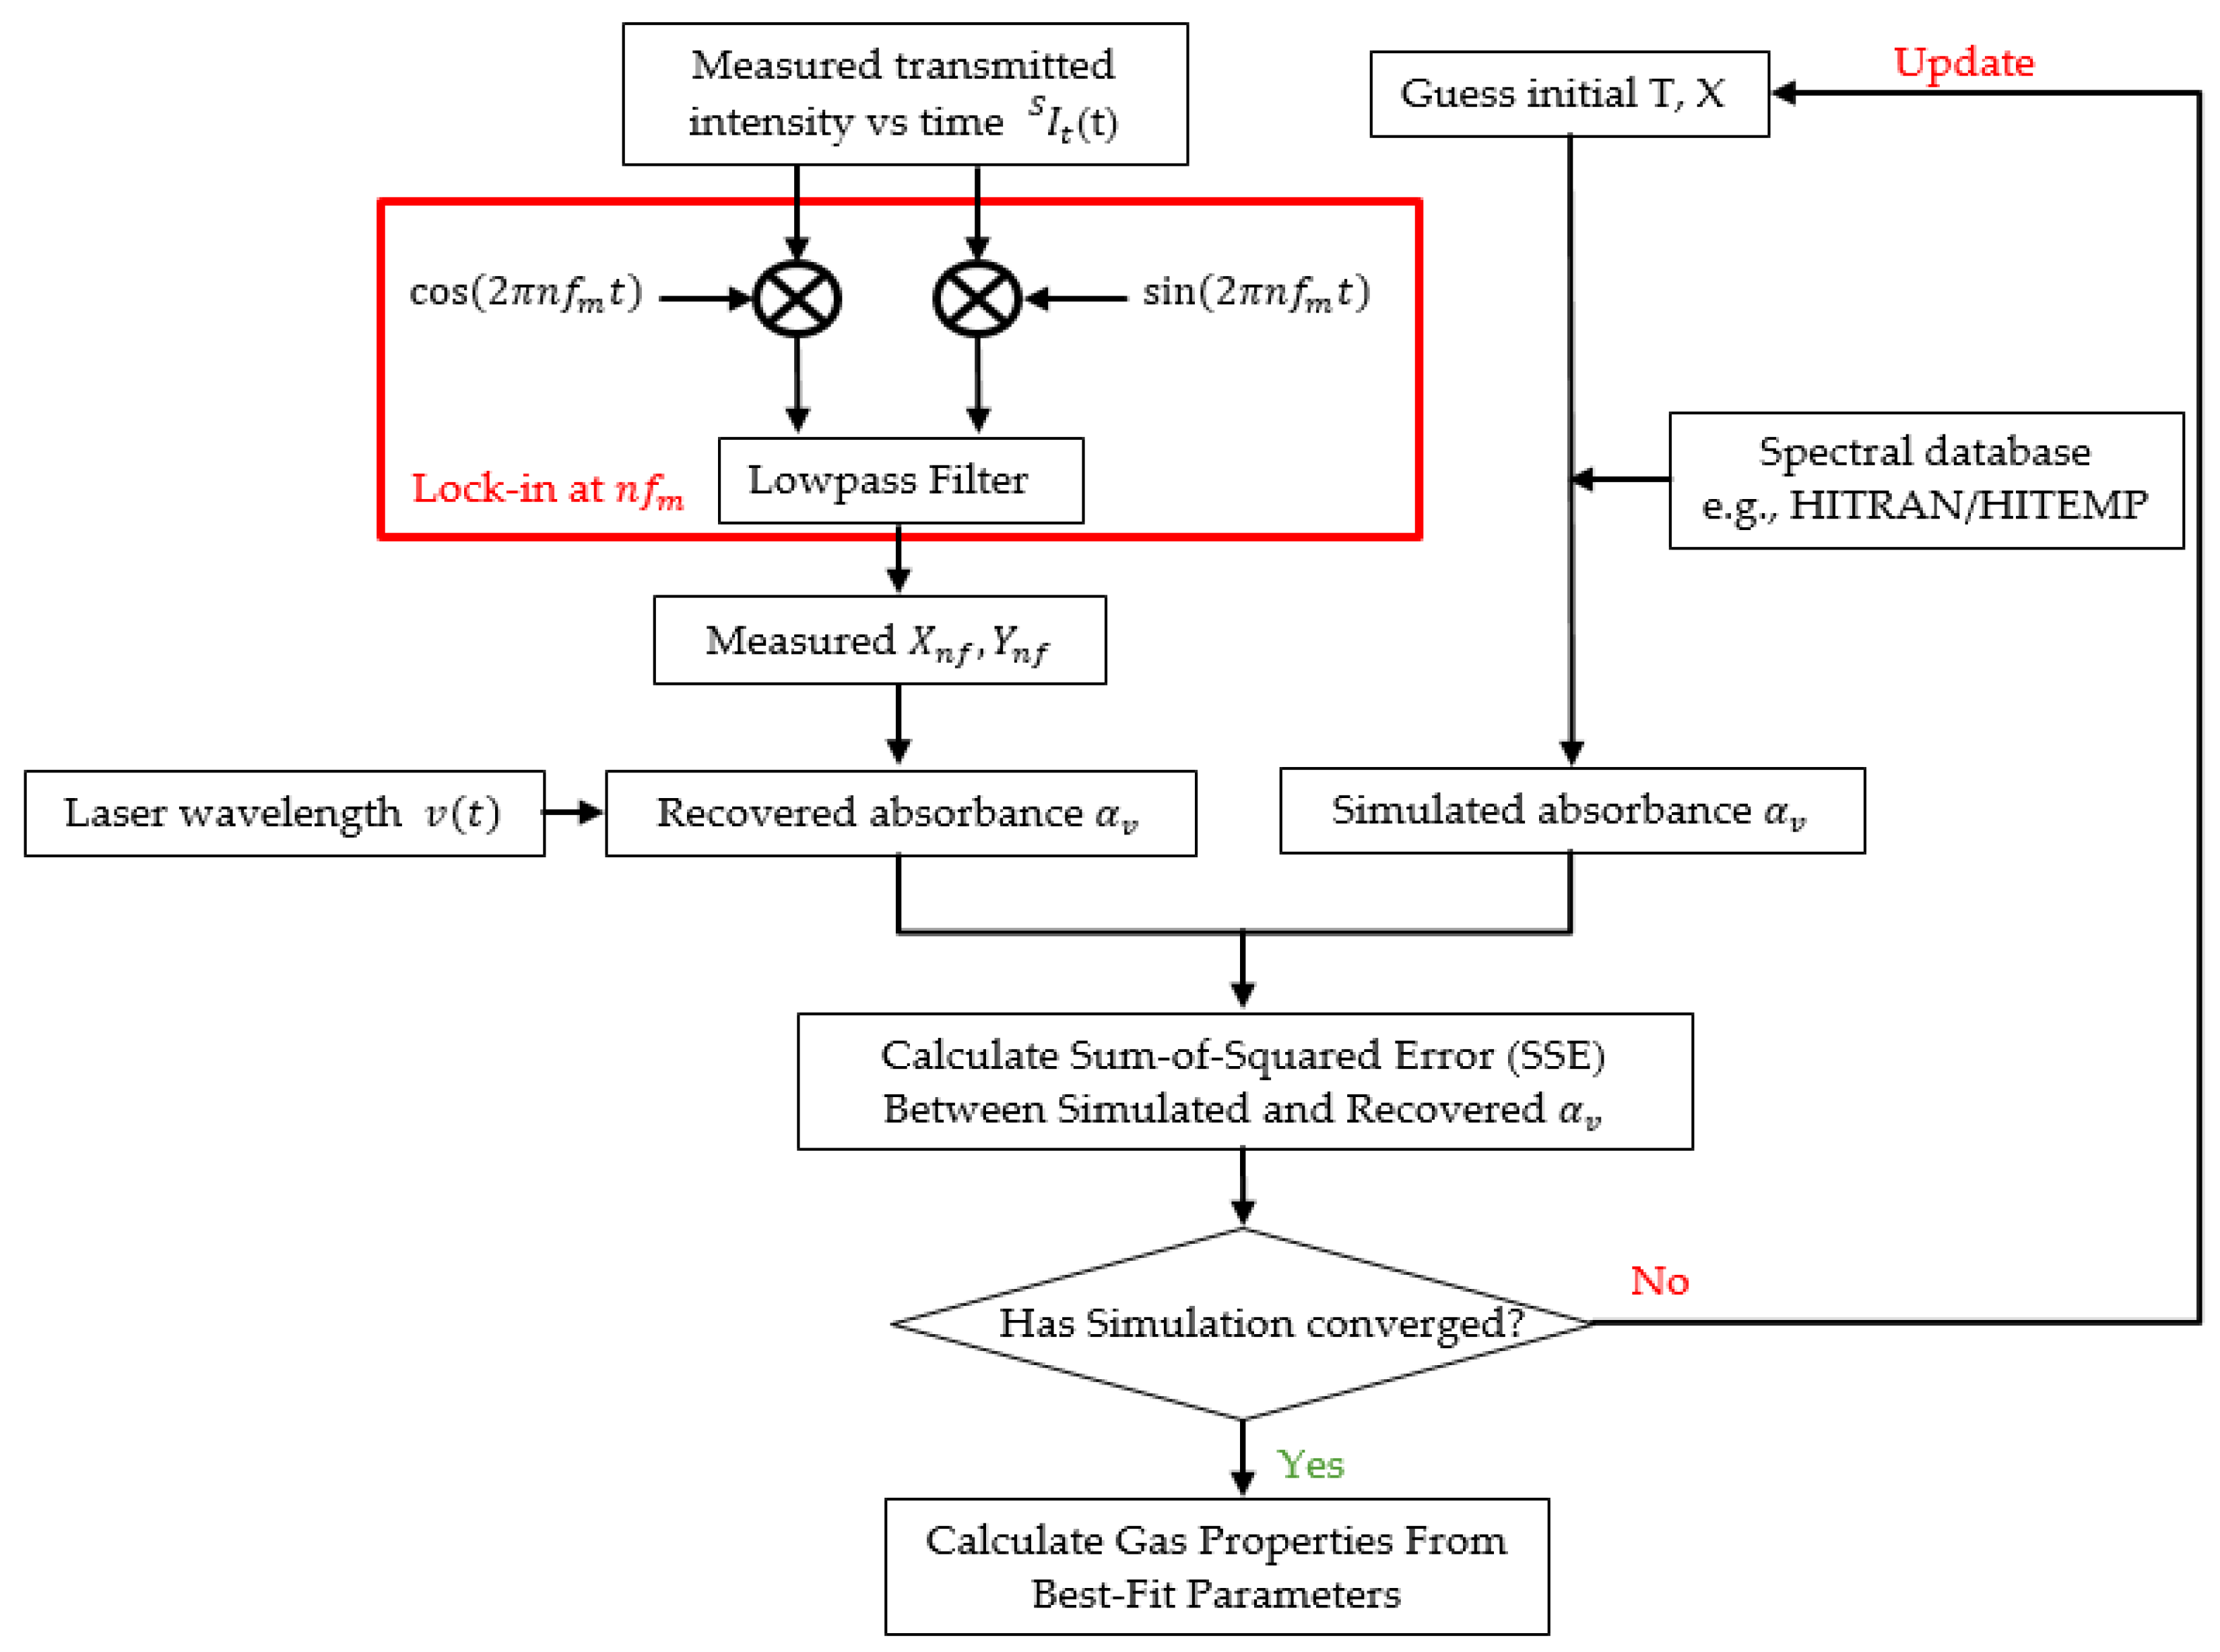
3.4. Recovery of the Absorbance Profile Based On Higher-Order Harmonic Signals

While previous WMS approaches use the harmonic signals directly, a phasor decomposition method has been proposed to recover the absorbance profile from the first harmonic on the basis of RAM [60,61]. However, these earlier attempts only worked well with small modulation indices (m < 0.2) when the first-order harmonic shape is close to the first derivative of the absorbance profile. Peng et al. employed additional higher odd harmonics (3rd, 5th, …) to enhance the recovery accuracy with large modulation indices [62]. Figure 6 shows the flow chart of the recovery and data reduction process. It is worth noting that while considering more harmonic components improves the model recovery accuracy, these high-order terms usually have low SNRs and are difficult to detect in practical measurements.

3.5. DAS-Calibrated WMS

From the discussion above, one may conclude that DAS and WMS have their own advantages and limitations. While being more noise-immune in practical environments, calibration-free WMS methods rely on extensive laser characterization, and the nonlinear response to the sinusoidal modulation over the entire wavelength scan could lead to significant distortion in the 2f lineshape, especially with wide wavelength scans. Klein et al. have thus proposed a DAS-calibrated WMS method, which combines the simplicity and accuracy of the intrinsically calibration-free direct TDLAS (dTDLAS) with the enhanced precision of WMS-2f [63]. A rapid (125 Hz) time-division multiplexed scheme alternating between triangular scan and scanned modulation was used to realize quasi-simultaneous DAS and WMS measurements. The concept of this on-the-fly calibration is illustrated in Figure 7. An absorbance level of 0.1 was chosen as the decision criterion of whether DAS only or DAS-calibrated WMS will be used. This largely extends the dynamic range of a single sensor and is especially advantageous for in-field measurements without the need for reference gases or measurement interruption.

3.6. Summary of Measurement Schemes

A summary of various scanned-wavelength LAS techniques discussed above is presented in Table 1. For the purpose of comparison, fitting parameter initialization, parameter predetermination, as well as features and limitations for each algorithm are listed.
DAS is preferred for its calibration-free detection capability and simplicity, for applications where relatively isolated transitions are used. However, laser intensity fluctuations, excess noises, and baseline fitting errors put limitations to the use of this method especially for difficult environments. Thus, DAS is the method of choice for measurements with transitions of sufficient linestrength and narrow linewidth to allow laser access with wavelength scanning.
By contrast, the WMS method is more promising for measurement systems with small absorbance, high pressure broadening, or blended absorption features precluding a straightforward determination of the non-absorbing baseline. With 1f normalization, the calibration-free WMS-2f/1f method can account for variations in laser intensity such as non-absorption losses due to light scattering or beam steering. This makes it advantageous for measurements in harsh environments involving high pressures, high opacity, high emission levels, and high temperatures.
The accuracy of DAS lineshape recovery from harmonic signals is limited by the low-SNR high-order terms, making this method unsuitable for practical measurements. A time-division multiplexed spectroscopic scheme is applied by alternating laser modulation and allows the enhancement of precision and dynamic range. This is an attractive strategy for in-field trace gas measurements without any need for reference gases or measurement interruption.
The LAS techniques discussed above typically provide a path-averaged parameter measurement over the zone of interest. Parameters including temperature, concentration, etc., are inferred by fitting measured and simulated spectral profiles. On the other hand, strategies have been developed to identify non-uniform characteristics in practical environments that commonly result from heat transfer, flow mixing, and combustion.
Two types of approaches including single line-of-sight (LOS) absorption and tomography have been proposed and experimentally demonstrated for the measurement of non-uniform zones. The first approach is based on either the a priori temperature (concentration) distribution profile or the probability density function along the LOS, namely, profile fitting and temperature binning, respectively [64]. It depends on simultaneous measurements of multiple absorption transitions with different temperature dependence. Tomography, on the other hand, relies on multiple LOS measurements and computational reconstruction algorithms. It reduces the requirements for spatially continuous optical access in traditional planar imaging and exhibits great potential for harsh and even optically dense environments [65]. However, this may complicate the optical system design and data processing of the experimental results.
Improvement in laser source and tomographic algorithms will contribute to greater accuracy in the temperature and concentration distribution reconstruction, using either of the two approaches above. Rieker et al. have extended the single LOS technique from advanced and expensive diode lasers with much broader tuning range (up to 10–15 cm−1) to a dual-frequency comb spectrometer [66,67]. The temperature distribution reconstruction accuracies increase as more absorption lines are incorporated. In addition, the development of hyperspectral laser sources enables measurements of a large number of absorption transitions and thereby significantly reduces the number of projections [68,69]. A detailed summary of laser absorption tomography (LAT) algorithms has been given by Cai et al. [65].

4. Strategies for Noise Reduction and Design Optimization

4.1. Souces of Noise

For any sensing system, the noise and uncertainty in the obtained results need to be assessed to evaluate the performance of the sensor. High noise levels not only obscure the signal to be measured but also make the data reduction process difficult and time-consuming. In the following, we will first discuss the several major sources of noise in a LAS system, including laser noise, detector noise, analogue-to-digital conversion (ADC) noise, optical noise, and environmental noise [70,71]. Then, different approaches for noise reduction and signal optimization will be reviewed to guide future design considerations.

4.1.1. Laser and Detector Noise

The laser and detector excess noise are both frequency-dependent and known to have a pink noise spectrum. They are known as 1/f noise and are usually the dominant noise component at low frequencies from 1 to 10 kHz. The detector shot noise and thermal noise, on the other hand, are independent of frequency and known to have a white noise spectrum. Table 2 gives a brief summary and comparison of the different laser and detector noises.

4.1.2. Quantization Noise and ADC Resolution

The demands for accuracy and precision in trace species detection present great challenges for DAS. Therefore, high-speed and high-resolution ADC is required to recover the analogue detector signal with low quantization noise and to reduce the laser relative intensity noise (RIN, same as excess noise) through fast sampling. The frequency filtering feature of WMS has been widely adopted as it could improve the SNR by modulating and demodulating the absorption signal at an elevated frequency band. On the other hand, Lins et al. pointed out that as long as RIN is the dominating noise, the requirements for ADC resolution in 2f-WMS and DAS setups are in fact similar [72]. As suggested by the simulation results, when the RIN is low and sufficient ADC resolution is provided, DAS can provide higher SNR than WMS. In this case, with the advances of modern electronics and digital signal processing, DAS can have more advantages over WMS [73].

4.1.3. Optical Interference Fringe Noise

In a multi-element optical system with coherent light source, many flat surfaces can lead to optical interference fringes, often referred to as optical etalons. These optical fringes often exhibit a free-spectral-range (FSR) comparable to the linewidth of the absorbing species, so that they are difficult to be distinguished from target absorption features.
Various means have been attempted to minimize the influence of optical etalons, including careful optical design [74,75,76], mechanical dithering of optics [77,78,79], balanced-ratio detection schemes [80,81], calibration-free WMS [82,83,84], and digital filtering techniques [85,86,87,88,89]. A summary of these approaches is given in Table 3 and briefly discussed in the following.
Optical etalons essentially arise from the constructive and destructive interferences when light bounces back and forth between parallel surfaces, similar to the way optical cavity modes are formed. Optical designs to avoid etalons are therefore approaches to reduce reflections and to scramble these standing-wave modes. This includes using wedged or anti-reflective (AR) -coated windows, optical isolators, and placing the optical elements at “etalon-immune distances” to avoid etalon effects from optical feedback. Collimated laser beams can be intentionally diverged before passing through optical thins and re-collimated thereafter. In addition to these passive optical designs, an active control of the optical system can be applied to effectively reduce etalons. Mechanical modulations, such as dithering or rotation of the mirrors and use of a Brewster-plate spoiler, are active control approaches taken in high-performance optical systems. However, these do largely increase the system’s cost and complexity and may limit the achievable detection bandwidth.
Certain laser devices exhibit unsuppressed cavity mode noise or fiber-coupling noise due to imperfect optical isolation, which appear as etalons on the output scans. Balanced-ratio detection schemes, also known as common-mode rejection schemes, are commonly employed to reduce such optical fringes. The laser beam is split into a measurement and a reference beam, and signals from the two detectors are fed into a balanced-ratio detection circuit that automatically cancels out the noises commonly present in the two signals. Etalons originated from the optical path external to the laser cannot generally be canceled in this way, since it would be difficult to achieve exactly the same beam path other than the portion being absorbed.
Etalon fringes often appear as low-frequency noises and can therefore be suppressed through the band-pass filtering process of WMS. On the other hand, fringe noises may add to the RAM and put additional constraint on selecting the optimal modulation parameters. This can lead to reduced SNR and larger uncertainties, especially since the optical alignment and etalon fringe profiles may change over time.
Digital filtering techniques are extensively investigated in absorption signal processing, including wavelet transform, Kalman filter, and empirical mode decomposition (EMD). These methods are purely from a standpoint of digital signal processing and frequency-domain analysis, thus require no additional optical or mechanical components. However, these techniques will inevitably increase the computation complexity, and the filter parameters need to be carefully designed on the basis of an appropriate understanding of the signal and noise characteristics. The extent of improvement that such techniques can achieve is ultimately limited by the quality of the light signal measured, so it is still of utmost importance to devote the best effort in designing a better optical system.

4.2. Strategies Based On Laser Control Parameter Optimization

The absorption signal can be enhanced by optimizing a number of laser control parameters including scanning amplitude, scan rate, modulation depth and frequency, and time delay constant of the lock-in amplifier.
A number of researchers have discussed parameter selection criteria for the WMS system. Werle et al. conducted a comprehensive analysis of the modulation degree so as to obtain maximum signal amplitude [8]; a Fourier series was utilized by Uehara et al. to analyze the relationship between modulated signals and optical penetration depth in frequency modulation [90]; Kluczyrrski et al. theoretically studied the effect of modulation frequency [91]; Neethu et al. studied the optimization of a number of modulation parameters in realizing a LAS oxygen sensing system [92].
Table 4 summaries the effect of different control parameters on the 2f-signal waveforms including maximum amplitude, SNR, peak width, and peak height ratio (PHR).
Due to the complex intercorrelation between various laser characteristic parameters, no explicit mathematical expressions generally exist to describe the dependence of the WMS signal on the laser control parameters. Therefore, the selection and optimization of these control parameters usually rely on empirical attempts and maximization of the target signal. The laser scan range, for example, is simply set to cover the target absorption feature and just enough non-absorption portions for baseline fitting, without leaving excessive margin which will decrease the detection bandwidth. For WMS in general, the modulation depth is chosen so that the WMS-2f signal at absorption line center is maximized. It has been demonstrated that for an isolated absorption feature, the highest peak value can be achieved by selecting the modulation depth to be 1.1 times the full-width-at-half-maximum (FWHM) Δν of the absorption feature [55].
In conventional scanned-wavelength WMS, a high-frequency sinusoidal wave is superimposed on a linear ramp of the laser injection current. As the laser tuning function can now readily be controlled digitally, variation of this tuning waveform can bring increased flexibility to signal optimization. Fried et al. employed a jump scanning function and dual fitting analysis to simultaneous optimize signals from two selected absorption profiles [93]. Chen et al. modified the linear ramp function so that the laser scanned more slowly near the line center ([94], Figure 8). The scan portion with stronger absorption thus occupied a larger fraction of the scan, resulting in the improvement of the overall SNR. Consequently, a factor of 1.8 improvement was observed with 2f detection, and an even higher enhancement by a factor of 3.3 was obtained with direct absorption measurements.
When multi-species detection is attempted by using closely spaced absorption lines accessible with a single laser scan, the different widths and line profiles of the target species may impose significantly different optimization targets according to the optimal modulation depth criteria stated above. Du et al. demonstrated an in situ, multi-parameter LAS sensor during a selective catalytic reduction (SCR) process by accessing four H2O spectral transitions and a group of NH3 lines with a single diode laser [95]. As can be seen in Figure 9, WMS with varied modulation amplitude (WMS-VMA) and an optimized multispectral fitting algorithm was used to satisfy the optimization targets for both the H2O and the NH3 lines.
WMS-2f detection is sensitive to the curvature of the signal. When blending different spectral features becomes more significant, absorption from the wings of adjacent lines would alter the curvature at the target line center, so that maximizing the line center 2f magnitude of an individual transition no longer renders the optimum of overall signal. In such cases, the optimal modulation depth am may largely deviate from the theoretical value of ~1.1 Δν. Peng et al. proposed a novel procedure for choosing an optimal WMS modulation depth in the presence of spectral interference by defining a new figure of merit to account for the spectral interference [96,97].
As shown in Equations (2) and (3), F and σ are defined to quantify the inverse magnitude of the WMS-2f signal and the sensitivity to spectral interference, respectively:
F ( a m ) = S 2 f ,   m a x S 2 f ( a m )
σ ( a m ) = | S 2 f / 1 f ,   i n t f ( a m , ϕ ¯ ) S 2 f / 1 f ( a m ) S 2 f / 1 f ( a m ) |
where S 2 f is the total interference-free WMS-2f signal at the target transition line center, S 2 f ,   m a x is the maximum possible interference-free WMS-2f signal, and S 2 f / 1 f is the WMS-2f/1f.
Ideally, a m should be chosen so that both the inverse signal magnitude F and the perturbation from interference σ are simultaneously minimized. Such an a m does not generally exist, so the strategy is to select a m ,   o p t = arg m i n ( C ) , where the cost function C = σ F is now the target of optimization. The so-obtained optimal modulation depth a m ,   o p t is indicated by the black dashed line in Figure 10 at the minimum of C, where the value of F at this modulation depth is 1.5, indicating that 33% of the potential SNR is sacrificed.

4.3. Strategies based On Signal Processing Schemes

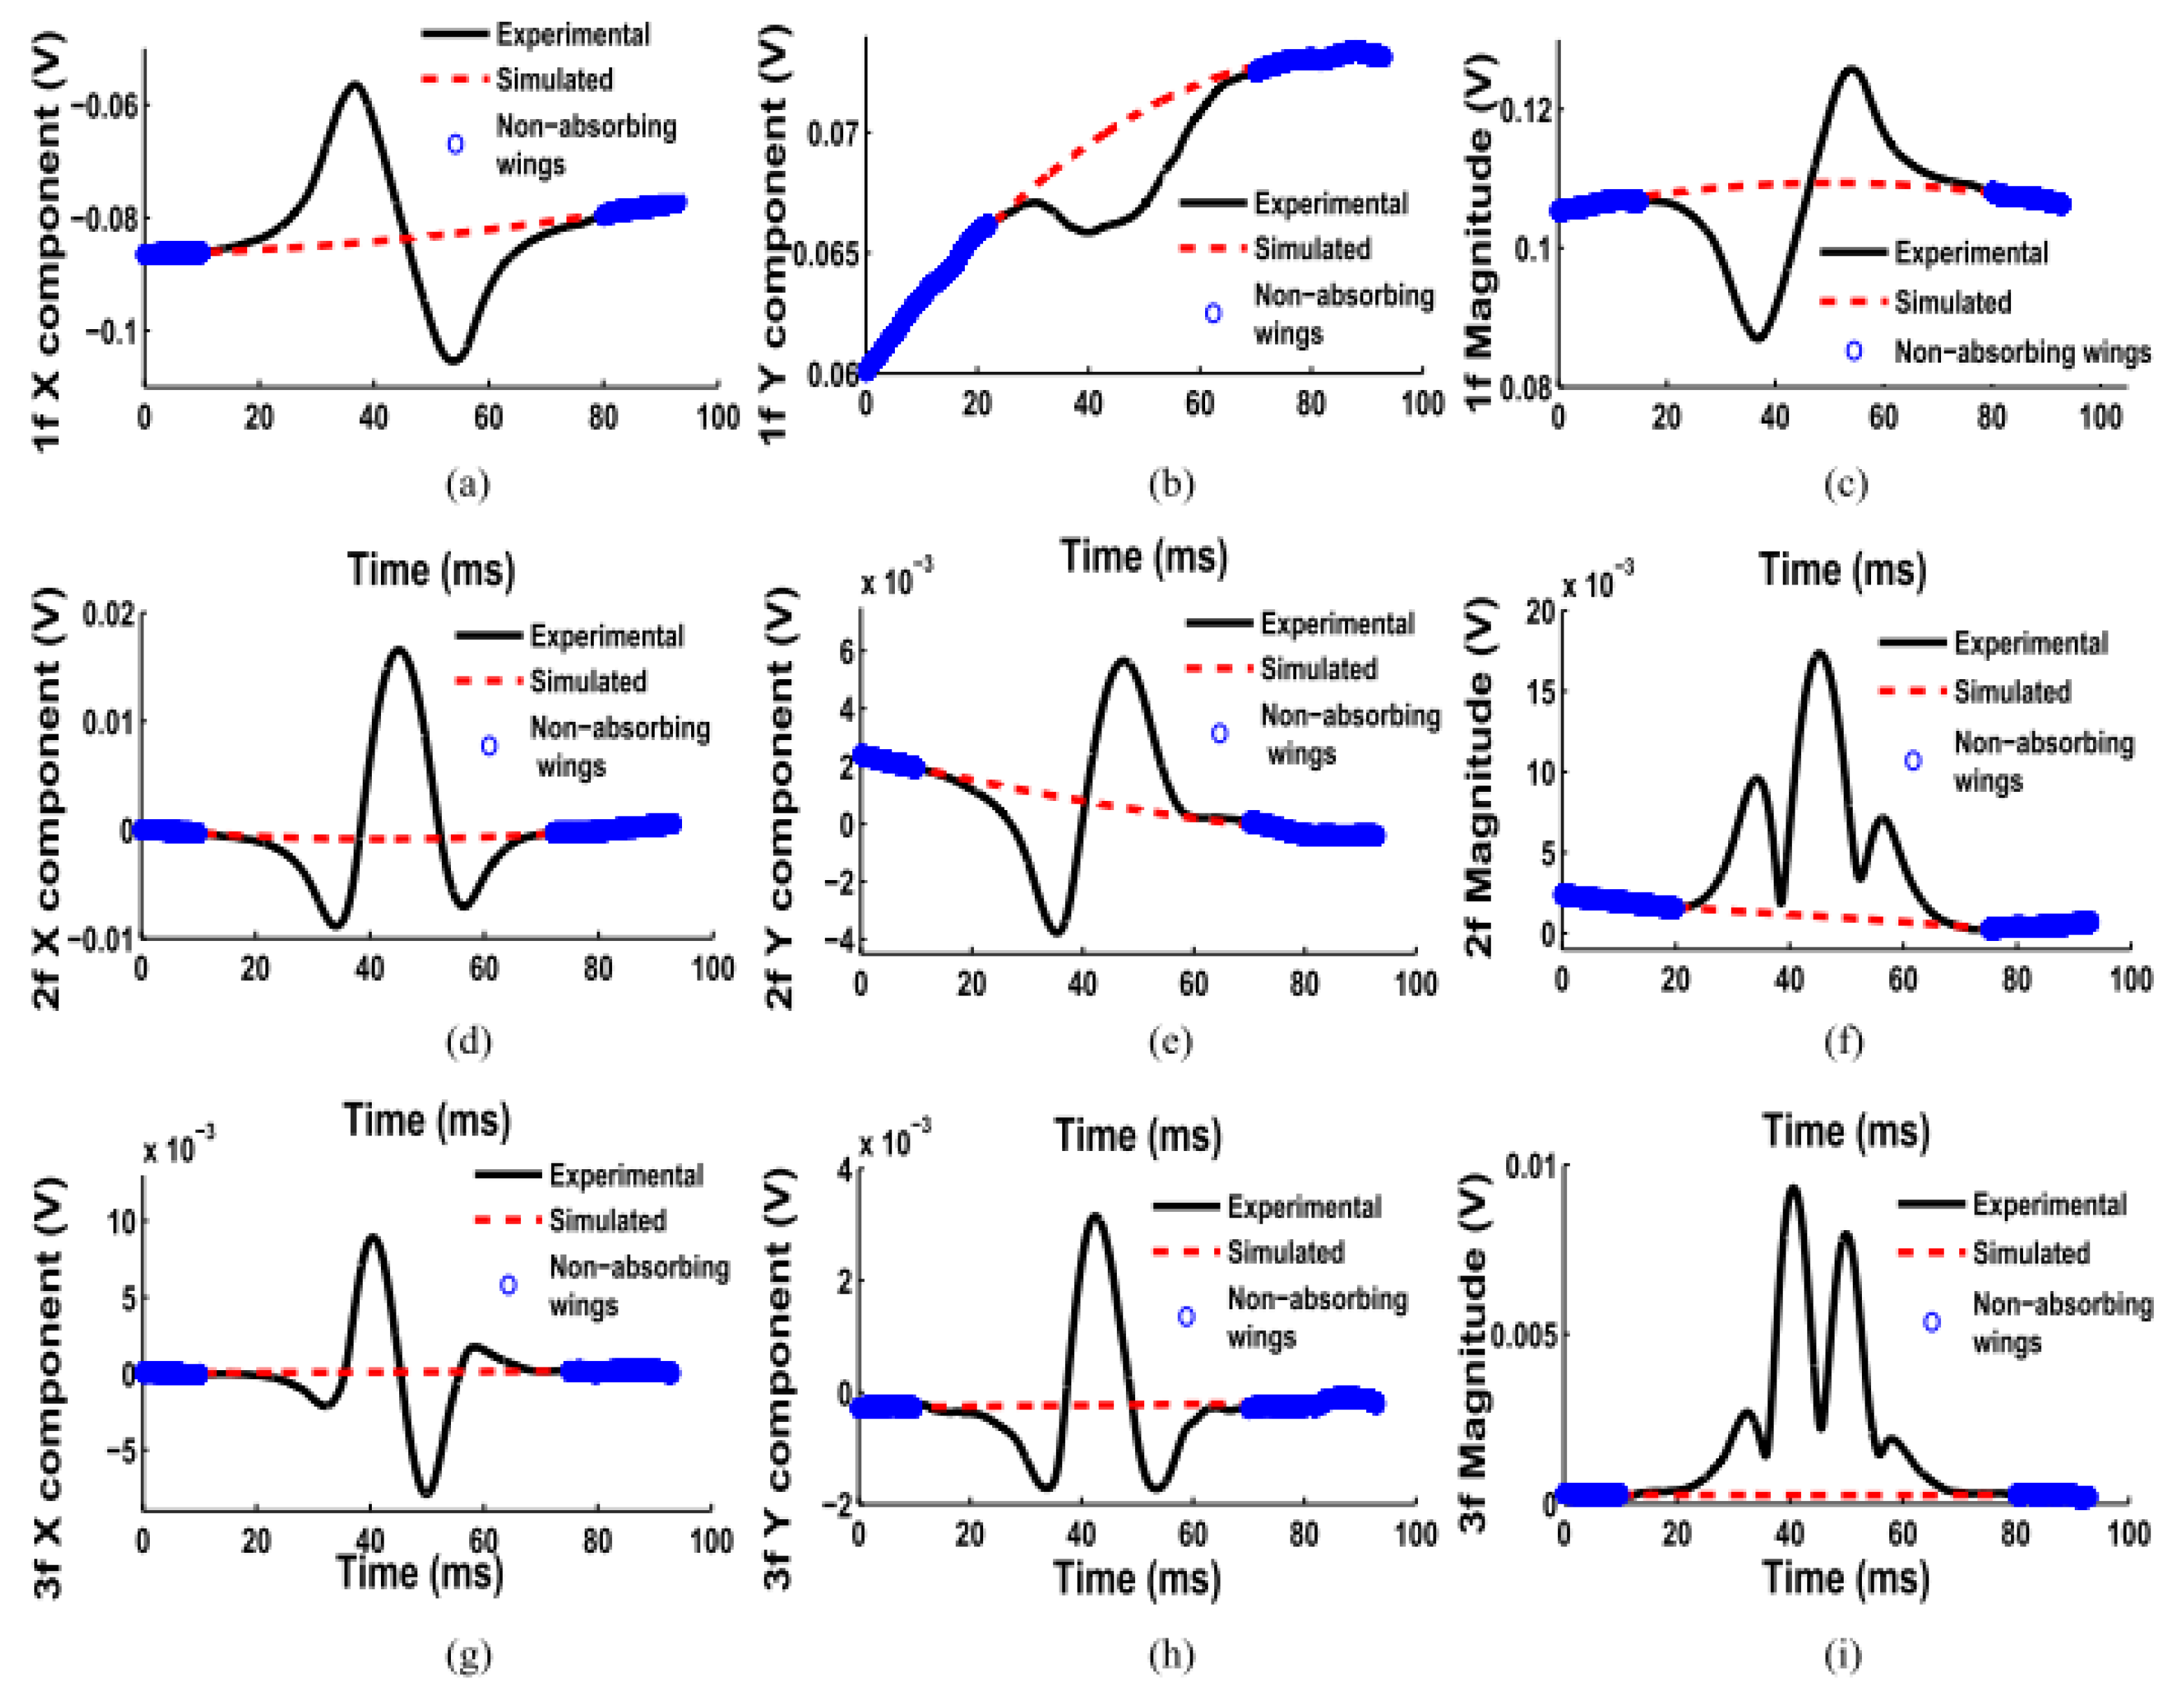
4.3.1. Baseline Fitting for Blended Absorption Feature

As discussed above, using the AI or LM fitting algorithms to calculate the laser intensity baseline requires proper identification of the absorption-free flanks. However, for spectra with low SNR, distinguishing the non-absorption area using direct visual inspection (DVI) is hard. A new strategy was proposed by Li et al. using wavelet decomposition and iteration to remove the background drift [98]. The application of wavelet transform (WT) for TDLAS signal denoising is based on finding the optimal wavelet pairs to determine the baseline. Figure 11 shows effective nonlinear baseline correction and denoising using discrete wavelet transform (DWT). Compared with the commonly used DVI method, this DWT algorithm demonstrated potential for batch processing of TDLAS spectra. However, system cost and complexity increased.
Weisberger et al. have developed a blended-feature baseline fitting method (BFBL) using a more efficient iterative lookup table approach [99]. The baseline is estimated by coupling measured data with simulated fractional transmission at the peaks between absorption features known as baseline anchor points. Figure 12 illustrates the fitting procedure, and this technique was validated against measurements in a static heated cell and a wood-fired two-stage hydronic heater. The results indicated that it can be very useful with multiple overlapping absorption features.

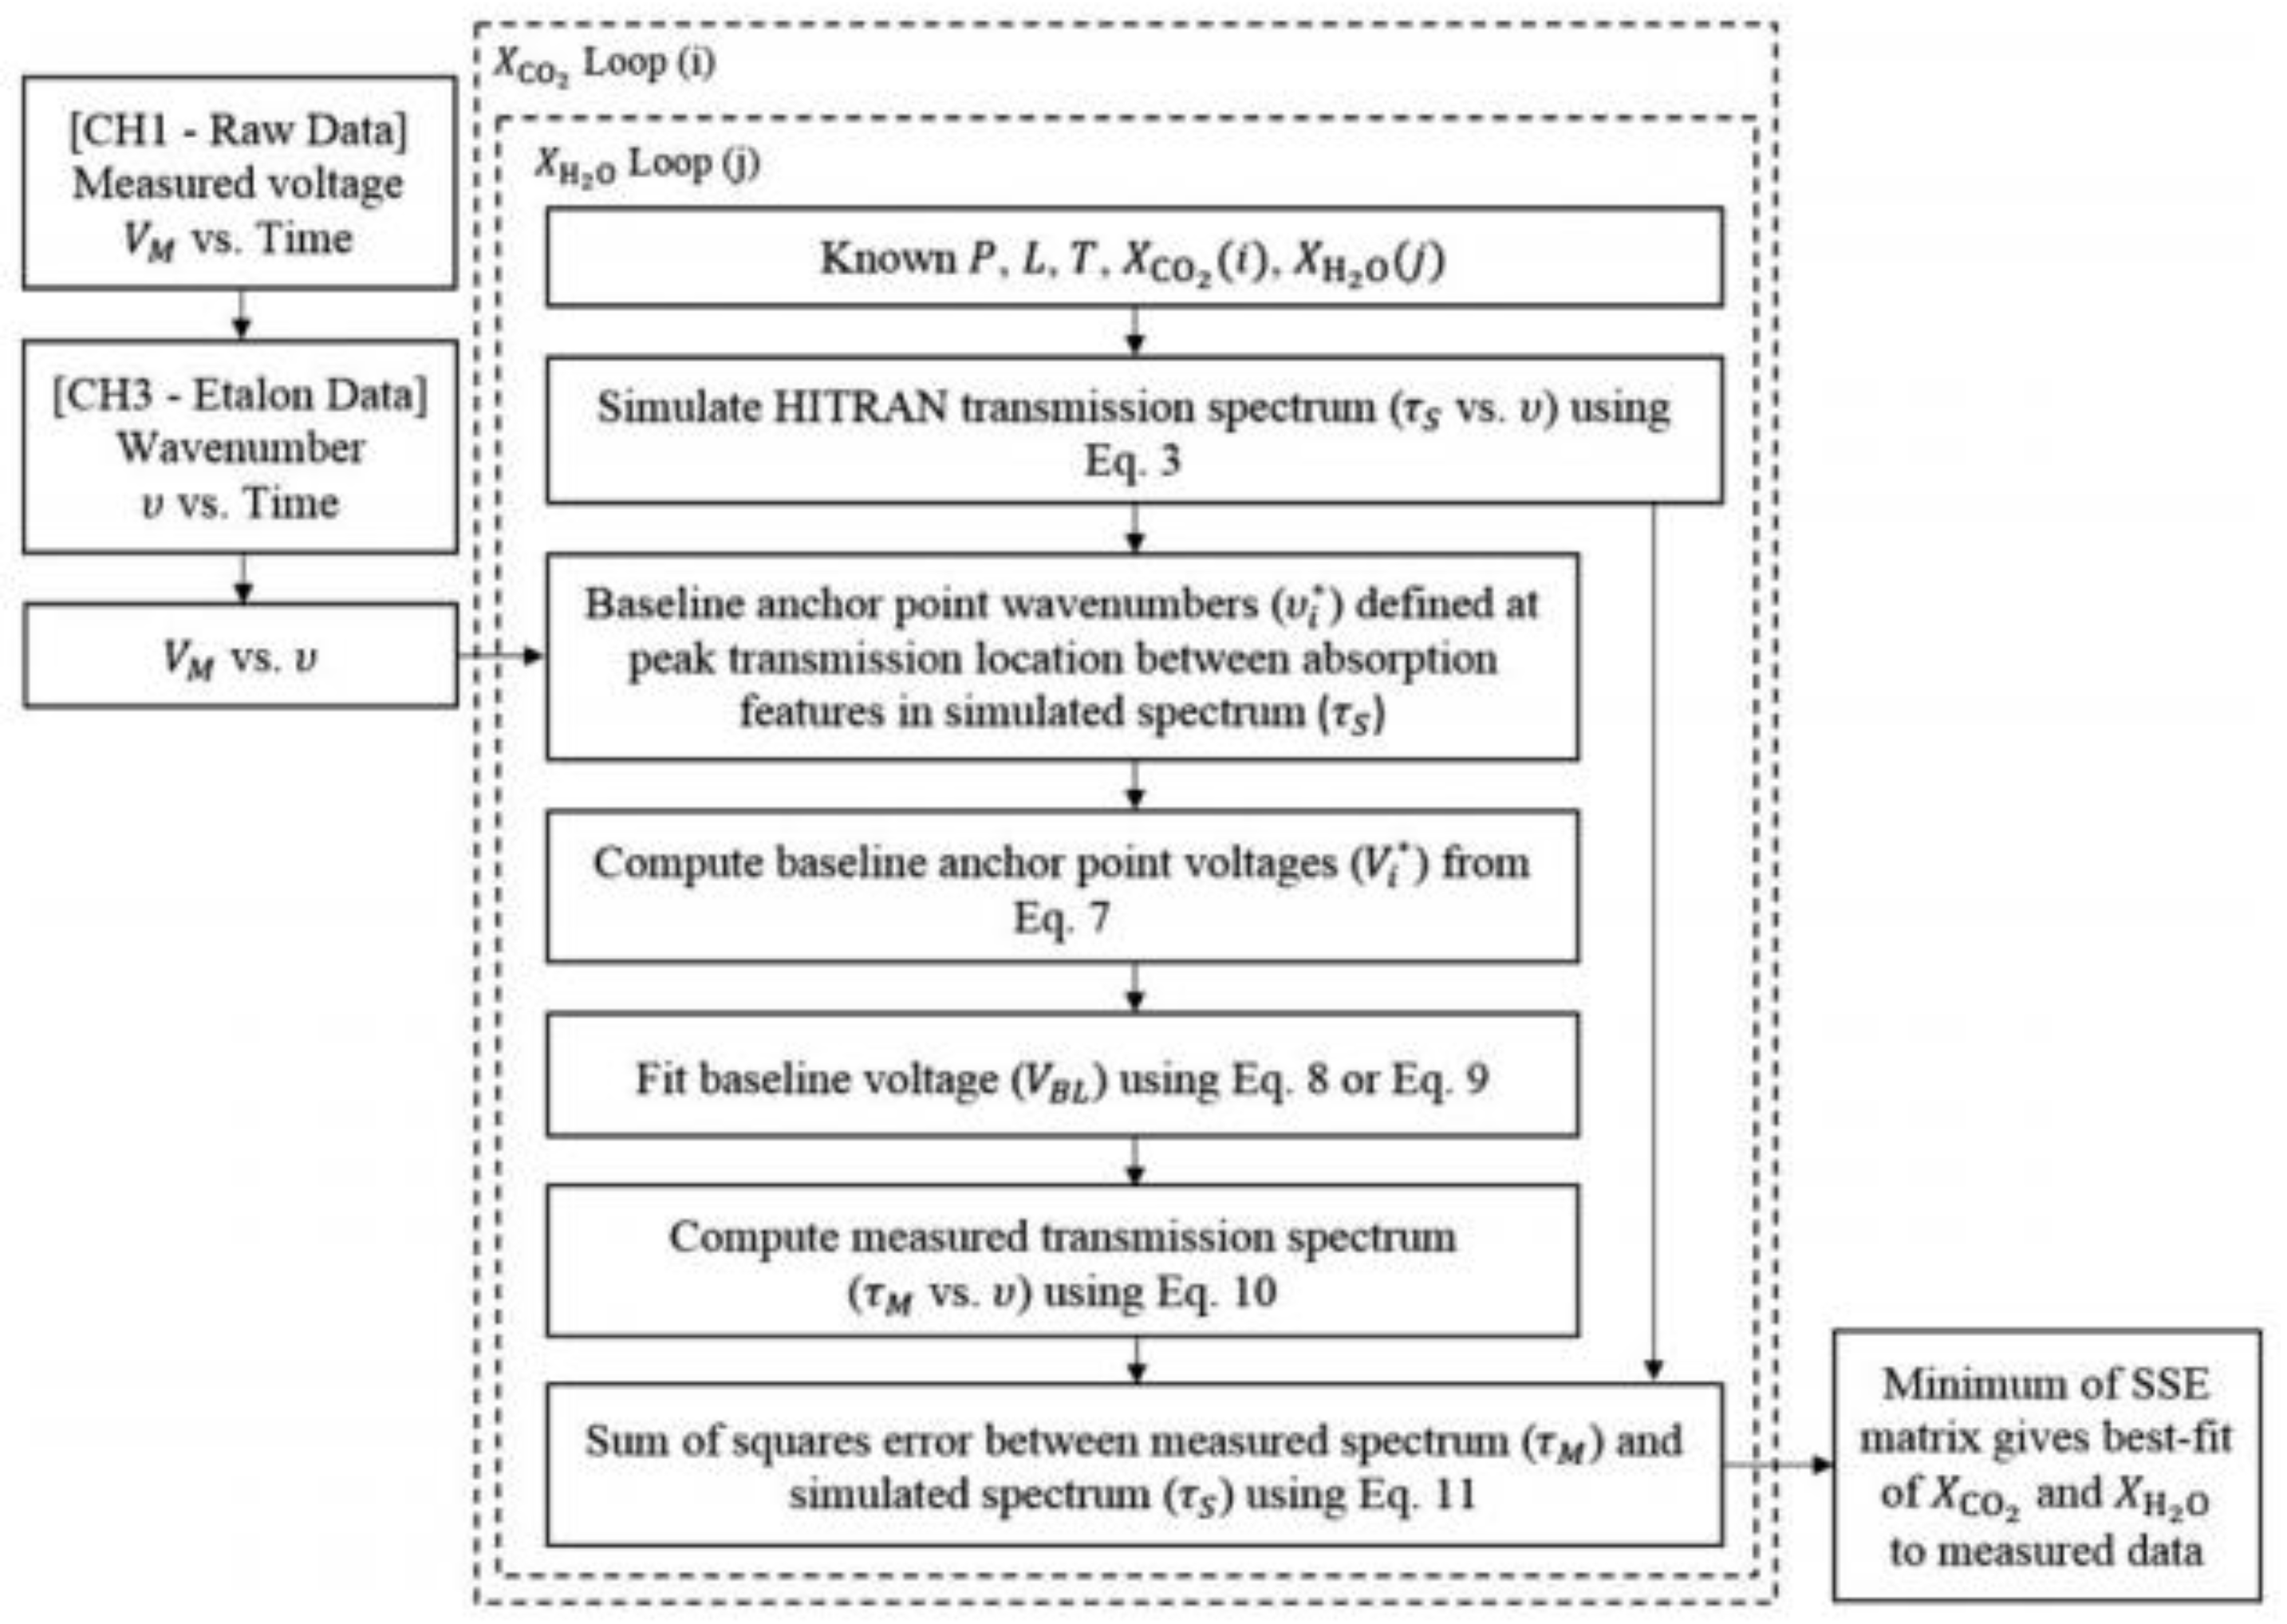
4.3.2. In Situ Parameter Fitting

In Section 3, we have discussed the limitation of calibration-free WMS when it is important to perform accurate assessments of laser characteristics. It is often assumed that the magnitude of wavelength modulation is constant over the entire scanning range [58] and the differential current-to-wavelength tuning behavior is linear for small current variations around a bias point [100,101]. Such assumption may nevertheless introduce different degrees of uncertainty under different circumstances. Zhao et al. presented an improved methodology for assessing the wavelength response of a DFB laser by using a high-order empirical formula [102].
Although the laser characterization process is not difficult by itself, the task of accurately tracking its variations in real time is nontrivial. More recently, Upadhyay et al. have proposed a new calibration-free 2f-WMS technique to measure gas concentration and pressure without the need for laser pre-characterization [103,104,105,106]. Similar to the idea of DAS baseline fitting, the harmonic backgrounds, i.e., RAMs, are obtained by interpolating the non-absorbing wings of the X and Y components of the demodulated 1f, 2f, and 3f signals (Figure 13). The intensity modulation indices in can then be obtained from the RAMs, whereas the intensity–frequency modulation phase shifts φ n can be obtained by taking the inverse tangent of the ratio of X and Ys.
The in situ and real-time characterization of relevant laser parameters ensures that the measurements are not affected by rapid non-absorbing laser intensity variations such as those due to light scattering, beam steering, vibrations, and window fouling or by slow variation effects such as temperature changes, calibration drift, and aging of the devices. However, even if it has been demonstrated that higher-order harmonic signals would have reduced spectral interference from neighboring lines, the requirement for non-absorbing baseline portions for the fitting still puts limitations to the applicable scope of this method.

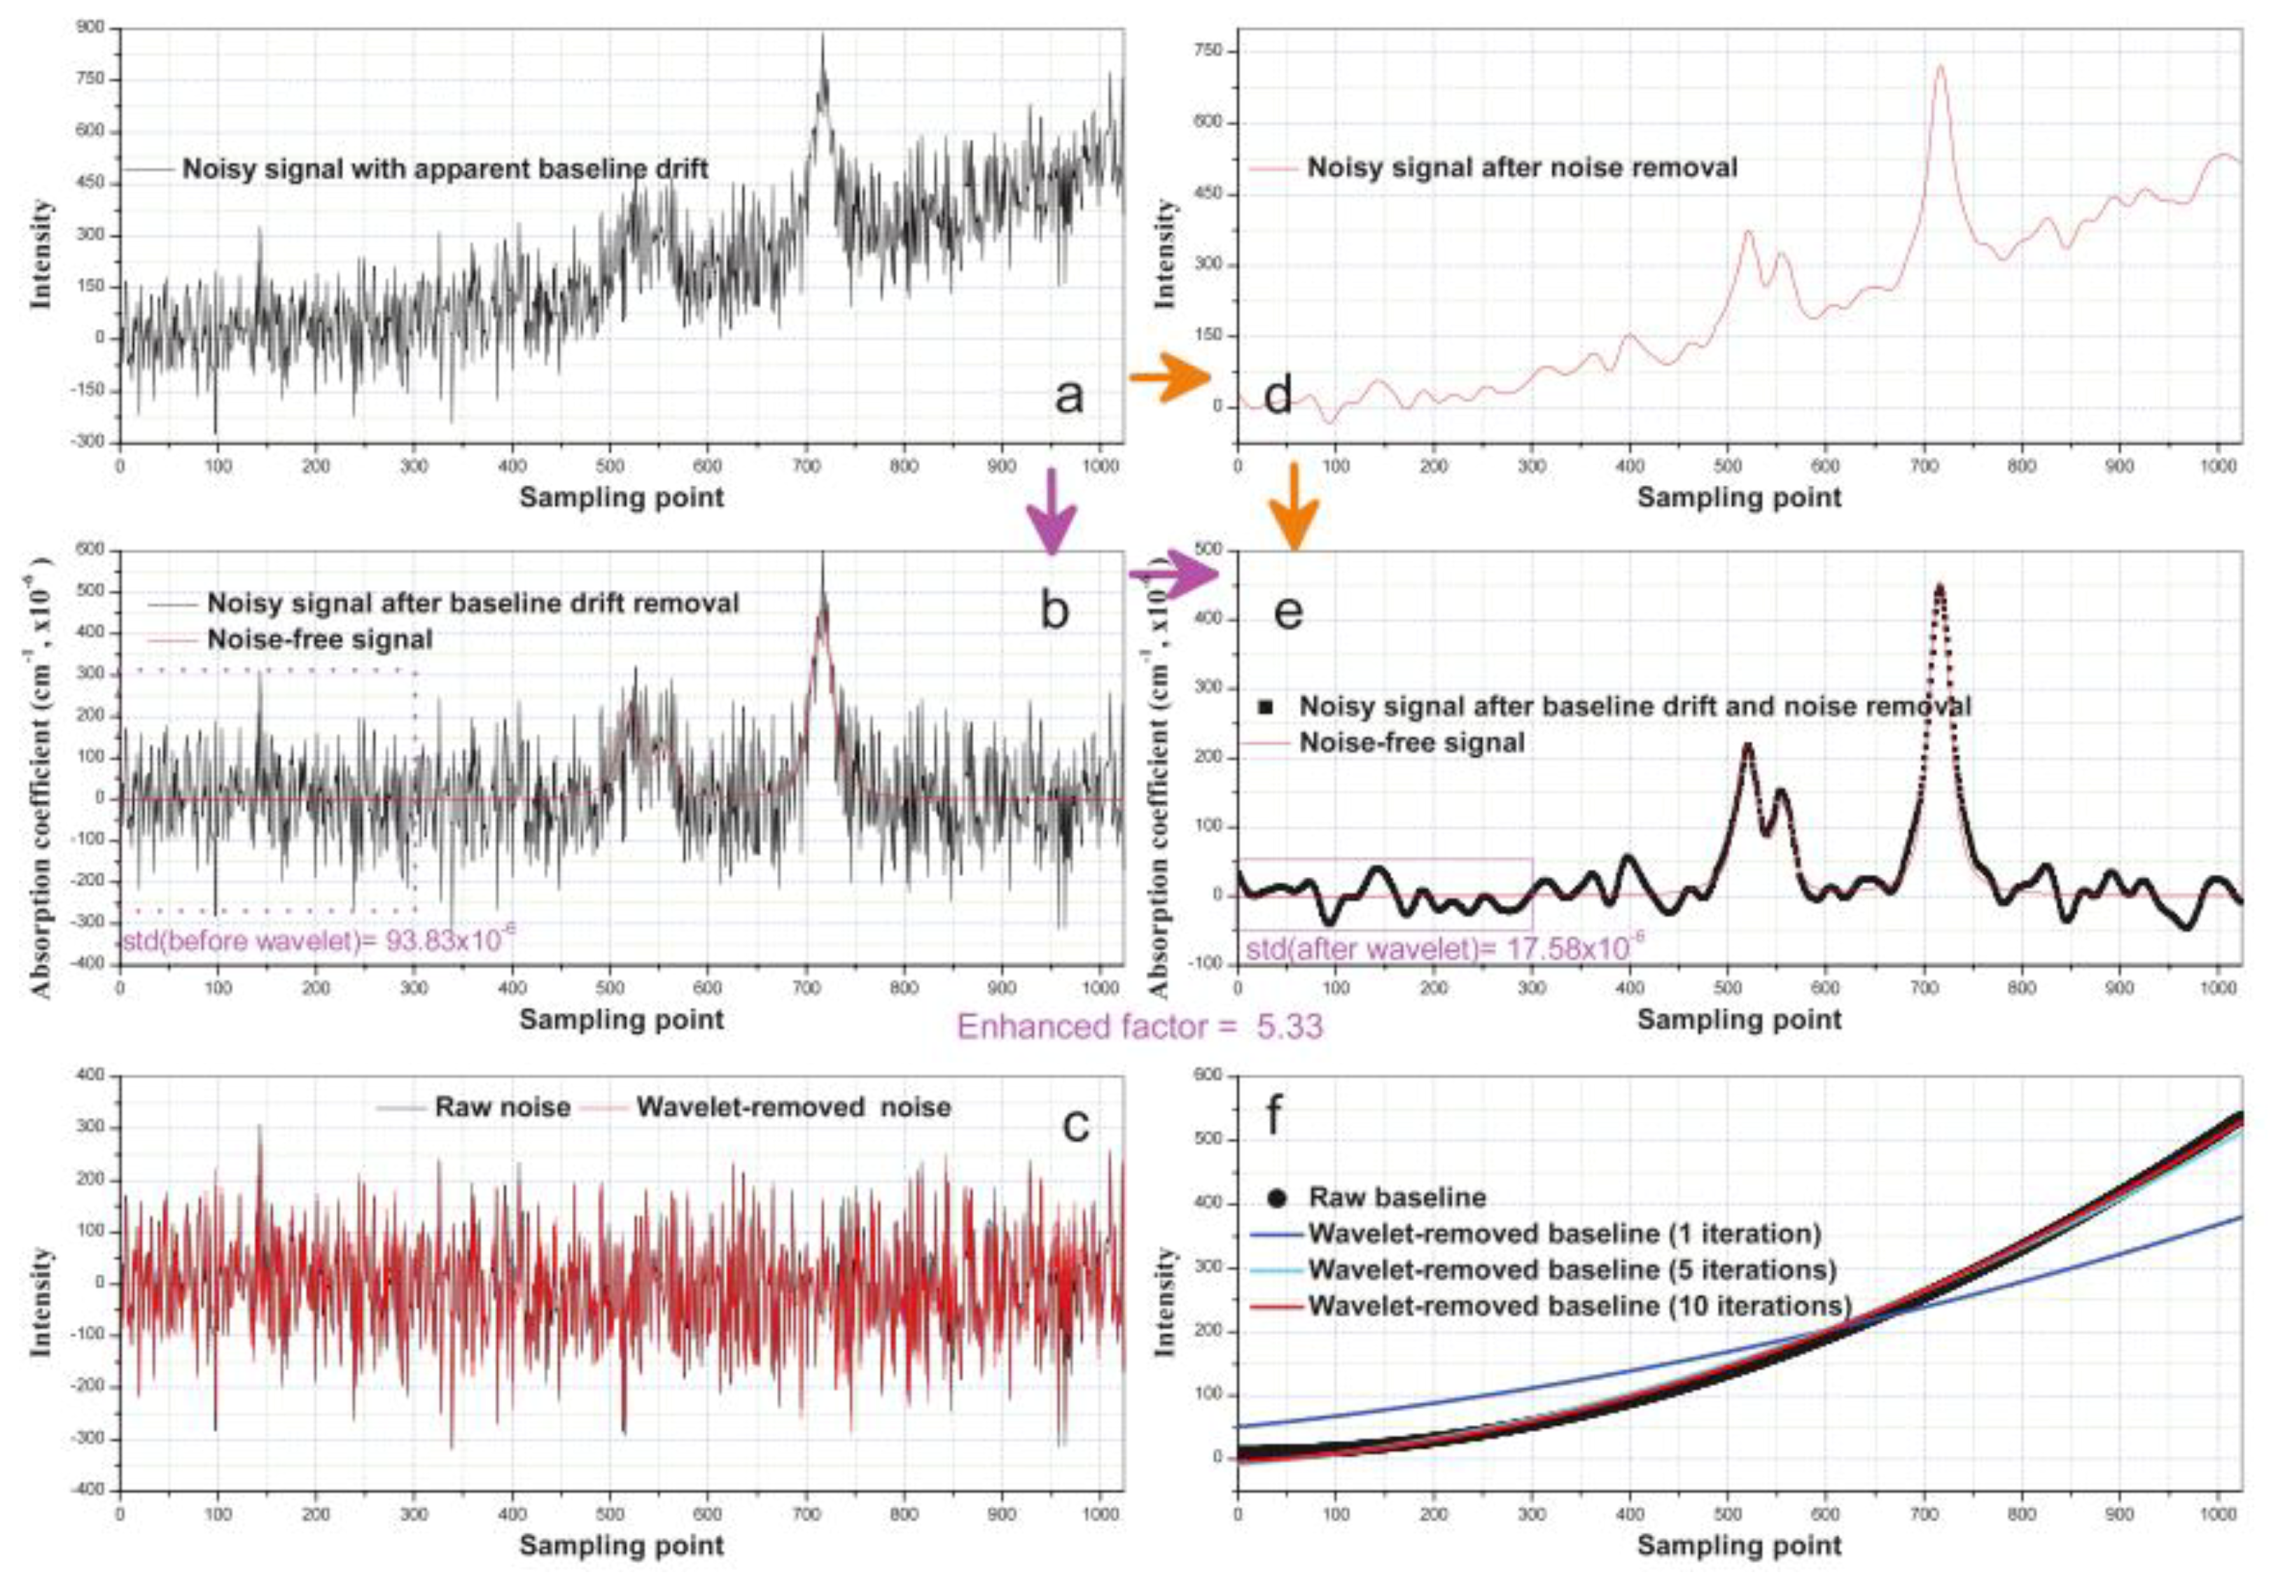
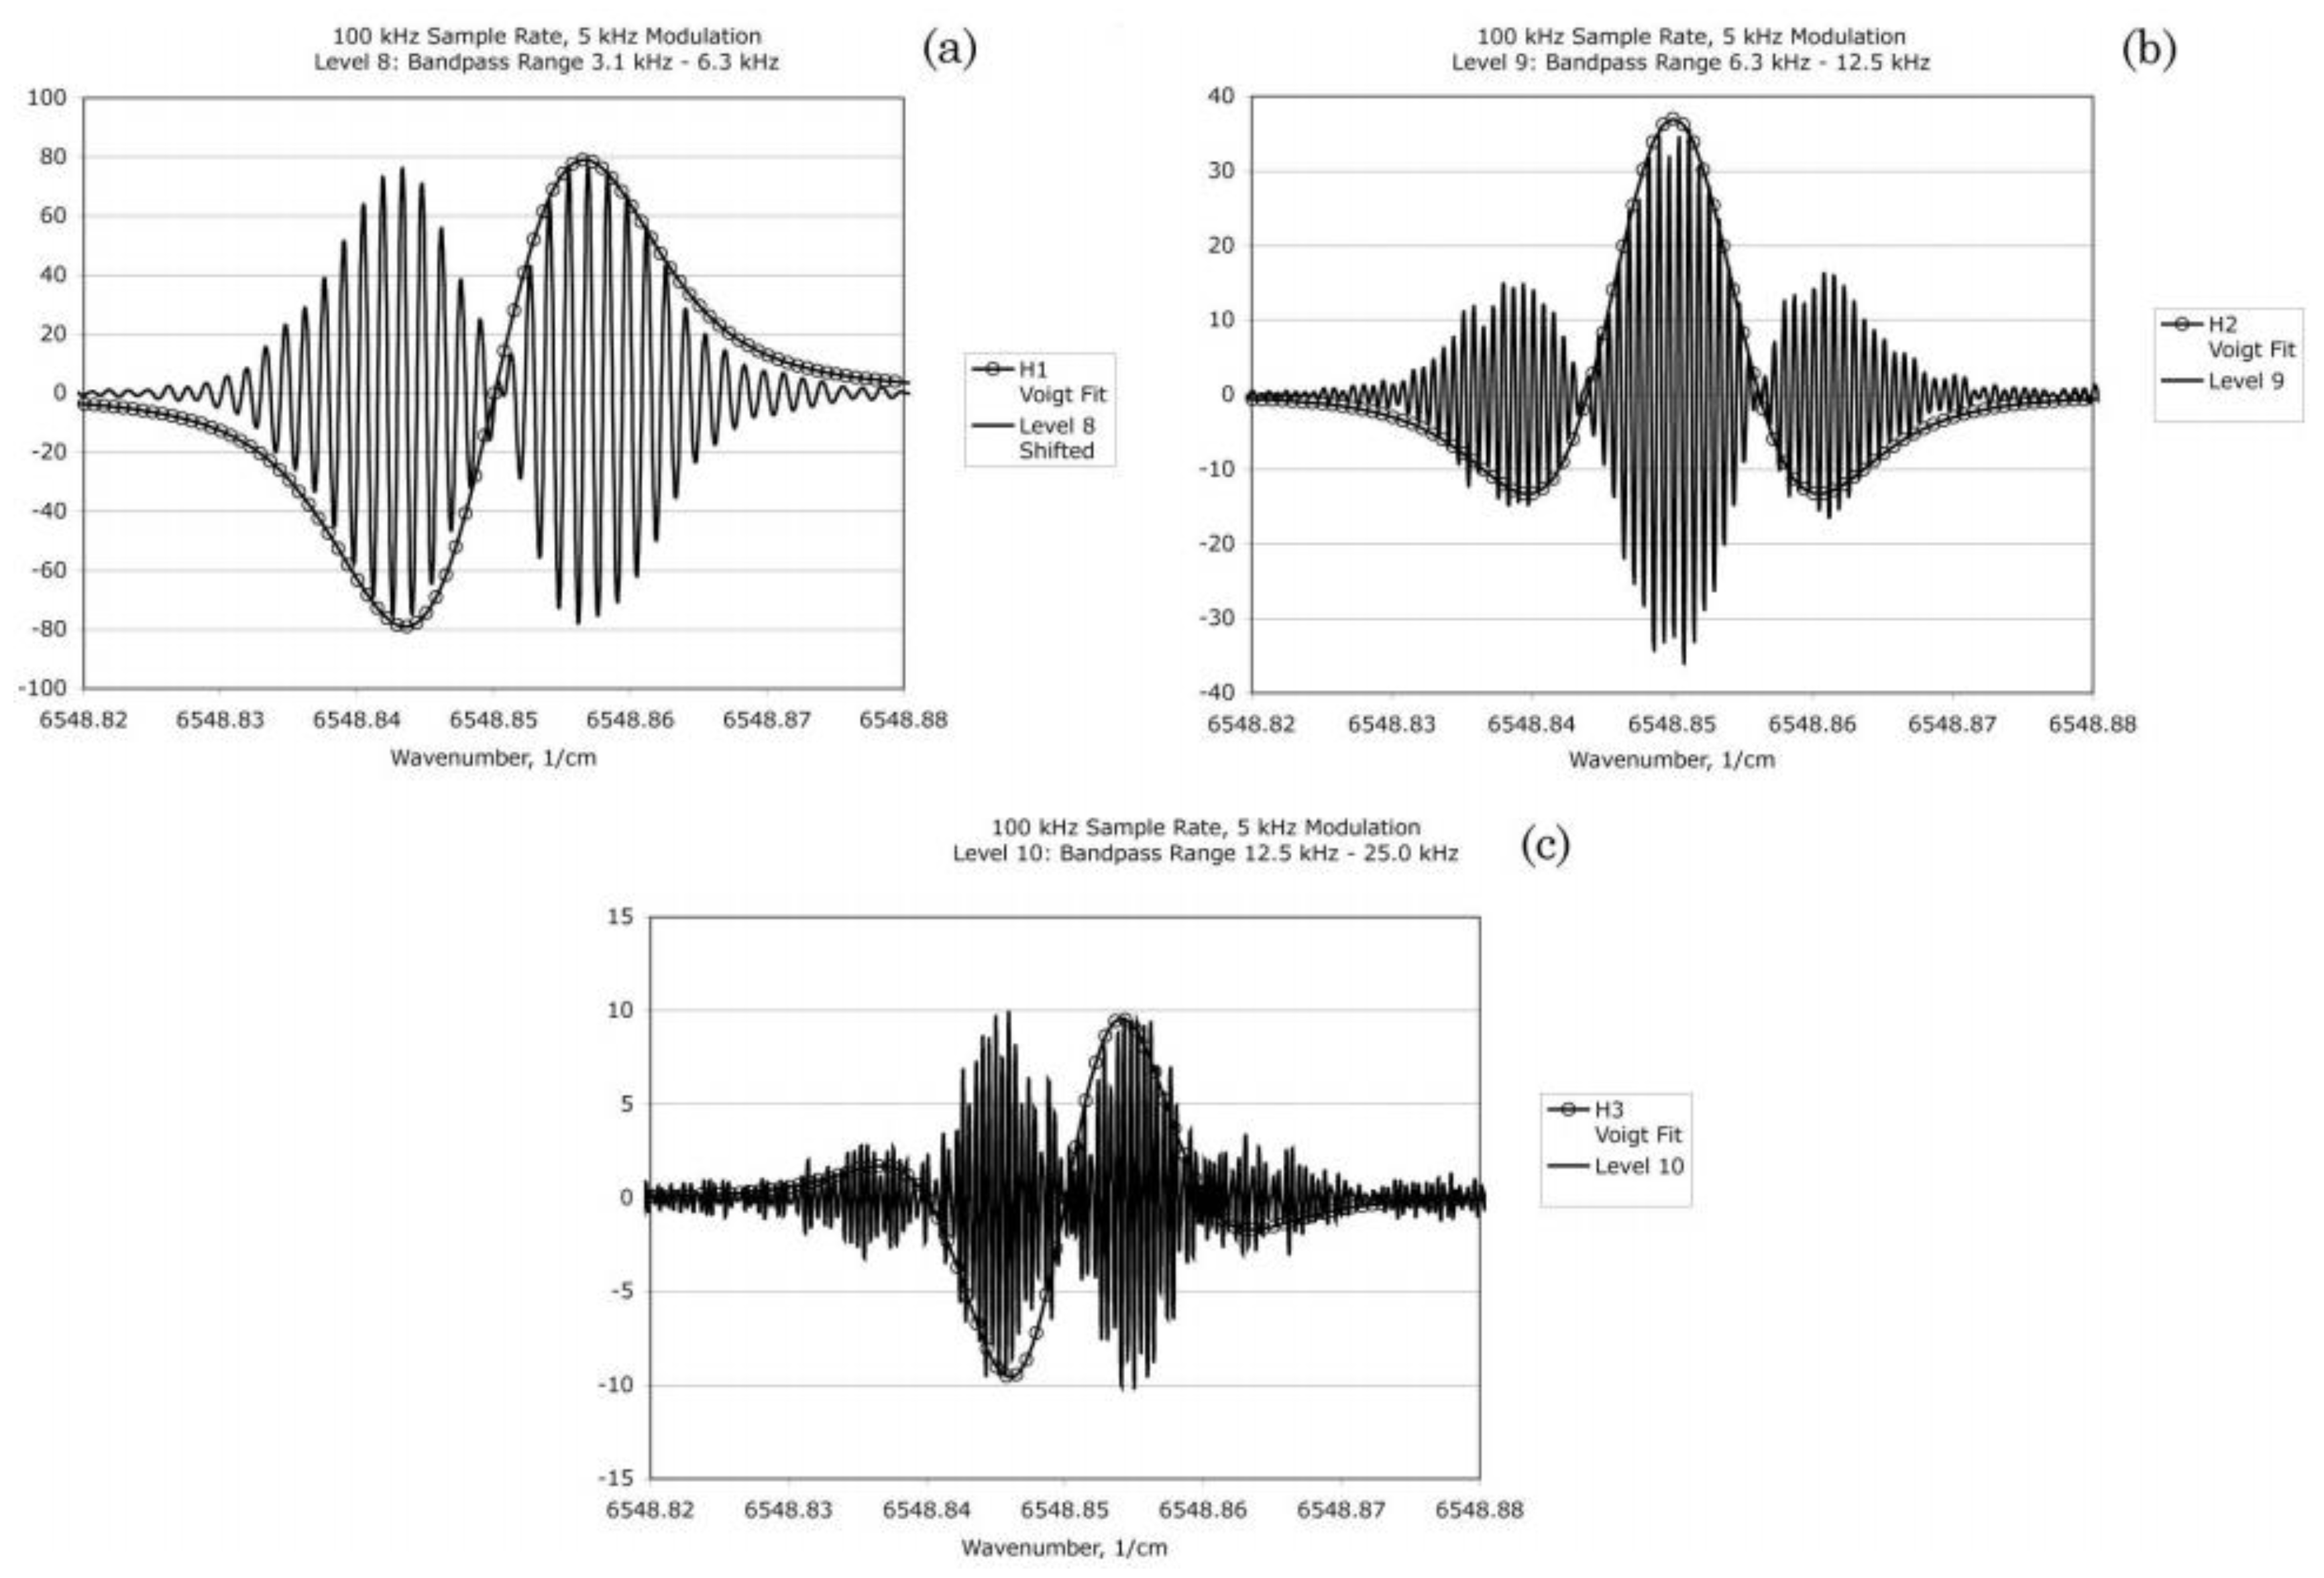
4.3.3. Harmonic Wavelet Analysis of Modulated TDLAS Signals

Calibration-free WMS is essentially a signal processing technique to extract information about molecular absorption from a noisy environment with higher signal fidelity. In view of the unsolved issues arising from potential uncertainties in laser characteristic parameters, spectroscopic constants, as well as requirements for digital filter design in the digital lock-in amplification process [107,108,109], new signal analysis methodologies have been proposed to better analyze the time-dependent signal harmonics.
Duan et al. have employed signal processing techniques based on wavelet analysis of modulated signals obtained from TDLAS and demonstrated that wavelets have the potential to enable the detection of signal harmonics [110]. In addition to a pure frequency domain analysis, windowed Fourier analysis can provide information on the time dependence of the frequency components but will suffer from substantial inaccuracy when the window width decreases. As an alternative, wavelet analyses can provide more accurate information on this time-dependent evolution of different frequency components and have become popular in recent years.
Figure 14 shows the comparison of wavelet analyses of level 8, 9, and 10 with analytical predictions from a Voigt absorption profile. Each level corresponds to a specific value related to scaling in DWT. As the level increases, the frequency resolution of the wavelet analysis increases. With the shown correlation between the two, it is apparent that wavelet analysis performed well in extracting the 1f and 2f harmonics. This work demonstrated the potential of wavelet analyses in yielding a new methodology for the improvement of the conventional TDLAS system.

5. Conclusions and Future Outlook

Efforts in improving LAS sensor performance suitable for practical environments have never stopped attracting the attention of researchers and developers. By overviewing the achievements of the developed sensors, particularly with sensor deployment in laboratory studies, industrial processes, and engine diagnostics, it can be understood that different measurement applications pose largely different demands in terms of detection limits and bandwidths. In this review, we have attempted to establish a logical development from a system design perspective, for the purpose of better understanding measurement needs and providing guidelines and insights for designing a laser absorption sensing system. Understanding the different sources and processes of noise is the prerequisite for proposing appropriate strategies for SNR amelioration. Under typical measurement conditions, analogue and digital noise from opto-electronic devices, optical noise from the optical system, and excess noise from the environment are the most relevant disturbances that contribute to signal deterioration. In addition to designing a better optical system, strategies of noise reduction and design optimization play important roles in improving a sensor performance and achieving better adaptation to various environments. This can be done through either optimization of laser control and tuning parameters or various algorithms for data processing, such as baseline extraction, in situ laser characterization, and wavelet analysis. It is realized that the need for sensing technology development is highly fragmented and demand-driven. While each measurement strategy has its limitations and constraints in face of the challenges from complex environments, much needs to be done from an engineering design perspective and to profoundly comprehend the underlying scientific fundamentals in terms of optics, spectroscopy, and signal processing.

Author Contributions

Z.W. collected references, drafted and revised the paper; P.F. collected references and revised the paper; X.C. supervised the whole work, designed the paper and revised the draft.

Funding

This material is based on work supported by the National Science Foundation of China under Grant No. 51606111 and No. 61627804.

Conflicts of Interest

The author declares no conflict of interest.

Nomenclature

LASLaser absorption spectroscopy
DASDiode absorption spectroscopy
WMSWavelength modulation spectroscopy
TDLASTunable diode laser absorption spectroscopy
LOSLine-of-sight
SNRSignal-to-noise ratio
It [W/cm2]Transmitted light intensity
I0 [W/cm2]Incident light intensity
ανAbsorbance
kν [1/cm]Spectral absorption coefficient
L [cm]Absorption pathlength
n [molecule/cm3]Number density of the absorbing species
σν [cm2/molecule] Absorption cross- section
S [cm−2/atm]Absorption linestrength
ϕν [cm]Frequency-dependent lineshape function
P [atm]Pressure
Xi Mole fraction of the absorbing species i
νLight frequency
NEANoise equivalent absorbance
DFBsDistributed feedback lasers
VCSELsVertical-cavity surface-emitting lasers
FDMLFourier-domain mode locked
QCLsQuantum cascade lasers
ICLsInterband cascade lasers
LMLevenberg –Marquardt
AIAdvanced integrative
HITRANHigh Resolution Transmission
HITEMPHigh Temperature
R2f2f peak ratio
TTemperature
X0Nominal concentration
aModulation depth
i1,1st-order laser intensity modulation indices
i22nd-order laser intensity modulation indices
φ11st-order laser intensity–frequency modulation phase shifts
φ22nd-order laser intensity-frequency modulation phase shifts
ν0Specific center frequency
ν ( t ) Laser wavelength
α ( t ) Simulated absorbance
I M 0 (t)No-absorbing intensity
I S t (t)Measured transmitted intensity
I S t (t)Simulated transmitted intensity
f m Modulation frequency
mModulation index
( S n f / 1 f ) M Measured 1f-normalized nf signal
( S n f / 1 f ) s Simulated 1f-normalized nf signal
SSESum-of-squared error
RAMResidual amplitude modulation
X n f Measured X component of nf signal
Y n f Measured Y component of nf signal
LATLaser absorption tomography
ADCAnalogue-to-digital conversion
RINRelative intensity noise
EMDEmpirical mode decomposition
PHRPeak height ratio
ΔνFull-width-at-half-maximum
FWHMFull-width-at-half-maximum
SCRSelective catalytic reduction
WMS-VMAWavelength modulation spectroscopy with varied modulation amplitude
a m Modulation depth
FInverse WMS-2f signal strength
σ Interference sensitivity
C Cost function
S 2 f Interference-free WMS-2f signal at the target transition line center
S 2 f ,   m a x Maximum possible interference-free WMS-2f signal
a m ,   o p t Optimal modulation depth
DVIDirect visual inspection
WTWavelet transform
DWTDiscrete wavelet transform
BFBLBlended-feature baseline fitting method
innth-order laser intensity modulation indices
φ n nth-order laser intensity–frequency modulation phase shifts
LIALock-in amplifier

References

  1. Hanson, R.K.; Falcone, P.K. Temperature measurement technique for high temperature gases using a tunable diode laser. Appl. Opt. 1978, 17, 2477–2480. [Google Scholar] [CrossRef] [PubMed]
  2. Ried, J.; Shewchun, J.; Garside, B.K.; Balik, E.A. High sensitivity pollution detection employing tunable diode lasers. Appl. Opt. 1978, 17, 300–307. [Google Scholar] [CrossRef] [PubMed]
  3. Druy, M.A. From laboratory technique to process gas sensor: The maturation of tunable diode laser absorption spectroscopy. Spectroscopy 2006, 21, 14–18. [Google Scholar]
  4. Lackner, M. Tunable diode laser absorption spectroscopy in the process industries: A review. Rev. Chem. Eng. 2007, 23, 65–147. [Google Scholar] [CrossRef]
  5. Available online: www.oxigraf.com (accessed on 3 July 2019).
  6. Wolfrum, J. Lasers in Combustion: From Basic Theory to Practical Devices; Elsevier: Amsterdam, The Netherlands, 1998; Volume 27, pp. 1–41. [Google Scholar]
  7. Allen, M.G. Diode laser absorption sensors for gas-dynamic and combustion flows. Meas. Sci. Technol. 1998, 9, 545–562. [Google Scholar] [CrossRef] [PubMed] [Green Version]
  8. Werle, P. A review of recent advances in semiconductor laser based gas monitors. Spectrochim. Acta Part A Mol. Biomol. Spectrosc. 1998, 54, 197–236. [Google Scholar] [CrossRef]
  9. Nasim, H.; Jamil, Y. Recent advancements in spectroscopy using tunable diode lasers. Laser Phys. Lett. 2013, 10, 043001. [Google Scholar] [CrossRef]
  10. Hanson, R.K. Applications of quantitative laser sensors to kinetics, propulsion and practical energy systems. Proc. Combust. Inst. 2011, 33, 1–40. [Google Scholar] [CrossRef]
  11. Bolshov, M.A.; Kuritsyn, Y.A.; Romanovskii, Y.V. Tunable diode laser spectroscopy as a technique for combustion diagnostics. Spectrochim. Acta Part B Atomic Spectrosc. 2015, 106, 45–66. [Google Scholar] [CrossRef]
  12. Goldenstein, C.S.; Spearrin, R.M.; Jeffries, J.B.; Hanson, R.K. Infrared laser-absorption sensing for combustion gases. Prog. Energy Combust. Sci. 2017, 60, 132–176. [Google Scholar] [CrossRef] [Green Version]
  13. Liu, C.; Xu, L. Laser absorption spectroscopy for combustion diagnosis in reactive flows: A review. Appl. Spectrosc. Rev. 2018, 54, 1–44. [Google Scholar] [CrossRef] [Green Version]
  14. Li, J.; Yu, B.; Zhao, W.; Chen, W. A review of signal enhancement and noise reduction techniques for tunable diode laser absorption spectroscopy. Appl. Spectrosc. Rev. 2014, 49, 666–691. [Google Scholar] [CrossRef]
  15. Zhang, T.; Kang, J.; Meng, D.; Wang, H.; Mu, Z.; Zhou, M.; Chen, C. Mathematical Methods and Algorithms for Improving Near-Infrared Tunable Diode-Laser Absorption Spectroscopy. Sensors 2018, 18, 4295. [Google Scholar] [CrossRef] [PubMed]
  16. Chao, X.; Jeffries, J.B.; Hanson R, K. In situ absorption sensor for NO in combustion gases with a 5.2 μm quantum-cascade laser. Proc. Combust. Inst. 2011, 33, 725–733. [Google Scholar] [CrossRef]
  17. Wagner, S.; Fisher, B.T.; Fleming, J.W.; Ebert, V. TDLAS-based in situ measurement of absolute acetylene concentrations in laminar 2D diffusion flames. Proc. Combust. Inst. 2009, 32, 839–846. [Google Scholar] [CrossRef]
  18. Wagner, S.; Klein, M.; Kathrotia, T.; Riedel, U.; Dreizler, A.; Ebert, V. In situ TDLAS measurement of absolute acetylene concentration profiles in a non-premixed laminar counter-flow flame. Appl. Phys. B 2012, 107, 585–589. [Google Scholar] [CrossRef] [Green Version]
  19. Nau, P.; Koppmann, J.; Lackner, A.; Kohse-Höinghaus, K.; Brockhinke, A. Quantum cascade laser-based MIR spectrometer for the determination of CO and CO2 concentrations and temperature in flames. Appl. Phys. B 2015, 118, 361–368. [Google Scholar] [CrossRef]
  20. Wagner, S.; Klein, M.; Kathrotia, T.; Riedel, U.; Kissel, T.; Dreizler, A.; Ebert, V. Absolute, spatially resolved, in situ CO profiles in atmospheric laminar counter-flow diffusion flames using 2.3 μm TDLAS. Appl. Phys. B 2012, 109, 533–540. [Google Scholar] [CrossRef]
  21. Wunderle, K.; Wagner, S.; Pasti, I.; Pieruschka, R.; Rascher, U.; Schurr, U.; Ebert, V. Distributed feedback diode laser spectrometer at 2.7 μm for sensitive, spatially resolved H2O vapor detection. Appl. Opt. 2009, 48, B172–B182. [Google Scholar] [CrossRef]
  22. Seidel, A.; Wagner, S.; Dreizler, A.; Ebert, V. Robust, spatially scanning, open-path TDLAS hygrometer using retro-reflective foils for fast tomographic 2-D water vapor concentration field measurements. Atmos. Meas. Tech. 2015, 8, 2061–2068. [Google Scholar] [CrossRef] [Green Version]
  23. Vanderover, J.; Wang, W.; Oehlschlaeger, M.A. A carbon monoxide and thermometry sensor based on mid-IR quantum-cascade laser wavelength-modulation absorption spectroscopy. Appl. Phys. B 2011, 103, 959–966. [Google Scholar] [CrossRef]
  24. Stranic, I.; Hanson, R.K. Laser absorption diagnostic for measuring acetylene concentrations in shock tubes. J. Quant. Spectrosc. Radiat. Transf. 2014, 142, 58–65. [Google Scholar] [CrossRef]
  25. Utsav, K.C.; Nasir, E.F.; Farooq, A. A mid-infrared absorption diagnostic for acetylene detection. Appl. Phys. B 2015, 120, 223–232. [Google Scholar]
  26. Spearrin, R.M.; Li, S.; Davidson, D.F.; Jeffries, J.B.; Hanson, R.K. High-temperature iso-butene absorption diagnostic for shock tube kinetics using a pulsed quantum cascade laser near 11.3 μm. Proc. Combust. Inst. 2015, 35, 3645–3651. [Google Scholar] [CrossRef]
  27. Sun, K.; Wang, S.; Sur, R.; Chao, X.; Jeffries, J.B.; Hanson, R.K. Sensitive and rapid laser diagnostic for shock tube kinetics studies using cavity-enhanced absorption spectroscopy. Opt. Express 2014, 22, 9291–9300. [Google Scholar] [CrossRef]
  28. Sun, K.; Wang, S.; Sur, R.; Chao, X.; Jeffries, J.B.; Hanson, R.K. Time-resolved in situ detection of CO in a shock tube using cavity-enhanced absorption spectroscopy with a quantum-cascade laser near 4.6 µm. Opt. Express 2014, 22, 24559–24565. [Google Scholar] [CrossRef]
  29. Ebert, V.; Fitzer, J.; Gerstenberg, I.; Pleban, K.U.; Pitz, H.; Wolfrum, J.; Jochem, M.; Martin, J. Simultaneous laser-based in situ detection of oxygen and water in a waste incinerator for active combustion control purposes. In Proceedings of the Symposium (International) on Combustion, Boulder, Colorado, USA, 2–7 August 1998. [Google Scholar]
  30. Teichert, H.; Fernholz, T.; Ebert, V. Simultaneous in situ measurement of CO, H2O, and gas temperatures in a full-sized coal-fired power plant by near-infrared diode lasers. Appl. Opt. 2003, 42, 2043–2051. [Google Scholar] [CrossRef] [PubMed]
  31. Ebert, V.; Teichert, H.; Strauch, P.; Kolb, T.; Seifert, H.; Wolfrum, J. Sensitive in situ detection of CO and O2 in a rotary kiln-based hazardous waste incinerator using 760 nm and new 2.3 μm diode lasers. Proc. Combust. Inst. 2005, 30, 1611–1618. [Google Scholar] [CrossRef]
  32. Sun, K.; Sur, R.; Jeffries, J.B.; Hanson, R.K.; Clark, T.; Anthony, J.; Northington, J. Application of wavelength-scanned wavelength-modulation spectroscopy H2O absorption measurements in an engineering-scale high-pressure coal gasifier. Appl. Phys. B 2014, 117, 411–421. [Google Scholar] [CrossRef]
  33. Nau, P.; Kutne, P.; Eckel, G.; Meier, W.; Hotz, C.; Fleck, S. Infrared absorption spectrometer for the determination of temperature and species profiles in an entrained flow gasifier. Appl. Opt. 2017, 56, 2982–2990. [Google Scholar] [CrossRef] [Green Version]
  34. Witzel, O.; Klein, A.; Wagner, S.; Meffert, C.; Schulz, C.; Ebert, V. High-speed tunable diode laser absorption spectroscopy for sampling-free in-cylinder water vapor concentration measurements in an optical IC engine. Appl. Phys. B 2012, 109, 521–532. [Google Scholar] [CrossRef]
  35. Witzel, O.; Klein, A.; Meffert, C.; Wagner, S.; Kaiser, S.; Schulz, C.; Ebert, V. VCSEL-based, high-speed, in situ TDLAS for in-cylinder water vapor measurements in IC engines. Opt. Express 2013, 21, 19951–19965. [Google Scholar] [CrossRef] [PubMed]
  36. Witzel, O.; Klein, A.; Meffert, C.; Schulz, C.; Kaiser, S.A.; Ebert, V. Calibration-free, high-speed, in-cylinder laser absorption sensor for cycle-resolved, absolute H2O measurements in a production IC engine. Proc. Combust. Inst. 2015, 35, 3653–3661. [Google Scholar] [CrossRef]
  37. Jatana, G.S.; Magee, M.; Fain, D.; Naik, S.V.; Shaver, G.M.; & Lucht, R.P. Simultaneous high-speed gas property measurements at the exhaust gas recirculation cooler exit and at the turbocharger inlet of a multicylinder diesel engine using diode-laser-absorption spectroscopy. Appl. Opt. 2015, 54, 1220–1231. [Google Scholar] [CrossRef] [PubMed]
  38. Spearrin, R.M.; Goldenstein, C.S.; Schultz, I.A.; Jeffries, J.B.; Hanson, R.K. Simultaneous sensing of temperature, CO, and CO2 in a scramjet combustor using quantum cascade laser absorption spectroscopy. Appl. Phys. B 2014, 117, 689–698. [Google Scholar] [CrossRef]
  39. Schultz, I.A.; Goldenstein, C.S.; Strand, C.L.; Jeffries, J.B.; Hanson, R.K. Hypersonic scramjet testing via TDLAS measurements of temperature and column density in a reflected shock tunnel. In Proceedings of the 52nd Aerospace Sciences Meeting, National Harbor, MD, USA, 13–17 January 2014. [Google Scholar]
  40. Caswell, A.W.; Roy, S.; An, X.; Sanders, S.T.; Schauer, F.R.; Gord, J.R. Measurements of multiple gas parameters in a pulsed-detonation combustor using time-division-multiplexed Fourier-domain mode-locked lasers. Appl. Opt. 2013, 52, 2893–2904. [Google Scholar] [CrossRef] [PubMed]
  41. Caswell, A.; Roy, S.; An, X.; Sanders, S.; Hoke, J.; Schauer, F.; Gord, J. High-bandwidth H2O absorption sensor for measuring pressure, enthalpy, and mass flux in a pulsed-detonation combustor. In Proceedings of the 50th AIAA Aerospace Sciences Meeting including the New Horizons Forum and Aerospace Exposition, Nashville, TN, USA, 9–12 January 2012. [Google Scholar]
  42. Goldenstein, C.S.; Spearrin, R.M.; Jeffries, J.B.; Hanson, R.K. Infrared laser absorption sensors for multiple performance parameters in a detonation combustor. Proc. Combust. Inst. 2015, 35, 3739–3747. [Google Scholar] [CrossRef]
  43. Goldenstein, C.S.; Schultz, I.A.; Spearrin, R.M.; Jeffries, J.B.; Hanson, R.K. Diode Laser Measurements of Temperature and H2O for Monitoring Pulse Detonation Combustor Performance. In Proceedings of the ICDERS Conference, Taipei, Taiwan, 28 July–2 August 2013. [Google Scholar]
  44. Spearrin, R.M.; Goldenstein, C.S.; Jeffries, J.B.; Hanson, R.K. Fiber-coupled 2.7 µm laser absorption sensor for CO2 in harsh combustion environments. Meas. Sci. Technol. 2013, 24, 055107. [Google Scholar] [CrossRef]
  45. Spearrin, R.M.; Goldenstein, C.S.; Jeffries, J.B.; Hanson, R.K. Quantum cascade laser absorption sensor for carbon monoxide in high-pressure gases using wavelength modulation spectroscopy. Appl. Opt. 2014, 53, 1938–1946. [Google Scholar] [CrossRef]
  46. Goldenstein, C.S.; Almodóvar, C.A.; Jeffries, J.B.; Hanson, R.K.; Brophy, C.M. High-bandwidth scanned-wavelength-modulation spectroscopy sensors for temperature and H2O in a rotating detonation engine. Meas. Sci. Technol. 2014, 25, 105104. [Google Scholar] [CrossRef]
  47. Gordon, I.E.; Rothman, L.S.; Hill, C.; Kochanov, R.V.; Tan, Y.; Bernath, P.F.; Birk, M.; Boudon, V.; Campargue, A.; Chance, K.V.; et al. The HITRAN2016 molecular spectroscopic database. J. Quant. Spectrosc. Radiat. Transf. 2017, 203, 3–69. [Google Scholar] [CrossRef]
  48. Chao, X. Development of Laser Absorption Sensors for Combustion Gases; Stanford University: Stanford, CA, USA, 2012. [Google Scholar]
  49. Sanders, S.T.; Wang, J.; Jeffries, J.B.; Hanson, R.K. Diode-laser absorption sensor for line-of-sight gas temperature distributions. Appl. Opt. 2001, 40, 4404–4415. [Google Scholar] [CrossRef] [PubMed]
  50. Liu, X.; Jeffries, J.B.; Hanson R, K. Measurements of spectral parameters of water-vapour transitions near 1388 and 1345 nm for accurate simulation of high-pressure absorption spectra. Meas. Sci. Technol. 2007, 18, 1185. [Google Scholar] [CrossRef]
  51. Li, H.; Farooq, A.; Jeffries, J.B.; Hanson, R.K. Diode laser measurements of temperature-dependent collisional-narrowing and broadening parameters of Ar-perturbed H2O transitions at 1391.7 and 1397.8 nm. J. Quant. Spectrosc. Radiat. Transf. 2008, 109, 132–143. [Google Scholar] [CrossRef]
  52. Skrotzki, J.; Habig, J.C.; Ebert, V. Integrative fitting of absorption line profiles with high accuracy, robustness, and speed. Appl. Phys. B 2014, 116, 393–406. [Google Scholar] [CrossRef]
  53. Abrarov, S.M.; Quine, B.M.; Jagpal R, K. A simple interpolating algorithm for the rapid and accurate calculation of the Voigt function. J. Quant. Spectrosc. Radiat. Transf. 2009, 110, 376–383. [Google Scholar] [CrossRef]
  54. Pagnini, G.; Mainardi, F. Evolution equations for the probabilistic generalization of the Voigt profile function. J. Comput. Appl. Math. 2010, 233, 1590–1595. [Google Scholar] [CrossRef] [Green Version]
  55. Rieker, G.B.; Jeffries, J.B.; Hanson R, K. Calibration-free wavelength-modulation spectroscopy for measurements of gas temperature and concentration in harsh environments. Appl. Opt. 2009, 48, 5546–5560. [Google Scholar] [CrossRef]
  56. Liu, J.T.C. Near-Infrared Diode Laser Absorption Diagnostics for Temperature and Species in Engines; Stanford University: Stanford, CA, USA, 2004. [Google Scholar]
  57. Zhou, X. Diode Laser Absorption Sensors for Combustion Control; Stanford University: Stanford, CA, USA, 2005. [Google Scholar]
  58. Sun, K.; Chao, X.; Sur, R.; Goldenstein, C.S.; Jeffries, J.B.; Hanson, R.K. Analysis of calibration-free wavelength-scanned wavelength modulation spectroscopy for practical gas sensing using tunable diode lasers. Meas. Sci. Technol. 2013, 24, 125203. [Google Scholar] [CrossRef]
  59. Goldenstein, C.S.; Strand, C.L.; Schultz, I.A.; Sun, K.; Jeffries, J.B.; Hanson, R.K. Fitting of calibration-free scanned-wavelength-modulation spectroscopy spectra for determination of gas properties and absorption lineshapes. Appl. Opt. 2014, 53, 356–367. [Google Scholar] [CrossRef]
  60. Stewart, G.; Johnstone, W.; Bain, J.R.P.; Ruxton, K.; Duffin, K. Recovery of absolute gas absorption line shapes using tunable diode laser spectroscopy with wavelength modulation—Part I: Theoretical analysis. J. Lightwave Technol. 2011, 29, 811–821. [Google Scholar]
  61. Bain, J.R.P.; Johnstone, W.; Ruxton, K.; Stewart, G.; Lengden, M.; Duffin, K. Recovery of absolute gas absorption line shapes using tunable diode laser spectroscopy with wavelength modulation—Part 2: Experimental investigation. J. Lightwave Technol. 2011, 29, 987–996. [Google Scholar] [CrossRef]
  62. Peng, Z.; Ding, Y.; Che, L.; Yang, Q. Odd harmonics with wavelength modulation spectroscopy for recovering gas absorbance shape. Opt. Express 2012, 20, 11976–11985. [Google Scholar]
  63. Klein, A.; Witzel, O.; Ebert, V. Rapid, time-division multiplexed, direct absorption-and wavelength modulation-spectroscopy. Sensors 2014, 14, 21497–21513. [Google Scholar] [CrossRef] [PubMed]
  64. Liu, X.; Jeffries, J.B.; Hanson R, K. Measurement of non-uniform temperature distributions using line-of-sight absorption spectroscopy. AIAA J. 2007, 45, 411–419. [Google Scholar] [CrossRef]
  65. Cai, W.; Kaminski C, F. Tomographic absorption spectroscopy for the study of gas dynamics and reactive flows. Prog. Energy Combust. Sci. 2017, 59, 1–31. [Google Scholar] [CrossRef]
  66. Rieker, G.B.; Giorgetta, F.R.; Swann, W.C.; Kofler, J.; Zolot, A.M.; Sinclair, L.C.; Baumann, E.; Cromer, C.; Petron, G.; Tans, P.P.; et al. Frequency-comb-based remote sensing of greenhouse gases over kilometer air paths. Optica 2014, 1, 290–298. [Google Scholar] [CrossRef]
  67. Malarich, N.A.; Rieker G, B. Resolving gas temperature distributions with single-beam dual-comb absorption spectroscopy. In Proceedings of the Conference on Lasers and Electro-Optics (CLEO), San Jose, CA, USA, 14–19 May 2017. [Google Scholar]
  68. Ma, L.; Cai, W.; Caswell, A.W.; Kraetschmer, T.; Sanders, S.T.; Roy, S.; Gord, J.R. Tomographic imaging of temperature and chemical species based on hyperspectral absorption spectroscopy. Opt. Express 2009, 17, 8602–8613. [Google Scholar] [CrossRef] [PubMed]
  69. Ma, L.; Li, X.; Sanders, S.T.; Caswell, A.W.; Roy, S.; Plemmons, D.H.; Gord, J.R. 50-kHz-rate 2D imaging of temperature and H2O concentration at the exhaust plane of a J85 engine using hyperspectral tomography. Opt. Express 2013, 21, 1152–1162. [Google Scholar] [CrossRef] [PubMed]
  70. Mohammad, I.L.; Anderson, G.T.; Chen, Y. Noise estimation technique to reduce the effects of 1/f noise in Open Path Tunable Diode Laser Absorption Spectrometry (OP-TDLAS). In Proceedings of the Sensors for Extreme Harsh Environments. International Society for Optics and Photonics, Baltimore, MD, USA, 5–9 May 2014. [Google Scholar]
  71. Werle, P.W.; Mazzinghi, P.; D’Amato, F.; De Rosa, M.; Maurer, K.; Slemr, F. Signal processing and calibration procedures for in situ diode-laser absorption spectroscopy. Spectrochim. Acta Part A Mol. Biomol. Spectrosc. 2004, 60, 1685–1705. [Google Scholar] [CrossRef]
  72. Lins, B.; Zinn, P.; Engelbrecht, R.; Schmauss, B. Simulation-based comparison of noise effects in wavelength modulation spectroscopy and direct absorption TDLAS. Appl. Phys. B 2010, 100, 367–376. [Google Scholar] [CrossRef]
  73. Zhu, J.; Cowie, A.; Kosterev, A.; Wyatt, D. Advantages of Using Direct Absorption Method for TDLAS Measurement. Available online: https://zh.scribd.com/document/234114018/Paper-Advantages-of-Using-Direct-Absorption-Method-for-TDLAS-Measurement-r1 (accessed on 3 July 2019).
  74. Hodgkinson, J.; Tatam, R.P. Optical gas sensing: A review. Meas. Sci. Technol. 2012, 24, 012004. [Google Scholar] [CrossRef]
  75. Hodgkinson, J.; Masiyano, D.; Tatam, R.P. Gas cells for tunable diode laser absorption spectroscopy employing optical diffusers. Part 1: Single and dual pass cells. Appl. Phys. B 2010, 100, 291–302. [Google Scholar] [CrossRef]
  76. Ehlers, P.; Johansson, A.C.; Silander, I.; Foltynowicz, A.; Axner, O. Use of etalon-immune distances to reduce the influence of background signals in frequency-modulation spectroscopy and noise-immune cavity-enhanced optical heterodyne molecular spectroscopy. JOSA B 2014, 31, 2938–2945. [Google Scholar] [CrossRef]
  77. Bomse, D.S.; Stanton, A.C.; Silver, J.A. Frequency modulation and wavelength modulation spectroscopies: Comparison of experimental methods using a lead-salt diode laser. Appl. Opt. 1992, 31, 718–731. [Google Scholar] [CrossRef] [PubMed]
  78. Chou, S.I.; Baer, D.S.; Hanson, R.K. Diode laser absorption measurements of CH3Cl and CH4 near 1.65 µm. Appl. Opt. 1997, 36, 3288–3293. [Google Scholar] [CrossRef] [PubMed]
  79. Webster, C.R. Brewster-plate spoiler: A novel method for reducing the amplitude of interference fringes that limit tunable-laser absorption sensitivities. JOSA B 1985, 2, 1464–1470. [Google Scholar] [CrossRef]
  80. Masiyano, D.; Hodgkinson, J.; Schilt, S.; Tatam, R.P. Self-mixing interference effects in tunable diode laser absorption spectroscopy. Appl. Phys. B 2009, 96, 863–874. [Google Scholar] [CrossRef] [Green Version]
  81. Persson, L.; Andersson, F.; Andersson, M.; Svanberg, S. Approach to optical interference fringes reduction in diode laser absorption spectroscopy. Appl. Phys. B 2007, 87, 523–530. [Google Scholar] [CrossRef]
  82. Kluczynski, P.; Lindberg, Å.M.; Axner, O. Characterization of background signals in wavelength-modulation spectrometry in terms of a Fourier based theoretical formalism. Appl. Opt. 2001, 40, 770–782. [Google Scholar] [CrossRef]
  83. Xiong, B.; Du, Z.; Li, J. Modulation index optimization for optical fringe suppression in wavelength modulation spectroscopy. Rev. Sci. Instrum. 2015, 86, 113104. [Google Scholar] [CrossRef] [PubMed]
  84. Sun, K.; Chao, X.; Sur, R.; Jeffries, J.B.; Hanson, R.K. Wavelength modulation diode laser absorption spectroscopy for high-pressure gas sensing. Appl. Phys. B 2013, 110, 497–508. [Google Scholar] [CrossRef]
  85. Xia, H.; Dong, F.; Zhang, Z.; Tu, G.; Pang, T.; Wu, B.; Wang, Y. Signal analytical processing based on wavelet transform for tunable diode laser absorption spectroscopy. In Proceedings of the Advanced Sensor Systems and Applications IV. International Society for Optics and Photonics, Beijing, China, 2 November 2010. [Google Scholar]
  86. Li, C.; Guo, X.; Ji, W.; Wei, J.; Qiu, X.; Ma, W. on fringe removal of tunable diode laser multi-pass spectroscopy by wavelet transforms. Opt. Quant. Electron. 2018, 50, 275. [Google Scholar] [CrossRef]
  87. Niu, M.; Han, P.; Song, L.; Hao, D.; Zhang, J.; Ma, L. Comparison and application of wavelet transform and Kalman filtering for denoising in δ 13 CO2 measurement by tunable diode laser absorption spectroscopy at 2.008 µm. Opt. Express 2017, 25, A896–A905. [Google Scholar] [CrossRef] [PubMed]
  88. Tian, G.; Li, J. Tunable diode laser spectrometry signal de-noising using discrete wavelet transform for molecular spectroscopy study. Opt. Appl. 2013, 43. [Google Scholar] [CrossRef]
  89. Yang, R.; Bi, Y.; Zhou, Q.; Dong, X.; Lv, T. A background reduction method based on empirical mode decomposition for tunable diode laser absorption spectroscopy system. Optik 2018, 158, 416–423. [Google Scholar] [CrossRef]
  90. Uehara, K. Dependence of harmonic signals on sample-gas parameters in wavelength-modulation spectroscopy for precise absorption measurements. Appl. Phys. B Lasers Opt. 1998, 67, 517–523. [Google Scholar] [CrossRef]
  91. Kluczynski, P.; Axner, O. Theoretical description based on Fourier analysis of wavelength-modulation spectrometry in terms of analytical and background signals. Appl. Opt. 1999, 38, 5803–5815. [Google Scholar] [CrossRef]
  92. Neethu, S.; Verma, R.; Kamble, S.S.; Radhakrishnan, J.K.; Krishnapur, P.P.; Padaki, V.C. Validation of wavelength modulation spectroscopy techniques for oxygen concentration measurement. Sens. Actuators B Chem. 2014, 192, 70–76. [Google Scholar] [CrossRef]
  93. Fried, A.; Henry, B.; Drummond, J.R. Tunable diode laser ratio measurements of atmospheric constituents by employing dual fitting analysis and jump scanning. Appl. Opt. 1993, 32, 821–827. [Google Scholar] [CrossRef]
  94. Chen, J.; Hangauer, A.; Strzoda, R.; Amann, M.C. Tunable diode laser spectroscopy with optimum wavelength scanning. Appl. Phys. B 2010, 100, 331–339. [Google Scholar] [CrossRef] [Green Version]
  95. Du, Z.; Yan, Y.; Li, J.; Zhang, S.; Yang, X.; Xiao, Y. In situ, multiparameter optical sensor for monitoring the selective catalytic reduction process of diesel engines. Sens. Actuators B Chem. 2018, 267, 255–264. [Google Scholar] [CrossRef]
  96. Peng, W.Y.; Sur, R.; Strand, C.L.; Spearrin, R.M.; Jeffries, J.B.; Hanson, R.K. High-sensitivity in situ QCLAS-based ammonia concentration sensor for high-temperature applications. Appl. Phys. B 2016, 122, 188. [Google Scholar] [CrossRef]
  97. Sur, R.; Peng, W.Y.; Strand, C.; Spearrin, R.M.; Jeffries, J.B.; Hanson, R.K.; Bekal, A.; Halder, P.; Poonacha, S.P.; Vartak, S.; et al. Mid-infrared laser absorption spectroscopy of NO2 at elevated temperatures. J. Quant. Spectrosc. Radiat. Transf. 2017, 187, 364–374. [Google Scholar] [CrossRef]
  98. Li, J.; Yu, B.; Fischer, H. Wavelet transform based on the optimal wavelet pairs for tunable diode laser absorption spectroscopy signal processing. Appl. Spectrosc. 2015, 69, 496–506. [Google Scholar] [CrossRef] [PubMed]
  99. Weisberger, J.M.; Richter, J.P.; Parker, R.A.; DesJardin, P.E. Direct absorption spectroscopy baseline fitting for blended absorption features. Appl. Opt. 2018, 57, 9086–9095. [Google Scholar] [CrossRef]
  100. Chen, J.; Hangauer, A.; Strzoda, R.; Amann, M.C. VCSEL-based calibration-free carbon monoxide sensor at 2.3 μm with in-line reference cell. Appl. Phys. B 2011, 102, 381–389. [Google Scholar] [CrossRef]
  101. Qu, Z.; Ghorbani, R.; Valiev, D.; Schmidt, F.M. Calibration-free scanned wavelength modulation spectroscopy–application to H2O and temperature sensing in flames. Opt. Express 2015, 23, 16492–16499. [Google Scholar] [CrossRef]
  102. Zhao, G.; Tan, W.; Hou, J.; Qiu, X.; Ma, W.; Li, Z.; Axner, O. Calibration-free wavelength-modulation spectroscopy based on a swiftly determined wavelength-modulation frequency response function of a DFB laser. Opt. Express 2016, 24, 1723–1733. [Google Scholar] [CrossRef]
  103. Upadhyay, A.; Lengden, M.; Wilson, D.; Humphries, G.S.; Crayford, A.P.; Pugh, D.G.; Johnstone, W. A new RAM normalized 1f-WMS technique for the measurement of gas parameters in harsh environments and a comparison with 2f/1f. IEEE Photonics J. 2018, 10, 1–11. [Google Scholar] [CrossRef]
  104. Upadhyay, A.; Wilson, D.; Lengden, M.; Chakraborty, A.L.; Stewart, G.; Johnstone, W. Demonstration of Calibration-Free WMS Measurement of Gas Parameters with in-Situ Real-Time Characterization of Laser Parameters Using CW-DFB-QCL, VCSEL and DFB Lasers. 2016. Available online: https://core.ac.uk/download/pdf/77036446.pdf (accessed on 3 July 2019).
  105. Upadhyay, A.; Wilson, D.; Lengden, M.; Chakraborty, A.L.; Stewart, G.; Johnstone, W. Calibration-free WMS using a cw-DFB-QCL, a VCSEL, and an edge-emitting DFB laser with in-situ real-time laser parameter characterization. IEEE Photonics J. 2017, 9, 1–17. [Google Scholar] [CrossRef]
  106. Upadhyay, A.; Chakraborty, A.L. Calibration-free 2f WMS with in situ real-time laser characterization and 2f RAM nulling. Opt. Lett. 2015, 40, 4086–4089. [Google Scholar] [CrossRef] [PubMed]
  107. Zhai, B.; He, Q.; Huang, J.; Zheng, C.; Wang, Y. Design and realization of harmonic signal orthogonal lock-in amplifier used in infrared gas detection. Acta Photonica Sin. 2014, 43, 1125001. [Google Scholar] [CrossRef]
  108. Jiang, C.; Liu, Y.; Yu, B.; Yin, S.; Chen, P. TDLAS-WMS second harmonic detection based on spectral analysis. Rev. Sci. Instrum. 2018, 89, 083106. [Google Scholar] [CrossRef] [PubMed]
  109. Du, Y.; Peng, Z.; Ding, Y. Wavelength modulation spectroscopy for recovering absolute absorbance. Opt. Express 2018, 26, 9263–9272. [Google Scholar] [CrossRef] [PubMed]
  110. Duan, H.; Gautam, A.; Shaw, B.D.; Cheng, H. Harmonic wavelet analysis of modulated tunable diode laser absorption spectroscopy signals. Appl. Opt. 2009, 48, 401–407. [Google Scholar] [CrossRef] [PubMed]
Figure 1. Schematic of different noise processes on an Allan deviation plot.
Applsci 09 02723 g001
Figure 2. Representative detection limits and measurement bandwidths of laser absorption sensors in various combustion-related systems.
Applsci 09 02723 g002
Figure 3. Absorption linestrengths for O2, CO, CO2, CH4, NO, NO2, NH3, and H2O at (a) 650 K, (b) 1800 K. Transitions with line strengths less than 1 × 10⁻²³ cm/molecule are not shown. All data taken from HITRAN2016 [47].
Applsci 09 02723 g003
Figure 4. Flowchart of the 2f-WMS method.
Applsci 09 02723 g004
Figure 5. Flow chart of a calibration-free WMS scheme with scanned-wavelength laser characterization.
Applsci 09 02723 g005
Figure 6. Flow chart of the recovery process of the absorbance profile based on higher-order harmonic signals.
Applsci 09 02723 g006
Figure 7. Schematic of the on-the-fly WMS calibration using time-multiplexed direct tunable diode laser absorption spectroscopy (dTDLAS) and WMS. Figure adapted from [63].
Applsci 09 02723 g007
Figure 8. Schematic illustration of the wavelength scanning function: conventional (linear) (a) and optimized (nonlinear) (d). The resulting spectrum waveform is shown for direct spectroscopy in (b) for linear scanning and (e) for nonlinear scanning as well as for WMS (second harmonic detection) in (c,f). Figure adapted from [94].
Applsci 09 02723 g008
Figure 9. Simulated WMS-2f signal with (a) modulation amplitude 0.065   cm 1 and 0.24   cm 1 , respectively; (b) wavelength modulation spectroscopy with varied modulation amplitude (WMS-VMA). Figure adapted from [95].
Applsci 09 02723 g009
Figure 10. Inverse WMS-2f signal strength (F, blue line), NH 3 interference sensitivity ( σ , red line), and cost function ( C , red line) vs modulation depth for a 3 ppm NH 3 mixture in CH 4 air   ϕ = 0.6 combustion exhaust at T = 600   K ,   P = 1   atm . The optimal modulation depth a m ,   o p t is shown in the black/dashed line. Figure adapted from [96].
Applsci 09 02723 g010
Figure 11. Nonlinear baseline correction and denoising using discrete wavelet transform (DWT). (a) Noisy signal with apparent baseline drift; (b) baseline drift-removed signal from (a) and noise-free signal; (c) raw noise and wavelet-removed noise; (d) denoised signal from (a); (e) baseline drift-removed signal from (d) and noise-free signal; (f) raw baseline and wavelet-removed baselines with different iterations. Figure adapted from [98].
Applsci 09 02723 g011
Figure 12. Flow chart for DAS baseline fitting data analysis. Figure adapted from [99].
Applsci 09 02723 g012
Figure 13. The 1650 nm DFB laser was modulated at m = 2.2, and the transmitted light through a 1% CH4 sample at 1 bar pressure was demodulated by a lock-in amplifier (LIA) to obtain (a) 1f X-component along I H1, (b) 1f Y-component orthogonal to I H1, (c) magnitude of 1f Signal, (d) 2f X-component along I H2, (e) 2f Y-component orthogonal to I H2, (f) magnitude of 2f Signal, (g) 3f X-component along I H3, (h) 3f Y-component orthogonal to I H3, and (i) magnitude of 3f Signal. Figure adapted from [104].
Applsci 09 02723 g013
Figure 14. Comparison of results from the wavelet analyses with (a) H1, (b) H2, and (c) H3 coefficients obtained with a Voigt absorption profile. Figure adapted from [110].
Applsci 09 02723 g014
Table 1. Comparison of fitting algorithms in direct absorption spectroscopy (DAS) and wavelength modulation spectroscopy (WMS) techniques. LM: Levenberg–Marquardt, AI: advanced integrative, SNR: signal-to-noise-ratio.
TechniqueParameter InitializationParameter PredeterminedFeature/Limitation
DAS LM algorithm ν 0 , T ,   X noEasy to fit multiple absorption lines
DAS AI algorithmno Δ ν Complicated to fit multiple absorption lines, a factor of 3-4 faster than the LM algorithm
2f-WMS T ,   X P
HITRAN/HITEMP database [47]
Calibrated on the basis of database, hard to calculate absolute T
Calibration-free WMS-2f/1f with fixed-wavelength laser characterization ν 0 , T ,   X i 1 ,   i 2 ,   φ 1 , φ 2
HITRAN/HITEMP database
Wavelength-dependent laser characteristics may lead to measurement errors
Calibration-free WMS-2f/1f with scanned-wavelength laser characterization ν 0 , T ,   X ν ( t ) ,   I M 0 ( t )
HITRAN/HITEMP database
Non-linear laser intensity variation along measurement beam path difficult to quantify
Recovery of DAS lineshapes ν 0 , T ,   X φ 1 , X n f , Y n f Higher-order harmonics come with low SNR
DAS-calibrated WMSnoP, TDirect, on-the-fly calibration,
increased precision and SNR for trace gas detection
Table 2. Comparison of laser and detector noises.
Type of noiseCauseFeatureFrequency Range
Laser excess noiseIntensity fluctuationFrequency dependent1–10 kHz
Detector thermal noiseThermal agitation of the charge carriersFrequency independent0.1–140 kHz
Detector shot noiseDiscrete nature of electric chargeFrequency independent0.1–140 kHz
Detector excess noiseIntensity fluctuationFrequency dependent1–10 kHz
Table 3. Comparison of strategies to minimize interference fringe noise. AR: anti-reflective, EMD: empirical mode decomposition.
StrategySolutionsFeature
Optical designWedged or AR-coated windows;Difficult to minimize etalon in complex optical systems
Optical isolators;
Etalon immune distance
Mechanical modulationDithering or rotating of mirrors;Increased system complexity;
Limited detection bandwidth
Brewster-plate spoiler
Balanced detection schemesSplit laser beam into the sample beam and reference beamDifficult to replicate all optical effects in reference path
WMSModulation index optimization;SNR sacrificed
Use of higher harmonics
Digital filtering techniqueWavelet transform;
Kalman filtering;
EMD
Increasing computation cost;
Parameters need to be set carefully
Table 4. Effects of different control parameters on 2f signals. PHR: peak height ratio.
Scanning AmplitudeScanning FrequencyModulation DepthModulation FrequencyTime Constant
Maximum 2f- 13↑↓↑↓
SNR-↑ or ↓↑↓-
Peak width2--
PHR-↑ or -- 4-
1 no evident correlation, 2 increase, 3 decrease, 4 unchanged.

