Featured Application
Near-infrared ppm-level C2H2 detection with time division multiplexing differential modulation, suitable for the precision improvement of other near-infrared single optical path gas detection systems.
Abstract
A time division multiplexing differential modulation technique is proposed to address the interference problem caused by the fluctuation of laser light intensity in the single optical path detection system. Simultaneously, a multi-reflection chamber is designed and manufactured to further improve the system’s precision with an optical path length of 80 m. A near-infrared C2H2 detection system was developed. The absorption peak of the acetylene (C2H2) molecule near 1520 nm was selected as the absorption line. A laser driver is developed, and a lock-in amplifier is used to extract the second harmonic (2f) signal. A good linear relationship existed between C2H2 concentration and the 2f signal, and the correlation coefficient was 0.9997. In the detection range of 10–100 ppmv, the minimum detection limit was 0.3 ppmv, and the precision was 2%. At 50 ppmv, C2H2 and continuous detection for 10 h, the data average was 50.03 ppmv, and the fluctuation was less than ±1.2%. The Allan variance method was adopted to evaluate the long-term characteristic of the system. At 1 s of integration time, the Allan deviation was 0.3 ppmv. When the integration time reached 362 s, the Allan deviation was 0.0018 ppmv, which indicates the good stability of the detection system.
1. Introduction
Acetylene (C2H2) is one of the most basic raw materials for industrial production. C2H2 is burned at high temperature to weld metals. C2H2 is easily decomposed, burned, and exploded, because its chemical character is very active. The explosion limit of C2H2 in air is between 2.3% and 72.3%. C2H2 has a lower explosion limit and a wider explosion range than other flammable and explosive gases. Therefore, highly sensitive and real-time detection of C2H2 concentration is especially necessary [1,2,3,4].
In recent years, tunable diode laser absorption spectrometry (TDLAS) has been widely used as a real-time and efficient online detection technique [5,6,7,8,9]. C2H2 detection is mostly performed in the near-infrared band because the laser process in the near-infrared band is mature. The reported TDLAS-based C2H2 detection system uses a wavelength modulation spectroscopy (WMS) technique to improve the signal-to-noise ratio (SNR) [10,11,12]. In 2018, Ming D et al. [13] developed a dual-optical C2H2 detection system near 1533 nm by using WMS, with minimum detection limit (MDL) of 7.9 ppmv at 6 m and 4 ppmv at 20 m. In the actual detection, to further eliminate the influence of the fluctuation of laser light intensity, the dual optical path differential method is used for detection [14,15]. For example, in 2018, the C2H2 detection system near 1534 nm, which was developed by He Q X et al. [15], has low MDL of 3.97 ppmv at 0.3 m and a precision of 3%. However, this dual optical path differential structure reduces the final detected optical power and increases system complexity. This study proposes a time division multiplexing differential modulation technique without changing the overall structure of the single optical path detection system. The DFB laser is driven and modulated by superimposing a high-frequency sine signal by a stair-stepping segmented low-frequency signal. Thus, it can eliminate the background noise caused by the fluctuation of laser light intensity, which further improves the detection precision. In addition, this study proposes the design and manufacture of a multi-reflection chamber that increases the absorption optical path and further improves the detection precision. The precision of the single-optical TDLAS gas detection system can be greatly improved by adopting a time division multiplexing differential modulation technique and the multi-reflection chamber method. It can better satisfy the high-precision detection requirements for C2H2 gas in practical applications without increasing the complexity of the system.
A near-infrared DFB laser is used to detect concentrations of C2H2 based on the TDLAS technique. The emitting peak wavelength of the laser is 1520 nm. A laser driver, which uses a time division multiplexing differential modulation technique to eliminate interference caused by the fluctuation of laser light intensity in the single optical path detection system, is developed. A laser temperature controller based on ARM was developed with a precision of 0.001 °C. The 2f signal’s amplitude (SA) is extracted by the lock-in amplifier, and the experimental data can be processed by the algorithm to obtain the detection result. Gas detection experiments are carried out to study the response performance of the system. The system measures different concentrations of C2H2 with good linearity, and the MDL is 0.3 ppmv. In addition, the detection precision and stability of the system were analyzed with a precision of 2% and ranged from 10 to 100 ppmv, and the detection data fluctuation was less than ±1.2%. Conclusions were drawn based on the experimental results. The stair-stepping segmented a low-frequency signal that can be used to achieve high-precision C2H2 detection in a single optical path system, and there is no requirement for phase consistency compared with the 2f/1f normalization [16,17].
2. TDLAS-WMS Detection Theory
2.1. Absorption Line of C2H2
The transition between the ro-vibrational energy levels of a molecule need to absorb the energy of the infrared region, and it will form an infrared spectrum [18]. From the point of view of quantum mechanics, the transition between molecular energy levels satisfies the quantization conditions. Since the energy of the ro-vibrational level is discontinuous, when a level transition occurs, a specific molecule will only absorb a specific wavelength infrared light, which ensures the selectivity of the infrared absorption spectrum gas detection technique. The absorption peak of the C2H2 molecule in the mid-infrared band is evidently stronger than in the near-infrared band [19]. However, the process of the near-infrared laser is mature, widely used, and relatively inexpensive. In the actual detection process, the optical path coupling of the mid-infrared laser is more difficult. Therefore, this study selects the characteristic absorption line at the near-infrared band of the C2H2 molecule to detect its concentration.
The absorption spectrum of the C2H2 molecule in the range of 1520.05 to 1520.15 nm is shown in Figure 1, according to the high-resolution transmission molecular absorption database 2016 (HITRAN 2016). Evidently, the line intensity of the C2H2 molecule is the largest near 1520 nm at 10−20. The line intensity of common gas molecules, such as CO2, H2O, and CH4, is less than 10−23 at 1520 nm, which is far less than that of the C2H2 molecule. The interference generated can be ignored in the actual detection. Therefore, these disturbances can be ignored in the actual detection. The absorption line at 1520 nm of the C2H2 molecule is used comprehensively. The line intensity is set to 1.340 × 10⁻²⁰ to obtain accurate detection results and avoid interference of other gas molecules as much as possible, considering these factors.
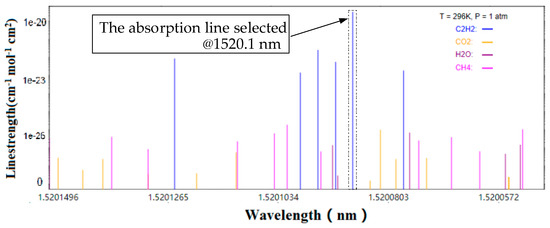
Figure 1.
C2H2 (blue) absorption line in the range of 1520.05–1520.15 nm. The absorption line strength of CO2, H2O, and CH4 is much smaller than that of C2H2.
2.2. Direct Absorption Spectroscopy
The Beer–Lambert law indicates that, when a beam of infrared light is transmitted through the C2H2 molecule, a specific wavelength of light is absorbed by the C2H2 molecule. The selective absorption of C2H2 molecules causes the attenuation of light energy, and the energy of light attenuation is proportional to the number of molecules of C2H2 [20,21]. The light intensity after absorption is obtained as follows.
where is the initial emitting light intensity, is the optical path length, is the measured gas concentration, and is the absorption line shape function. At a standard atmospheric pressure, we use the Lorentz line shape function to describe the gas absorption coefficient, as follows.
where is the absorption coefficient at the center of the gas absorption line, is the center frequency of the gas absorption peak, and is the half-width at half-peak of the absorption line.
2.3. Single Optical Path Time Division Multiplexing Differential Modulation
We can tune the laser output wavelength by modulating the drive current based on WMS [22]. A stair-stepping segmented low-frequency signal (10 Hz) was used to modulate the laser’s injection current to further eliminate the fluctuation of laser light intensity on the single-light path detection system. As shown in Figure 2, the stair-stepping segmented low-frequency signal (10 Hz) is divided into L, M, and H segments. The M segment is a sawtooth signal. This segment is used for C2H2 concentration detection. The laser injection current is modulated by superimposing a high-frequency sine signal (5 kHz). Thus, the laser’s output wavelength sweeps the absorption peak of C2H2. The currents of L and H segments are constant, and the laser’s output wavelength driven by the currents is in the non-absorption region of the C2H2 molecule. The laser’s mean value distribution can be considered in the short single period detection time of 100 ms at 10 Hz because its intensity fluctuation is mainly derived from its own background noise. Therefore, the average light intensity corresponding to the L and H segment waveforms is obtained, and the data processing is performed as the inversion basis of the light intensity of the M segment signal, which further eliminates the interference caused by the laser light intensity fluctuation in the single optical path detection system.
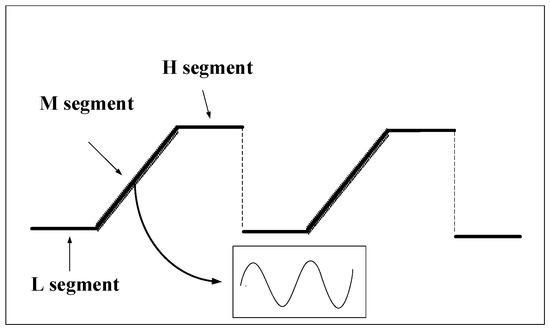
Figure 2.
Waveform of stair-stepping segmented low-frequency signal.
After modulation, the output frequency v and the output intensity are obtained as follows.
where is the center frequency of the laser’s output, is the modulated SA, is the light intensity modulation index, and is the modulation frequency.
According to Equation (4) and Equation (1), the light intensity with gas absorption is the following.
The actual gas absorption and light intensity modulation are extremely small, i.e., α(v) << 1 and η << 1. The Taylor series expansion is performed, according to Equation (5). The light intensity is obtained, ignoring the high-order terms, as follows.
From Equation (2), the center frequency of the laser is adjusted to coincide with the gas absorption peak, i.e., . Then, the light intensity with gas absorption is obtained as follows.
The detection signals , , and of the photodetector can be expressed as follows.
where is the conversion factor of the photodetector, is the amplification factor of the detection circuit, and , , , and are the incident light intensity corresponding to the L, M, and H segments of the low-frequency signal that satisfy . Differential signal is obtained as follows.
The Fourier series expansion is performed on Equation (12) to obtain the second harmonic component coefficient as follows.
From Equation (13), given that , , and are constant, the gas concentration (), and the amplitude of the 2f signal () are proportional. In the experiment, the 2f signal is extracted, and the concentration of C2H2 can be calculated. The relationship between and can be obtained through calibration experiments.
3. System Configuration
The C2H2 detection system is mainly divided into two components, which includes optical and electrical modules. The system structure is shown in Figure 3a. The optical module includes a DFB laser, a self-developed multi-reflection gas chamber, and a photodetector. The electrical module includes a laser driver, a high-precision temperature controller, a lock-in amplifier, and a data processing module. The design of the C2H2 detection system is shown in Figure 3b.
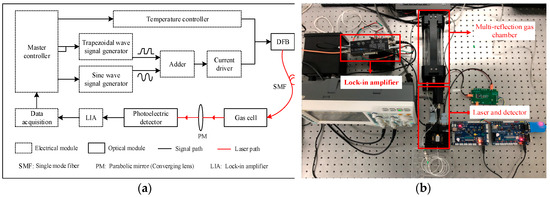
Figure 3.
(a) Structure of the C2H2 detection system. (b) C2H2 concentration detection experimental platform.
3.1. Testing of Laser Performance
The near-infrared DFB laser (1520 nm, Nanoplus) is driven by a self-developed driver. The output wavelength of the laser is tuned by controlling the drive current and temperature, and the laser’s temperature was set to 20 °C, 25 °C, and 30 °C by the self-developed temperature controller. As the driving current increases (20 to 150 mA), the emitting peak wavelength gradually increases, and the current tuning factor is approximately 0.011 nm/mA. At a stable driving current, the emitting peak wavelength increases with temperature, and the temperature tuning factor is approximately 0.113 nm/°C. The tuning characteristics of the laser are shown in Figure 4a.
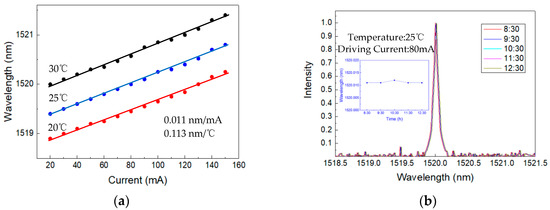
Figure 4.
(a) Curve of the laser’s emitting peak wavelength versus the driving current at 20 °C, 25 °C, and 30 °C. (b) Curve of the laser’s emitting peak wavelength during four hours of continuous operation.
The driving current is set to 80 mA, and the temperature is set to 25 °C with a monitoring experiment for 4 h (8:30–12:30). The laser’s optical emission spectrometry is shown in Figure 4b. The emitting peak wavelength varies by approximately 0.001 nm (between 1520.011 and 1520.012 nm). The monitoring experiment results show that the laser’s emission peak wavelength slightly changes, and the working state is stable during a long-term continuous operation.
3.2. Multi-Reflection Chamber
The spots of the traditional optical chamber are roughly distributed in a circular shape on the spherical mirror, as shown in Figure 5a. When the distance between the mirrors is extremely close (i.e., the physical size is small), the optical path length cannot easily satisfy the detection requirements. To improve the detection sensitivity, the proposed gas chamber uses three mirrors with a mirror diameter of 60 mm. There are two semi-circular mirrors on the front and a circular mirror on the back. The mirror surface is coated with a silver film by a vacuum coating process. The effective reflection spectrum ranges from 450 nm to 20 μm and the reflectance is greater than 95%. The optical path length can be changed by manually adjusting the incident optical path. As shown in Figure 5b, the reflected spots on the mirror surface of the gas chamber are distributed in 13 rows, which increases the utilization of the mirror surface.
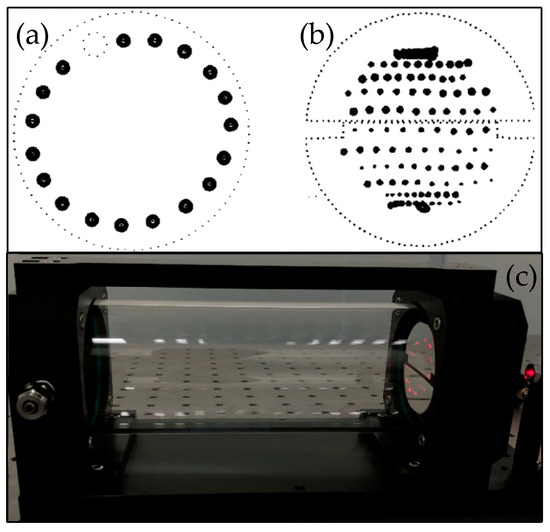
Figure 5.
(a) Mirror spots of the conventional optical chamber distributed in a circular shape. (b) Mirror spots of a multi-reflection chamber distributed in 13 rows. (c) Photo of the multi-reflection chamber.
Since the mirror is made of fused silica (JGS1) material, and the main body of the gas chamber is made of 316 steel. Therefore, the material is easy to obtain, and the cost is relatively low compared with the products of the same market. The chamber adopts a ferrule connector/ asperity polishing connector (FC/APC) fiber coupling interface, the light is coupled into the gas chamber by the fiber, and the docking is convenient. The chamber’s actual structure is shown in Figure 5c, and the optical path length is set to 80 m with 250 reflections by adjusting the incident optical path.
4. Experimental Process and Discussion
In the experiment, the laser temperature is set to 25 °C, and the emission peak wavelength is near 1520 nm. The light is coupled through a fiber into a gas chamber. We used the Gas Dilution System 4040 gas distribution system. The precision and repeatability of the instrument are ±1.0% and ±0.05%. The temperature and humidity of the laboratory are constant, and the precision of gas preparation can be controlled at ±1.2%.
4.1. Calibration Results and Response Time
To measure the relationship between the 2f SA and C2H2 concentration, 10 C2H2 samples with concentrations of 10, 20, 30, 40, 50, 60, 70, 80, 90, and 100 ppmv are prepared by dynamic gas preparation. The prepared C2H2 sample was sequentially introduced into the gas chamber at intervals of 5 min. As shown in Figure 6a, the 2f SA obtained in the experiment was expressed as max (2f). The 2f SA is linear with the C2H2 concentration, and Equation (15) is obtained by linear fitting (where CC2H2 is the measured C2H2 concentration).
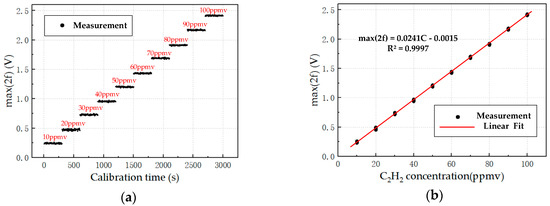
Figure 6.
(a) Relationship between 2f signal’s amplitude (SA) and concentration C2H2 (60 samples per group), and detection data recorded every 5 s. (b) Fitted curve of the 2f SA and concentration C2H2.
Then, Equation (16) is derived as follows.
The 2f SA can be converted to C2H2 concentration by using Equation (16) with a linear correlation of 0.9997, and the fitted curve is shown in Figure 6b.
The response time of the system depends on the time of data processing and the speed of gas diffusion. The detection system can obtain the concentration value in one stair-stepping segmented signal cycle, and 10 concentration values are displayed after average processing. In the case of static gas preparation (i.e., using an air bag to inject C2H2 into the gas chamber), the response time is approximately 2 s.
4.2. Detection Limit and Precision
To test the minimum detection limit (MDL), 50 ppmv C2H2 is introduced into the gas chamber. The 2f signal detected by the lock-in amplifier is shown in Figure 7a. When the C2H2 concentration is 0 ppmv, the 2f signal is as shown in Figure 7b. The 2f SA is 1.206 V when the C2H2 concentration is 50 ppmv, and the system noise’s amplitude (NA) of 0 ppmv is 0.007 V. The SNR is 44.725 dB, and the MDL is as follows: 50 ppmv × NA / SA ≈ 0.3 ppmv.
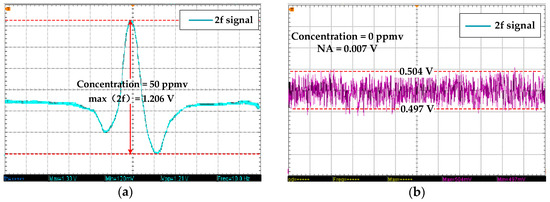
Figure 7.
(a) 2f SA of 50 ppmv C2H2. (b) 2f SA of 0 ppmv C2H2.
He, Q.X. et al. used a 1.534-µm tunable diode laser and a miniature gas chamber to achieve C2H2 detection in Reference [19], and the minimum detectable absorption is 2.66 × 10⁻³. In this paper, different concentrations of C2H2 were introduced into the gas chamber, and the minimum detectable concentration is 0.3 ppmv. Therefore, the minimum detectable absorption is 3.01 × 10⁻³.
To test the precision of the detection system, nine C2H2 samples at 10, 15, 25, 35, 45, 55, 75, 95, and 100 ppmv were prepared. The detection system calculated the concentration values according to the fitting formula. The error analysis of the detection results is shown in Figure 8. The blue line indicates the absolute error of the experimental results, and the red line reflects the relative error. The maximum absolute error is 0.3 ppmv, and the maximum relative error is within ±2%. Therefore, the precision is 2% in the detection range from 10 to 100 ppmv.
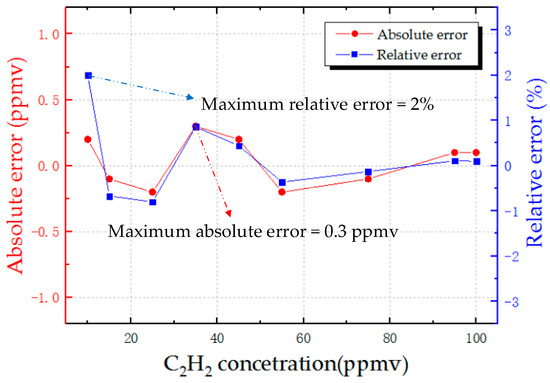
Figure 8.
Detection error of the system on nine C2H2 samples with concentrations of 10, 15, 25, 35, 45, 55, 75, 95, and 100 ppmv.
4.3. Stability Analysis of the System
To test the stability of the detection system, the C2H2 sample at 50 ppmv was introduced into the gas chamber, and the concentration value was recorded every second. The experiment was carried out for 10 h. The result is shown in Figure 9a. The 2f SA ranged from 1.194 to 1.218 V, and the C2H2 concentration was between 49.6 and 50.6 ppmv. Therefore, the fluctuation was less than ±1.2%, and the average value of the data was 50.03 ppmv.
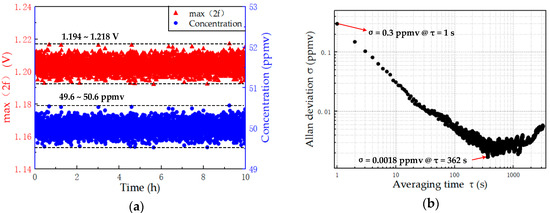
Figure 9.
(a) Results of the stability test of 50 ppmv C2H2. (b) Analysis of Allan deviation for long-term characteristics of the detection system.
Allan deviation was adopted to analyze the long-term characteristics of the detection system [23]. The result shown in Figure 9b indicates that the Allan deviation at the initial integration time of 1 s is 0.3 ppmv. If the integration time continues to increase, then Allan deviation is greatly reduced. Moreover, the Allan deviation can be reduced to 0.0018 ppmv when the integration time is increased to 362 s. The results indicate that the detection system has good stability.
4.4. Comparison
We conducted a large number of experiments using a 15-cm single-pass cell and an 80-m multi-pass cell, which clarifies the increase in detection sensitivity caused by modulation and the increase in sensitivity attributable to the multi-reflection cell. Many researchers have recently conducted in-depth research on C2H2 detection technology in the near-infrared band. The performance comparison between the proposed C2H2 detection system and the reported near-infrared C2H2 detection system is shown in Table 1. The C2H2 detection system in References [13,15,19,24] uses the conventional driving method of the TDLAS-WMS technique. The laser’s driving signal is generated by super-imposing low-frequency sawtooth waves and high-frequency sine waves. Precision and error are greater than 3%. Time division multiplexing differential modulation is used to eliminate light intensity fluctuations, and system stability has been further improved, with a lower detection limit and higher precision.

Table 1.
Performance comparison between the proposed C2H2 detection system and the reported C2H2 detection system.
5. Conclusions
A time division multiplexing differential modulation technique is proposed to eliminate the interference caused by the fluctuation of laser source in a single optical path detection system. A new multi-reflection chamber was designed to further improve the system detection precision. A near-infrared C2H2 detection system was developed based on TDLAS using a 1520 nm DFB laser. A laser driver and a high-precision temperature controller were developed, and a lock-in amplifier is used to extract the 2f signal. A number of experiments were performed using the detection system to study its performance. The experimental results indicated that the detection system has good performance indicators. The MDL is 0.3 ppmv, and the precision was 2% in the detection range of 10 to 100 ppmv and contains errors caused by dynamic gas preparation. A 10-h stability observation experiment was performed on 50 ppmv C2H2, and the fluctuation was less than ±1.2%. The Allan deviation value was 0.3 ppmv when the initial integration time was 1 s, according to the Allan deviation analysis experimental data. When the integration time increased to 362 s, Allan deviation value was 0.0018 ppmv, which indicated the system’s good stability. In addition, the time division multiplexing differential modulation technique and the chamber structure adopted by the system were suitable for the precision improvement of other near-infrared single optical path gas detection systems. Therefore, the proposed approach was flexible and practical.
Author Contributions
Conceptualization, B.W. Methodology, B.W. and H.L. (Hongfei Lu). Software, B.W. Validation, B.W., H.L. (Hongfei Lu), and C.C. Formal analysis, L.C. Investigation, H.L. (Hongfei Lu). Writing—original draft preparation, H.L. (Hongfei Lu). Writing—review and editing, H.L. (Hongfei Lu), B.W., and C.C. Visualization, H.L. (Houquan Lian), T.D., and Y.C. Project administration, L.C. Funding acquisition, B.W.
Funding
The National Key R&D Program of China, grant number 2017YFB0405303, funded this research.
Acknowledgments
The author wishes to express his gratitude to the National Key R&D Program of China (2017YFB0405303) for their generous support toward this work.
Conflicts of Interest
The authors declare no conflicts of interest.
References
- Utsav, K.C.; Nasir, F.E.; Aamir, F. A mid-infrared absorption diagnostic for acetylene detection. Appl. Phys. B 2015, 120, 223–232. [Google Scholar]
- Cao, Y.; Jin, W.; Ho, H.L.; Qi, L.; Yang, Y.H. Acetylene detection based on diode laser QEPAS: combined wavelength and residual amplitude modulation. Appl. Phys. B Lasers Opt. 2012, 109, 359–366. [Google Scholar] [CrossRef]
- D’Amico, A.; De Marcellis, A.; Di Carlo, C.; Di Natale, C.; Ferri, G.; Martinelli, E.; Paolesse, R.; Stornelli, V. Low-voltage low-power integrated analog lock-in amplifier for gas sensor applications. Sens. B Chem. 2010, 144, 400–406. [Google Scholar]
- Kluczynski, P.; Jahjah, M.; Nahle, L.; Axner, O.; Belahsene, S. Detection of acetylene impurities in ethylene and polyethylene manufacturing processes using tunable diode laser spectroscopy in the 3-lm range. Appl. Phys. B 2011, 105, 427–434. [Google Scholar] [CrossRef]
- Zheng, C.T.; Ye, W.L.; Li, G.L.; Yu, X.; Zhao, C.X.; Song, Z.W.; Wang, Y.D. Performance enhancement of mid-infrared CH4 detection sensor by optimizing an asymmetric ellipsoid gas-cell and reducing voltage-fluctuation: Theory, design and experiment. Sens. Actuators B Chem. 2011, 160, 389–398. [Google Scholar] [CrossRef]
- Xia, H.; Dong, F.Z.; Wu, B.; Zhang, Z.R.; Pang, T.; Sun, P.S.; Cui, X.J. Sensitive absorption measurements of hydrogen sulfide at 1.578 µm using wavelength modulation spectroscopy. Chin. Phys. B 2015, 24, 034204. [Google Scholar] [CrossRef]
- Ye, W.L.; Zheng, C.T.; Yu, X.; Zhao, C.X.; Song, Z.W.; Wang, Y.D. Design and performances of a mid-infrared CH4 detection device with novel three channel-based LS-FTF self-adaptive denoising structure. Sens. Actuators B Chem. 2011, 155, 37–45. [Google Scholar] [CrossRef]
- Yue, J.X.; Xie, P.A.; Lu, Y.Z.; Liu, F.H.; Wang, F.P. Concentration monitoring of carbon dioxide in supersonic flow-fields by TDLAS. Laser J. 2018, 39, 30–33. [Google Scholar]
- Lackner, M. Tunable diode laser absorption spectroscopy (TDLAS) in the process industries—A review. Rev. Chem. Eng. 2007, 23, 65–147. [Google Scholar] [CrossRef]
- Hancock, G.; Van Helden, J.H.; Peverall, R.; Ritchie, G.A.D.; Walker, R.J. Direct and wavelength modulation spectroscopy using a cw external cavity quantum cascade laser. Appl. Phys. Lett. 2009, 94, 201110. [Google Scholar] [CrossRef]
- Sur, R.; Sun, K.; Jeffries, J.B.; Socha, J.G.; Hanson, R.K. Scanned-wavelength-modulation-spectroscopy sensor for CO, CO2, CH4 and H2O in a high-pressure engineering-scale transport-reactor coal gasifier. Fuel 2015, 150, 102–111. [Google Scholar] [CrossRef]
- Sur, R.; Sun, K.; Jeffries, J.B.; Hanson, R.K.; Pummill, R.J.; Waind, T.; Wagner, D.R.; Whitty, K.J. TDLAS-based sensors for in situ measurement of syngas composition in a pressurized, oxygen-blown, entrained flow coal gasifier. Appl. Phys. B 2014, 116, 33–42. [Google Scholar] [CrossRef]
- Dong, M.; Zheng, C.T.; Yao, D.; Zhong, G.Q.; Miao, S.Z.; Ye, W.L.; Wang, Y.D.; Tittel, F.K. Double-range near-infrared acetylene detection using a dual spot-ring Herriott cell (DSR-HC). Opt. Express 2018, 26, 12081–12091. [Google Scholar] [CrossRef] [PubMed]
- He, Q.X.; Liu, H.F.; Li, B.; Pan, J.Q.; Wang, L.J.; Zheng, C.T.; Wang, Y.D. Online detection system on acetylene with tunable diode laser absorption spectroscopy method. Spectrosc. Spectr. Anal. 2016, 36, 3501–3505. [Google Scholar]
- He, Q.X. Research on Gas Detection System Based on Infrared Laser Absorption Spectroscopy Technique. Ph.D. Thesis, Jilin University, Changchun, China, 2018. [Google Scholar]
- Li, C.G.; Dong, L.; Zheng, C.T.; Tittel, F.K. Compact TDLAS based optical sensor for ppb-level ethane detection by use of a 3.34 µm room-temperature CW interband cascade laser. Sens. Actuators B 2016, 232, 188–194. [Google Scholar] [CrossRef]
- Li, J.Y.; Luo, G.; Du, Z.H.; Ma, Y.W. Hollow waveguide enhanced dimethyl sulfide sensor based on a 3.3 µm interband cascade laser. Sens. Actuators B 2018, 255, 3550–3557. [Google Scholar] [CrossRef]
- Yan, M.; Luo, P.L.; Iwakuni, K.; Millot, G.; Hänsch, T.W.; Picqué, N. Mid-infrared dual-comb spectroscopy with electro-optic modulators. Light Sci. Appl. 2016, arXiv:1608.08013. [Google Scholar] [CrossRef] [PubMed]
- He, Q.X.; Zheng, C.T.; Liu, H.F.; Li, B.; Wang, L.J.; Tittel, F.K. A near-infrared acetylene detection system based on a 1.534 µm tunable diode laser and a miniature gas chamber. Infrared Phys. Technol. 2016, 75, 93–99. [Google Scholar] [CrossRef]
- Li, J.S.; Yu, B.L.; Zhao, W.X.; Chen, W.D. A Review of Signal Enhancement and Noise Reduction Techniques for Tunable Diode Laser Absorption Spectroscopy. Appl. Spectrosc. Rev. 2014, 49, 666–691. [Google Scholar] [CrossRef]
- Zhu, X.R.; Lu, W.Y.; Rao, Y.Z.; Li, Y.S.; Lu, Z.M.; Yao, S.C. Selection of baseline method in TDLAS direct absorption CO2 measurement. Chin. Opt. 2017, 10, 455–461. [Google Scholar]
- Hosseinzadeh, S.S.; Khorsandi, A. Apodized 2f/1f wavelength modulation spectroscopy method for calibration-free trace detection of carbon monoxide in the near-infrared region: Theory and experiment. Appl. Phys. B 2014, 116, 521–531. [Google Scholar] [CrossRef]
- Allan, D.W. Statistics of Atomic Frequency Standards. Proc. IEEE 1966, 54, 221–230. [Google Scholar] [CrossRef]
- He, Y.; Zhang, Y.J.; Kan, R.F.; Xia, H.; Wang, M.; Cui, X.J.; Chen, J.Y.; Chen, D.; Liu, W.Q.; Liu, J.G. The development of acetylene online monitoring technology based on laser absorption spectrum. Spectrosc. Spectr. Anal. 2008, 10, 2228–2231. [Google Scholar]
© 2019 by the authors. Licensee MDPI, Basel, Switzerland. This article is an open access article distributed under the terms and conditions of the Creative Commons Attribution (CC BY) license (http://creativecommons.org/licenses/by/4.0/).