Article

Terahertz Time-Domain Spectroscopy Based on Commercially Available 1550 nm Fabry–Perot Laser Diode and ErAs:In(Al)GaAs Photoconductors

1
Chair of Communication Systems NTS, University of Duisburg-Essen 47057 Duisburg, Germany
2
French-German Research Institute of Saint-Louis ISL, F-68301 Saint-Louis, France
3
Terahertz Devices and Systems, Department of Electrical Engineering and Information Technology, TU Darmstadt, 64283 Darmstadt, Germany
*
Author to whom correspondence should be addressed.
Appl. Sci. 2019, 9(13), 2704; https://doi.org/10.3390/app9132704
Submission received: 17 June 2019 / Revised: 28 June 2019 / Accepted: 1 July 2019 / Published: 3 July 2019
(This article belongs to the Special Issue Terahertz and Far Infrared Pulsed Devices and Systems)

Abstract

:
THz time-domain spectroscopy (TDS) is a promising tool for quality control purposes in industrial applications, but the high cost and the relatively large laser sources still make it difficult to use the full potential of the technology for a decent price. In this work, a THz TDS system, which uses a commercially available Fabry–Perot laser diode emitting at 1550 nm, is presented. By dispersion compensation, pulses with a duration of 544 fs were generated, resulting in THz radiation with a bandwidth of 1.4 THz and a peak dynamic range of 56 dB with state-of-the-art ErAs:In(Al)GaAs photoconducting antennas. These results are compared with those of a conventional and expensive fiber laser system with a 90 fs pulse duration.

1. Introduction

Over the last three decades, THz time-domain spectroscopy (TDS) has matured from proof of principle demonstrations [1] to a widely utilized tool in basic research and industrial applications [2]. Especially for industrial applications in real-world scenarios, it is mandatory to find compact and cost-effective solutions for the required ultrafast laser source, which drives the THz TDS system. While first experiments were performed with dye lasers, more user-friendly and reliable Ti-sapphire lasers later enabled the first THz TDS images [3]. A big step towards user-friendly and more compact systems was the employment of erbium-doped ultrafast fiber lasers [4]. With these systems it was possible to demonstrate several real-world related applications including non-destructive testing [5,6,7], food quality control [8,9,10], and applications in archeology [11,12,13].
However, fiber-lasers are still not the ideal solution for ultra-compact and cost-effective systems. They must be pumped optically and still make up 50% of the total costs of a THz TDS system [14]. From a system engineer’s point of view, a semiconductor laser diode is the ideal light source. It can be pumped electrically, has a very small footprint, and can be inexpensively mass-produced by the semiconductor industry. Despite these advantages, no commercially available THz TDS system is driven by a monolithic laser diode. The utter lack of ultrafast monolithic laser diodes stems from the complex semiconductor physics, which prohibit the direct generation of ultrashort laser pulses [15,16,17].
One method to overcome this problem is the use of inexpensive multimode laser diodes without any locking. The photomixer generates multiple THz frequencies by mixing the longitudinal laser modes. This technique requires no specific phase relation of the modes. Furthermore, short-term fluctuations caused by mode competition average out during a measurement due to temporal integration at each time step. Initially, this technique was called THz cross-correlation spectroscopy (CCS) [18,19] and was later established as THz quasi time-domain spectroscopy (QTDS) [20,21]. Recent publications demonstrate the feasibility at telecom wavelengths with a bandwidth of up to 2 THz [22,23]. However, the performance of a mode-locked laser diode in THz TDS should be superior to CCS/QTDS since the peak power and, hence, the generated THz power is higher, compared to a continuous wave laser.
So far only one demonstration for THz TDS using a monolithic laser diode exists [24], wherein a research grade laser diode was used to drive a standard THz TDS system. The bandwidth was limited to 800 GHz with a peak dynamic range of 45 dB. The poor performance, compared to recent CCS/QTDS results, originated from rather broad pulses (~900 fs), low average optical power (5 mW) at the photoconductive antennas (PCA), and an emitter PCA carrier lifetime of 30 ps, which is long compared to the 25 ps period of the laser pulses.
In this paper, a commercially available laser diode was used to drive state-of-the-art ErAs:In(Al)GaAs PCAs with carrier lifetimes around 2 ps (source: 2.1 ± 0.4 ps, receiver: 1.55 ± 0.1 ps). The intrinsic linear chirp of the fiber-coupled laser diode can be compensated by the dispersion of a standard single mode fiber. In the first step, its essential to find a stable operation mode and the optimal fiber length for minimal pulse duration. Then, a classic THz TDS setup was used to evaluate the capability to generate and detect THz radiation. The results are compared to a state-of-the-art pulsed fiber laser.

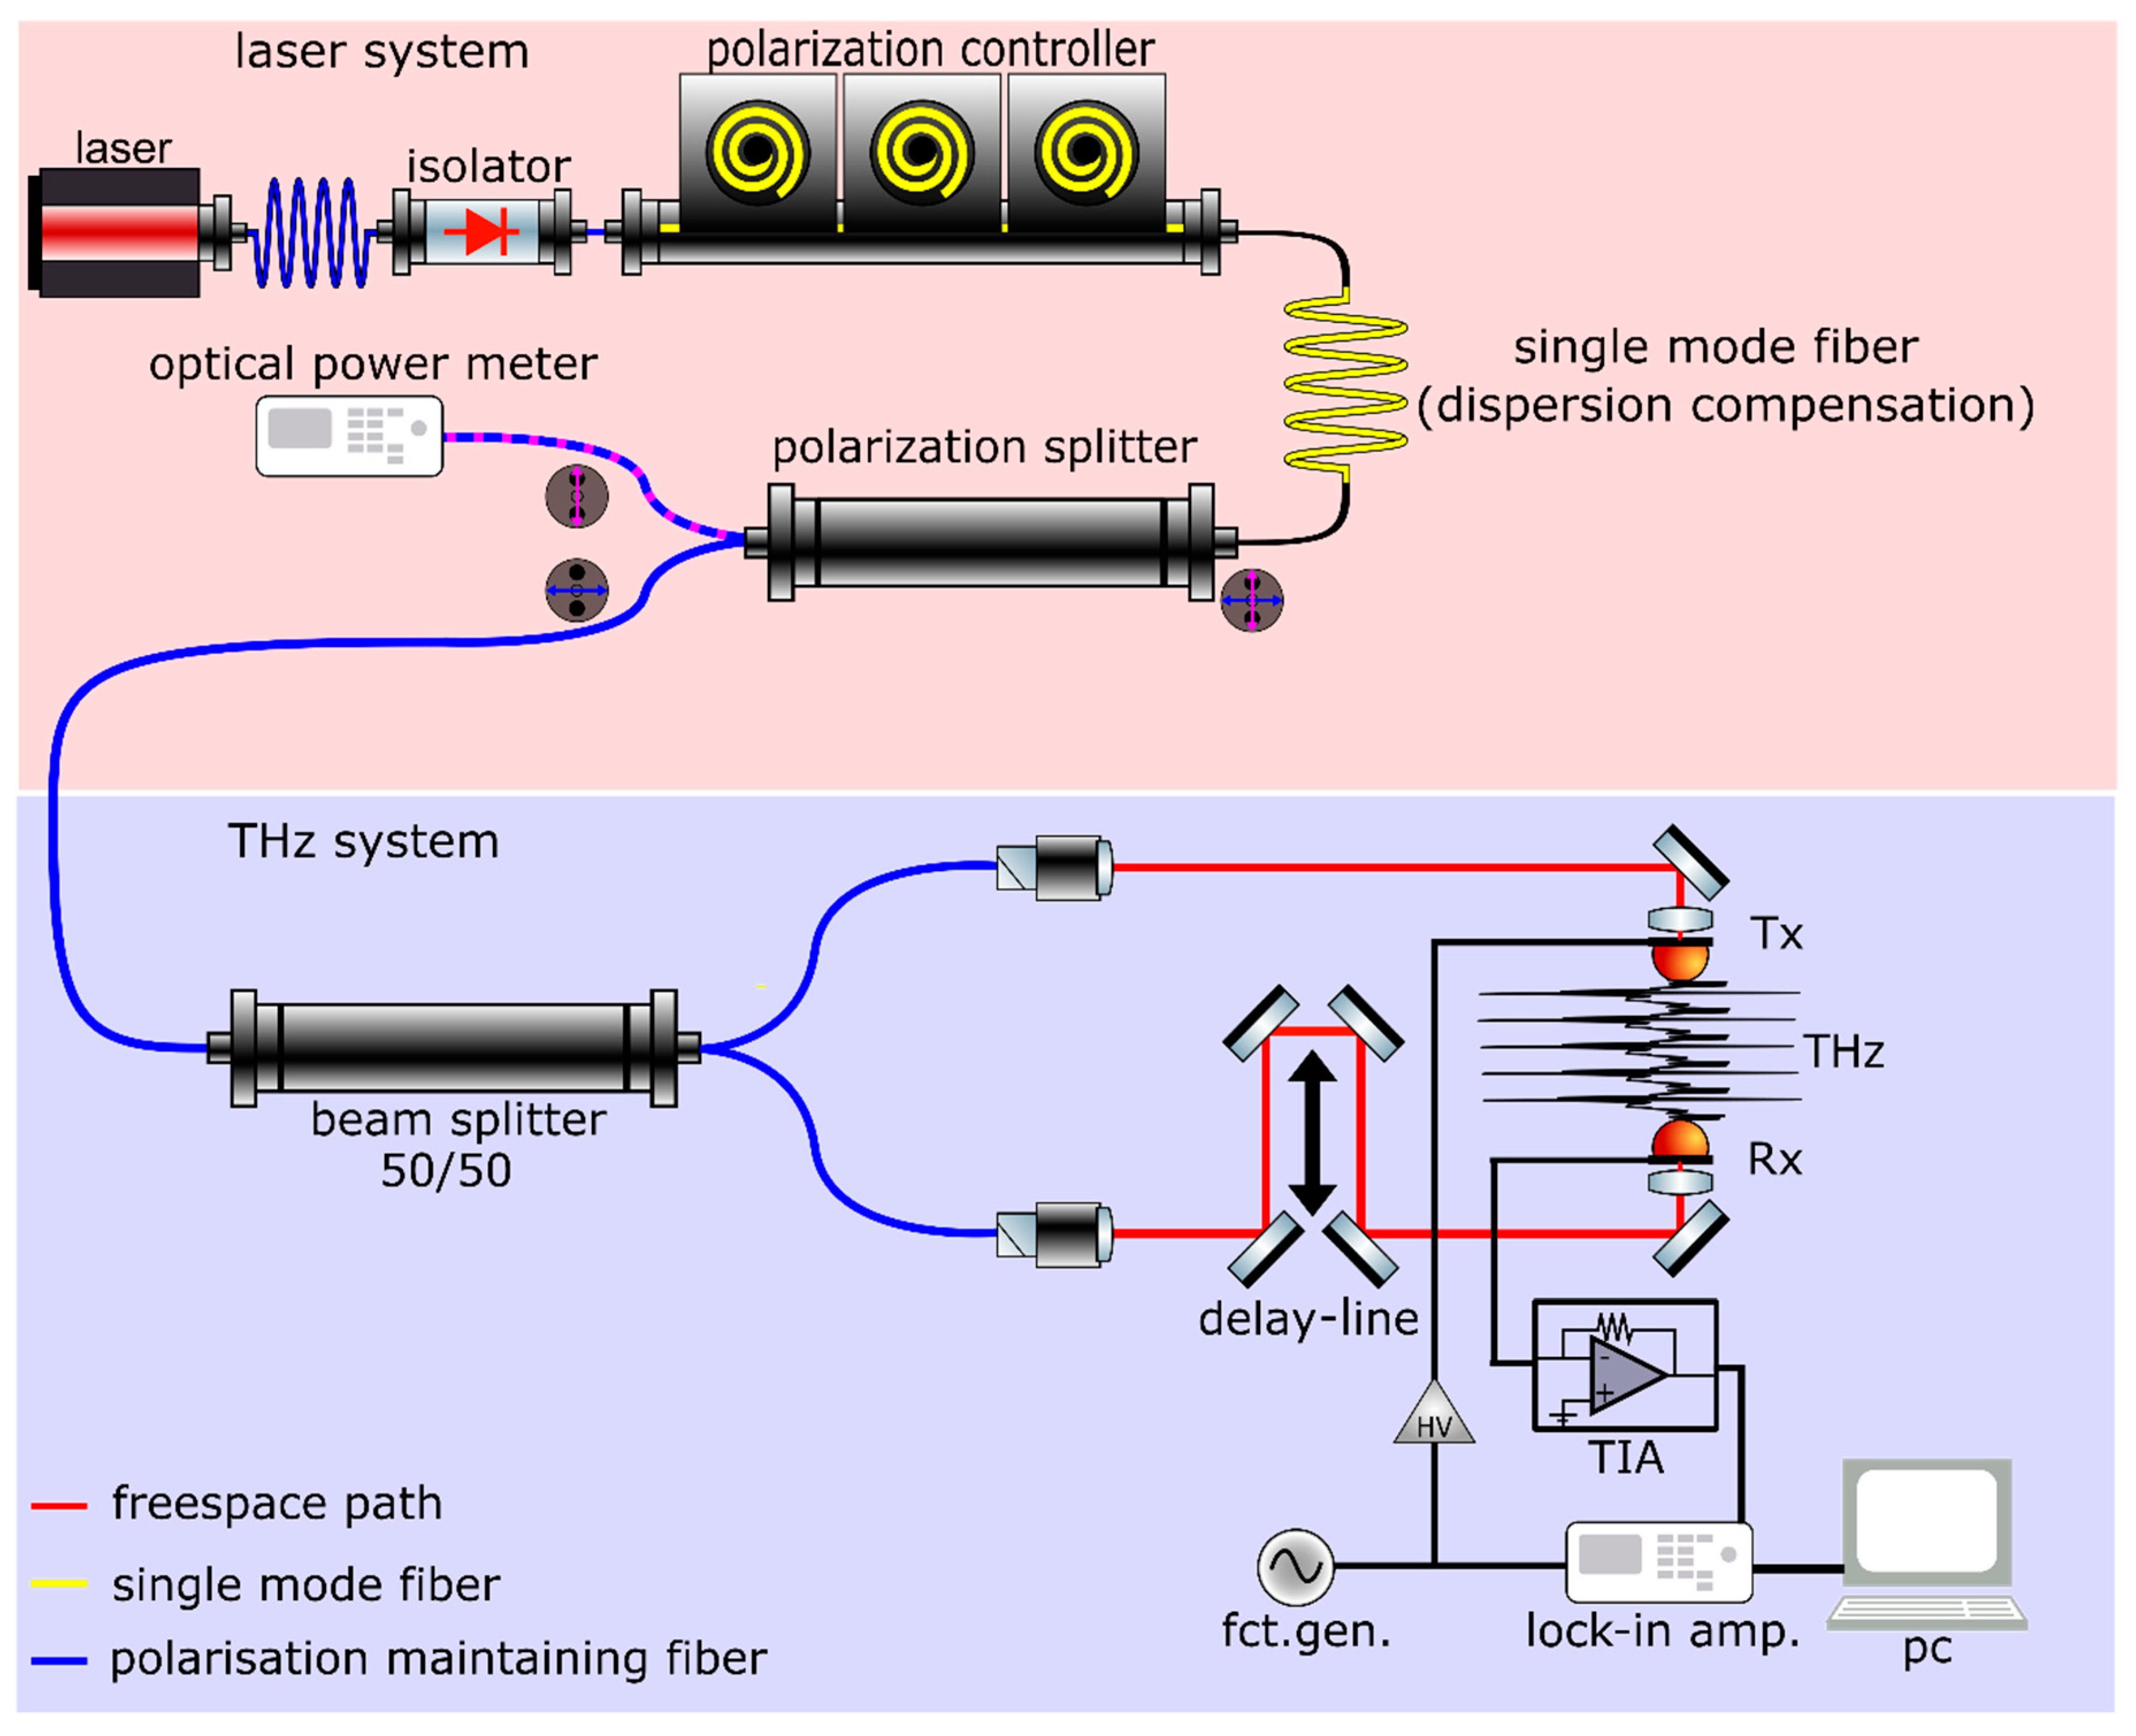
2. Experimental Setup

A block diagram of the experimental setup is depicted in Figure 1. It can be divided in two parts, the laser system (shaded in red) and the THz system (shaded in blue).

2.1. Laser System

The monolithic laser source in our setup is a fiber-coupled Fabry–Perot laser diode (FPL1009P, Thorlabs). It offers a small footprint, can be pumped electrically, is commercially available, and is inexpensive (<$1500) as compared to fiber lasers. Its emission wavelength is centered at 1550 nm, which makes the laser compatible with established telecom technology. The free spectral range (FSR) is 43.47 GHz, while the average output power exceeds 100 mW at an injection current of 500 mA. Although this laser is sold as a longitudinal multimode laser with no hint of mode locking capabilities, there was the conjecture from previous experiments that the broad emission spectrum with a full-width half-maximum exceeding 10 nm is a sign of four-wave mixing mode locking in this single section laser [25,26]. In this case, the laser emits linearly chirped pulses, which can be compressed by the anomalous dispersion of a standard single mode fiber (SMF) [24].
The rest of the laser system setup is as follows: To suppress unwanted feedback from the rest of the setup, a fiber optic isolator is employed. The inherent chirp of the laser can be compensated using a SMF with variable length. A fused fiber polarization splitter (PS) is used to ensure well-defined linear polarization at the output of the laser system. The polarization maintaining fiber (PMF) at the slow-axis output of the PS is connected to the PMF at the input of a fiber optic 50/50 beam splitter. The PMF at the fast-axis output of the PS is connected to a power meter. A polarization controller at the input of the section of SMF is used to minimize the power at the fast-axis output of the PS, thus maximizing the power at the slow-axis output. To check whether an ultrashort laser pulse exists, a second harmonic generation (SHG) autocorrelator (pulseCheck, APE Berlin) is used to determine the length of the pulse. The length of the SMF can then be varied to find optimal dispersion compensation and hence the shortest pulse. The autocorrelation function (ACF) is directly measured before the PCAs to determine the correct pulse duration. Further, an optical spectrum analyzer (MS9740A, Anritsu) is used to obtain the optical spectrum of the laser diode.

2.2. THz System

The optical signal at the input of the THz system is distributed to the two PCAs by a fiber optic PM 50/50 beam splitter. The PCAs are ErAs:In(Al)GaAs photoconductors, optimized for 1550 nm excitation, similar to those presented in Reference [27]. The source consists of a superlattice of 15 nm InGaAs, 1.5 nm p-InAlAs, 0.8 monolayers ErAs, and 1.5 nm p-InAlAs with 90 periods. It is connected to an H-dipole with a central dipole length of 35 µm and a gap of 20 µm. The receiver is a superlattice with 90 periods of 15 nm InGaAs, 1.6 monolayers delta-p-doped ErAs, and 2 nm p-InAlAs with an H-dipole of length 100 µm and a gap of 10 µm. The optical signal for the detector can be delayed by a translation stage (M-ILS150CC Motorized Linear Stage, Newport). The THz system was operated under ambient air.
The photocurrent generated at the receiving PCA is converted to a voltage with a transimpedance-amplifier (TIA) and detected by a lock-in amplifier (MFLI, Zürich Instruments). Lock-in detection is facilitated by modulating the bias voltage of the transmitting PCA with a sine wave. The sine wave is generated by a signal generator (HP8116A). A high-voltage amplifier (Tabor Electronics 9200) is used to adapt the output voltage range to the required bias voltage of the PCA (~120 V). The lock-in amplifier is synchronized with the signal generator.

2.3. Reference Laser System

To compare the performance of the monolithic laser diode with other laser sources, the measurements have been repeated with a state-of-the-art 1550 nm fiber laser system, from Menlo Systems, with 90 fs pulse duration. This system replaces the red part (optical setup) of Figure 1, while the blue part (THz Setup) remains unchanged.

3. Results

This section shows the results from the optical characterization of the laser diode FPL1009P, the measured THz time-domain traces, and spectra. Further, a spectrum recorded with the fiber laser from Menlo Systems is compared to the results from the monolithic laser diode.

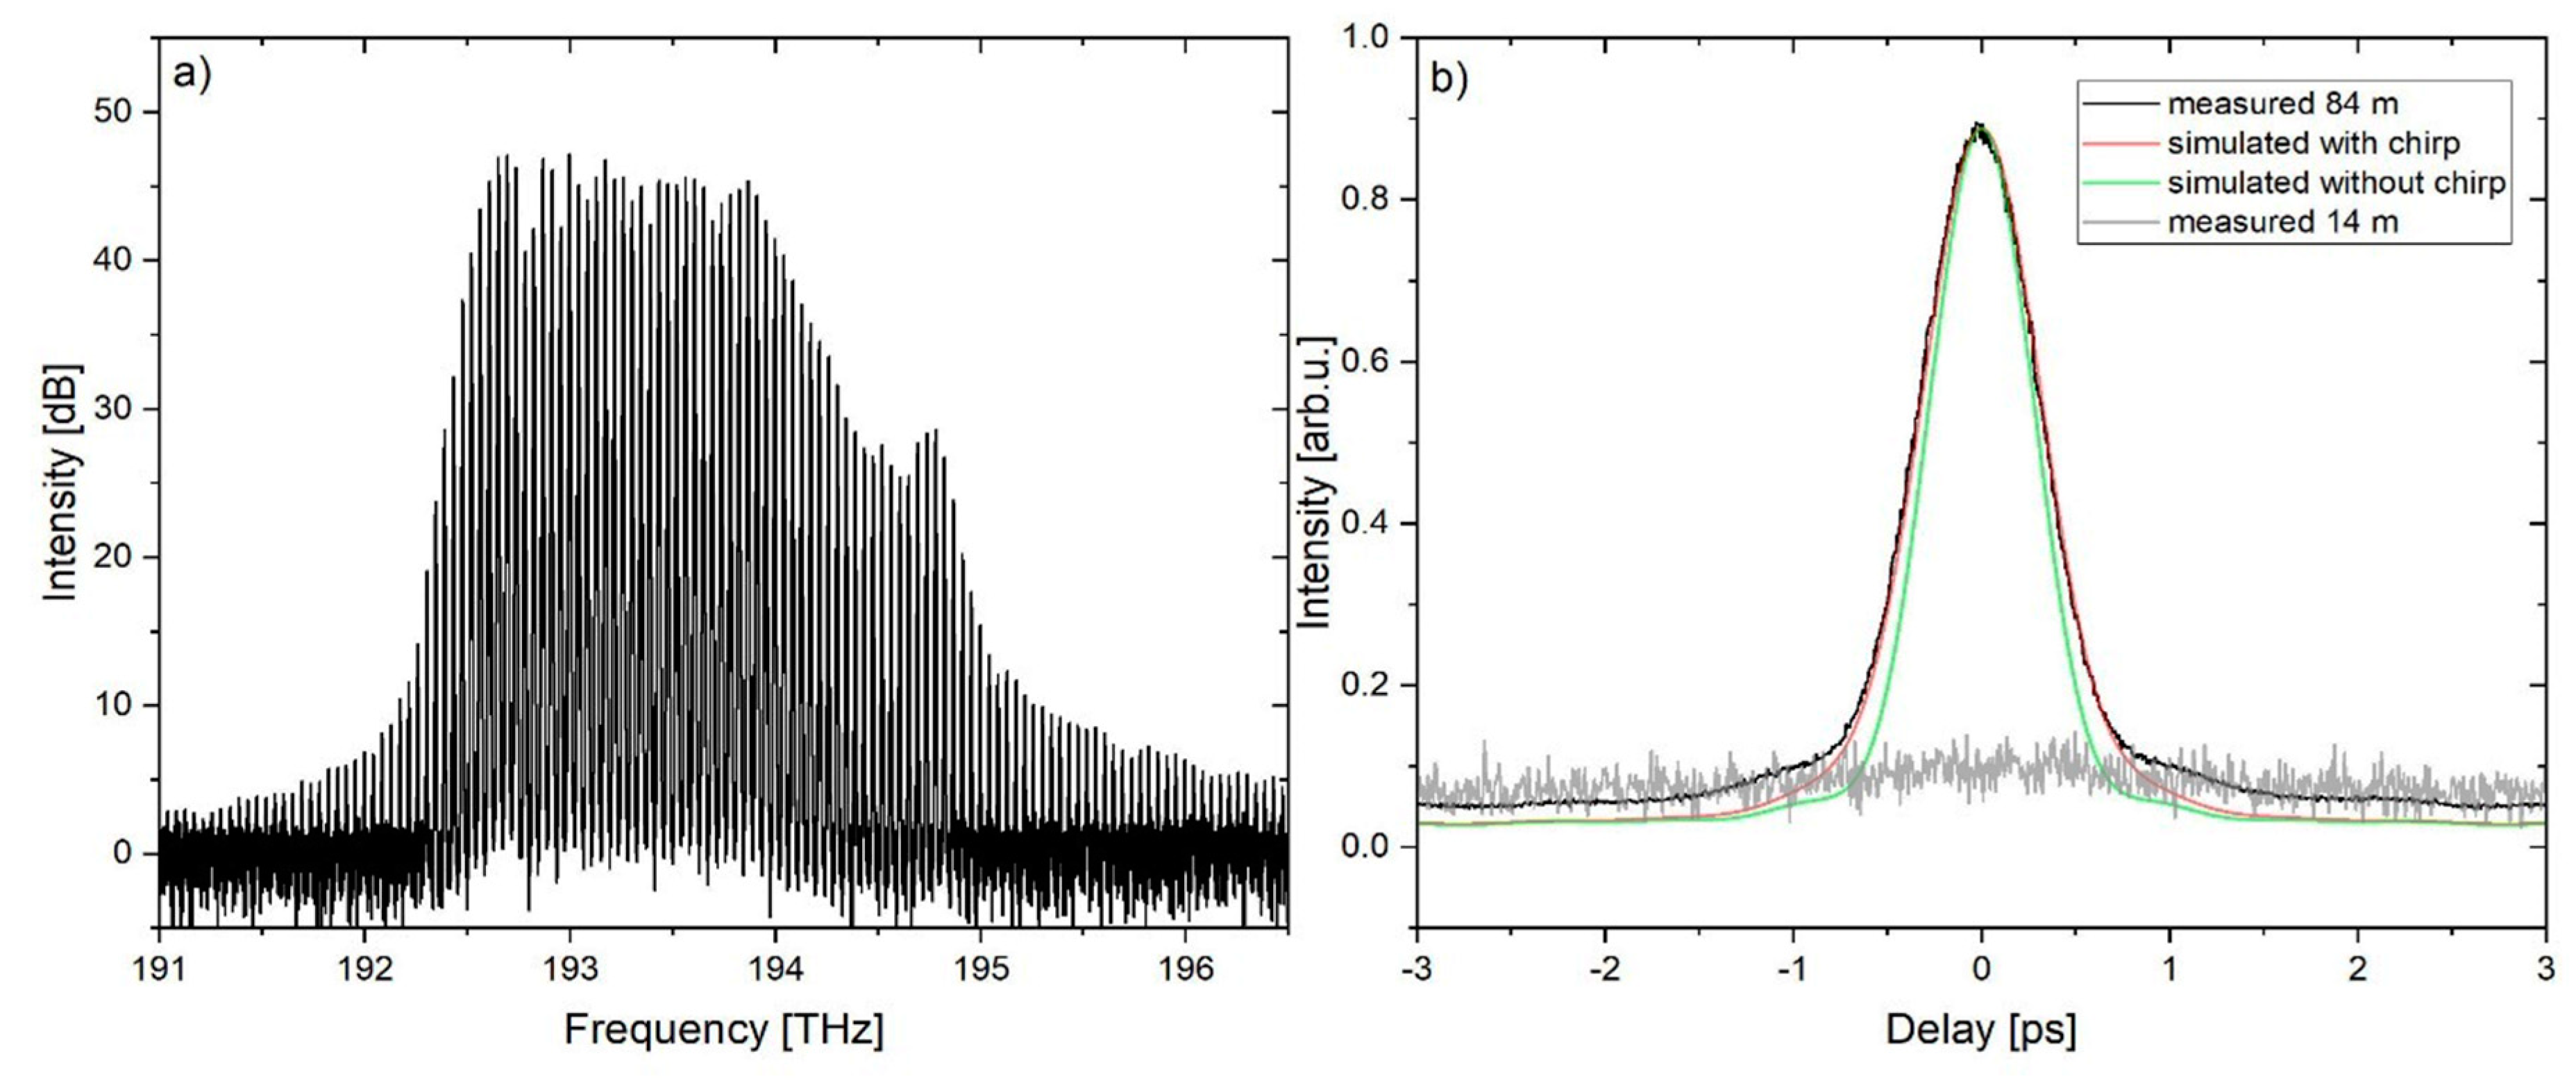
3.1. Optical Characterization
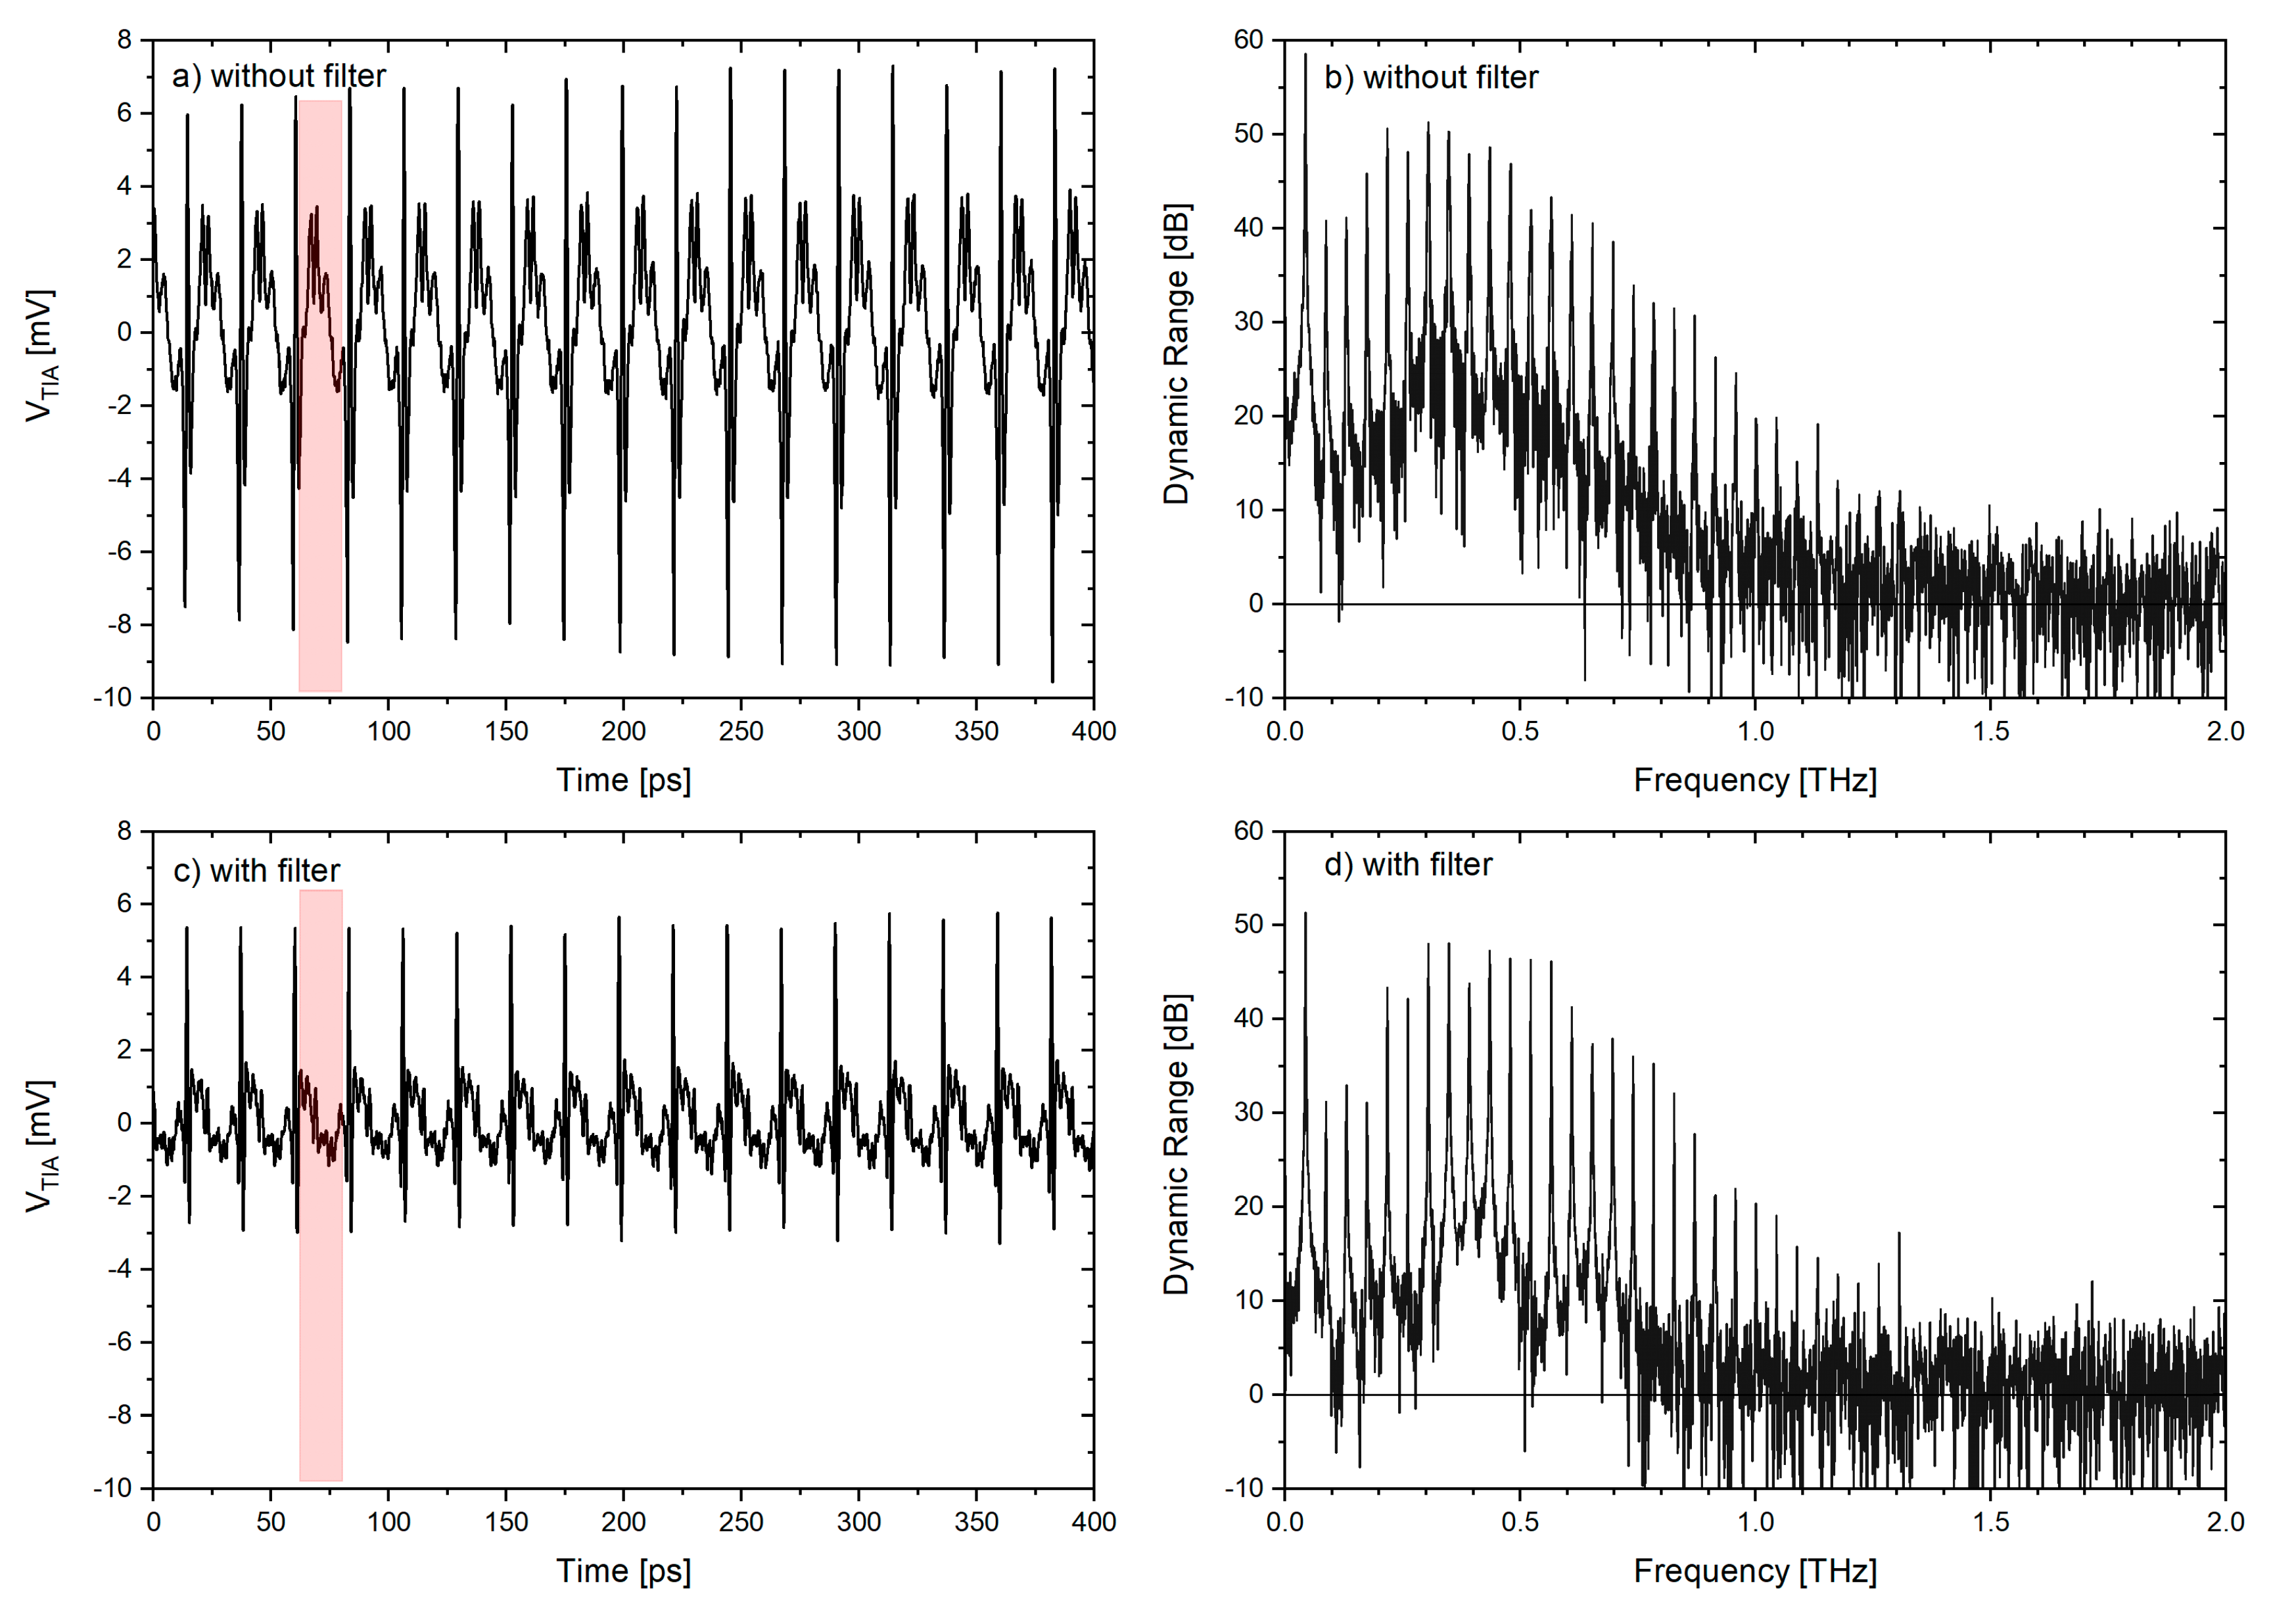
The power spectrum of the monolithic laser diode is measured with an optical spectrum analyzer at a laser temperature of T = 20.10 °C and an injection current of I = 487 mA. The trace is depicted in Figure 2a. From the spectrum, the mode spacing was calculated to be Δ f FSR = 43.47   GHz . If the laser is mode-locked, the optimal dispersion for chirp compensation can be estimated from the −10 dB bandwidth, Δ f 10 dB , and Δ f FSR [28], as follows:
| B | = ( 2 π Δ f 10 dB Δ f FSR ) 1 = 2.274   ps 2 ,
with Δ f 10 dB = 1.61   THz . From the group velocity dispersion, GVD = 0.023   ps 2 / m of an SMF at 1550 nm follows a predicted fiber length of 99 m.
To check whether the laser is mode-locked, the second harmonic generation (SHG) ACF is measured after the beam splitter. First, we measured the ACF without additional fiber. In this case, the total fiber length is 14 m due to the fiber from the laser, the fiber-based isolator, and the polarization controller. The ACF can be seen as a flat gray line in Figure 2b.
The SMF length that provides the best chirp compensation is determined experimentally by changing the total fiber length from 14 m to 84 m in steps of 5 m and finer steps close to the optimum point. At a total fiber length of 84 m, the full-width at half maximum (FWHM) of the measured ACF reaches a minimum of 762 fs. The measured ACF is depicted in black in Figure 2b and clearly demonstrates that the laser diode is mode-locked. The mismatch of 15 m for the optimal fiber length between the estimated and the experimentally found fiber length originates from the phenomenological nature of Equation (1). The −10 dB bandwidth is especially highly dependent on the shape of the optical spectrum.
To verify the chirp compensation, the ACF can be simulated from the measured power spectrum as follows: The electric field of the laser signal is given by the sum of those of the individual modes,
E _ LD ( t ) = k = 0 N 1 E k · e j [ 2 π · ( f 0 + k · Δ f FSR ) t + φ k ]   ,
where E k and φ k denote the amplitude and phase of mode k , respectively. The corresponding instantaneous optical power, i.e., the optical pulse envelope, is
P opt ( t ) = | E _ LD ( t ) | 2 ,
and the ACF, R ( τ ) , can be calculated according to
R ( τ ) =   P opt ( t + τ ) · P opt ( t )   dt .
The chirp-free case is approximated by a linear phase relationship between the modes, i.e.,
φ k , lin = φ 0 , lin · k   ,
with the arbitrary phase slope φ 0 , lin .
The residual chirp in our measurement is approximated by assuming a square phase profile, i.e.,
φ k , squ = φ 0 , squ · ( k N ) 2 .
The parameter φ 0 , squ is optimized so that the FWHM of the simulated ACF matches the FWHM of the measured ACF.
The chirp-free case is depicted as the green line in Figure 2b with an FWHM of the ACF of 656 fs. The simulated ACF for the case of a residual chirp is depicted as the red line in Figure 2b and exhibits a FWHM of 762 fs. Its shape closely matches the shape of the measured ACF (black).
Further, a conversion factor can be calculated for the ACF of the measured pulse with the simulated data. The ACF is always broader than the underlying pulse. Dividing the FWHM of the simulated ACF by the FWHM of the simulated pulse yields a factor of 1.4. The deconvoluted pulse duration is thus 544 fs for the measured pulse. The pulse is a factor of 1.16 wider than the ideal chirp-free pulse. This deviation can be explained by higher order dispersion, which cannot be compensated by simply adding SM fiber length. The time-bandwidth-product (TBP) of the laser is 0.7, with a 3 dB bandwidth of 1.3 THz.

3.2. THz Results

The above-described measurements demonstrate that the used laser diode is mode-locked. We used the optimum parameters (injection current, fiber length) to drive the THz setup (Figure 1, blue part) with the laser diode. The transimpedance amplifier (TIA) before the lock-in amplifier is set to a gain of 107 V/A. The lock-in frequency is set to 17.3 kHz and the amplitude of the external sine wave reference is set to 7 V. The HV amplifier is used to increase the reference voltage by a factor of 15 to 105 V for the emitter antenna, which results in a maximum photocurrent of 205 µA. The integration time, tc, is set to 1 ms. At each time step, a waiting time of 10 ms is introduced as the settling time for the lock-in amplifier. The scan window is 120 mm at a step size of 0.025 mm. The optical power is 22 mW at the THz emitter and 27 mW at the THz receiver.
Figure 3a,c shows the THz time-domain traces recorded with the FPL1009P. The time between the pulses is Δt = 23 ps for both time-traces and corresponds to the inverse repetition rate of the laser, at 43.47 GHz. The laser´s high repetition rate causes the discrete spectrum shown in Figure 3b,d obtained by Fourier transformation. The measurements shown in Figure 3c,d are done with a metallic mesh-filter inside the THz path. This filter acts as a high pass filter attenuating the low frequency components (particularly <400 GHz) in the spectrum.
The peak-to-peak amplitude is 14.1 mV without the filter (Figure 3a) and 8.3 mV with the mesh filter (Figure 3c), corresponding to a decrease to 60% in peak-to-peak amplitude. Due to an unwanted resonance in the antenna leads, the emitter-receiver pair produces a particularly strong line around 50 GHz, which causes ringing after the main pulse. This ringing is visible in the red shaded areas in Figure 3a, which is heavily attenuated by the filter, as shown in Figure 3c. The red shaded part of the pulse in Figure 3a has a peak at 3.5 mV, whereas this peak is reduced to 0.98 mV with the use of the filter. This is a reduction factor of 3.6 in amplitude of the unwanted resonance. The visibility of the filter effect is more pronounced in the frequency domain. The first peak at 43.47 GHz in Figure 3d is suppressed by 7.5 dB, as compared to Figure 3b, but it is still dominant considering the peak dynamic range. Therefore, we neglected it for the determination of the peak dynamic range. The peak dynamic range is 51 dB without and 48 dB with the filter. Using the filter decreased the bandwidth from 1.4 THz (without filter) to 1.3 THz (with filter).

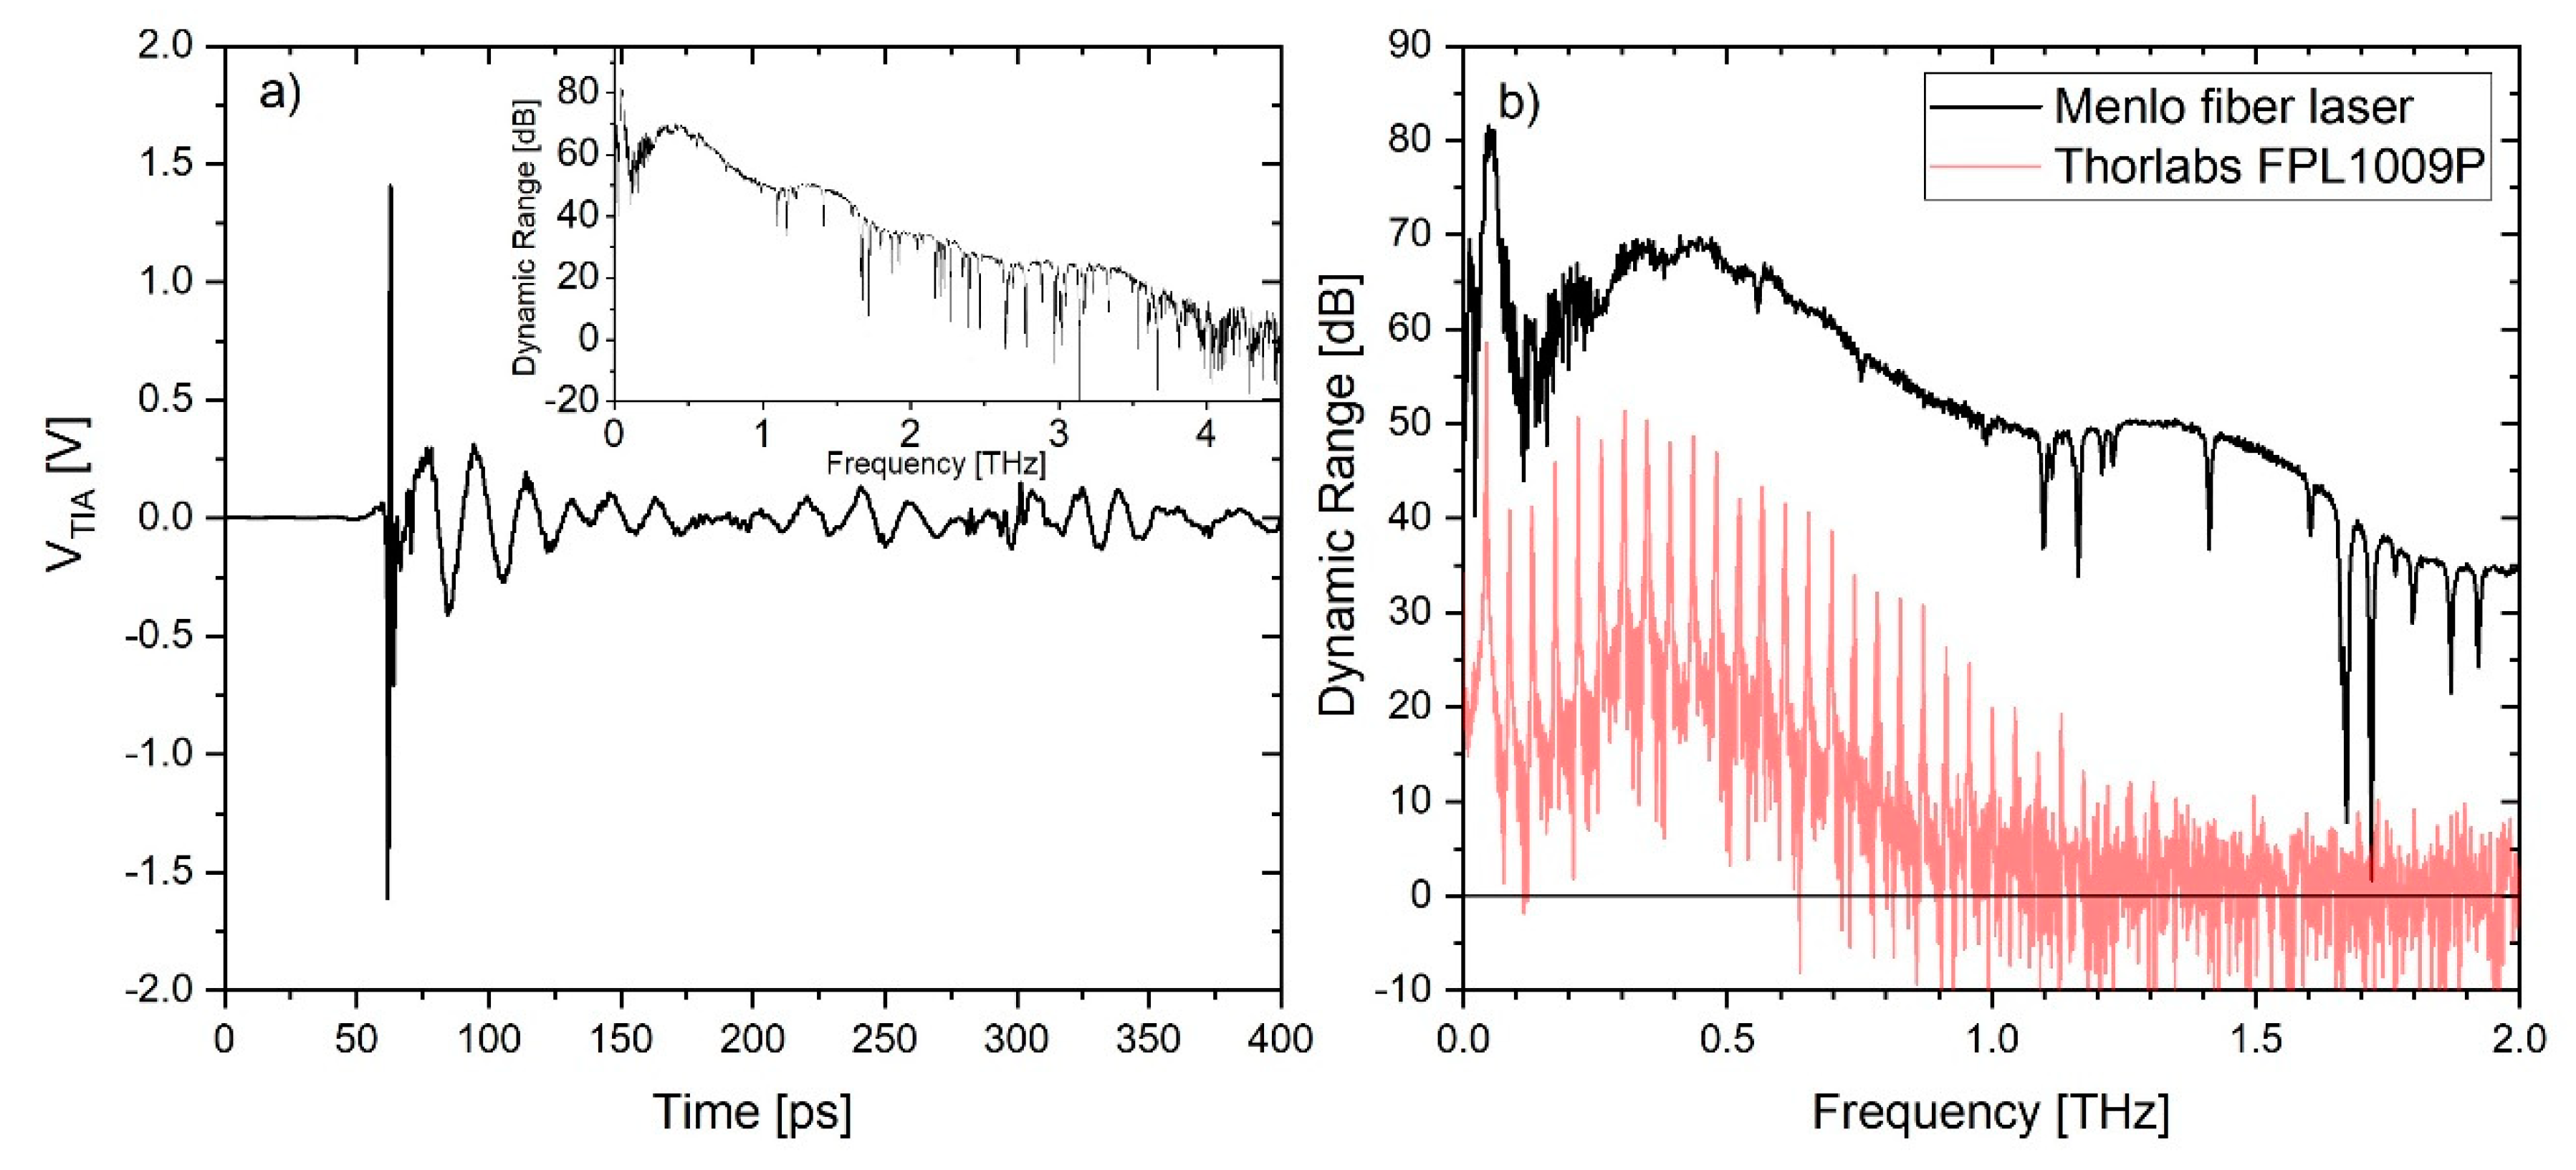
3.3. Comparison with Reference Laser System

In order to compare the results from the laser diode to a state-of-the-art fiber laser, we repeated the measurement with a Menlo Systems 1550 nm laser with a pulse duration shorter than 90 fs. The settings of the lock-in amplifier are kept as before, but the step size for the delay-line was reduced to 0.01 mm to resolve the higher bandwidth. The laser power is 45 mW at the emitter and 16 mW at the receiver side. For this measurement, the mesh filter is removed. The measured time-domain trace is depicted in Figure 4a. The system generates a single THz pulse. The low frequency oscillation after the pulse is due to the above described unwanted resonance of the antenna leads. The slight ripples after the main pulse originate from absorption due to water vapor.
Figure 4b shows the retrieved spectrum (black). The peak dynamic range is about 70 dB, while the bandwidth exceeds 4 THz. The water lines are clearly visible. For comparison, the spectrum from the laser diode driven system without mesh is plotted in light red.

4. Conclusions

In this work, we have demonstrated that a low-cost Fabry–Perot laser diode works very well to drive a THz TDS setup. We found that the commercially available laser diode is mode-locked. With 84 m of additional single mode fiber, the linear chirped pulse can be compressed to 544 fs. Without any further amplification, a THz pulse train is generated. The spectral bandwidth of the THz signal is 1.4 THz with a peak dynamic range of 51 dB from a single measurement.
For comparison, the measurement with the state-of-the-art fiber laser under otherwise same conditions shows a peak dynamic range of 70 dB and a bandwidth of more than 4 THz. Keeping in mind that the laser diode costs less than a tenth of the fiber laser, Fabry–Perot laser diodes are an excellent alternative to fiber lasers for future low-cost terahertz systems. For applications like the detection of water content of leaves or the detection of germinable sugar beet seeds, a bandwidth below 1 THz suffices [29,30]. These applications can be realized with this cheap and compact laser source. Further, we see that the bandwidth is now limited by the pulse duration of the laser. If the pulse duration can be further reduced, for example by the modulation of the laser diode as in Reference [31], the THz bandwidth may be further increased.

Author Contributions

Conceptualization, S.P. and J.C.B.; Data curation, K.-H.T. and F.F.; Formal analysis, K.-H.T.; Investigation, K.-H.T.; Software, K.K.; Supervision, S.P. and J.C.B.; Validation, K.K. and F.F.; Writing—original draft, K.-H.T.

Acknowledgments

Author S.P. acknowledges the Deutsche Forschungsgemeinschaft (DFG) for funding project number 278381540 (REPHCON). We acknowledge support by the Open Access Publication Fund of the University of Duisburg-Essen.

Conflicts of Interest

The authors declare no conflict of interest.

References

  1. Van Exter, M.; Fattinger, C.; Grischkowsky, D. Terahertz time-domain spectroscopy of water vapor. Opt. Lett. 1989, 14, 1128. [Google Scholar] [CrossRef]
  2. Jepsen, P.U.; Cooke, D.G.; Koch, M. Terahertz spectroscopy and imaging—Modern techniques and applications. Laser Photon. Rev. 2011, 5, 124–166. [Google Scholar] [CrossRef]
  3. Hu, B.B.; Nuss, M.C. Imaging with terahertz waves. Opt. Lett. 1995, 20, 1716. [Google Scholar] [CrossRef]
  4. Sartorius, B.; Roehle, H.; Künzel, H.; Böttcher, J.; Schlak, M.; Stanze, D.; Venghaus, H.; Schell, M. All-fiber terahertz time-domain spectrometer operating at 1.5 μm telecom wavelengths. Opt. Express 2008, 16, 9565. [Google Scholar] [CrossRef] [PubMed]
  5. Palka, N.; Panowicz, R.; Ospald, F.; Beigang, R. 3D Non-destructive Imaging of Punctures in Polyethylene Composite Armor by THz Time Domain Spectroscopy. J. Infrared Millim. Terahertz Waves 2015, 36, 770–788. [Google Scholar] [CrossRef] [Green Version]
  6. Kusano, M. Non-destructive evaluation by terahertz spectroscopy for penetration of acid solutions into epoxy resin. Express Polym. Lett. 2016, 10, 941–949. [Google Scholar] [CrossRef]
  7. Abdul-Munaim, A.M.; Aller, M.M.; Preu, S.; Watson, D.G. Discriminating gasoline fuel contamination in engine oil by terahertz time-domain spectroscopy. Tribol. Int. 2018, 119, 123–130. [Google Scholar] [CrossRef]
  8. Redo-Sanchez, A.; Salvatella, G.; Galceran, R.; Roldós, E.; García-Reguero, J.-A.; Castellari, M.; Tejada, J. Assessment of terahertz spectroscopy to detect antibiotic residues in food and feed matrices. Analyst 2011, 136, 1733. [Google Scholar] [CrossRef] [PubMed]
  9. Gowen, A.A.; O’Sullivan, C.; O’Donnell, C.P. Terahertz time domain spectroscopy and imaging: Emerging techniques for food process monitoring and quality control. Trends Food Sci. Technol. 2012, 25, 40–46. [Google Scholar] [CrossRef] [Green Version]
  10. Mathanker, S.K.; Weckler, P.R.; Wang, N. Terahertz (THz) Applications in Food and Agriculture: A Review. Trans. ASABE 2013, 56, 1213–1226. [Google Scholar]
  11. Stübling, E.-M.; Rehn, A.; Siebrecht, T.; Bauckhage, Y.; Öhrström, L.; Eppenberger, P.; Balzer, J.C.; Rühli, F.; Koch, M. Application of a robotic THz imaging system for sub-surface analysis of ancient human remains. Sci. Rep. 2019, 9, 3390. [Google Scholar] [CrossRef] [PubMed]
  12. Cosentino, A. Terahertz and Cultural Heritage Science: Examination of Art and Archaeology. Technologies 2016, 4, 6. [Google Scholar] [CrossRef]
  13. Cacciari, I.; Siano, S. Use of THz Reflectometry for Roughness Estimations of Archeological Metal Surfaces. J. Infrared Millimeter. Terahertz Waves 2017, 38, 503–517. [Google Scholar] [CrossRef]
  14. Hochrein, T. Markets, Availability, Notice, and Technical Performance of Terahertz Systems: Historic Development, Present, and Trends. J. Infrared Millimeter. Terahertz Waves 2015, 36, 235–254. [Google Scholar] [CrossRef]
  15. Vasil’ev, P.P. Ultrashort pulse generation in diode lasers. Opt. Quantum Electron. 1992, 24, 801–824. [Google Scholar] [CrossRef]
  16. Balzer, J.C.; Pilny, R.H.; Dopke, B.; Klehr, A.; Erbert, G.; Trankle, G.; Brenner, C.; Hofmann, M.R. Passively Mode-Locked Diode Laser With Optimized Dispersion Management. IEEE J. Sel. Top. Quantum Electron. 2015, 21, 16–23. [Google Scholar] [CrossRef]
  17. Delfyett, P.J.; Florez, L.; Stoffel, N.; Gmitter, T.; Andreadakis, N.; Silberberg, Y.; Heritage, J.P.; Alphonse, G.A. High-power ultrafast laser diodes. IEEE J. Quantum Electron. 1992, 28, 2203–2219. [Google Scholar] [CrossRef]
  18. Tani, M.; Matsuura, S.; Sakai, K.; Hangyo, M. Multiple-frequency generation of sub-terahertz radiation by multimode LD excitation of photoconductive antenna. IEEE Microw. Guid. Wave Lett. 1997, 7, 282–284. [Google Scholar] [CrossRef]
  19. Tani, M.; Morikawa, O.; Matsuura, S.; Hangyo, M. Generation of terahertz radiation by photomixing with dual- and multiple-mode lasers. Semicond. Sci. Technol. 2005, 20, S151–S163. [Google Scholar] [CrossRef]
  20. Scheller, M.; Koch, M. Terahertz quasi time domain spectroscopy. Opt. Express 2009, 17, 17723. [Google Scholar] [CrossRef]
  21. Brenner, C.; Hofmann, M.; Scheller, M.; Shakfa, M.K.; Koch, M.; Mayorga, I.C.; Klehr, A.; Erbert, G.; Tränkle, G. Compact diode-laser-based system for continuous-wave and quasi-time-domain terahertz spectroscopy. Opt. Lett. 2010, 35, 3859. [Google Scholar] [CrossRef] [PubMed]
  22. Kohlhaas, R.B.; Rehn, A.; Nellen, S.; Koch, M.; Schell, M.; Dietz, R.J.B.; Balzer, J.C. Terahertz quasi time-domain spectroscopy based on telecom technology for 1550 nm. Opt. Express 2017, 25, 12851. [Google Scholar] [CrossRef] [PubMed]
  23. Molter, D.; Kolano, M.; von Freymann, G. Terahertz cross-correlation spectroscopy driven by incoherent light from a superluminescent diode. Opt. Express 2019, 27, 12659. [Google Scholar] [CrossRef] [PubMed]
  24. Merghem, K.; Busch, S.F.; Lelarge, F.; Koch, M.; Ramdane, A.; Balzer, J.C. Terahertz Time-Domain Spectroscopy System Driven by a Monolithic Semiconductor Laser. J. Infrared Millim. Terahertz Waves 2017, 38, 958–962. [Google Scholar] [CrossRef]
  25. Rosales, R.; Murdoch, S.G.; Watts, R.T.; Merghem, K.; Martinez, A.; Lelarge, F.; Accard, A.; Barry, L.P.; Ramdane, A. High performance mode locking characteristics of single section quantum dash lasers. Opt. Express 2012, 20, 8649. [Google Scholar] [CrossRef] [PubMed]
  26. Calò, C.; Schmeckebier, H.; Merghem, K.; Rosales, R.; Lelarge, F.; Martinez, A.; Bimberg, D.; Ramdane, A. Frequency-resolved optical gating measurements of sub-ps pulses from InAs/InP quantum dash based mode-locked lasers. In Proceedings of the 2013 International Conference on Indium Phosphide and Related Materials (IPRM), Kobe, Japan, 19–23 May 2013; Volume 22, pp. 10835–10840. [Google Scholar]
  27. Nandi, U.; Norman, J.C.; Gossard, A.C.; Lu, H.; Preu, S. 1550-nm Driven ErAs: In(Al)GaAs Photoconductor-Based Terahertz Time Domain System with 6.5 THz Bandwidth. J. Infrared Millim. Terahertz Waves 2018, 39, 340–348. [Google Scholar] [CrossRef]
  28. Duill, S.P.O.; Murdoch, S.G.; Watts, R.T.; Rosales, R.; Ramdane, A.; Landais, P.; Barry, L.P. Simple dispersion estimate for single-section quantum-dash and quantum-dot mode-locked laser diodes. Opt. Lett. 2016, 41, 5676. [Google Scholar] [CrossRef] [PubMed]
  29. Gente, R.; Busch, S.F.; Stubling, E.-M.; Schneider, L.M.; Hirschmann, C.B.; Balzer, J.C.; Koch, M. Quality Control of Sugar Beet Seeds With THz Time-Domain Spectroscopy. IEEE Trans. Terahertz Sci. Technol. 2016, 6, 1–3. [Google Scholar] [CrossRef]
  30. Gente, R.; Rehn, A.; Probst, T.; Stübling, E.M.; Camus, E.C.; Covarrubias, A.A.; Balzer, J.C.; Koch, M. Outdoor Measurements of Leaf Water Content Using THz Quasi Time-Domain Spectroscopy. J. Infrared Millim. Terahertz Waves 2018, 39, 943–948. [Google Scholar] [CrossRef]
  31. Rehn, A.; Mikerov, M.; Preu, S.; Koch, M.; Balzer, J.C. Enhancing the performance of THz quasi time-domain spectroscopy systems by low duty cycle laser operation. Opt. Express 2018, 26, 32758. [Google Scholar] [CrossRef]
Figure 1. Schematic of the THz TDS setup. The red part shows the setup used for the analysis of the laser characteristics of the monolithic Fabry–Perot laser diode and polarization management for the input signal of the THz system. The laser chirp can be compensated with a SMF (single mode fiber) of variable length. The blue part shows a classical TDS setup with a delay-line, the THz optics, and ErAs:In(Al)GaAs emitter (Tx) and ErAs:In(Al)GaAs receiver (Rx) with the needed electrical devices for data acquisition and THz signal generation.
Applsci 09 02704 g001
Figure 2. (a) Shows the spectrum of the FPL1009P. The total fiber length in (a,b) is 84 m. (b) Shows the autocorrelation function after dispersion compensation with 84 m SMF (black) and 14 m (gray), the simulated autocorrelation function (ACF) with a residual chirp (red), and with perfect chirp compensation (green). The measured FWHM is 762 fs, which corresponds to a deconvoluted pulse duration of 544 fs.
Applsci 09 02704 g002
Figure 3. THz TDS time-domain traces (a) VP2P = 14.1 mV and (c) VP2P = 8.3 mV and spectra (b,d) with the FPL1009P laser diode. (a,b) are recorded without high pass mesh-filter. (c,d) with high pass mesh filter. (b) has a peak dynamic range of 51 dB and 1.4 THz bandwidth and (d) with filter: 48 dB and 1.3 THz.
Applsci 09 02704 g003
Figure 4. THz-TDS time-trace (a) and spectrum (b) with the commercial Menlo System and the FPL1009P. The black spectrum has a dynamic range of 70 dB and a bandwidth of more than 4 THz. The light red spectrum has a bandwidth of 1.4 THz and a peak dynamic range of 51 dB.
Applsci 09 02704 g004

