Simultaneous In-Cylinder Flow Measurement and Flame Imaging in a Realistic Operating Engine Environment Using High-Speed PIV

Abstract
:1. Introduction
2. Materials and Methods
2.1. Engine Specifications and Operating Conditions
2.2. High-Speed PIV
2.3. High-Speed Flame Tomography
3. Results and Discussions
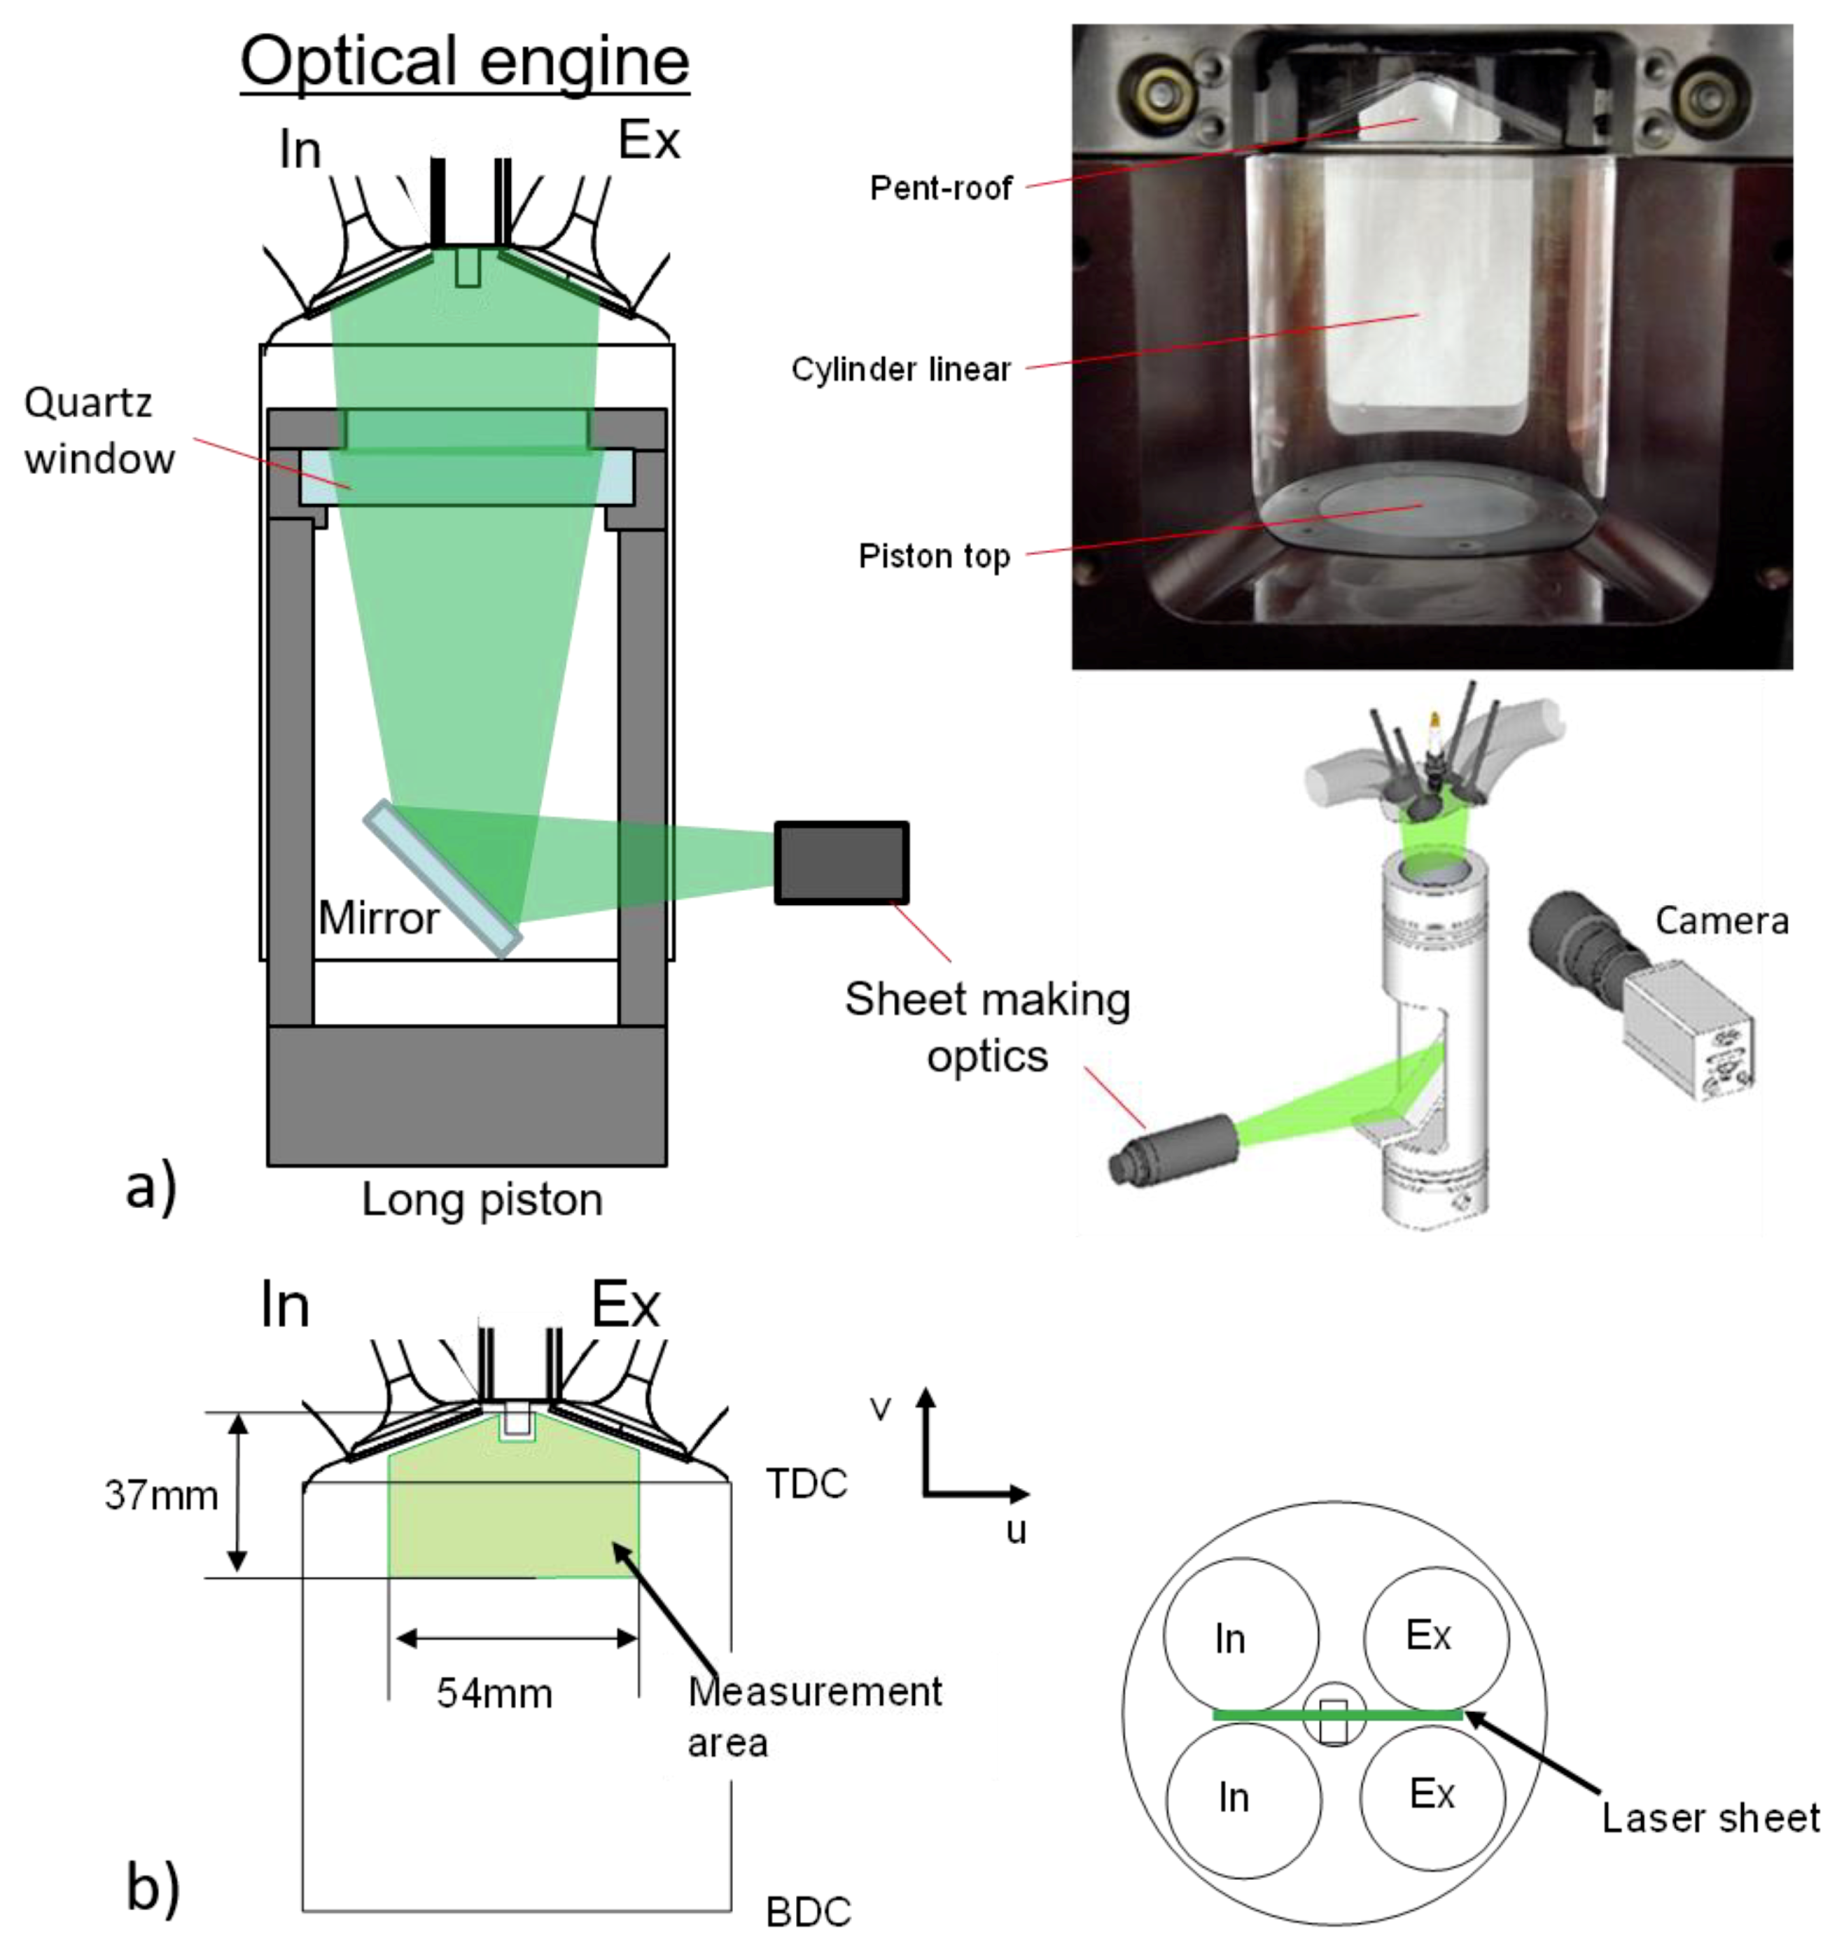
3.1. Considerations for Diagnostics Setup
3.2. Data Processing and Validation
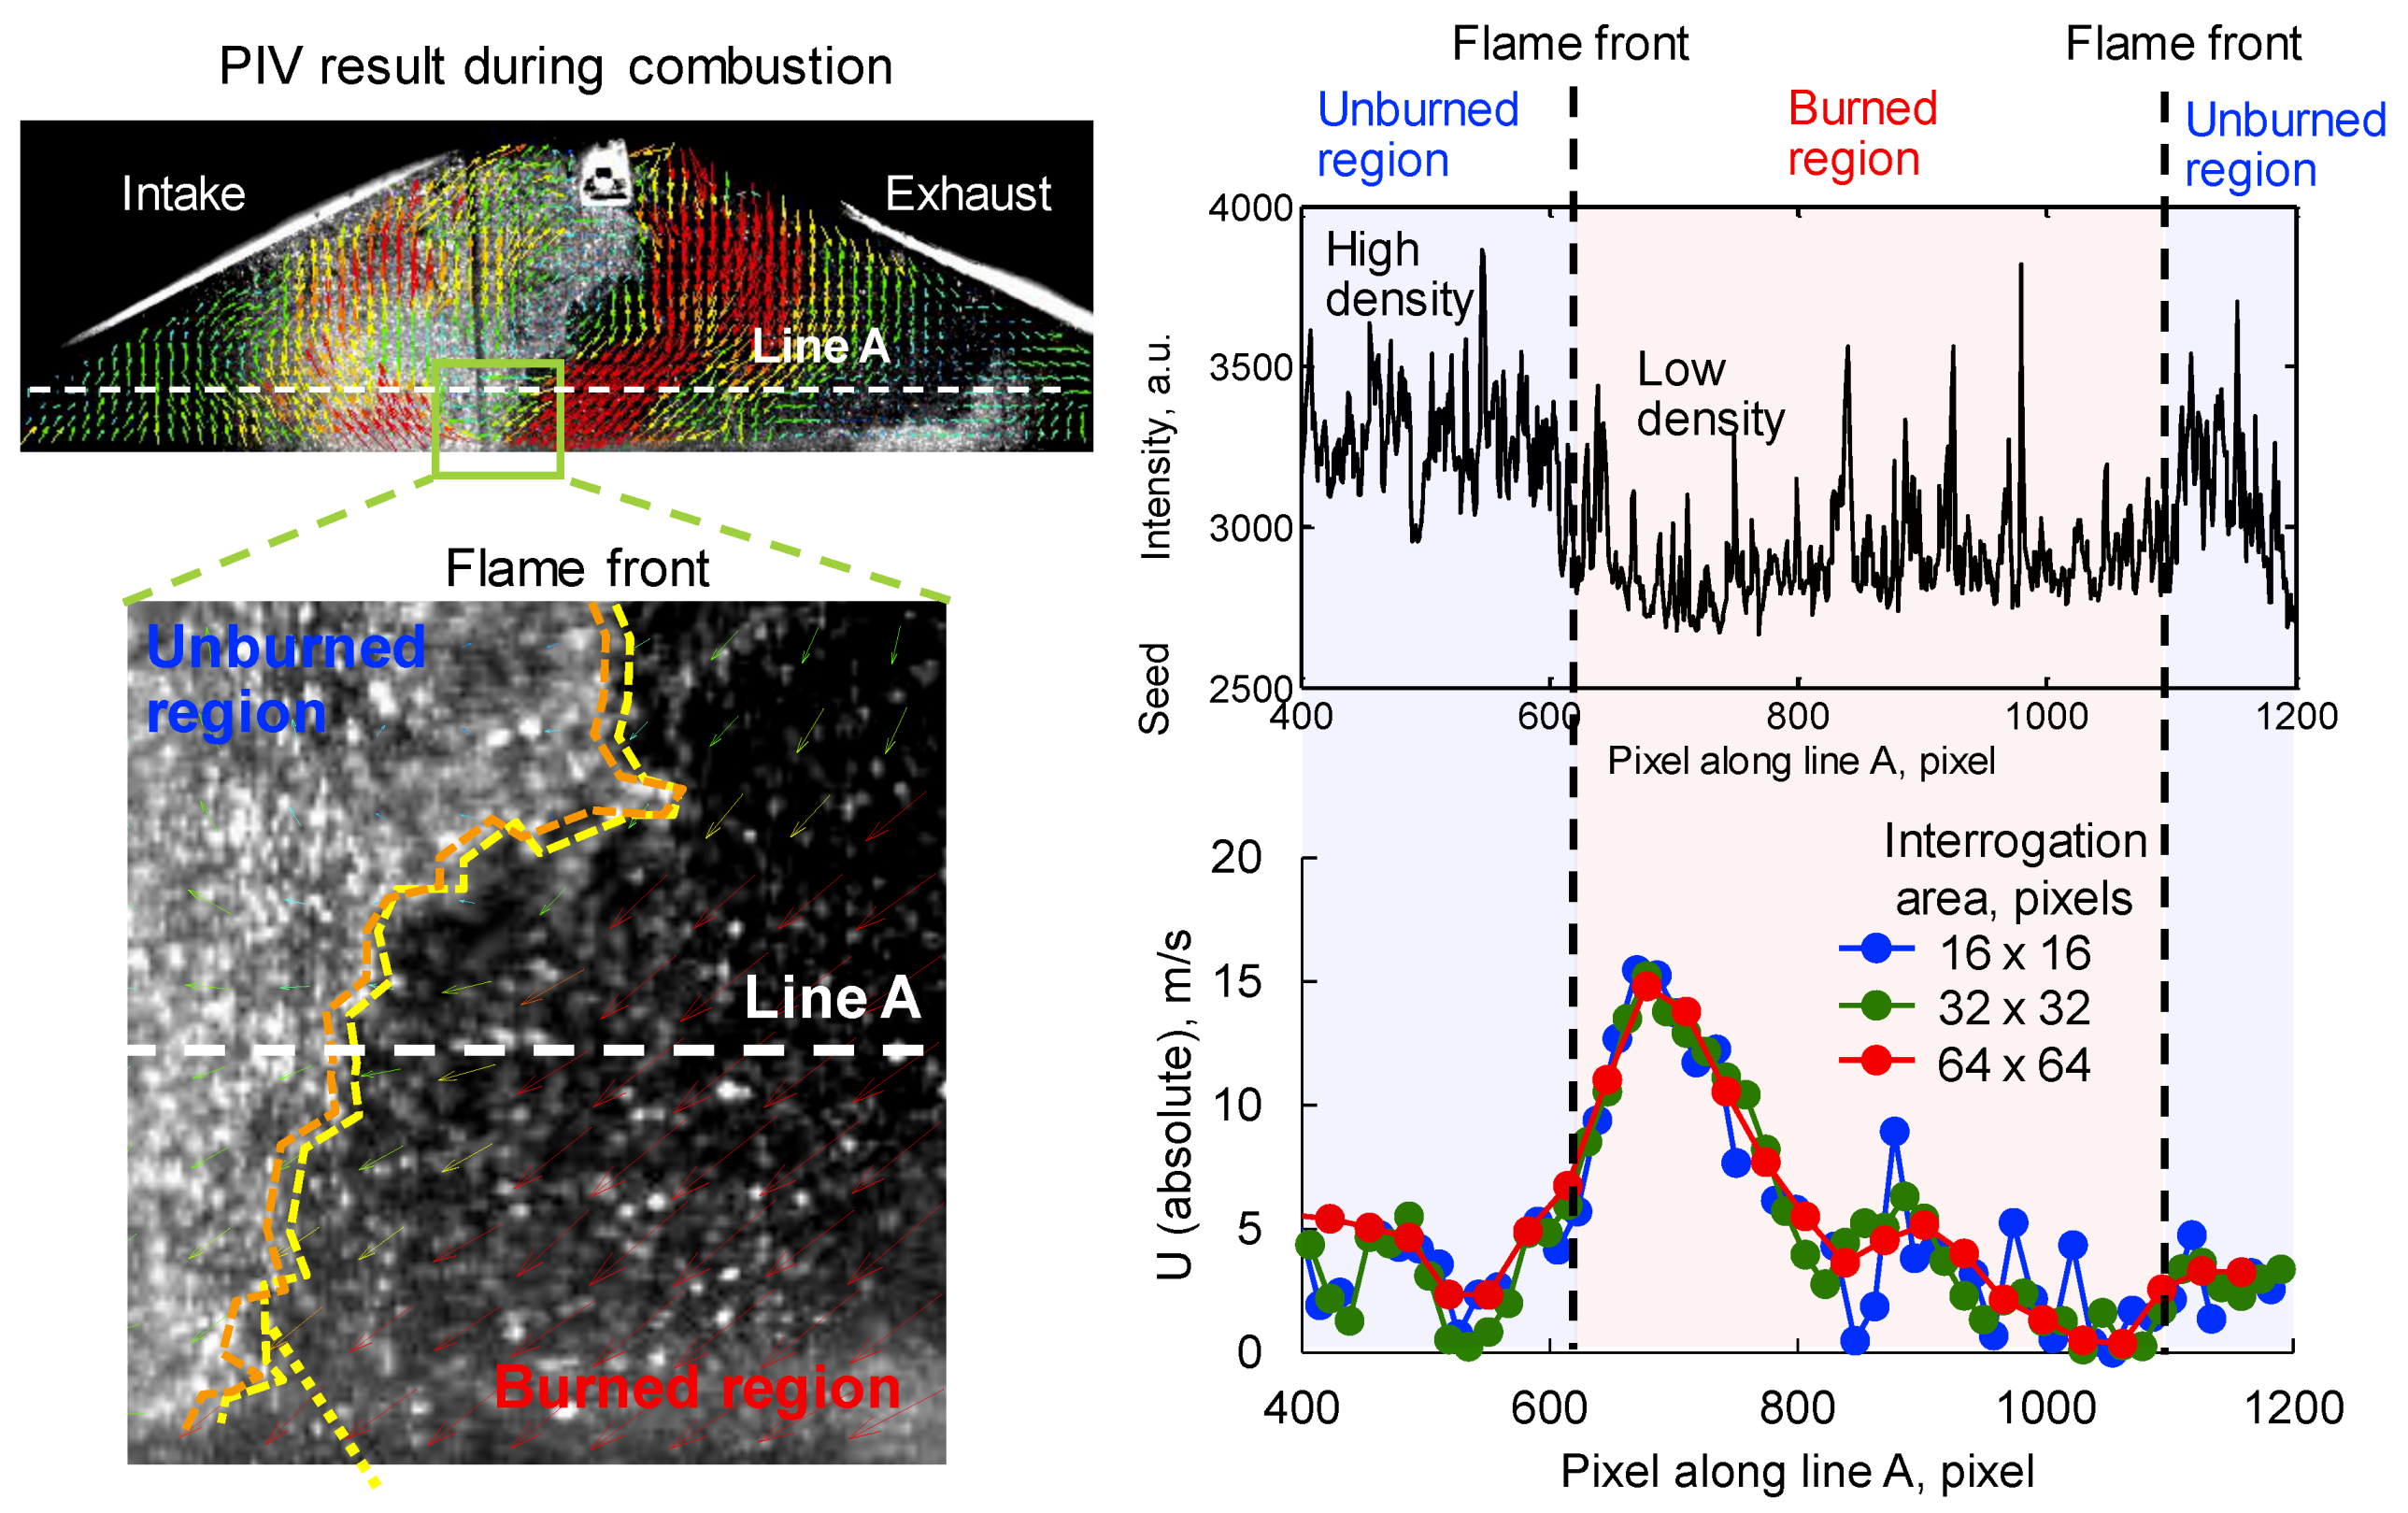
3.2.1. PIV Processing
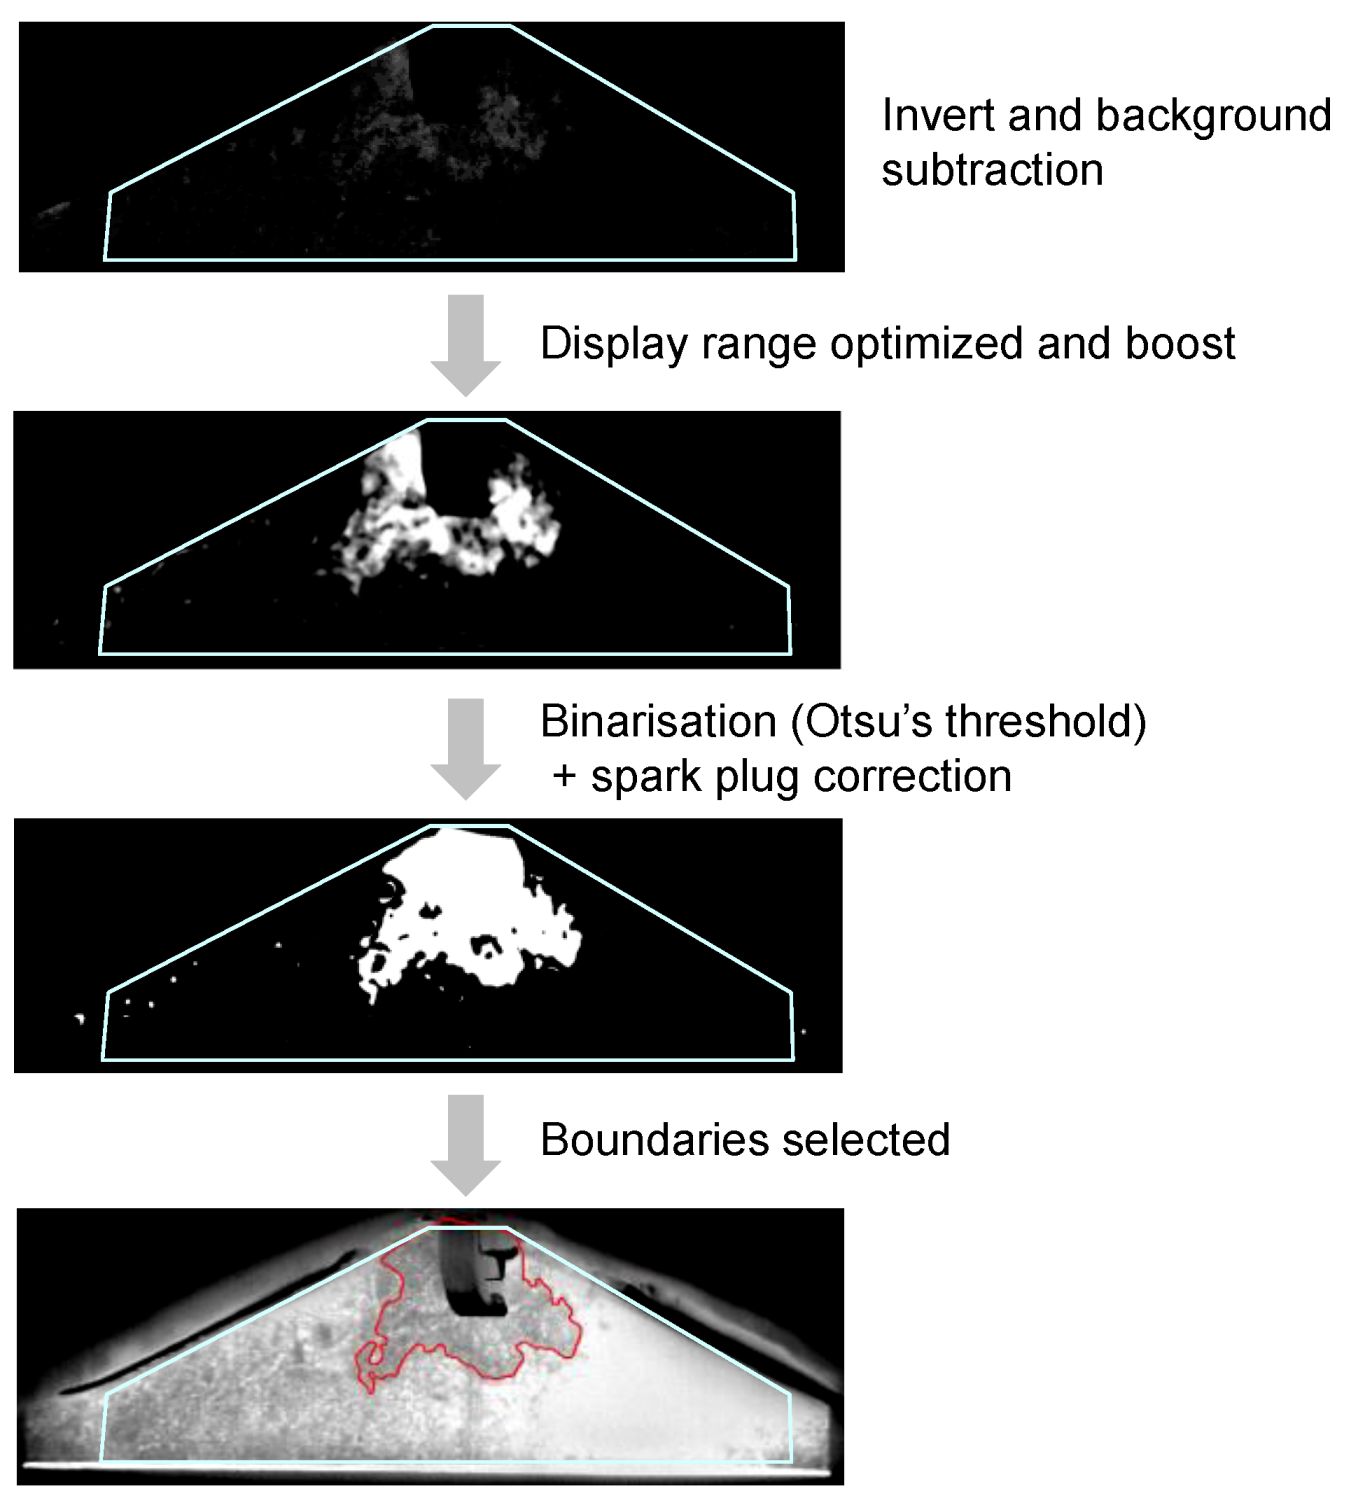
3.2.2. Flame Analysis
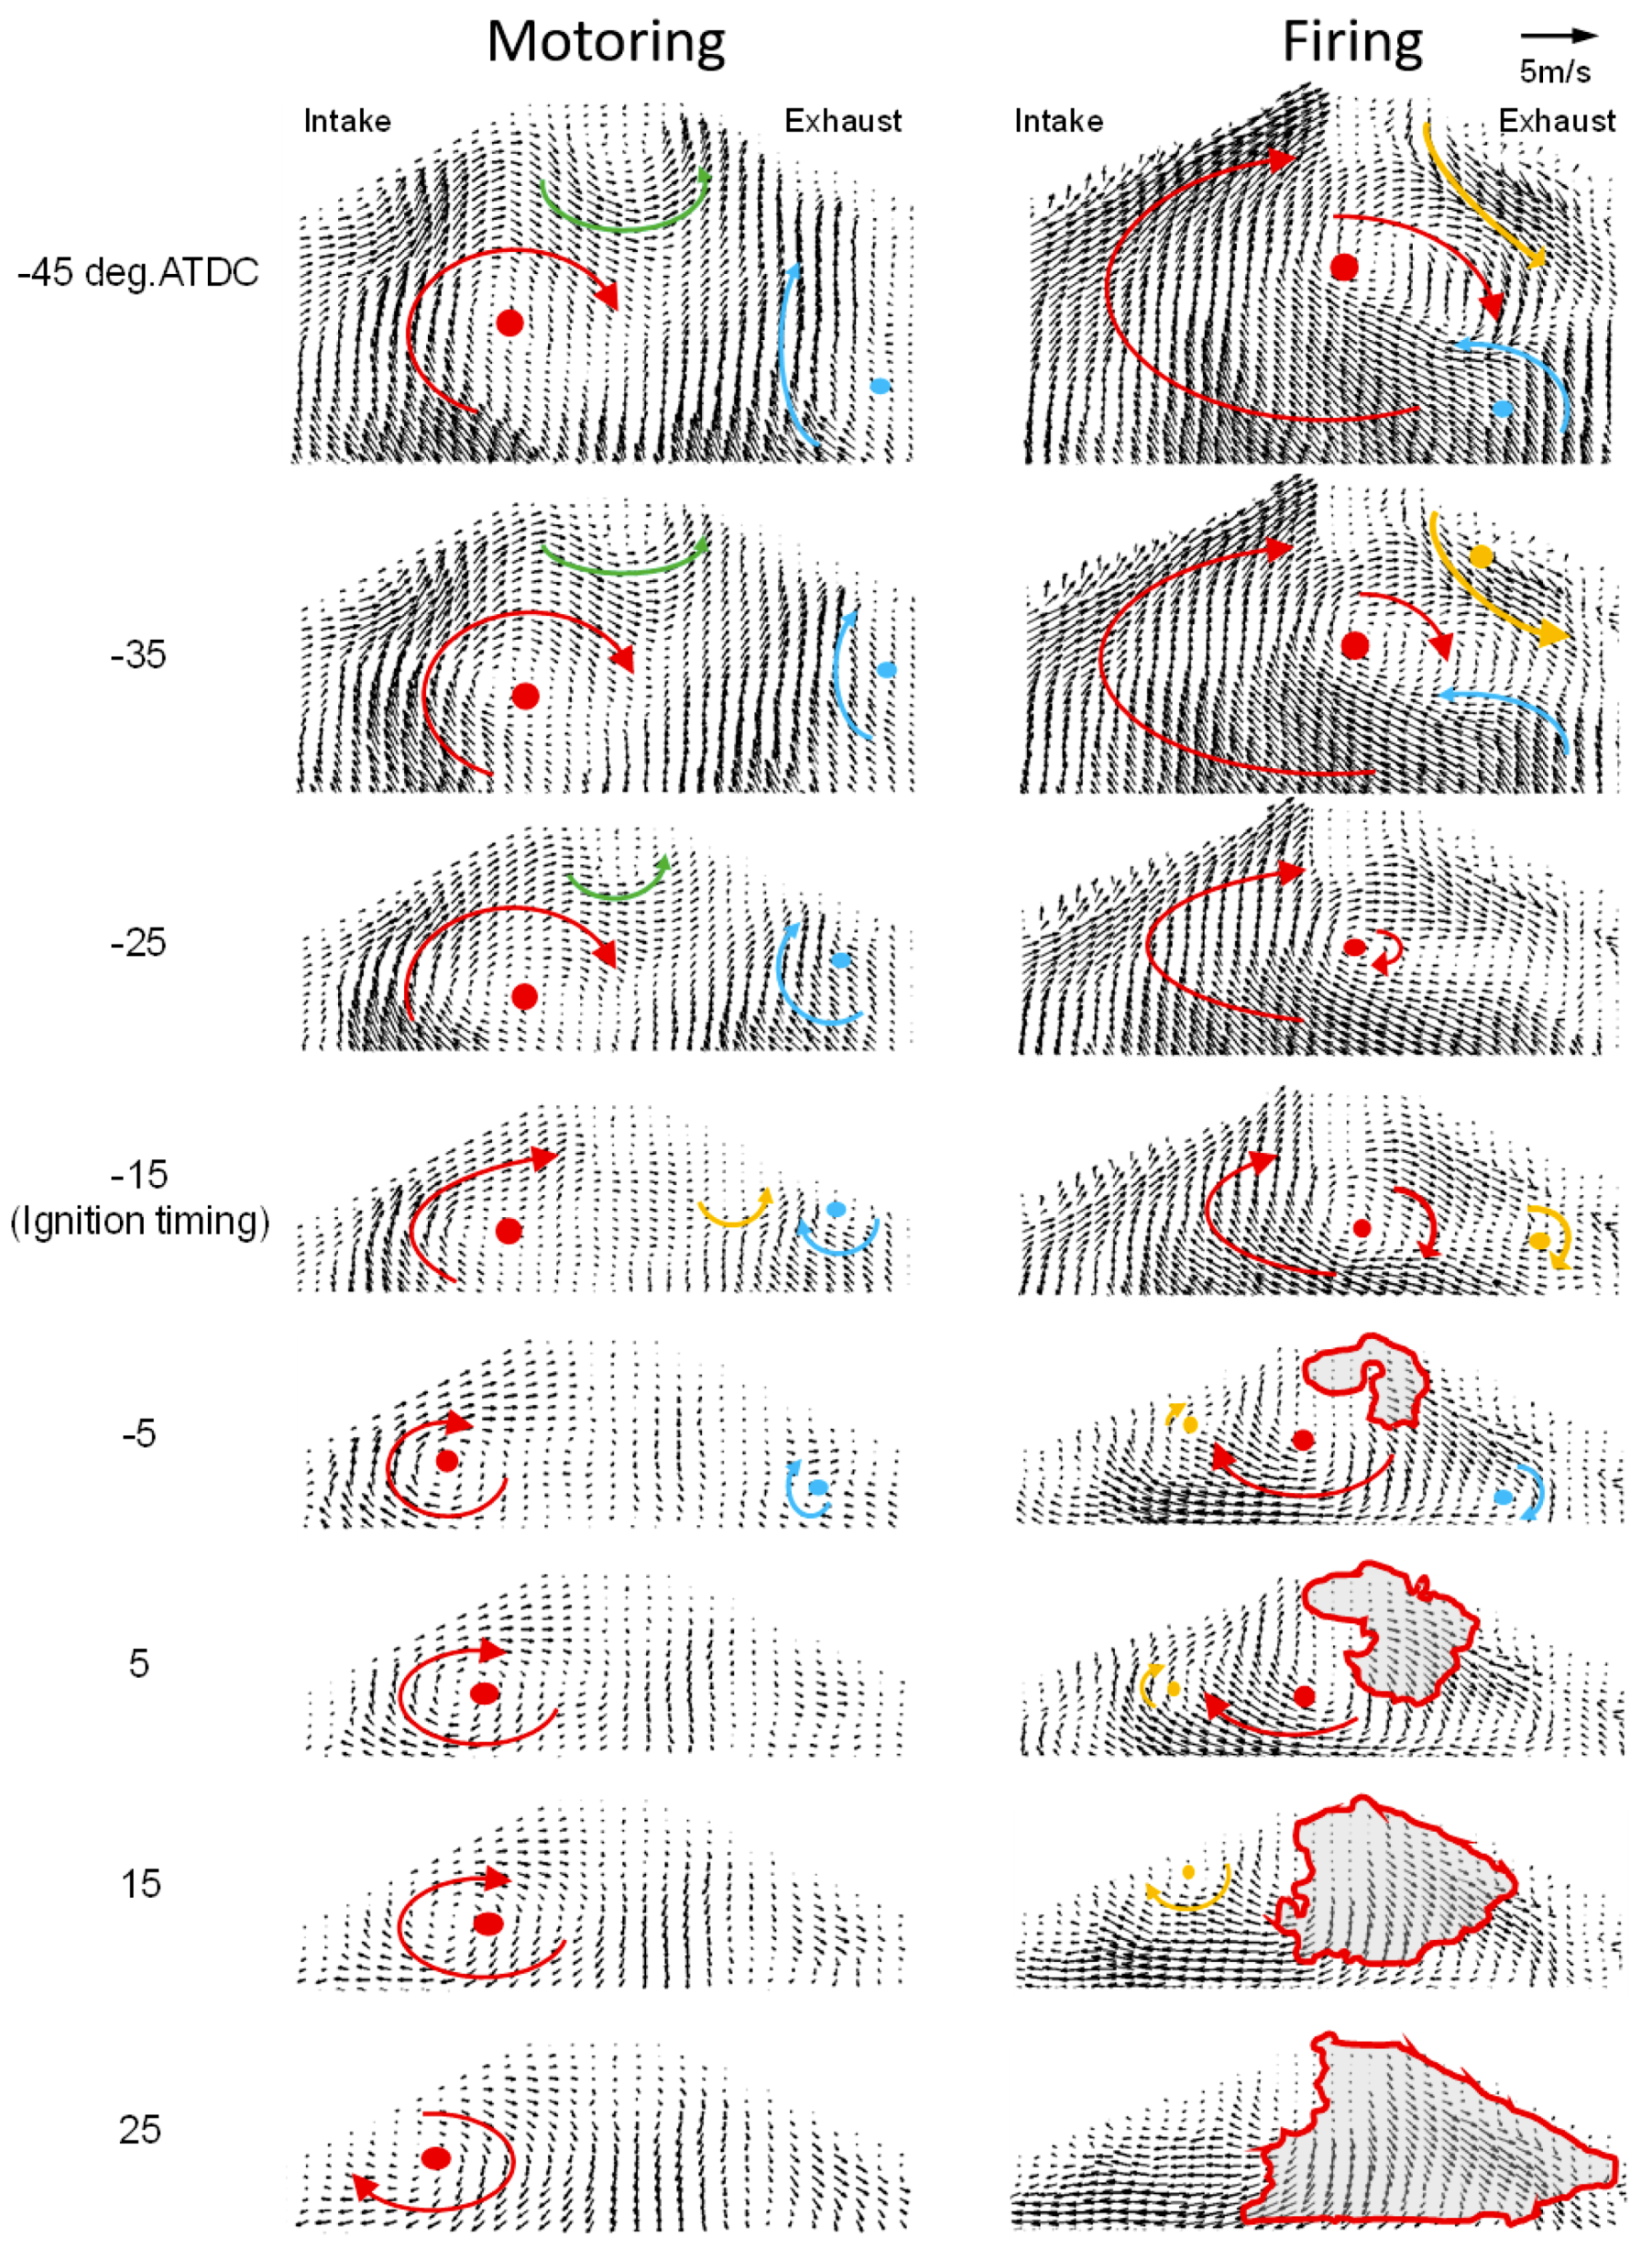
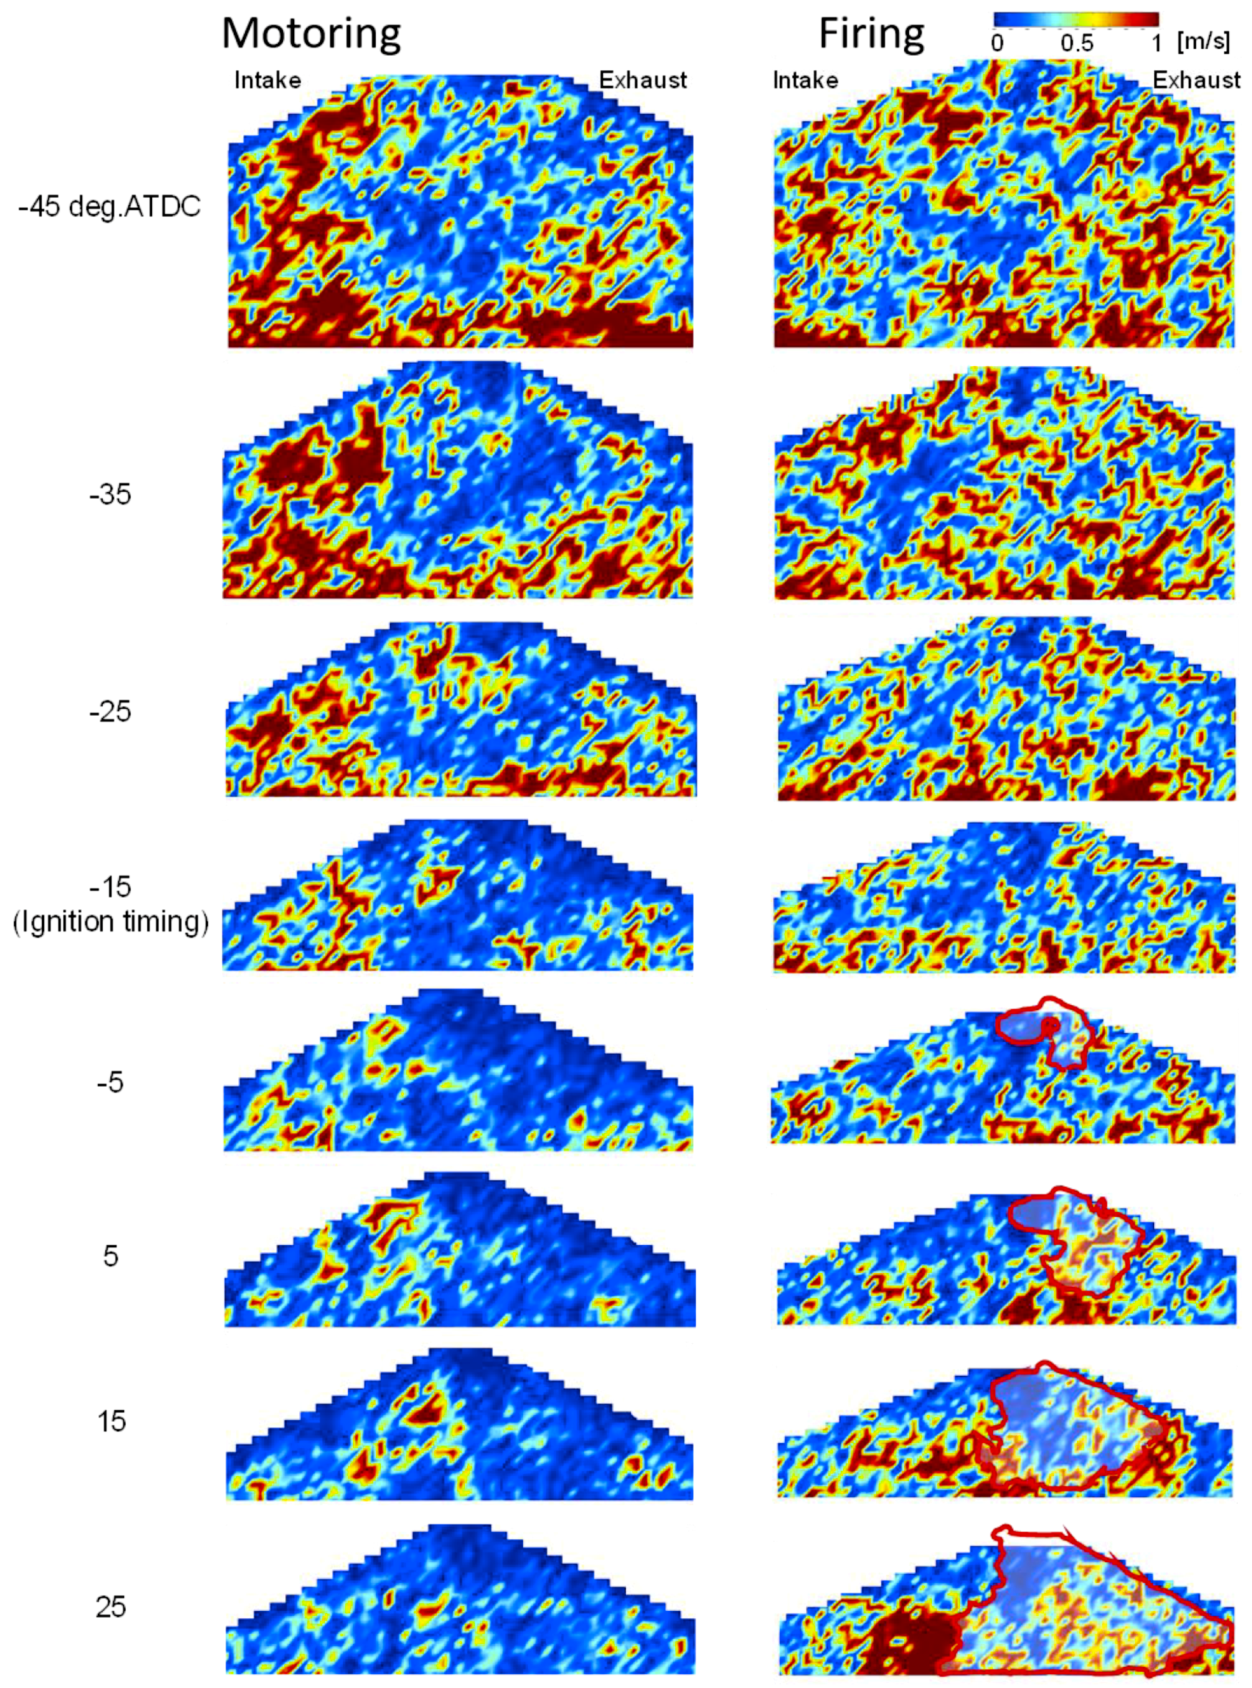
3.3. Differences Between Firing and Motoring
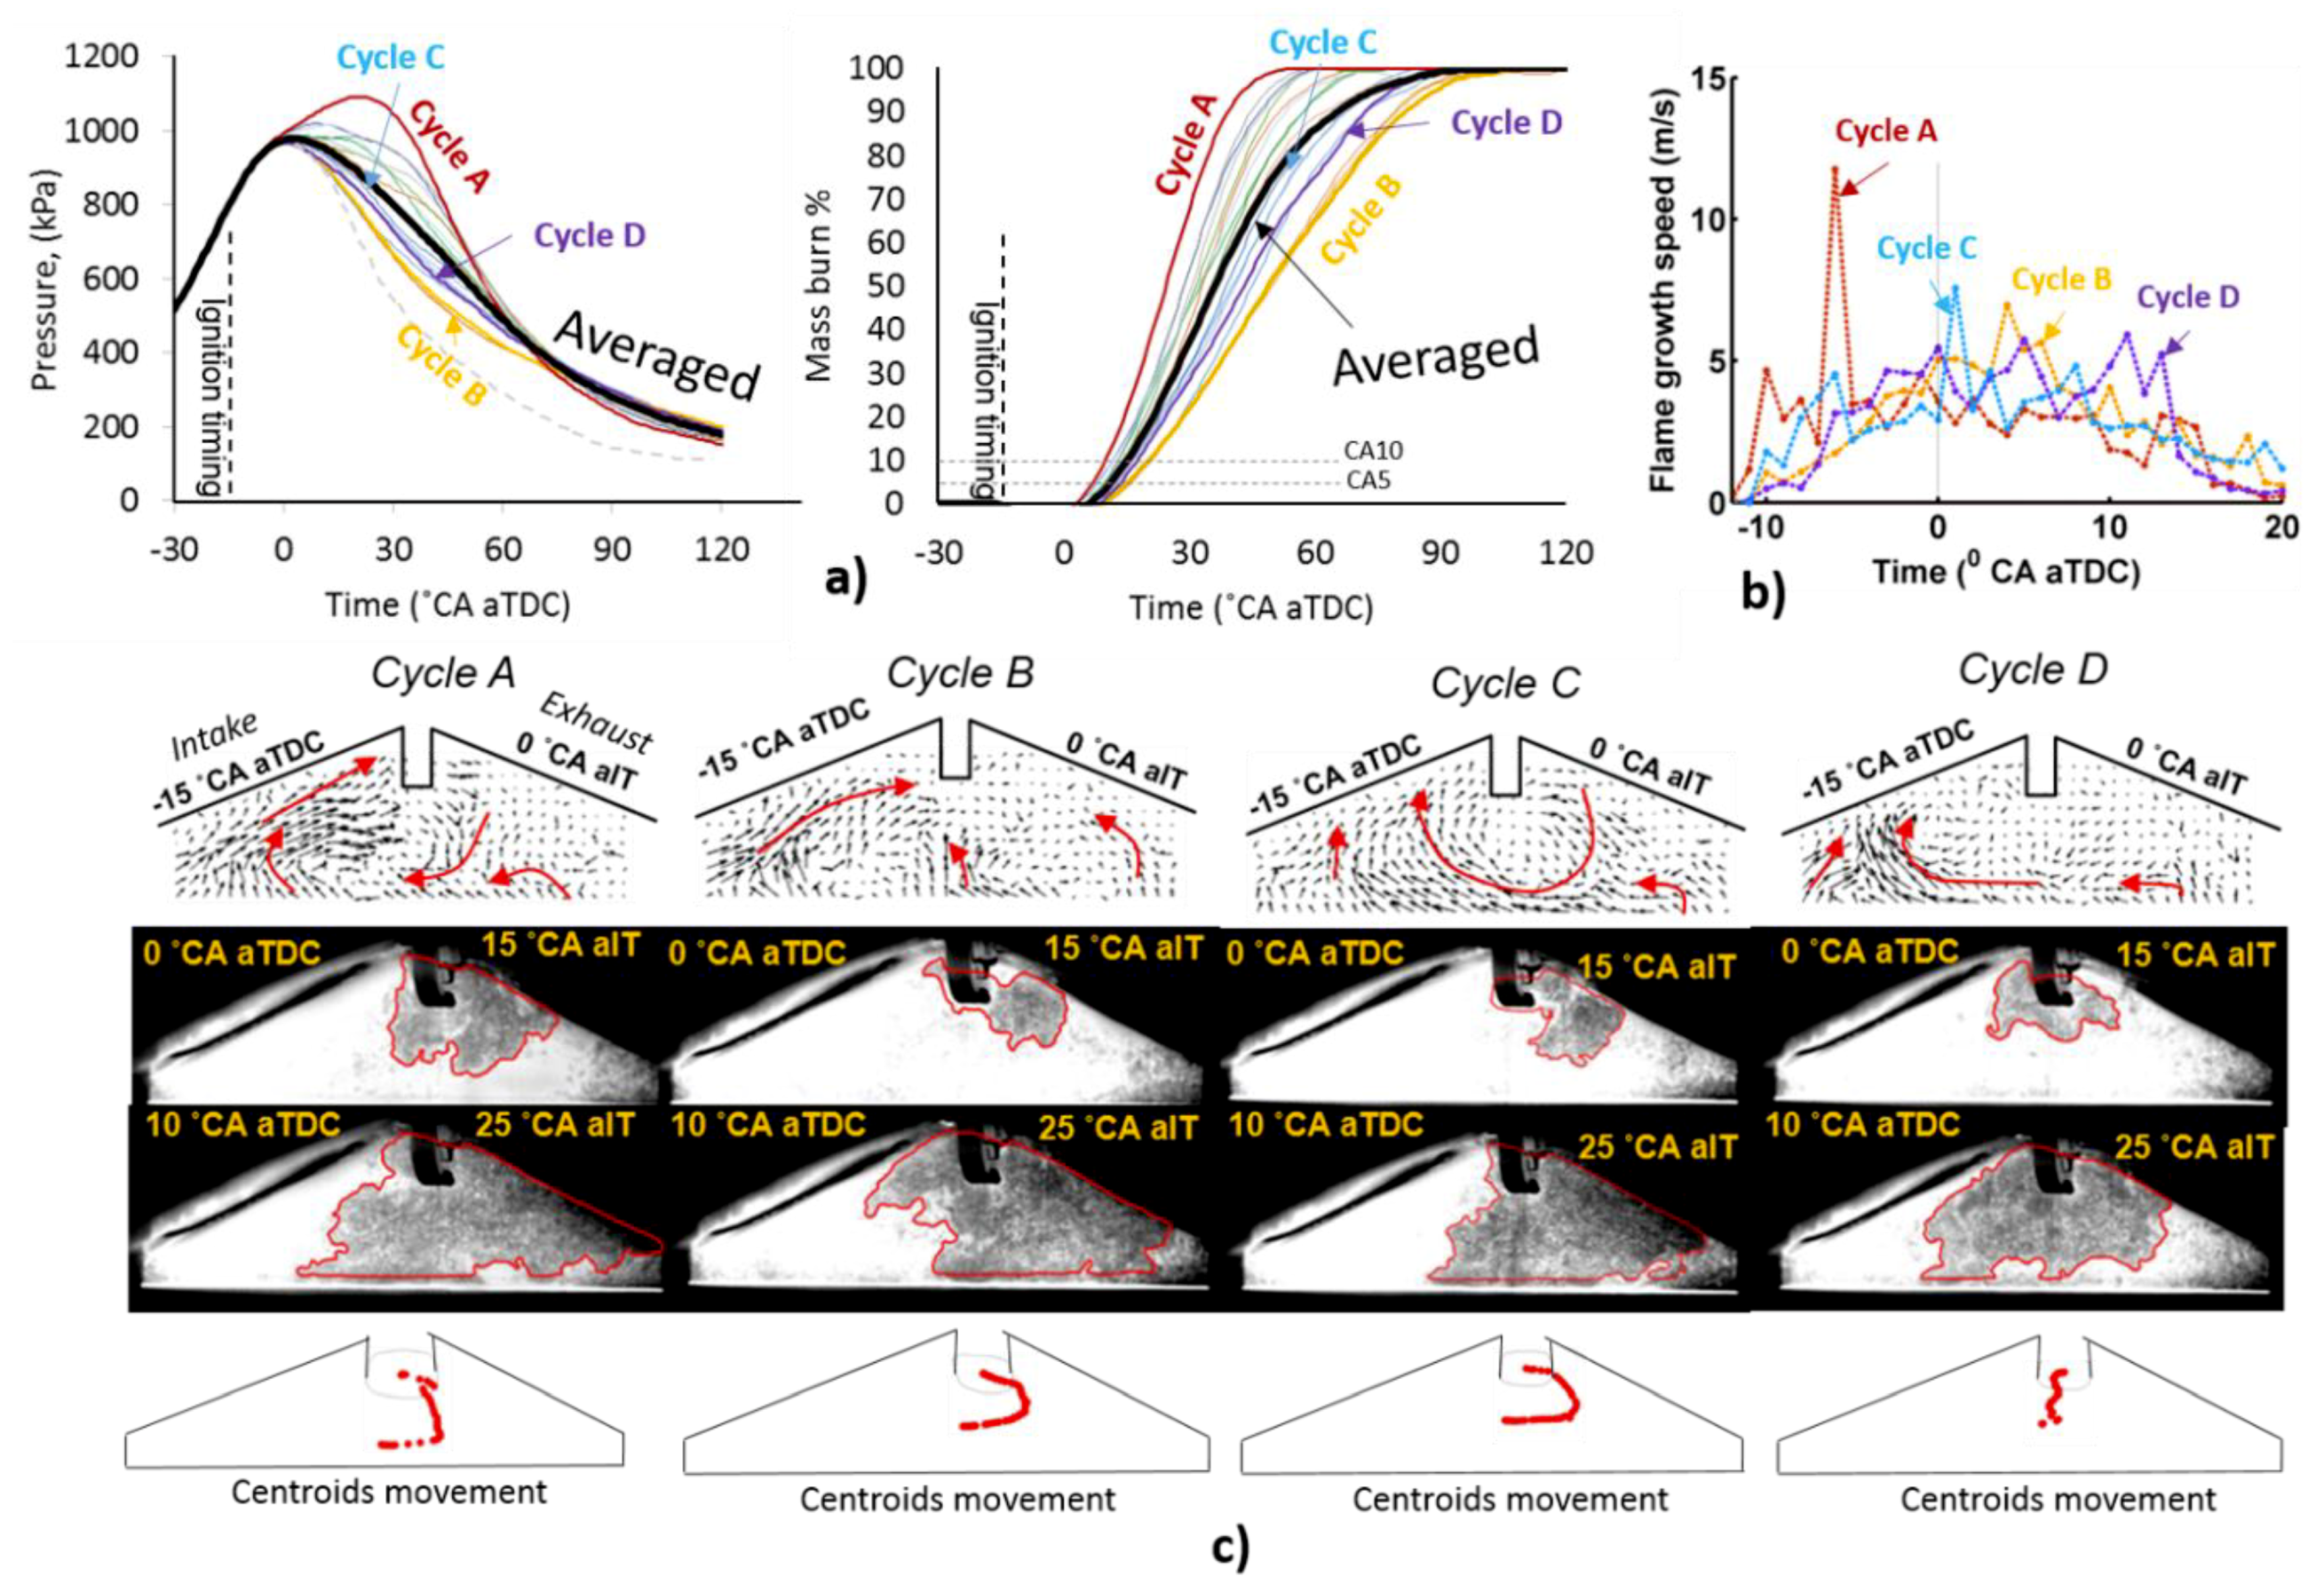
3.4. Connection to Cyclic Variations and Combustion Performance
4. Conclusions
Author Contributions
Funding
Conflicts of Interest
References
- Nogawa, S.; Nataka, K.; Mohammadi, A. Effect of ignition system on combustion. In Proceedings of the 1st International Conference: Advanced Ignition System for Gasoline Engines, Berlin, Germany, 12–13 November 2012. [Google Scholar]
- Le Coz, J. Cycle-to-Cycle Correlations between Flow Field and Combustion Initiation in an S.I. Engine; SAE Technical Paper 920517; SAE International: Warrendale, PA, USA, 1992; p. 15. [Google Scholar]
- Abdel-Gayed, R.G.; Bradley, D.; Lawes, M. Turbulent Burning Velocities: A General Correlation in Terms of Straining Rates. Proc. R. Soc. Lond. A. 1987, 414, 389. [Google Scholar] [CrossRef]
- Nishiyama, A.; Furui, T.; Ikeda, Y. Development of M12 Type Plug-in LDV Probe for Evaluation of Flow Field near Spark Location in SI Engine. In Proceedings of the 17th International Symposium on Applications of Laser Techniques of Fluid Mechanics, Lisbon, Portugal, 7–10 July 2014. [Google Scholar]
- Ikeda, Y.; Nishiyama, A.; Furui, T.; Wachi, Y. PIV/LDV combination for optimum turbulence generation scheme to spark ignition in wide operating condition of SI engine. In Proceedings of the 16th International Symposium on Applications of Laser Techniques to Fluid Mechanics, Lisbon, Portugal, 9–12 July 2012. [Google Scholar]
- Okura, Y.; Segawa, M.; Onimaru, H.; Urata, Y.; Tanahashi, M. Analysis of in-cylinder flow for a boosted GDI engine using high-speed particle image velocimetry. In Proceedings of the 17th International Symposium on Applications of Laser Techniques to Fluid Mechanics, Lisbon, Portugal, 7–10 July 2014. [Google Scholar]
- Sick, V. High speed imaging in fundamental and applied combustion research. Proc Comb. Inst. 2013, 34, 3509–3530. [Google Scholar] [CrossRef]
- Voisine, M.; Thomas, L.; Boree, J.; Rey, P. Spatio-temporal structure and cycle to cycle variations of an in-cylinder tumbling flow. Exp. Fluids 2011, 50, 1393–1407. [Google Scholar] [CrossRef]
- Chi, T.; Zhai, G.; Kook, S.; Chan, Q.; Hawkes, E. Application of LED-based thermographic phosphorescent technique to diesel combustion chamber walls in a pre-burn-type optical constant-volume vessel. Exp. Fluids 2019, 60, 58. [Google Scholar] [CrossRef]
- Clark, L.; Kook, S.; Chan, Q.; Hawkes, E. Multiple Injection Strategy Investigation for Well-Mixed Operation in an Optical Wall-Guided Spark-Ignition Direct-Injection (WG-SIDI) Engine through Flame Shape Analysis; SAE Technical Paper 2016-01-2162; SAE International: Warrendale, PA, USA, 2016; p. 12. [Google Scholar]
- Clark, L.; Kook, S.; Chan, Q.; Hawkes, E. Influence of Injection Timing for Split-Injection Strategies on Well-Mixed High-Load Combustion Performance in an Optically Accessible Spark-Ignition Direct-Injection (SIDI) Engine; SAE Technical Paper 2017-01-0657; SAE International: Warrendale, PA, USA, 2017; p. 11. [Google Scholar]
- Peterson, B.; Reuss, D.L.; Sick, V. High-speed imaging analysis of misfires in a spray-guided direct injection engine. Proc. Comb. Inst. 2011, 33, 3089–3096. [Google Scholar] [CrossRef]
- Mounaïm-Rousselle, C.; Landry, L.; Halter, F.; Foucher, F. Experimental characteristics of turbulent premixed flame in a boosted spark-ignition engine. Proc. Comb. Inst. 2013, 34, 2941–2949. [Google Scholar] [CrossRef]
- Aleiferis, P.G.; Behringer, M.K. Flame front analysis of ethanol, butanol, iso-octane and gasoline in a spark-ignition engine using laser tomography and integral length scale measurement. Combust. Flame 2015, 162, 4371–4674. [Google Scholar] [CrossRef]
- Le, M.K.; Furui, T.; Nishiyama, A.; Ikeda, Y. Application of High-Speed PIV Diagnostics for Simultaneous Investigation of Flow Field and Spark Ignited Flame inside an Optical SI Engine. SAE Int. J. Eng. 2017, 10, 917–927. [Google Scholar] [CrossRef]


| Engine Type | 4 Stroke, Single Cylinder, PFI |
|---|---|
| Bore × stroke | 86 × 86 mm |
| Displacement | 500 cm3 |
| Compression ratio | 10.4 |
| Fuel injection | Port fuel injection |
| Fuel type | Regular gasoline |
| Injection pressure | 300 kPa |
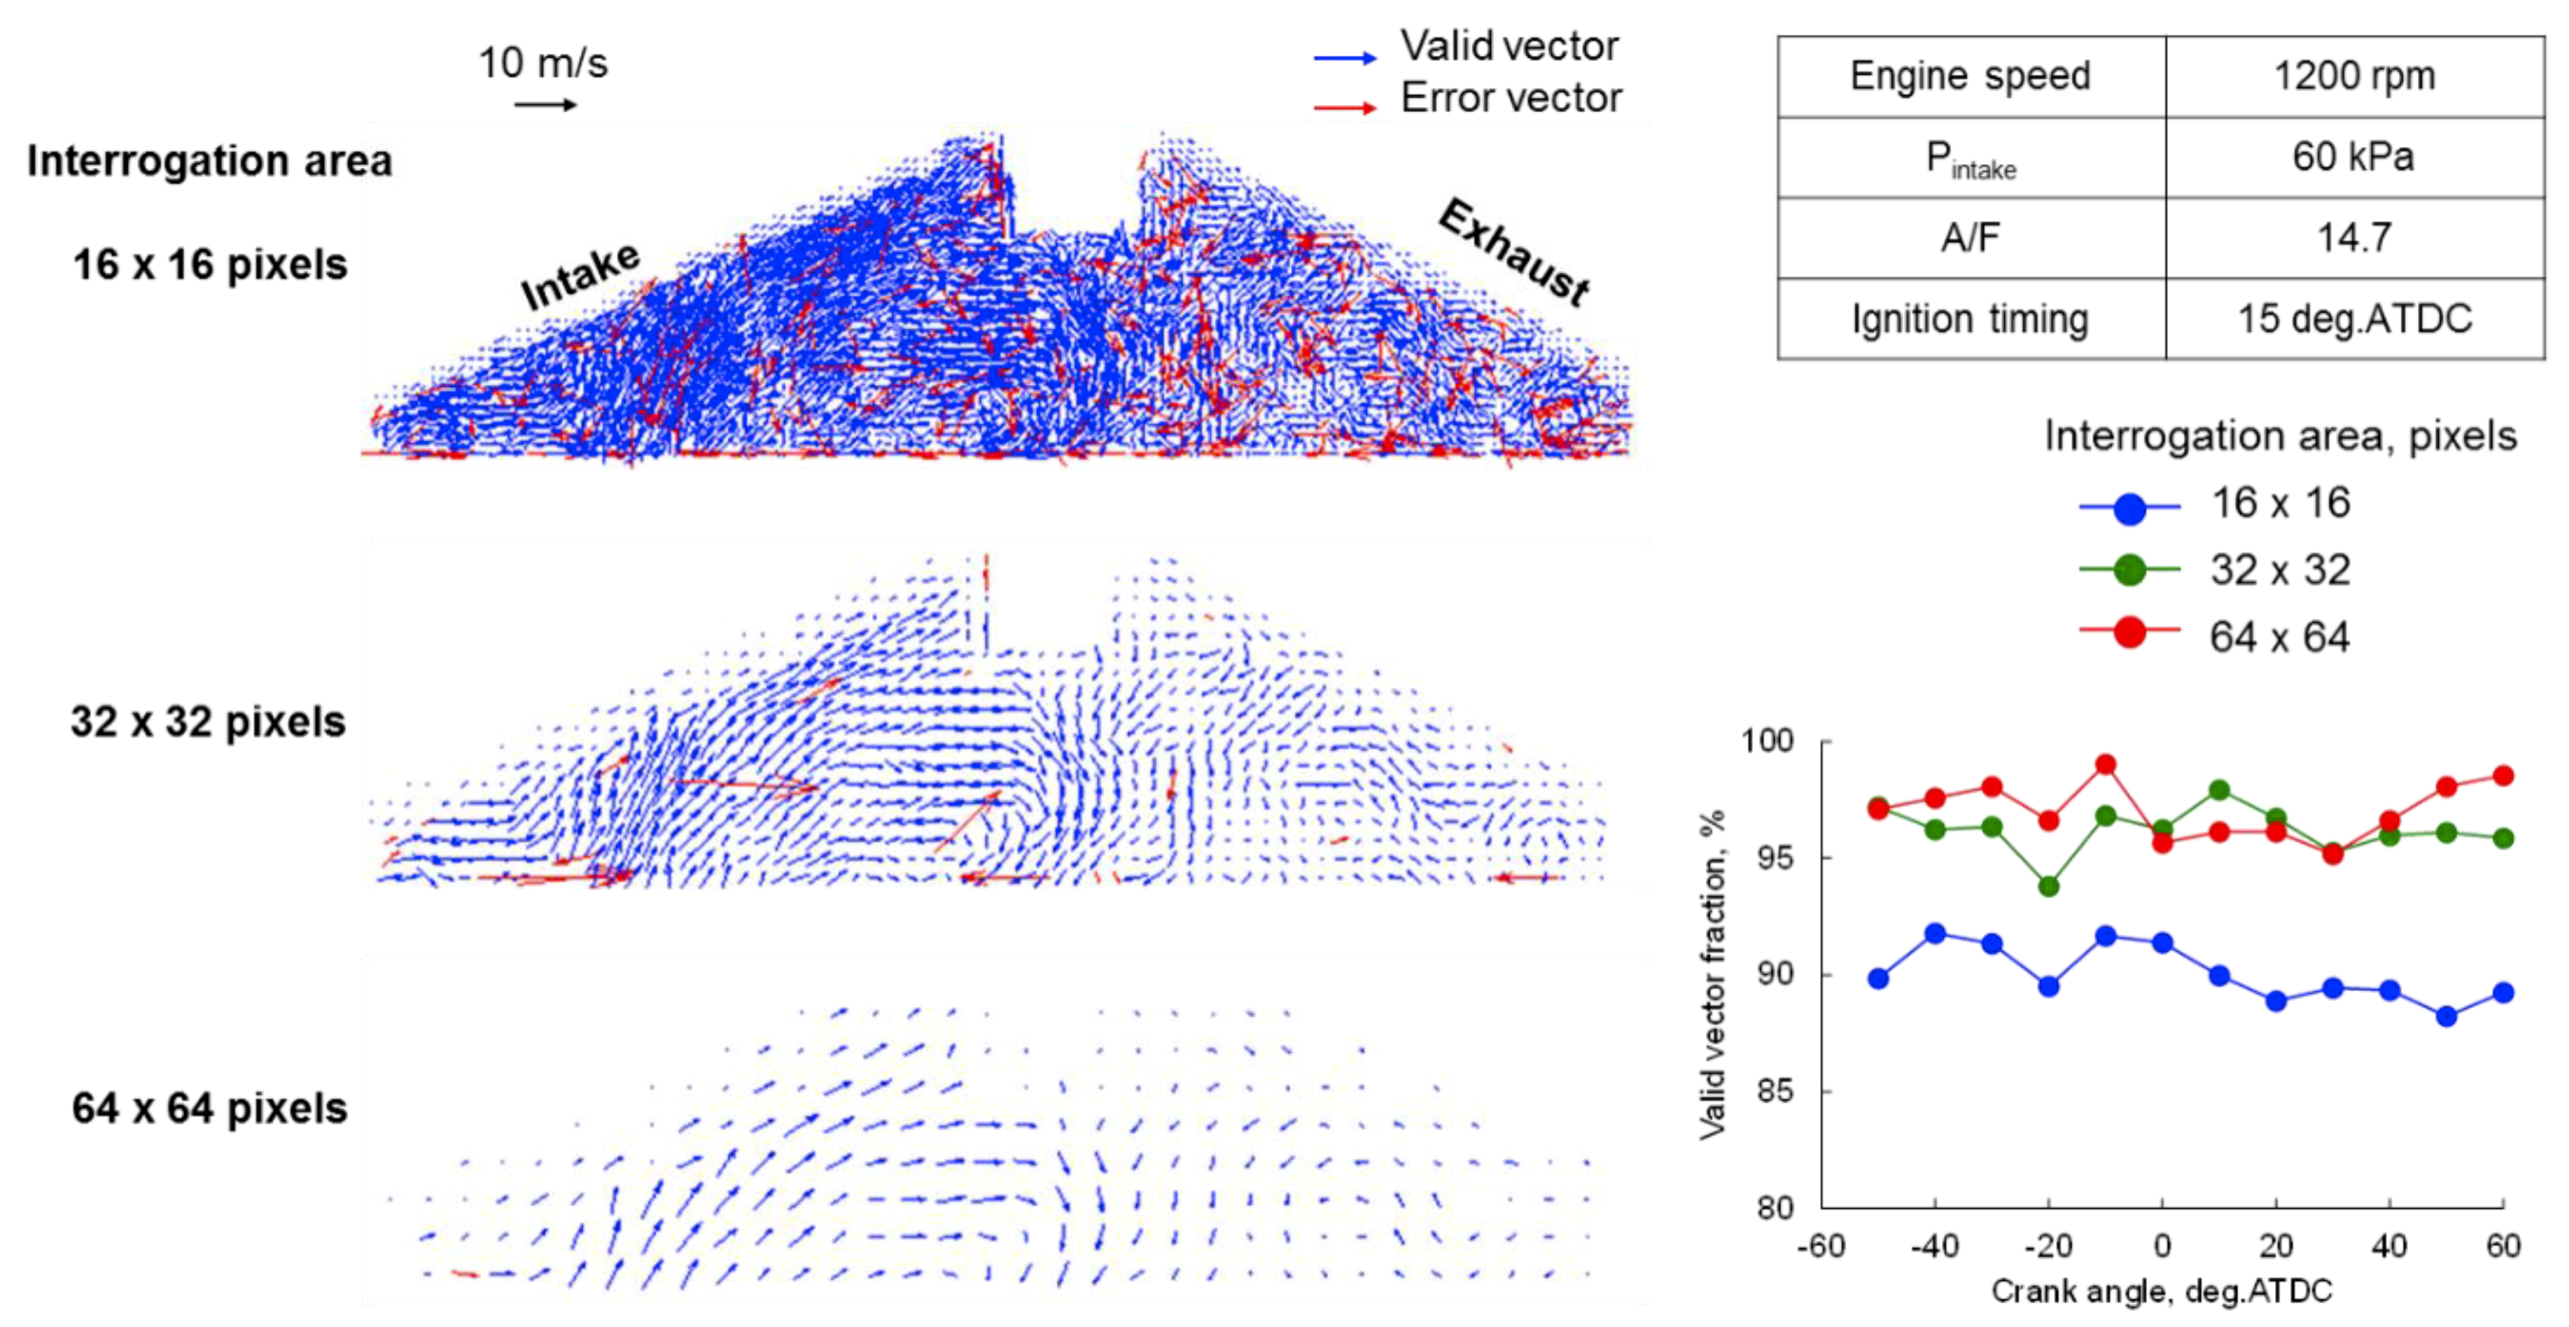
| Engine speed | 1200 rpm |
| Equivalence ratio | 1 (AFR 14.7) |
| Intake pressure | 60 kPa |
| Spark timing | −15° CA aTDC |
| Sampling frequency | 7.2 kHz |
| Crank angle resolution | 1°. CA |
| Image size | 1280 × 800 (59 × 37 mm) |
| Spatial resolution of image | 0.046 × 0.046 mm |
| Seeding particles | SiO2 |
| Measurement cycle number | 19 (consecutive) |
| Interrogation area | 32 × 32 px. (1.5 × 1.5 mm) |
| Overlap (Duplication degree of interrogation area) | 50% |
| Spatial resolution for vector | 0.74 × 0.74 mm |
© 2019 by the authors. Licensee MDPI, Basel, Switzerland. This article is an open access article distributed under the terms and conditions of the Creative Commons Attribution (CC BY) license (http://creativecommons.org/licenses/by/4.0/).
Share and Cite
Nishiyama, A.; Le, M.K.; Furui, T.; Ikeda, Y. Simultaneous In-Cylinder Flow Measurement and Flame Imaging in a Realistic Operating Engine Environment Using High-Speed PIV. Appl. Sci. 2019, 9, 2678. https://doi.org/10.3390/app9132678
Nishiyama A, Le MK, Furui T, Ikeda Y. Simultaneous In-Cylinder Flow Measurement and Flame Imaging in a Realistic Operating Engine Environment Using High-Speed PIV. Applied Sciences. 2019; 9(13):2678. https://doi.org/10.3390/app9132678
Chicago/Turabian StyleNishiyama, Atsushi, Minh Khoi Le, Takashi Furui, and Yuji Ikeda. 2019. "Simultaneous In-Cylinder Flow Measurement and Flame Imaging in a Realistic Operating Engine Environment Using High-Speed PIV" Applied Sciences 9, no. 13: 2678. https://doi.org/10.3390/app9132678
APA StyleNishiyama, A., Le, M. K., Furui, T., & Ikeda, Y. (2019). Simultaneous In-Cylinder Flow Measurement and Flame Imaging in a Realistic Operating Engine Environment Using High-Speed PIV. Applied Sciences, 9(13), 2678. https://doi.org/10.3390/app9132678