1. Introduction
Suspended structures containing structural art in nature have profound architectural artistic connotations and are expressions of structural beauty, which achieves the harmonic unification of structure and architecture, function and art, power and beauty, and has attracted the focus of many architects and engineers [
1,
2,
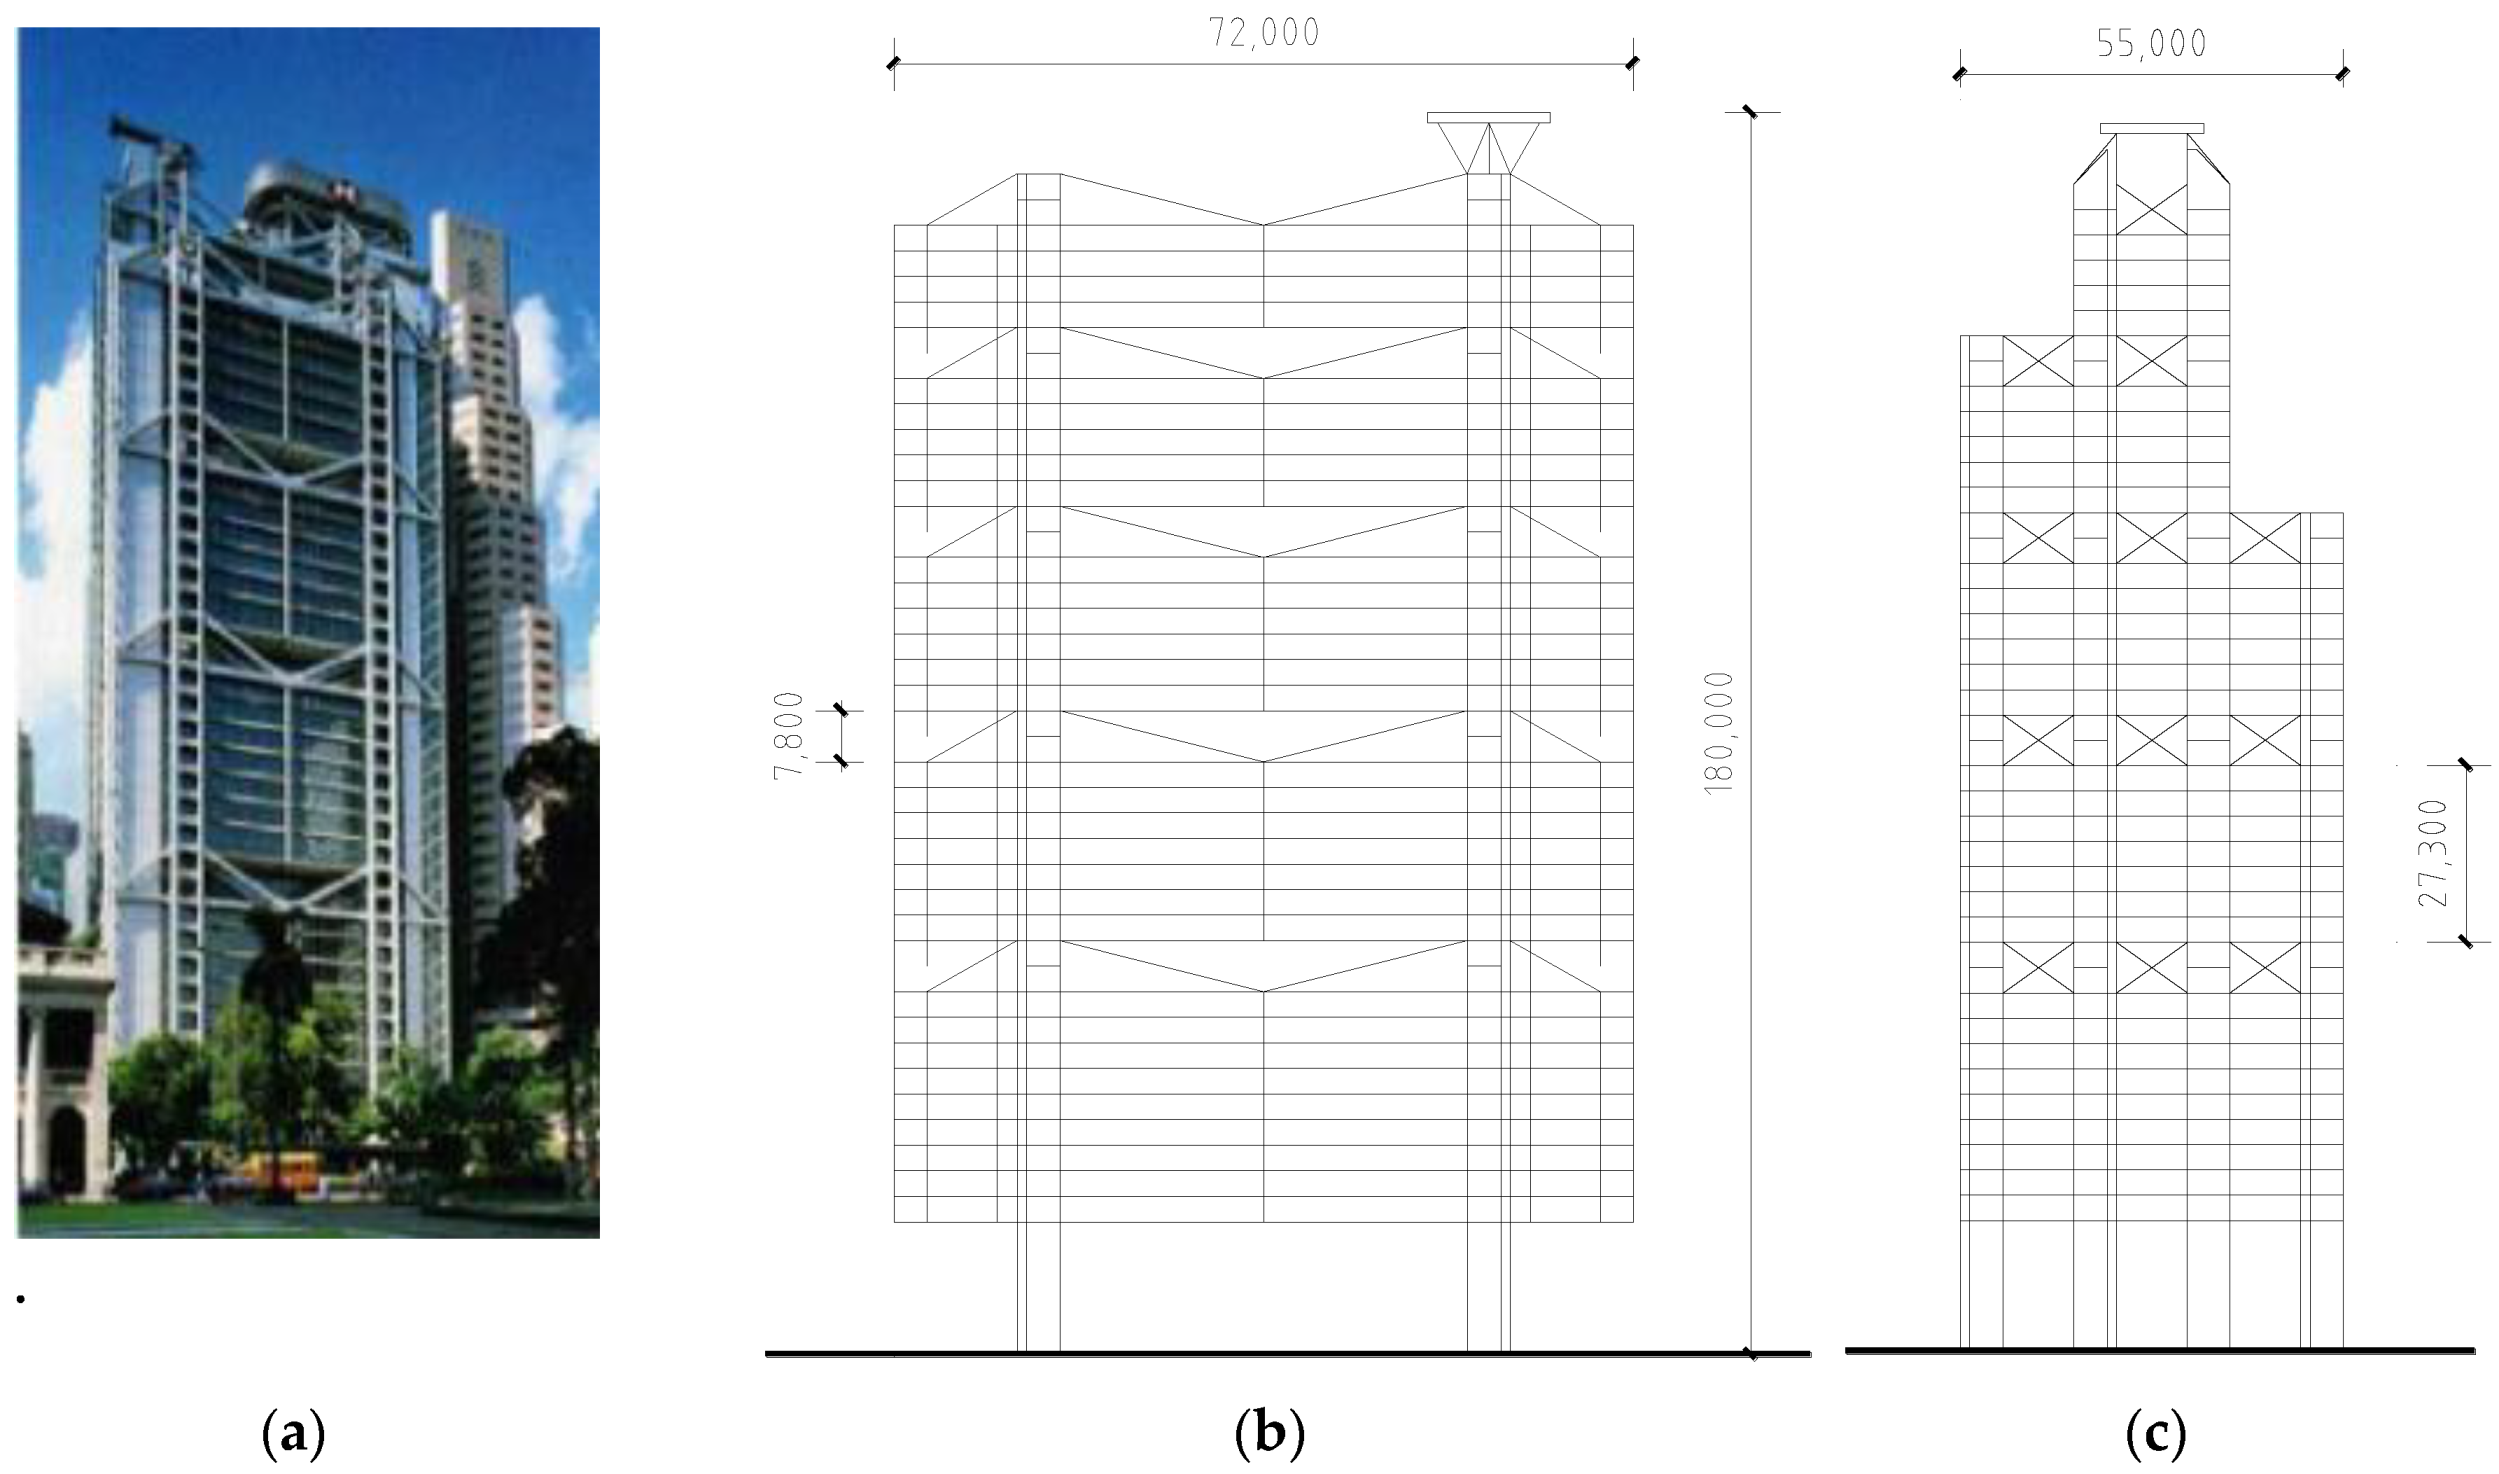
3]. The HSBC (Hongkong and Shanghai Banking Corporation Limited) Bank in Hong Kong [
4] is a typical mega-frame suspended structure, as shown in
Figure 1.
This kind of suspended structure system is mainly composed of three parts, namely, the primary mega-frame of the load-bearing structure, the rigid boom and the suspended floors. This structural system, utilizing the vibration of the suspended floors to adjust the dynamic characteristics of the primary structure, has a good seismic performance. The suspended floors are similar to a larger mass pendulum, like a tuned mass damper (TMD) [
5,
6,
7] or multiple tuned mass damper (MTMD) [
8,
9] system, and have even more advantages over these systems, in that no additional mass is required and the mass ratio is higher.
Many theoretical studies have been carried out on the damping performance of suspended structures. Bing Xu et al. [
10] established a continuous model of a shear-type suspended structure. Based on the motion equation for infinite degree of freedom shear bar, the frequency and mode equations of the shear-type suspended structure were derived, and the damping effect was studied. Jun Dong et al. [
11] used the spatial dynamic analysis method to study high-rise suspended structures, proposed a spatial calculation model that can reasonably reflect the translation and rotation of space-suspended floors, and derived control equations for the dynamic responses of high-rise suspended structures. Zhaoming Wang et al. [
12] used a structural scheme as an example to establish an analytical model of the high-rise mega-frame suspended structure system, and studied the static dynamic characteristics and the influence laws of giant frame. Qizhi Liang et al. [
13,
14], aiming to apply the mega-frame suspended structure system to high-rise buildings, studied the structural vibration control method compatible with its dynamic characteristics, established an algorithm for the lateral stiffness of the suspended structure system, and proposed a calculation method for the lateral stiffness of the mega-frame, considering the influence of axial force. Kim and Jung [
15] considered that a mega-frame structural system was a perfect fit for the concept of the best structural system. The research of these people shows that mega-frame suspended structure systems have good shock absorbing performance. It also can be seen that most of the studies listed above have focused on abstract theoretical models. Moreover, the mega-frame and the suspended floors are either rigidly connected or not connected. Experimental studies are very few [
16]. Although very limited theoretical and experimental research has been conducted in this area, existing research outcomes indicate that the mega-frame suspended structure has outstanding seismic performance.
The shaking table test is one of the most effective methods to study and evaluate the seismic performance of complex buildings. Many researchers, including Lu [
17,
18] and Ario Ceccotti [
19], have conducted scale model tests on shaking tables to study the seismic performance of tall or high-rise buildings. These shaking table tests have provided important references for the present work.
In this paper, a mega-frame damping suspended structure system was studied. Between the primary structure and the sub-structure, viscous dampers were installed, and the shaking table tests were then carried out to study the vibration damping performance and the damping effect.
2. Experimental Program
2.1. Test Model Design
The experimental model consisted of a ten storey concrete frame as the primary structure, and a six storey suspended-floor segment as the sub-structure.
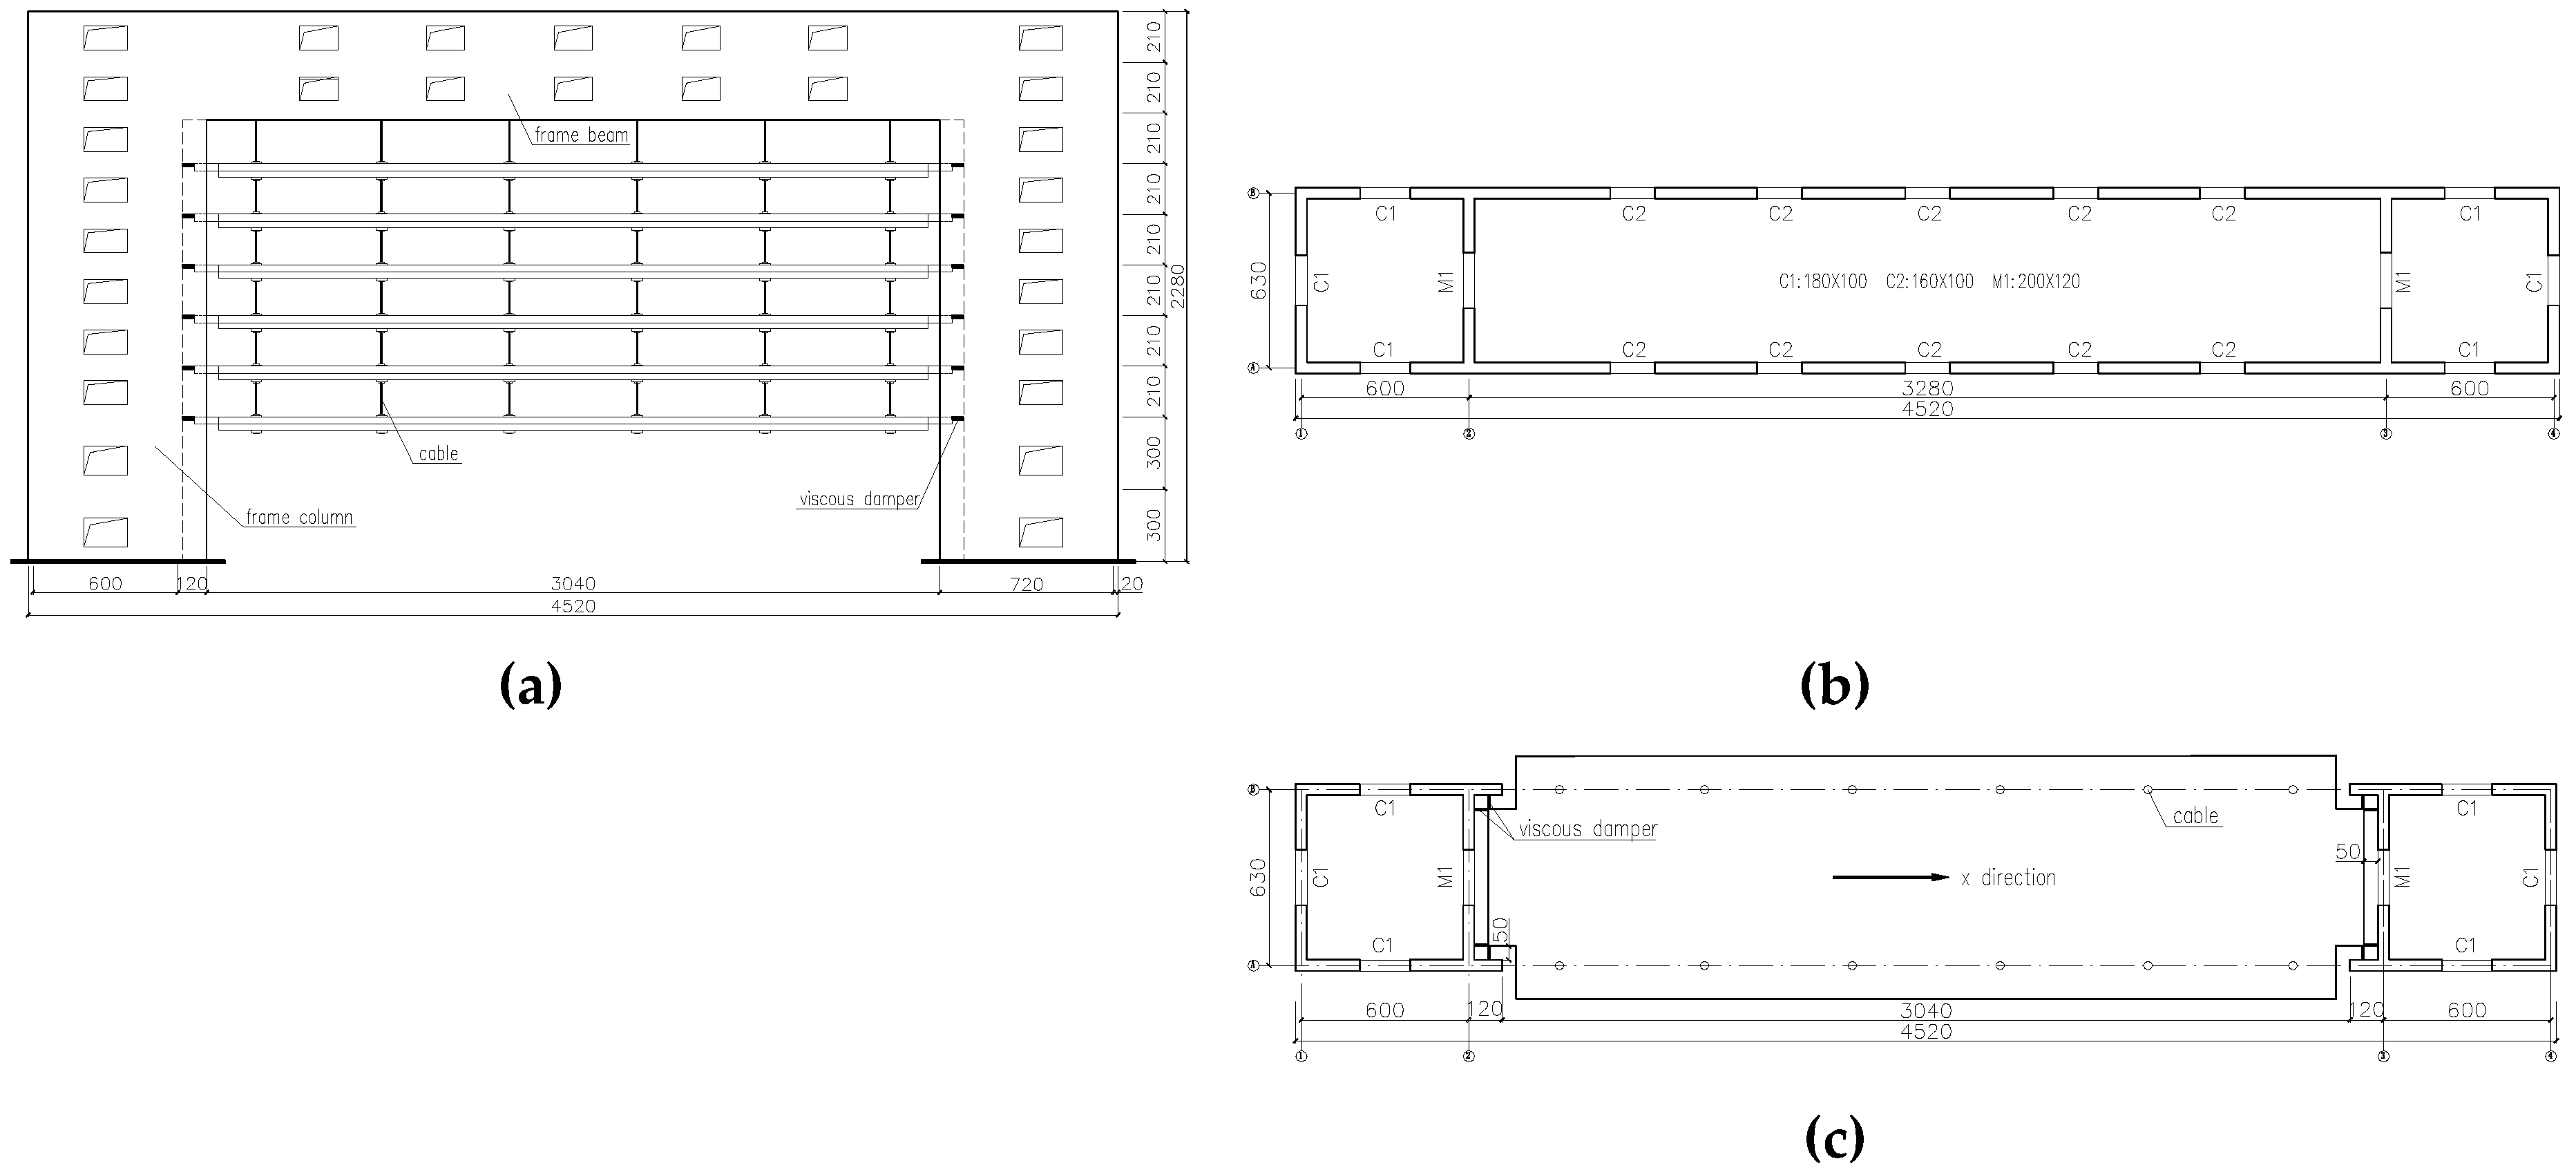
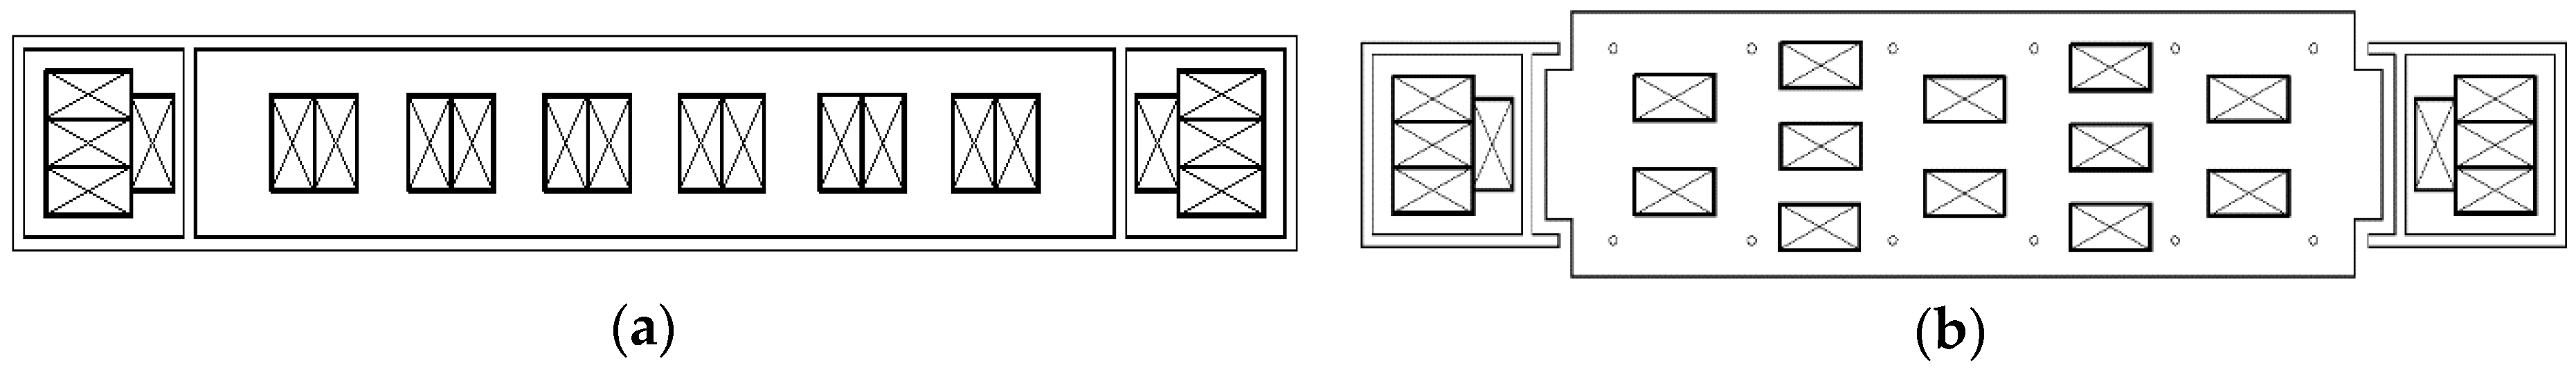
Figure 2 shows the configuration of the model. Two giant columns were at each end of the structure, the mega-frame beam was located in the 9th and 10th floors, and the suspended floors were arranged between the two giant columns.
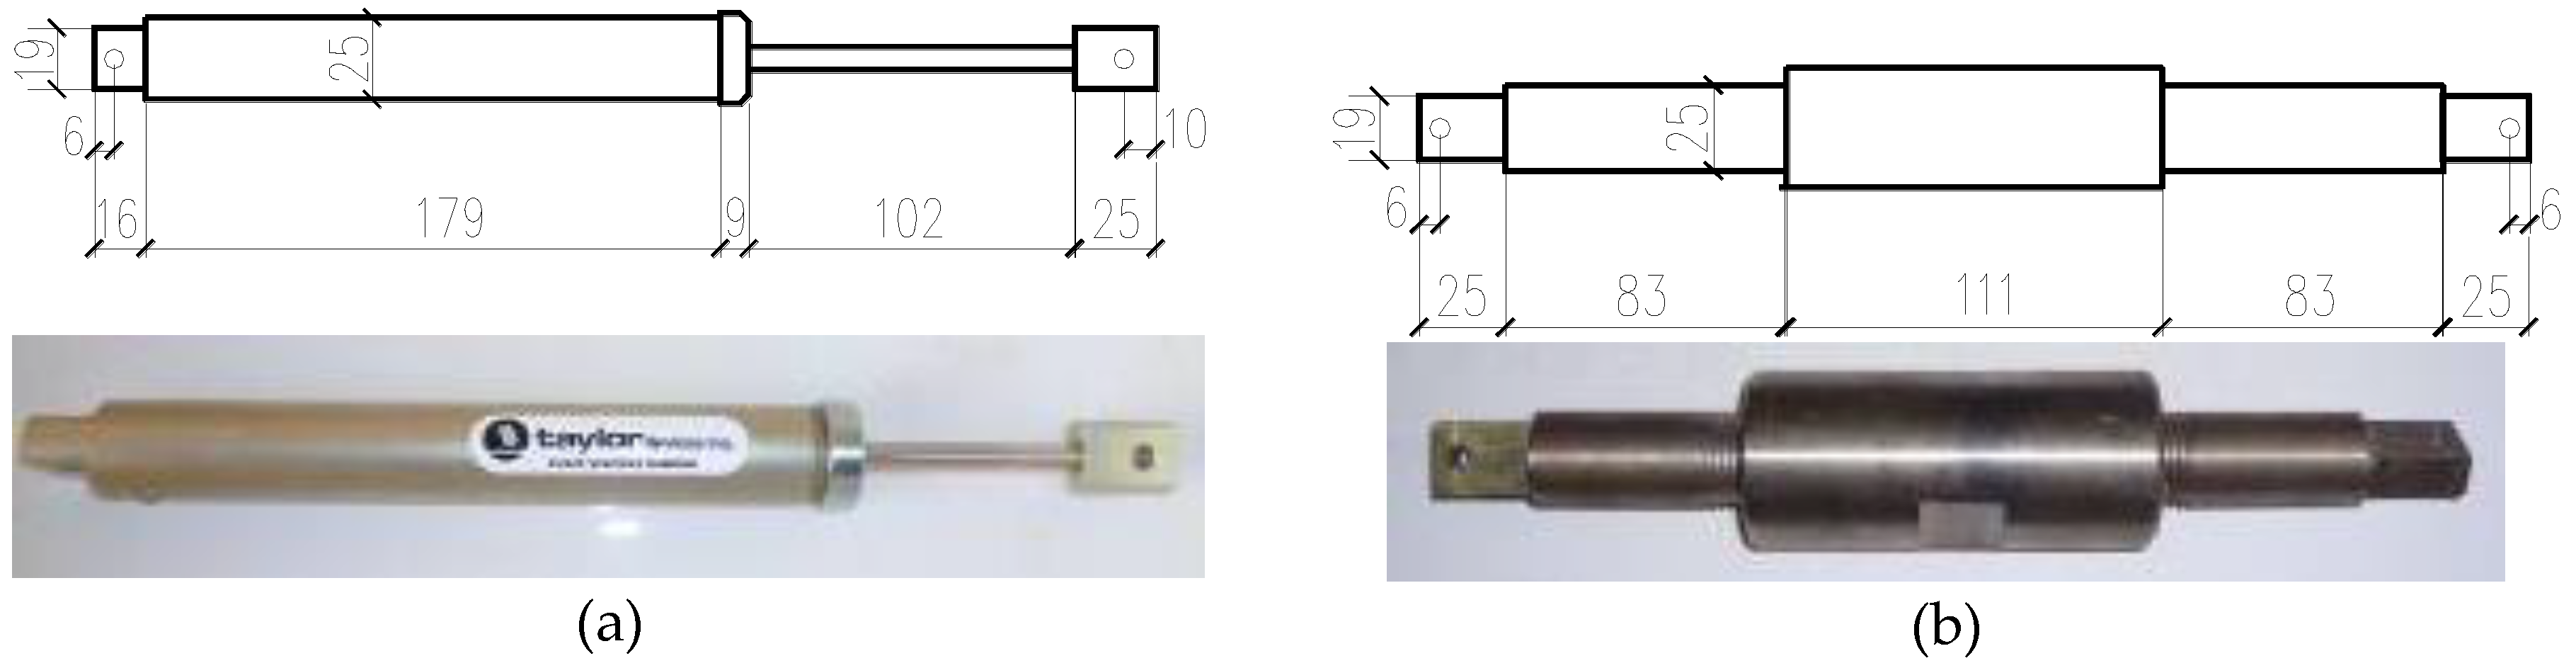
The model plan size was 4.52 m × 0.67 m and the total height was 2.28 m. The suspended floors hung from the mega-frame beam, and there was a distance of 50 mm between the suspended floors and the mega columns for viscous dampers or rigid connecting rods (see schematic diagram in
Figure 3). The parameters of the viscous dampers are presented in
Table 1.
The parameters of the damper were obtained from finite element analysis of the suspended structure model, and the size was mainly determined according to the model size and the manufacturing process.
The model was made of particulate concrete and galvanized steel wire [
20]. During the casting of the model, three sets of particulate concrete cubes and prismatic test blocks were reserved. The average compressive strength of the measured particulate concrete cube was 9.4 Mpa, and the elastic modulus was 6 × 10
3 Mpa. The yield strength and tensile strength of the galvanized steel wire were obtained by tensile tests using an electro-hydraulic servo universal testing machine, as listed in
Table 2.
2.2. Model Similarity Rate
Based on the consistent similarity rate [
21,
22,
23] of the seismic simulation test, the length similarity coefficient of the test model was determined to be 1/20 according to the size of the vibrating table. Considering the model making techniques and conditions, the similarity coefficient of the elastic modulus was 1/5, and particle concrete was selected as the main material. Taking into account the factors such as material and counterweight, the similarity ratio of gravity density was 2.67. The main similarity relationship of the model is shown in
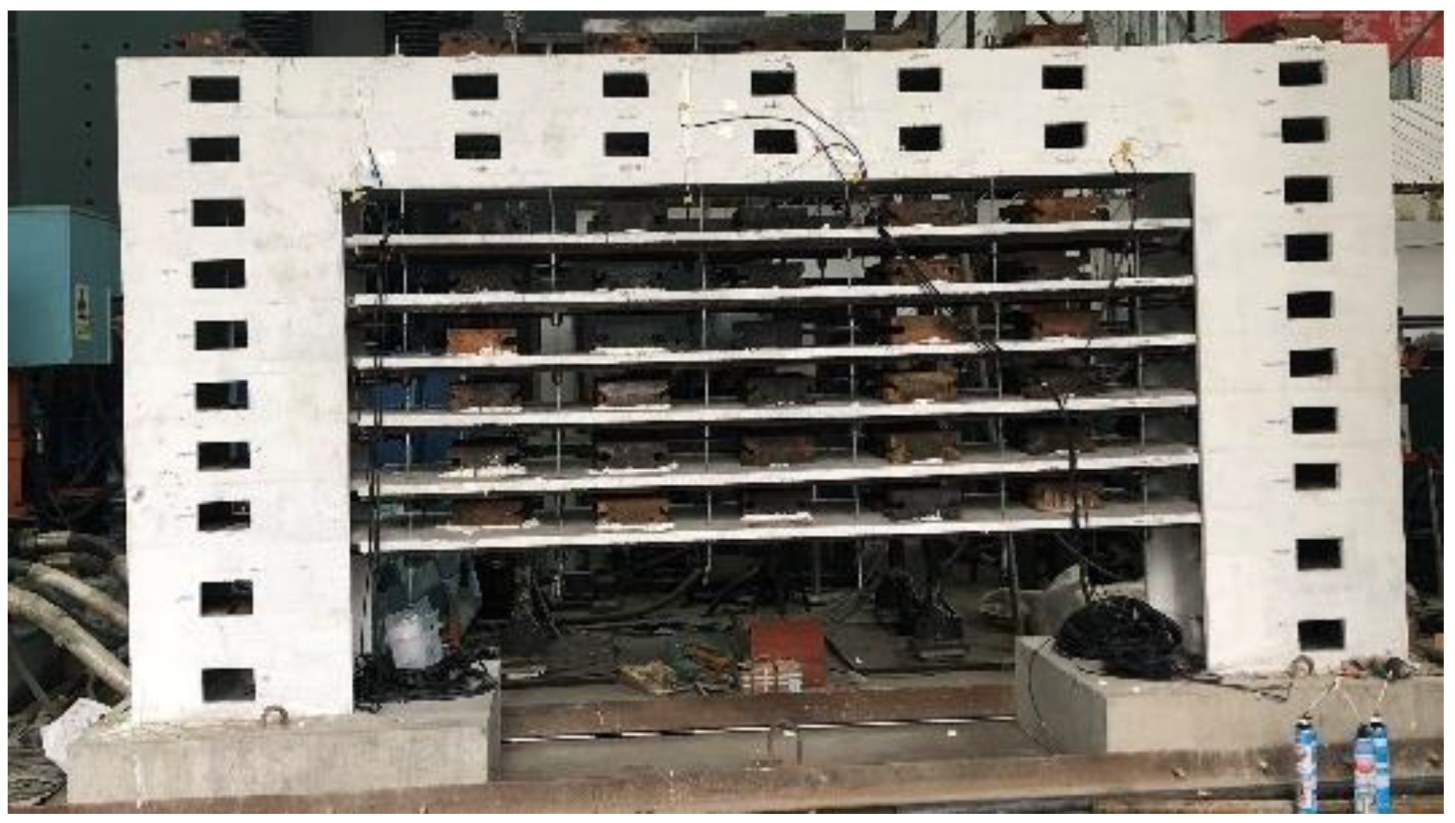
Table 3, and the experimental model is displayed in
Figure 4.
In order to meet the requirement of the similarity relation, the similarity relationship of mass was calculated according to the similarity relationship of gravity density, and then the mass of each part of the model was derived in light of the prototype quality. The calculation results show that the model needs to add artificial weight, calculating the required weight of each part of the structure and the total weight of the structure. The test-specific mass was selected as the additional mass and was uniformly arranged on each floor of the structure, according to the weight of each part. This increased only the weight of the structure without increasing the strength and stiffness of the structure. The weighting scheme of this test is shown in
Figure 5. According to the actual weight calculation, the mass ratio of the primary and secondary structures of the model was 0.54.
2.3. Instrumentation
The measuring points were defined to capture the overall response of the test models during the seismic loading. Accelerometers were fixed to the south side of the test model, considering the model’s symmetry. A total of 10 accelerometers and 7 displacement sensors were mounted on the model and the shaking table.
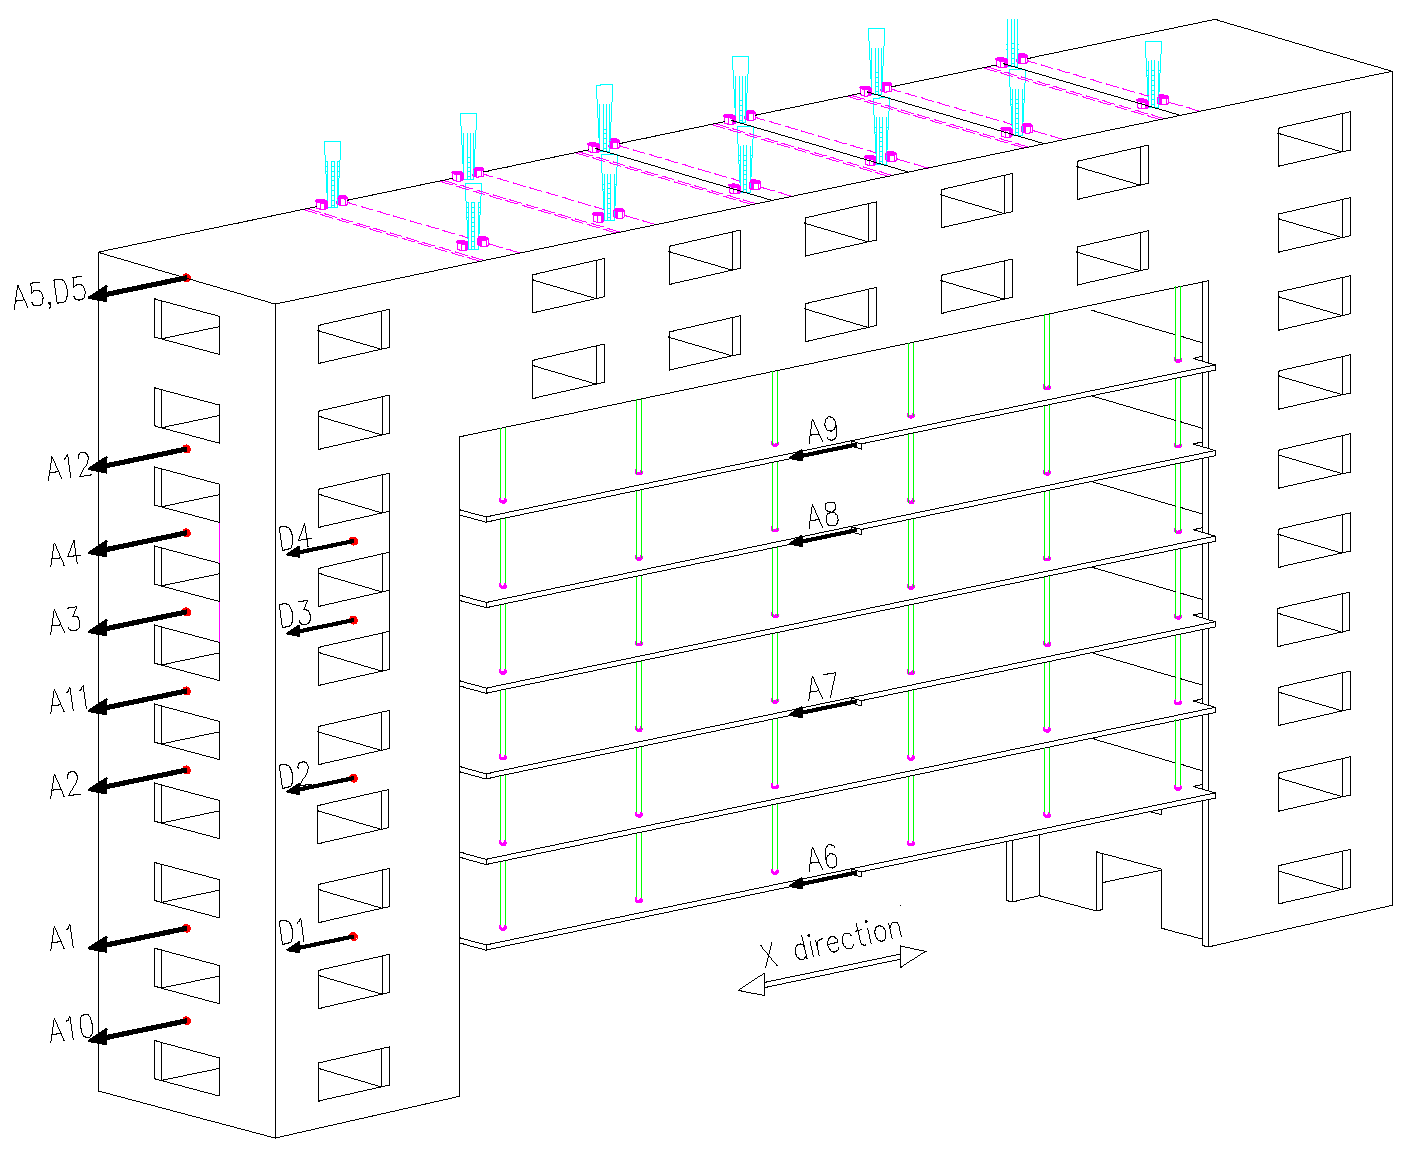
The accelerometers, installed in the first, second, fourth, fifth, sixth, eighth and tenth floors of the primary structure (numbered A10, A1, A2, A11, A3, A4, A12, A5), were utilized to measure the response of the primary structure and the motion of the suspended floors. On suspended floors, accelerometers (sequentially numbered A6, A7, A8, A9) were arranged on the first, third, fifth and sixth floors. The displacement laser sensors were placed in appropriate positions, namely the second, fourth, sixth, seventh and tenth floors (numbered D1, D2, D3, D4, D5) of the primary structure, keeping level with the first, third, fifth and sixth suspended floors, as displayed in
Figure 6. The direction of the sensors was consistent with the direction of vibration, in order to capture valid data. A total of 10 concrete and 20 steel strain gauges were installed on the model, including the bottom corner of each side giant column, the end of the mega-frame beam, the mid-span of the mega-frame beam, and the surface of the cables.
2.4. Testing Loading Protocol
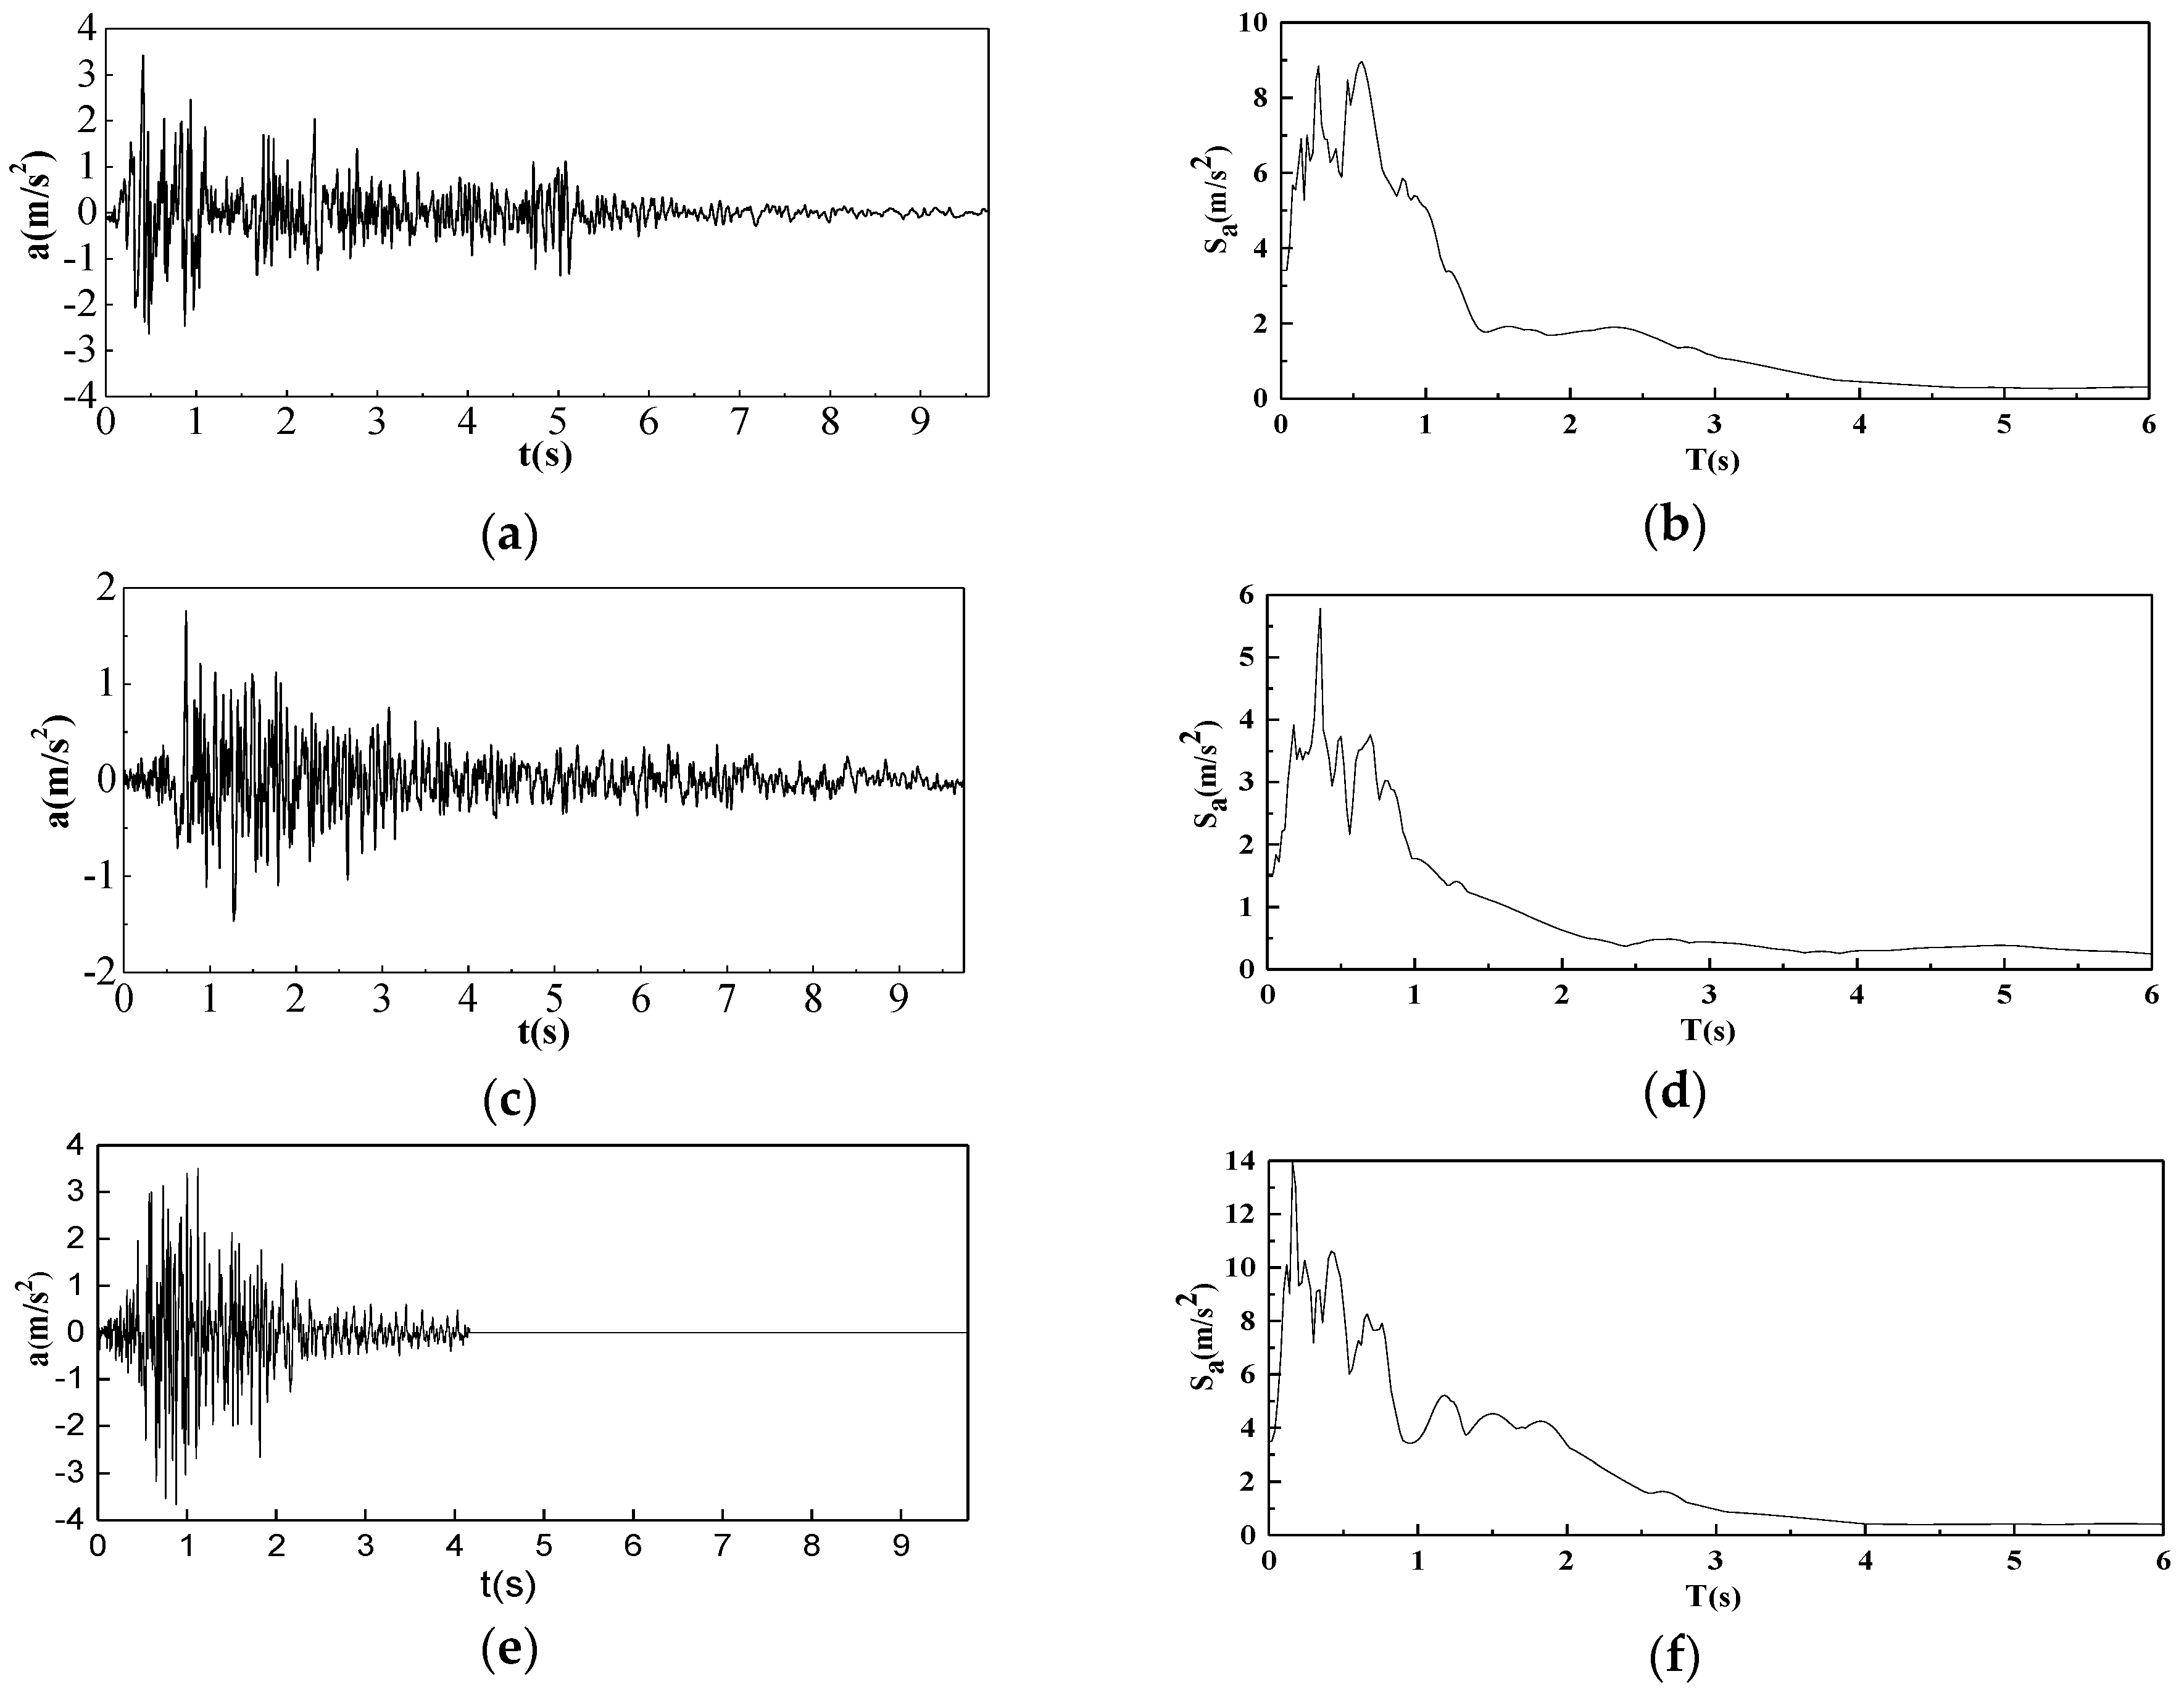
The shaking table test was conducted with increasing earthquake excitation magnitudes. Three earthquake time histories of acceleration were selected as the input data during the shaking table test. The three time histories of acceleration were El Centro wave (i.e., Imperial Valley earthquake, 1940), Taft wave (i.e., California earthquake, 1952) and a random artificial wave.
Figure 7 shows the time histories and response spectrum of the three waves. All the earthquake time histories of acceleration were input in the X direction of the experimental model and the time interval was 0.02 s. The peak value of the acceleration at each level was adjusted to the same value as the mesa excitation. As shown in
Table 4, the loading protocol was composed of 21 seismic cases in the vibration direction. Two types of input were used: white noise and earthquake excitation [
24]. Before the start of the test and after the end of each working condition, white noise excitation was used to identify any variation in the dynamic characteristics of the model. The natural frequencies of the model during the testing were first identified from the response to a white noise signal.
The two models of different links carried out the above 21 seismic cases. During the test process, the motion of the model was monitored with acceleration and displacement gauges, and the data were collected by a computer-controlled system, and were then transferred to a personal computer for further analysis.
3. Experimental Observations
The two test models responded with a weak tremor. For the conventional suspended structure, the primary structure has a hardly observable tremor, and the suspended floors have slightly visible relative displacement. For the damping suspended structure, the suspended floors have a slightly larger relative displacement. As the peak acceleration of the seismic wave was increased step by step, the vibration of the primary structure and suspended floors became gradually more intense. Compared with the vibration of suspended floors, the primary structure’s vibration was significantly less. For the suspended structure with the rigid-bar links, i.e., the conventional suspended structure, some fastening bolts at the ends of the rigid-bar joints loosed, a few of them even showed bending, and a slight relative vibration occurred between suspended floors and the primary structure under the rare earthquake condition. The findings showed that the swing of suspended floors and the deformation of the bolts absorbed the seismic energy input. For the damping suspended structure, the relative vibration between suspended floors and the primary structure was very obvious, and the vibration of the suspended floors lagged behind the primary structure. The bolts connected to the viscous dampers showed no obvious deformation and were only slightly loosened. The finding of the above test phenomenon showed that the swing of the suspended floors and viscous dampers dissipated the seismic energy input. However, under all working cases (
Table 4), the whole structure, including the primary structure and suspended floors, had no cracks from the test beginning to end, and the hang booms also had no traces of shear damage, even in the case of rare earthquake excitation. Moreover, the slight, visible deformation produced during the vibration process was quickly restored, which indicates that the test models were in the elastic working phase. These results suggest that the seismic-resistant performance of the test models was superior, and the structure system, especially the damping suspended structure system, can satisfy or even surpass the requirement for “no damage under frequent earthquake, repairable damage after an occasional earthquake, and no collapse when subjected to a rare earthquake,” as described in the code for seismic design of buildings [
24].
In order to explore the failure mode of the structures, after the above various conditions, an additional condition under 9 rare earthquakes was carried out. For the conventional suspended structure, a few rigid joints were broken, and some of the bolts connecting the rigid bar had large bending deformation at one end and were pulled out at the other end. At this time, the suspended floors still had no obvious cracks, and the primary structure had only minute fine lines at the intersection of the hanging beam and the giant columns. It can be inferred that after the rigid joints between the primary structure and the suspended floors were destroyed, the entire suspended section was equivalent to a mass pendulum, which was used to dissipate energy, thereby protecting the primary structure from damage. For the damping suspended structure, most of the bolts used to connect the dampers had moderate bending deformation, but none had been pulled out. In addition, there were no obvious cracks in the primary structure and suspended floors. It can be foreseen that as the seismic energy input is further increased, the dampers between the primary and secondary structures will be destroyed and cease to function. At this time, the primary and secondary structures will be connected only by the booms, and the suspended section will use its own free swing to dissipate energy.
It can be seen from the experimental observations of the above two model structures that the damping suspended structure has multiple seismic fortification lines. The first seismic line of defence is to install energy-absorbing and damping control devices between the primary structure and suspended floors, such as viscous dampers. When there is seismic energy input, the devices work to reduce the impact of the earthquake, and at the same time protect the primary structure from damage. If this line of defence is not broken, the energy consumption device can be repaired and the building’s use faction can be restored. The second seismic line of defence is that after the failure of the energy absorbing device, the suspended floor and the primary structure are completely disengaged. At this time, the suspended floors are freely oscillating to achieve energy consumption and shock absorption. It can be seen that the active suspended control system can continuously adapt to the earthquake action, continuously adjusting the stiffness and damping of the structure and protecting the primary structure from damage. The third seismic line of defence is to use the deformation of the primary structure itself to dissipate energy until the primary structure is destroyed.
4. Experimental Results and Discussion
4.1. Structural Dynamic Characteristics
Mode identification is an important mechanical dynamic characteristic parameter. The main task of model identification is to determine the vibration mode parameters of the vibration system from the test data [
25,
26]. The representative white noise excitation cases input in the X direction of the structural model were selected, and the natural frequencies and vibration mode characteristics of the two structural models were obtained by analysing the time history response, spectral characteristics and transfer function of each acceleration point. However, the vibration mode obtained by the test analysis was not entire, and only the first few main vibration modes could be derived in the test direction. Additionally, under each white noise excitation, the difference of the natural frequency and damping ratio was small, so the average values are given. It was verified that the two structural models were in an elastic state, as explained in the previous experimental phenomenon. The identified natural frequencies and modal damping ratios of the two model structures are listed in
Table 5.
Table 5 lists the first three natural frequencies and corresponding damping ratio of two structural models under the white noise excitation. It can be seen from
Table 5 that for the damping suspended structure, the first three natural frequencies were 1.50, 3.71 and 6.24Hz. The first three natural frequencies of the conventional suspended structure were 5.21, 10.74, and 12.24 Hz. The first three natural frequencies of the damping suspended structure were significantly smaller than those of the conventional suspended structure, especially the first natural frequency. This indicates that the damping suspended structure was softer than the conventional suspended structure.
The damping ratio decreased as the natural frequency increased. The damping ratio of the damping suspended structure was greatly improved, compared with the conventional suspended structure. The first three damping ratios in the X direction increased from 2.301%, 0.813% and 0.710% to 9.254%, 5.879% and 3.362%, respectively. The relatively smaller damping ratios show that the conventional suspended structure was lightly damped. It is clear that the dampers can significantly improve the damping ratio of the structure, and ameliorate the vibration damping performance of the suspended structure.
4.2. Acceleration Response
Since the same peak acceleration of the vibration table input will give different responses under dissimilar working conditions, the acceleration amplification factor is used to characterize the power amplification effect. The acceleration amplification factor K
F is the ratio of the peak acceleration of each floor to the peak acceleration of the shaking table in the corresponding direction, which can be defined as:
where
and
are the acceleration response measured by the accelerometers arranged at the
th floor and the shaking table, respectively. The operation ‘max’ is applied to all the data of the acceleration time history.
Minglan et al. [
27] and Wu Kechuan et al. [
28] used this formula to calculate the amplification factors of structures.
The variations of acceleration amplification factor K
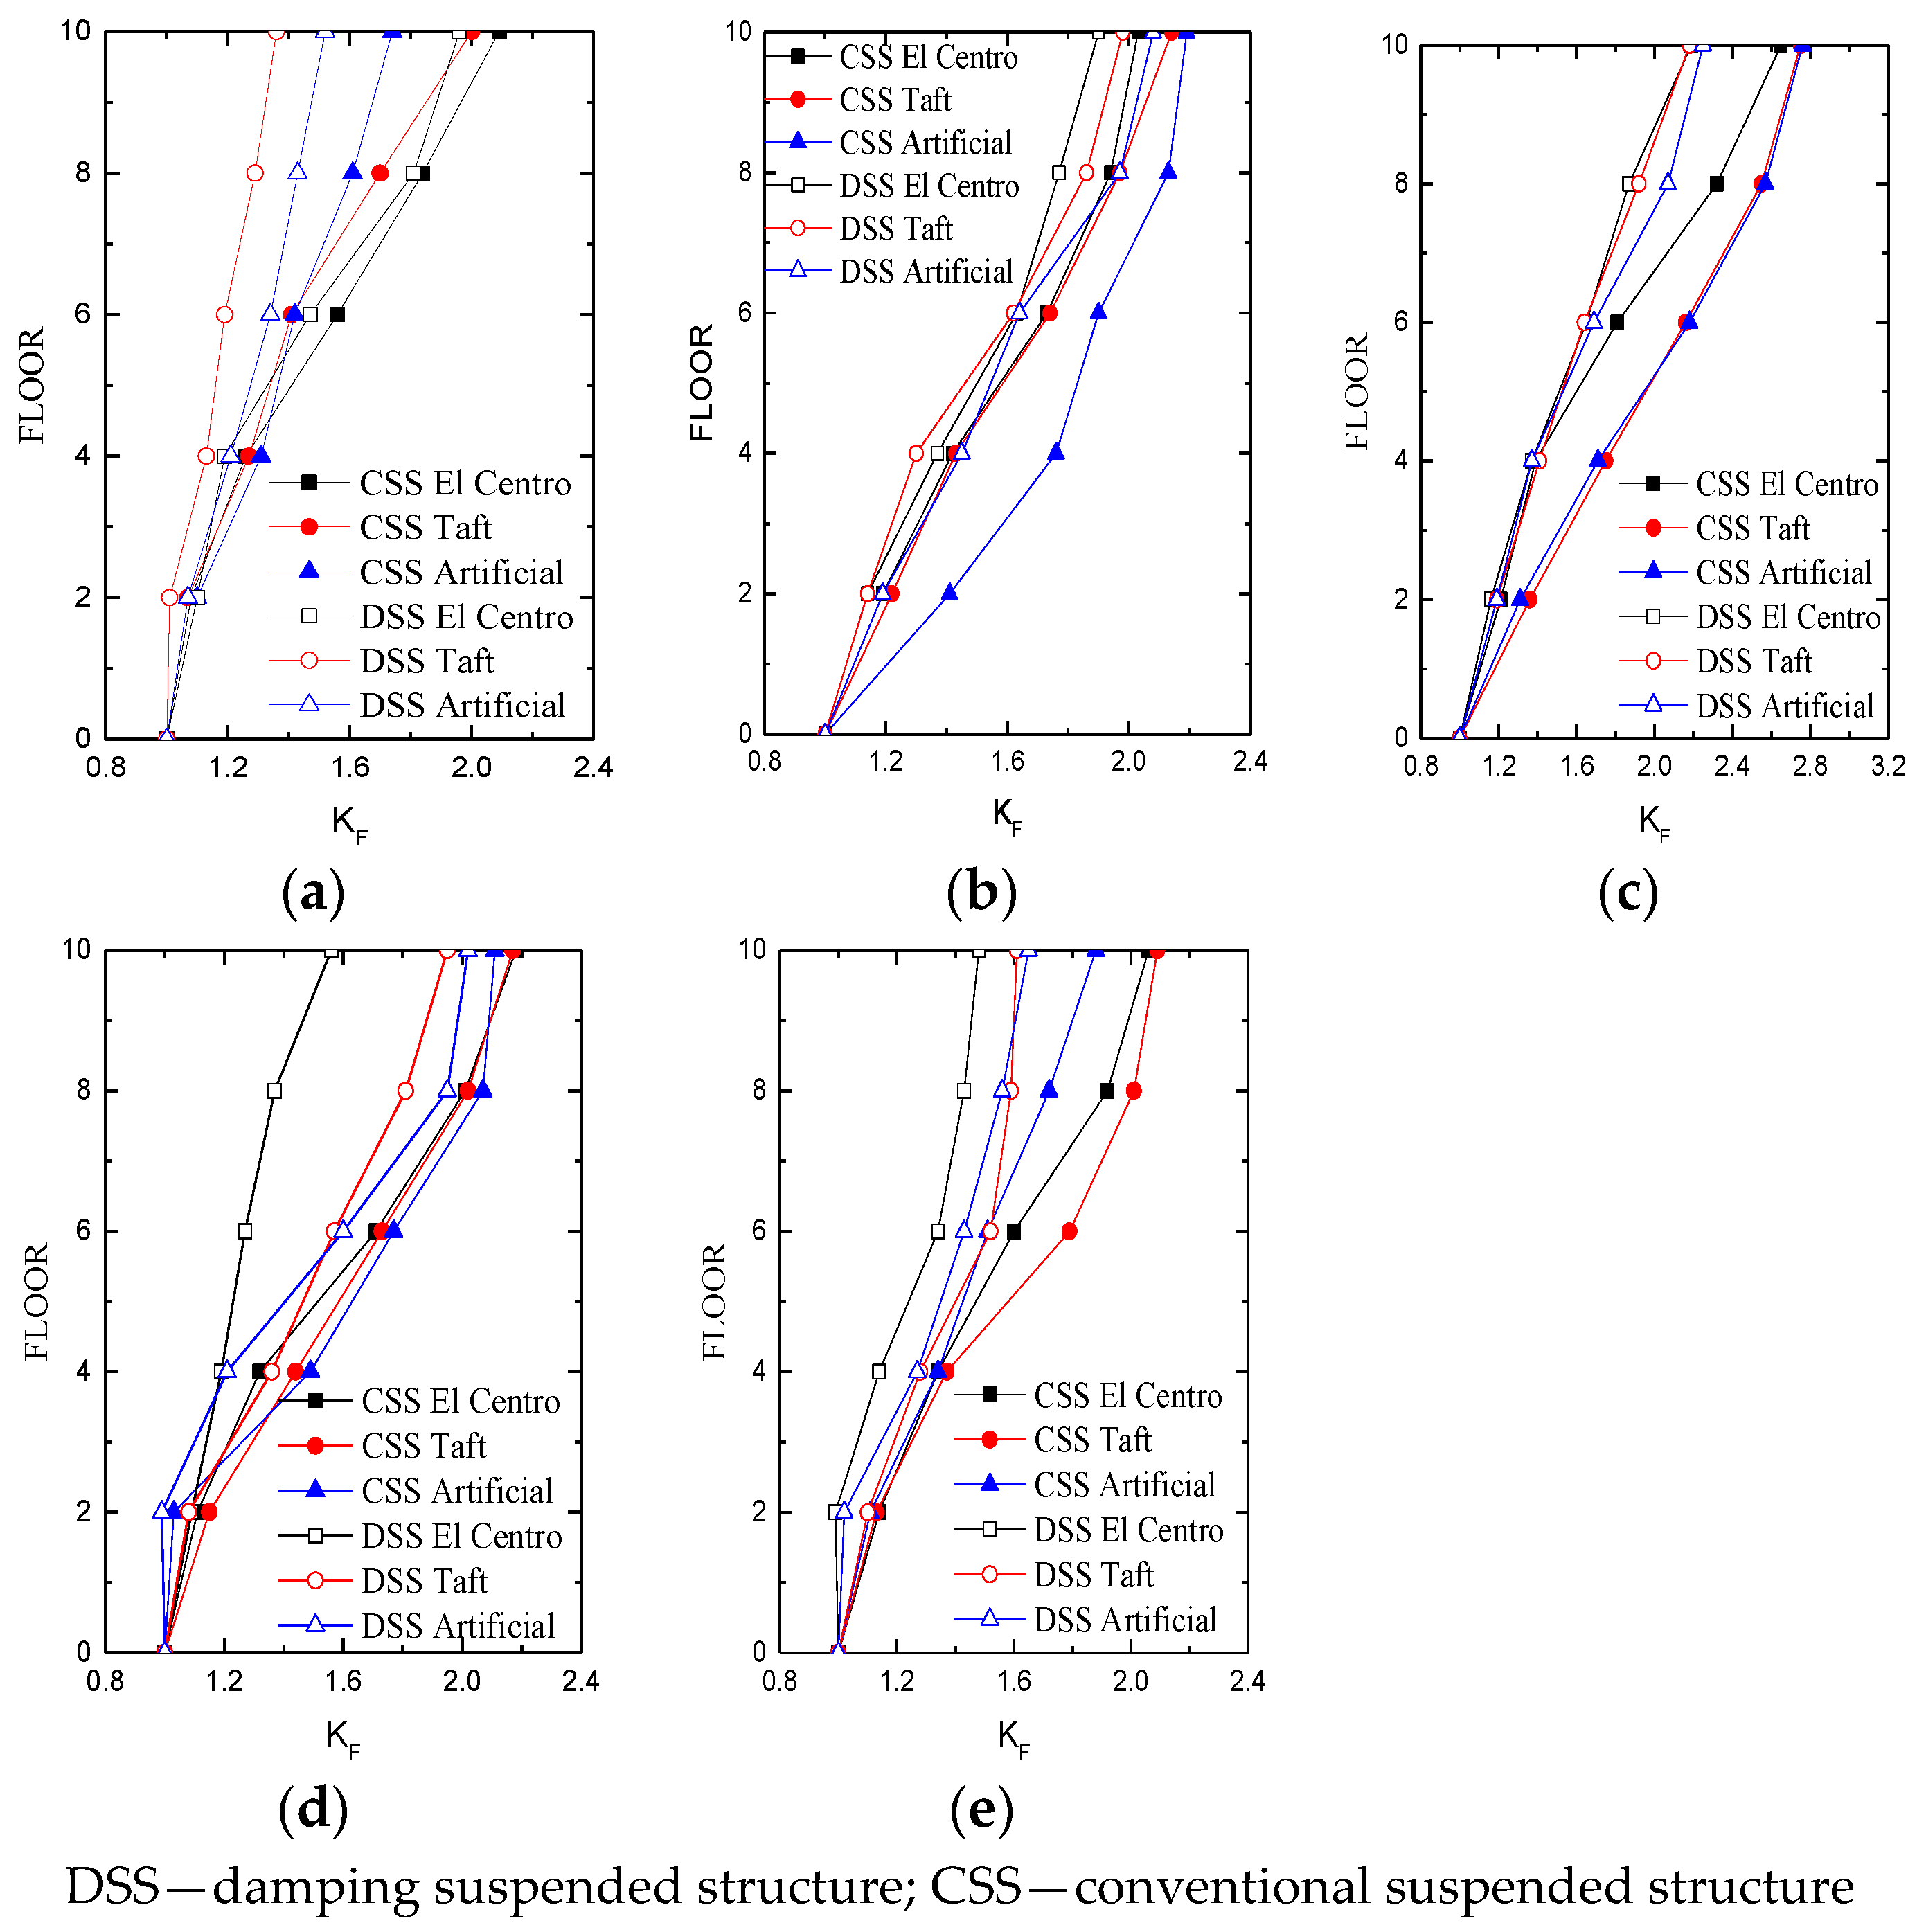
F of two structural models under various level seismic inputs are shown in
Figure 8.
As displayed in
Figure 8, the acceleration response of K
F displayed a consistent change and significantly increased with the height. The acceleration amplification factors of each structural model at the first two floors did not change much, primarily owing to the lateral stiffness of the bottom, which was relatively large. From the observation on the degree of changes in value, it is clear that the acceleration amplification factors on the fourth floor and above grew rapidly, and the difference between the three seismic waves was large.
The top acceleration amplification factor of the two test models did not change much with the increase of seismic intensity, and the value was in the range of 1.6 to 2.0. This indicates that the structure models kept in elastic condition during the test process. Additionally, the acceleration amplification factors of the primary structure’s top under dissimilar seismic waves were moderately different.
It is noted that the acceleration amplification factors of the damping suspended structure were moderately smaller than those of the conventional suspended structure, and, under the different seismic levels, the difference between the amplification factors of the two structures under the Taft wave was the largest, which means that the suspended structure under the Taft wave had the best damping effect. The finding indicated that the acceleration amplification factor of the structure was not only affected by the input seismic intensity, but also depended on the frequency spectrum characteristics of the seismic wave.
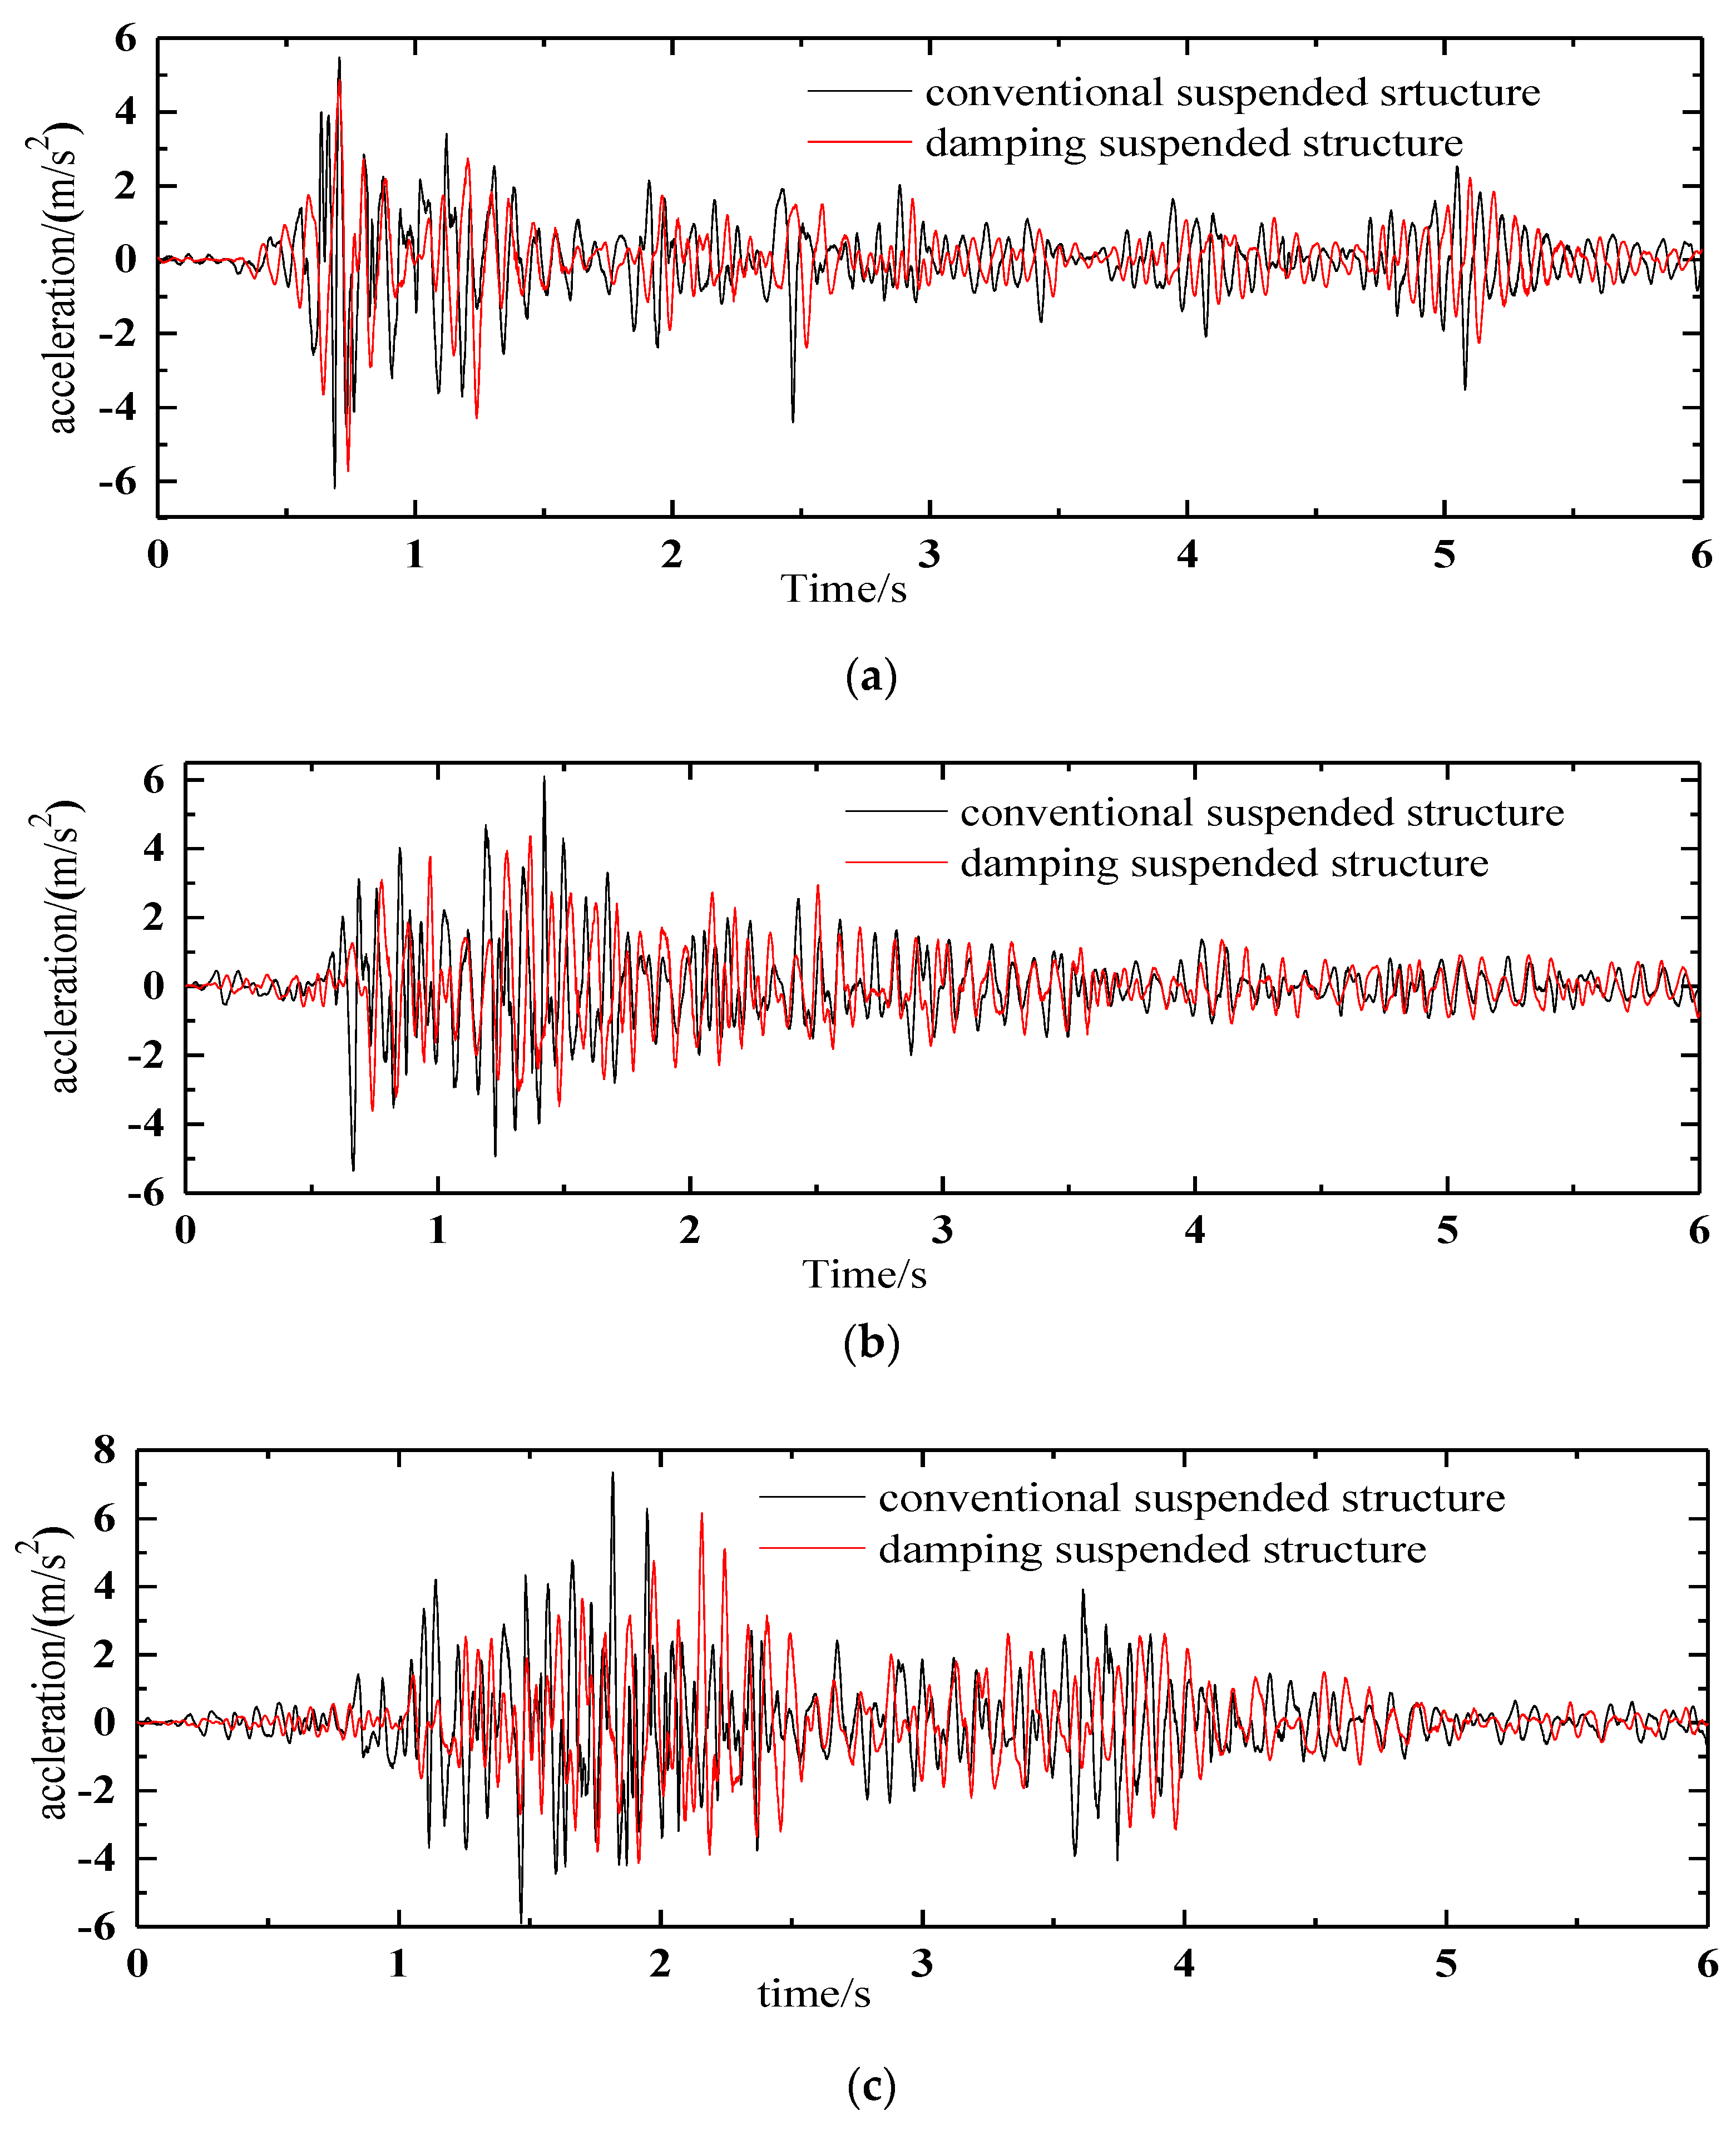
Figure 9 presents the acceleration time history curve of the primary structure’s top of two types of suspended structure under the 9 frequent earthquake.
As can be seen from
Figure 9, the peak acceleration response of the damping suspended structure was less than and slightly behind the conventional suspended structure. Under the Taft wave, the peak acceleration response of the damping suspended structure reduced significantly, and the reduction effect (reduction effect = (response of the conventional structure—response of the damping structure)/ response of the conventional structure) was 28.49%.
The suspended floors, as the main activity site, are worthy of attention. The suspended floors were numbered 1 to 6 in order from bottom to top, and the acceleration peak of the first floor may be larger than others, so
Table 6 displays the peak acceleration response of the first suspended floor. The values were measured by the acceleration sensor (accelerometer A6). It can be seen from
Table 6 that the maximum acceleration response of the damping suspended floor was much smaller than that of the conventional suspended structure, and the reduction effect was 85.71–91.90%; the damping effect under the Taft wave was the most obvious, and the value of the reduction effect was 82.35–91.90%. In particular, for the damping suspended structure, most of the acceleration peaks in
Table 6 were less than 0.25 m/s
2 (i.e., 0.25 m/s
2, pursuant to Reference [
29]), which indicates that the suspended floors’ acceleration can meet the requirements of human comfort under some seismic conditions. It was clearly shown that the placement of the viscous dampers plays an important role in reducing the acceleration response. In addition, the optimal damping effect can be achieved by optimizing the parameters of the viscous dampers, similar to other researches [
30,
31,
32,
33,
34].
4.3. Displacement Response
By analysing the data collected, the relative displacement of each layer can be obtained.
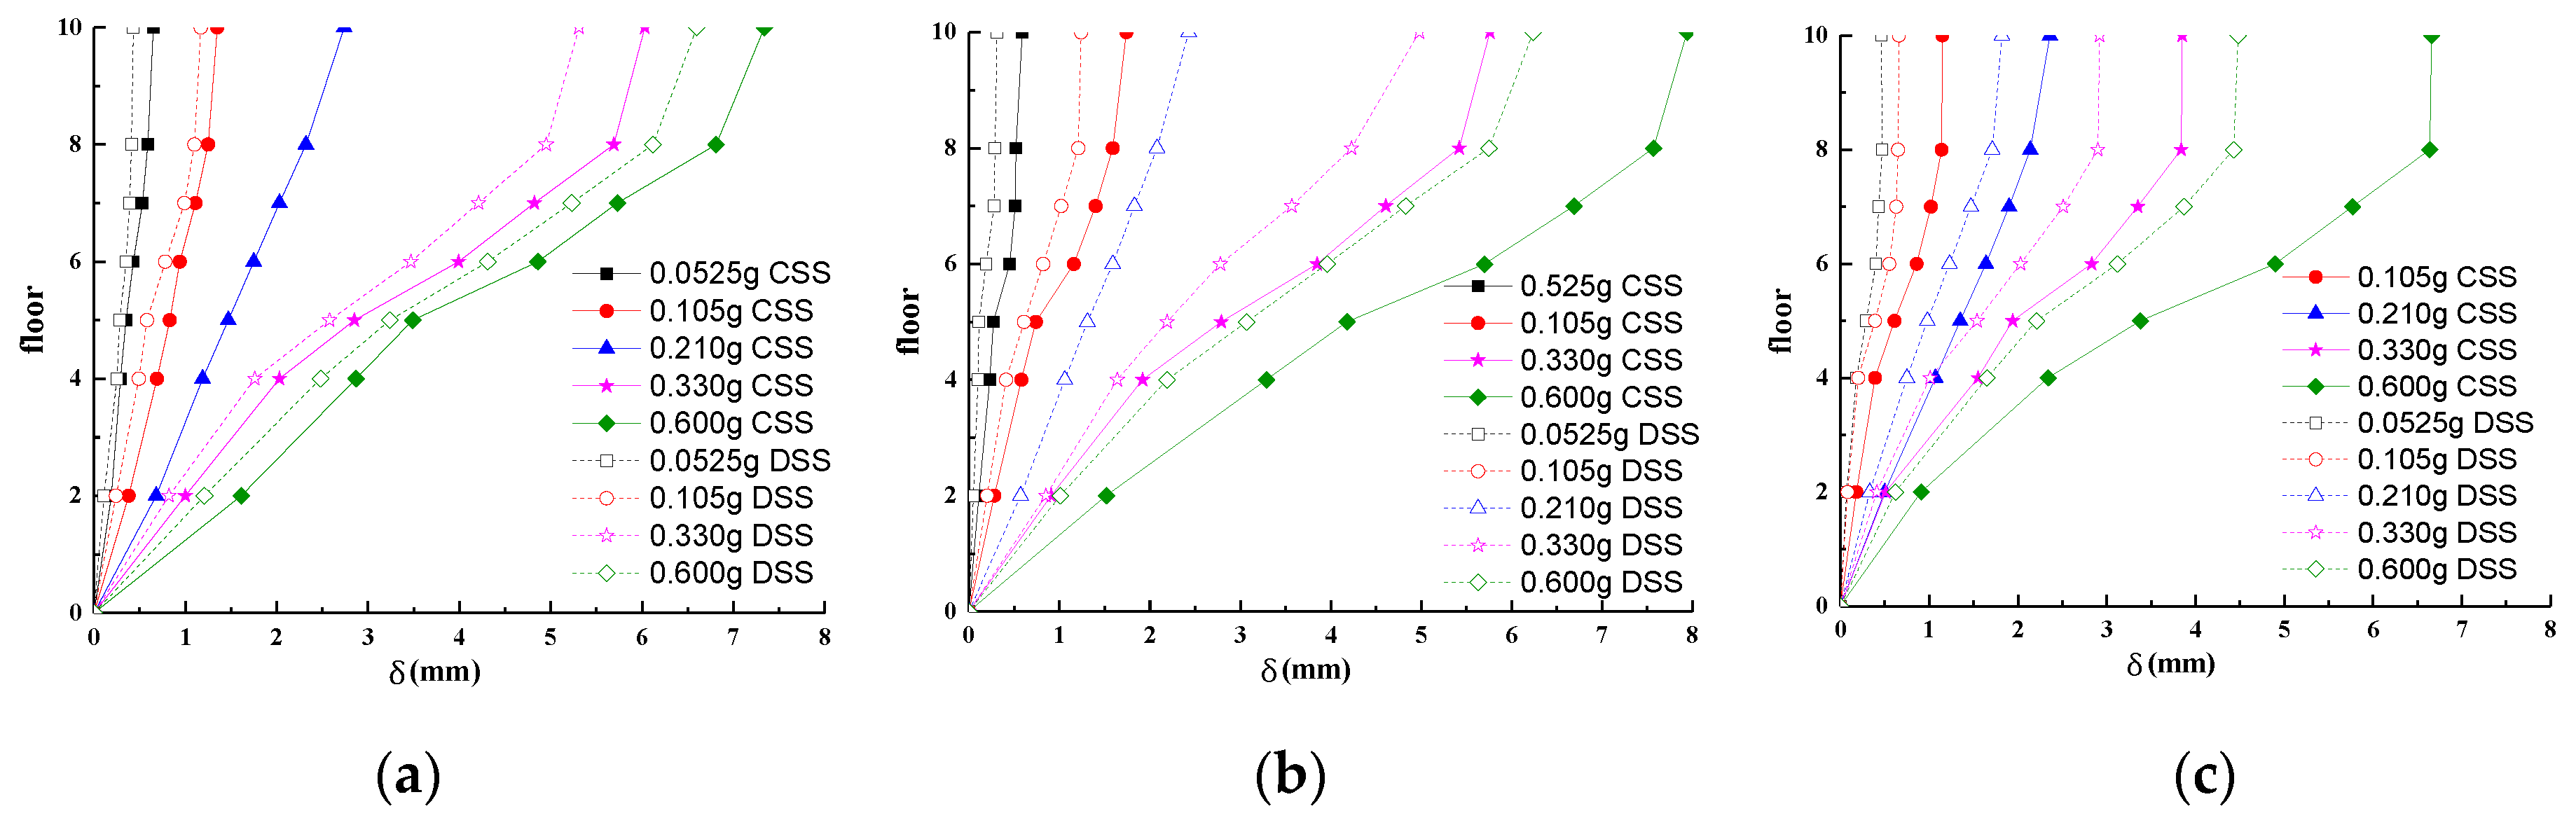
Figure 10 shows the maximum relative displacements of each layer under three earthquake waves. The maximum relative displacement is the maximum difference between the displacement of each layer and the displacement of the shaking table under the same case.
It can be seen that with the increase of the peak acceleration input and the height of the model structures, the relative displacement of each layer gradually increased. The comparison and analysis showed that under 7 and 8 frequent earthquakes, the relative displacement of each layer was not much different. However, under 9 frequent and 7, 8 rare earthquakes, the relative displacement of each layer increased significantly, and the difference was large. Furthermore, the response under the Taft wave was slightly larger than those of the other two waves, according to the maximum relative displacement of the same floors, and the maximum relative displacement of the tenth layer under 8 rare earthquake (PGA = 0.600 g) was 7.94 mm (
Figure 10b).
It can also be seen that the damping suspended structure (DSS) had a smaller relative displacement compared with that of the conventional suspended structure (CSS). Through analysis and calculation of the data in the above figure, it was found that: (i) the reduction effect of displacement at the model structure’s top was 10.08–49.55%. This meant the dampers installed between the mega columns and suspended floors can help the primary structure to dissipate a lot of the input earthquake energy. Furthermore, displacement can also be considerably reduced. (ii) Different seismic wave inputs had different reduction effects. The damping suspended structure had the best reduction effect under 7 frequent earthquake of the Taft wave, while under 8 rare earthquake of the El Centro wave had the worst reduction effect. The reason may lie in the frequency characterization of the input earthquake excitation.
Table 7 lists the maximum inter-story drift angles at different earthquake levels. Combined with
Figure 10, it can be analysed that the positions of the maximum inter-story drift angle were mostly on the fifth floor. Additionally, the maximum inter-story drift angles of DSS were moderately less than those of CSS, except for the 7 frequent earthquake.
The maximum inter-story drift angle was 1/724 when the conventional suspended structure was subjected to frequent earthquakes. The value exceeded the limit value of frame-core tube (i.e., 1/800 pursuant to GB50011 (2010)). However, for DSS, the value was reduced to 1/856, which met the limit requirement. Even under a rare earthquake, the corresponding value was 1/196, which was well within the limit value (i.e., 1/100).
Powell and Row (1976) studied 10 storey frames and found only small increases of displacements and inter-story drifts when p-delta effects were considered. The maximum inter-storey drifts under a rare earthquake in
Table 7 were 1/138 and 1/196 respectively, which was far less than a maximum inter-story drift of only 1.2% of the story height. Therefore, the influence of p-delta on the two model structures can be considered negligible.
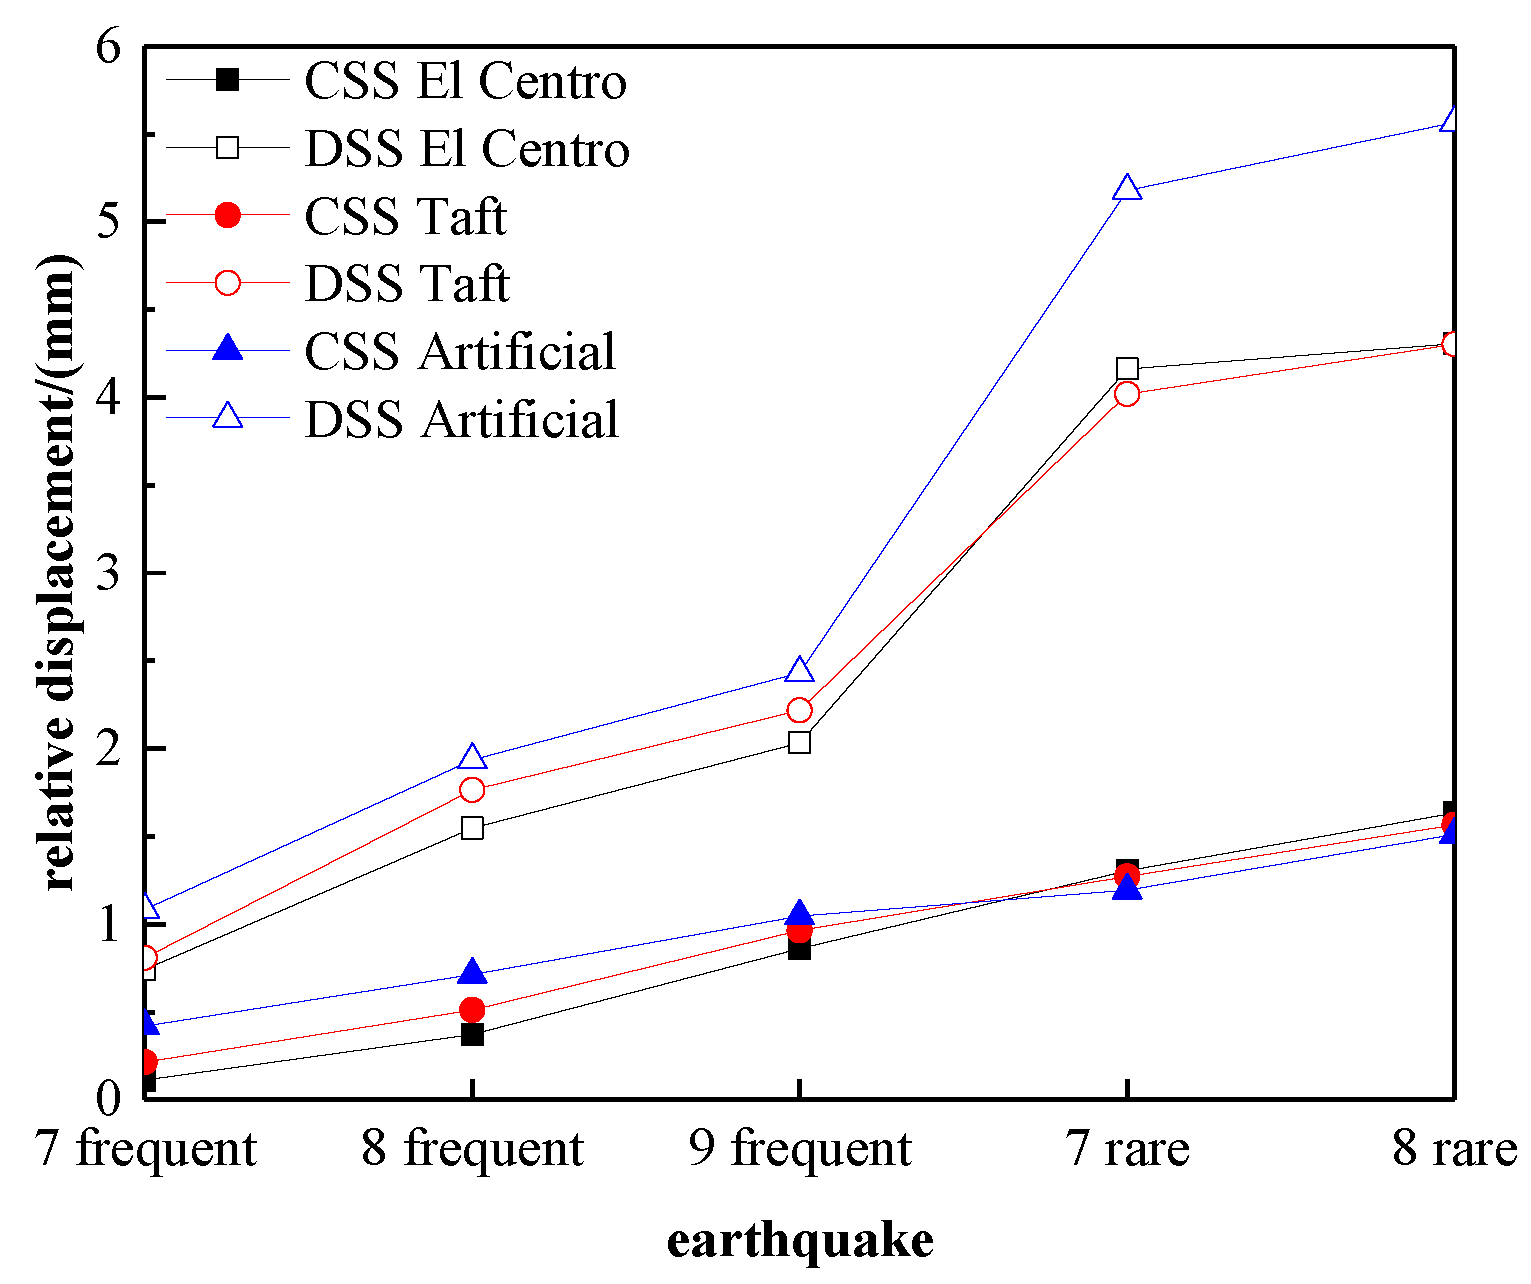
Figure 11 shows the maximum relative displacement of the suspended floor and the primary structure of the damping suspended structure and the conventional suspended structure. It can be seen from
Figure 11 that as the seismic load increased, the maximum relative displacement also increased, and the damping suspended structure’s maximum relative displacements were significantly larger than those of the conventional structure, which indicates the swing of the suspended floors. The consumption of the viscous dampers played an important role in reducing the displacement response of the structure. Additionally, inputting the different seismic waves of the same level, the maximum relative displacements of the two structure models were different, and for the damping suspended structure, the relative displacements of the artificial wave were slightly larger than those of the El Centro wave and the Taft wave.
4.4. Strain Response
The bottom corner of each giant column, the ends, and the mid-span of the top suspended beams are all key parts of the experimental model structure. The maximum strain measured by different strain gauges in the same part of the structure was taken as the maximum strain response of the part, and the maximum stress response of the part could then be indirectly calculated.
The structural strain response increased with the increase of the seismic load level. Because of the huge amount of data, only the maximum strain response of the key parts under 9 frequent earthquake is shown in
Table 8.
In contrast, the damping suspended structure certainly had a considerable and stable reduction of strain response. Considering the material of steel wire, the maximum peak strain response was reduced by 28.4–66.1%, while for the concrete, the maximum peak strain response was also similarly decreased, by 42.3–72.7%, for the damping suspended structure compared with the conventional suspended structure. It is clear that the maximum peak strain response at the end of the top suspended beam was larger than the strain at the bottom of the column and mid-span of the beam, and the reduction effect here was also superior to the other two positions, especially under the Taft wave.
5. Conclusions
Through the shaking table tests and comparative analysis of the damping suspended structure and the conventional suspended structure, the following conclusions can be obtained:
Compared with the conventional suspended structure, the damping suspended structure, which uses viscous dampers to connect the suspended floors with the primary structure, had a reduced natural vibration frequency, and the damping ratio of the damping structure was improved, especially the first frequency and the corresponding damping ratio.
The acceleration amplification factor of the two test models did not change much with the increase of seismic intensity, but increased obviously with the structural height, and the maximum acceleration amplification factor was mainly in the range of 1.6 to 2.0. The acceleration peak response at the top of the primary structure of the damping suspended structure was smaller than that of the conventional suspended structure, and the reduction effect was around 20%. The acceleration peak of the fifth suspended floor of the damping suspended structure was also smaller than that of the conventional suspended structure, but the reduction effect was particularly noticeable, up to 90%. These results show that the viscous damper has a good energy dissipation effect.
Compared with the conventional suspended structure, the maximum relative displacement response of each floor of the damping suspended structure was significantly reduced. Different seismic wave inputs had different damping effects, of which the under 7 frequent earthquake of the Taft wave had the best reduction effect, while the under 8 rare earthquake of the El Centro wave was the worst.
The maximum inter-storey drift angles were not great, with a maximum of 1/138 for CSS and 1/196 for DSS under rare earthquakes, which was less than that allowed by GB50011-2010 (1/100), which shows that the design of the test model is reasonable.
Using viscous dampers to connect the suspended floors with the primary structure, the maximum relative displacement of them was larger than that of the conventional suspended structure, which indicates that the stronger the connection between the primary and secondary structures, the smaller the relative displacement. It was further illustrated that the damping suspended structure was consuming energy due to the swinging of the suspended floor and the viscous dampers.
Compared with the conventional suspended structure, the maximum peak strain response of steel wire for the damping suspended structure was reduced by 28.4–66.1%, and for the concrete, the maximum peak strain response was also similarly decreased by 42.3–72.7%.
Author Contributions
Conceptualization, W.C., B.Y. and S.K.; methodology, W.C.; software, W.C.; validation, W.C., B.Y. and S.K.; formal analysis, W.C.; investigation, W.C.; resources, S.K.; data curation, W.C.; writing—original draft preparation, W.C.; writing—review and editing, B.Y. and S.K.; visualization, W.C.; supervision, S.K.; project administration, S.K.; funding acquisition, W.C. and S.K.
Funding
This work was supported by the national Natural Science Foundation of China (grant numbers: 51508491) and Scholarship for Overseas Studies in Yancheng Institute of Technology.
Acknowledgments
The authors are grateful to the European Commission for H2020-MSCA-RISE Project No. 691135 “RISEN: Rail Infrastructure Systems Engineering Net-work” (
www.risen2rail.eu) [
35].
Conflicts of Interest
The authors declare there is no conflict of interest of this regarding the publication of this paper.
References
- Goodno, B.J.; Gere, J.M. Analysis of shear cores using superelements. J. Struct. Div. 1976, 102, 267–283. [Google Scholar]
- Goodno, B.J.; Gere, J.M. Earthquake Behavior of Suspended-Floor Buildings. J. Struct. Div. 1976, 102, 973–992. [Google Scholar]
- Nikolaen, N.A.; Burgamen, I.N. Earthquake resistance of structures with suspended masses. In Proceedings of the 5th International Conference on Computational Method in Structural Dynamics and Earthquake Engineering, Crete Island, Greece, 25–27 May 2015. [Google Scholar]
- Dahai, L.; Cuiru, Y. The Optimization of High-Rise Building Structure Design; China Building Industry Press: Beijing, China, 1996. [Google Scholar]
- Tuan, A.Y.; Shang, G.Q. Vibration control in a 101-storey building using a tuned mass damper. J. Appl. Sci. Eng. 2014, 17, 141–156. [Google Scholar]
- Huang, J.Q.; Chong, X.; Jiang, Q.; Ye, X.G.; Wang, H.Q. Seismic Response Reduction of Megaframe with Vibration Control Substructure. Shock Vib. 2018, 2018, 9427908. [Google Scholar] [CrossRef]
- Jiang, Q.; Lu, X.; Guan, H.; Ye, X. Shaking table model test and FE analysis of a reinforced concrete mega-frame structure with tuned mass dampers. Struct. Design Tall Spec. Build. 2014, 23, 1426–1442. [Google Scholar] [CrossRef]
- Nagarajaiah, S.; Sonmez, E. Structures with semiactive variable stiffness single/multiple tuned mass dampers. J. Struct. Eng. 2007, 133, 67–77. [Google Scholar] [CrossRef]
- Li, C. Performance of multiple tuned mass dampers for attenuating undesirable oscillations of structures under the ground acceleration. Earthq. Eng. Struct. Dyn. 2000, 29, 1405–1421. [Google Scholar] [CrossRef]
- Xu, B.; Huang, L. Research on Dynamic Characteristics of Shear Suspended Structure. J. Kunming Univ. Sci. Technol. 2004, 3, 56–62. [Google Scholar]
- Jun, D.; Deng, H.; Nie, Y.; Wang, Z. Studies on control of wind-induced vibration of mega-structure suspension systems. Eng. Mech. 2001, 18, 73–78. [Google Scholar]
- Wang, Z.; Deng, H.; Dong, J. A study of aseismic properties of huge frame suspended structure in tall buildings. J. Build. Struct. 1999, 20, 23–30. [Google Scholar]
- Liang, Q.; Zhang, Y. Analysis of the dynamic system and aseismic properties of megaframe with suspension system. J. South China Univ. Technol. 1998, 26, 1–6. [Google Scholar]
- Zhang, Y.; Liang, Q.; Fu, G. The Earthquake Philosophy and Initial Design of Megaframe with Suspension Systems. Eng. Mech. 2000, 17, 10–17. [Google Scholar]
- Kim, J.; Jung, M. Progressive collapse-resisting capacity of modular mega-frame buildings. Struct. Des. Tall Spec. Build. 2013, 22, 471–484. [Google Scholar] [CrossRef]
- Yongsheng, Z. Analysis and Experimental Research on Vibration Reduction Parameters of Suspension Structure System of High-Rise Buildings. Ph.D. Dissertation, Tongji University, Shanghai, China, 2001. [Google Scholar]
- Lu, X.; Li, P.; Guo, X.; Shi, W.; Liu, J. Vibration control using ATMD and site measurements on the Shanghai World Financial Center Tower. Struct. Des. Tall Spec. Build. 2014, 23, 105–123. [Google Scholar] [CrossRef]
- Lu, X.; Zhou, B.; Zhao, B.; Lu, W. Shaking table test and numerical analysis of a high-rise building with steel reinforce concrete column and reinforce concrete core tube. Struct. Des. Tall Spec. Build. 2015, 24, 1019–1037. [Google Scholar] [CrossRef]
- Ceccotti, A.; Sandhaas, C.; Okabe, M.; Yasumura, M.; Minowa, C.; Kawai, N. SOFIE project–3D shaking table test on a seven-storey full-scale cross-laminated timber building. Earthq. Eng. Struct. Dyn. 2013, 42, 2003–2021. [Google Scholar] [CrossRef]
- Chinese Standards for Architecture and Industry, JGJ/T101-2015. Specification for Seismic Test of Buildings; China Architecture and Industry Press: Beijing, China, 2015. [Google Scholar]
- Tong, Z. Research on Similar Problems of Structural Dynamic Model and Structural Dynamic Testing Technology. Ph.D. Dissertation, Dalian University of Technology, Dalian, China, 2004. [Google Scholar]
- Yang, J. Similarity Theory and Model Test; Wuhan University of Technology Press: Wuhan, China, 2005. [Google Scholar]
- Xie, D. Similar Methods and Dimensional Theory in Mechanics; Science Press: Beijing, China, 2008. [Google Scholar]
- Chinese Standards for Architecture and Industry, GB 50011-2010. Code for Seismic Design of Buildings; China Architecture and Industry Press: Beijing, China, 2010. [Google Scholar]
- Zhou, Y.; Gong, S.; Lu, X. Study on Shaking Table Test of a Steel Structure with Additional Visco-elastic Dampers. J. Build. Struct. 2014, 35, 1–10. [Google Scholar]
- Smith, R.; Merello, R.; Willford, M. Intrinsic and Supplementary Damping in Tall Buildings. Struct. Build. 2010, 163, 111–118. [Google Scholar] [CrossRef]
- Ge, M.; Hao, J.; Yu, J. Shaking Table Test of Buckling-restrained Steel Plate Shear Walls. J. Constr. Steel Res. 2017, 137, 254–261. [Google Scholar] [CrossRef]
- Kechuan, W.; Zhong, T.; HaiShaking, G. Table Test on RC Frame Structure with Buckling Restrained Braces. J. Build. Struct. 2015, 36, 18–28. [Google Scholar]
- Chinese Standards for Architecture and Industry, JGJ3-2010. Technical Specification for Concrete Structures of Tall Building; China Architecture and Industry Press: Beijing, China, 2010. [Google Scholar]
- Ngamkhanong, C.; Kaewunruen, S.; Baniotopoulos, C. Far-Field Earthquake Responses of Overhead Line Equipment (OHLE) Structure Considering Soil-Structure Interaction. Front. Built Environ. 2018, 4, 5. [Google Scholar] [CrossRef]
- Kaewunruen, S.; Ngamkhanong, C.; Liu, X. Spectro-temporal responses of curved railway tracks with variable radii of arc curves. Int. J. Struct. Stab. Dyn. 2019, 19. [Google Scholar] [CrossRef]
- Mirza, O.; Kaewunruen, S.; Galia, D. Seismic vulnerability analysis of Bankstown’s West Terrace railway bridge. Struct. Eng. Mech. 2016, 57, 3–569. [Google Scholar] [CrossRef]
- Kaewunruen, S.; Li, D.; Chen, Y.; Xiang, Z. Enhancement of Dynamic Damping in Eco-Friendly Railway Concrete Sleepers Using Waste-Tyre Crumb Rubber. Materials 2018, 11, 1169. [Google Scholar] [CrossRef] [PubMed]
- Mirza, O.; Kaewunruen, S. Resilience and Robustness of Composite Steel and Precast Concrete Track Slabs Exposed to Train Derailments. Front. Built Environ. 2018, 4, 60. [Google Scholar] [CrossRef]
- Kaewunruen, S.; Sussman, J.M.; Matsumoto, A. Grand Challenges in Transportation and Transit Systems. Front. Built Environ. 2016, 2, 4. [Google Scholar] [CrossRef]
Figure 1.
The HSBC Bank in Hong Kong. (a) Picture; (b) longitudinal section; (c) cross section.
Figure 1.
The HSBC Bank in Hong Kong. (a) Picture; (b) longitudinal section; (c) cross section.
Figure 2.
Schematic of structural plane and elevation. (a) Front view; (b) frame-beam floor plan; (c) suspended floor plan.
Figure 2.
Schematic of structural plane and elevation. (a) Front view; (b) frame-beam floor plan; (c) suspended floor plan.
Figure 3.
Schematic diagrams of two types of connection. (a) Viscous damper; (b) rigid connecting rod.
Figure 3.
Schematic diagrams of two types of connection. (a) Viscous damper; (b) rigid connecting rod.
Figure 4.
Experimental model.
Figure 4.
Experimental model.
Figure 5.
The weight scheme of the test model. (a) The weight scheme of the primary structure; (b) the weight scheme of suspended floors.
Figure 5.
The weight scheme of the test model. (a) The weight scheme of the primary structure; (b) the weight scheme of suspended floors.
Figure 6.
Layout of the displacement and acceleration sensors.
Figure 6.
Layout of the displacement and acceleration sensors.
Figure 7.
Acceleration curve and response spectrum of three waves. (a) Acceleration time history curve of El Centro wave; (b) response spectrum of El Centro wave; (c) acceleration time history curve of Taft wave; (d) response spectrum of Taft wave; (e) acceleration time history curve of artificial wave; (f) response spectrum of artificial wave.
Figure 8.
Amplification factor of acceleration. (a) 7 frequent earthquake; (b) 8 frequent earthquake; (c) 9 frequent earthquake; (d) 7 rare earthquake; (e) 8 rare earthquake.
Figure 8.
Amplification factor of acceleration. (a) 7 frequent earthquake; (b) 8 frequent earthquake; (c) 9 frequent earthquake; (d) 7 rare earthquake; (e) 8 rare earthquake.
Figure 9.
Acceleration time history curves at top of primary structure under 9 frequent earthquake. (a) Acceleration time history under El Centro; (b) Acceleration time history under Taft; (c) Acceleration time history under artificial wave.
Figure 9.
Acceleration time history curves at top of primary structure under 9 frequent earthquake. (a) Acceleration time history under El Centro; (b) Acceleration time history under Taft; (c) Acceleration time history under artificial wave.
Figure 10.
Maximum relative displacements of model structures. (a) Under El Centro; (b) under Taft; (c) under artificial wave.
Figure 10.
Maximum relative displacements of model structures. (a) Under El Centro; (b) under Taft; (c) under artificial wave.
Figure 11.
Maximum displacement of a suspended floor relative to the primary structure.
Figure 11.
Maximum displacement of a suspended floor relative to the primary structure.
Table 1.
Parameters of viscous dampers.
Table 1.
Parameters of viscous dampers.
| Model | Max. Damping Force | Damping Coefficient | Max.travel |
|---|
| 1 × 4D | 2005 N | 5kN s/m | 102 mm |
Table 2.
Mechanical properties of galvanized steel wire.
Table 2.
Mechanical properties of galvanized steel wire.
| Diameter (mm) | Yield Strength (Mpa) | Tensile Strength (Mpa) | Elastic Modulus (Mpa) |
| 2 | 240 | 300 | 2.00 × 10⁵ |
| 4 | 240 | 300 | 2.00 × 10⁵ |
Table 3.
Similitude ratios of experimental model.
Table 3.
Similitude ratios of experimental model.
| Physical Quantity | Similarity | Similar Constant |
|---|
| length | SL | 1/20 |
| elastic modulus | SE | 1/5 |
| equivalent mass density | Sm | 2.67 |
| stress | | 1/5 |
| time | St | 1/5.48 |
| acceleration | Sa | 1.50 |
Table 4.
Seismic loading sequence.
Table 4.
Seismic loading sequence.
| Case | Excitation | Earthquake Intensity | PGA/g |
|---|
| 1 | white noise | - | 0.050 |
| 2 | El Centro | 7 frequent | 0.0525 |
| 3 | Taft | | 0.0525 |
| 4 | artificial | | 0.0525 |
| 5 | white noise | - | 0.050 |
| 6 | El Centro | 8 frequent | 0.105 |
| 7 | Taft | | 0.105 |
| 8 | artificial | | 0.105 |
| 9 | white noise | - | 0.050 |
| 10 | El Centro | 9 frequent | 0.210 |
| 11 | Taft | | 0.210 |
| 12 | artificial | | 0.210 |
| 13 | white noise | - | 0.050 |
| 14 | El Centro | 7 rare | 0.330 |
| 15 | Taft | | 0.330 |
| 16 | artificial | | 0.330 |
| 17 | white noise | - | 0.050 |
| 18 | El Centro | 8 rare | 0.600 |
| 19 | Taft | | 0.600 |
| 20 | artificial | | 0.600 |
| 21 | white noise | - | 0.050 |
Table 5.
Frequency and damping ratio of model.
Table 5.
Frequency and damping ratio of model.
| Mode Shape | Conventional Suspended Structure | Damping Suspended Structure |
|---|
| Frequency (Hz) | Damping Ratio (%) | Frequency (Hz) | Damping Ratio (%) |
|---|
| 1 | 5.21 | 2.301 | 1.50 | 9.254 |
| 2 | 10.74 | 0.813 | 3.71 | 5.879 |
| 3 | 12.24 | 0.710 | 6.24 | 3.362 |
Table 6.
Acceleration of first suspended floor.
Table 6.
Acceleration of first suspended floor.
| Seismic Input | PGA/g | Conventional Structure | Damping Structure | Reduction Effect (%) |
|---|
| El Centro | 0.0525 | 0.70 | 0.09 | 87.14 |
| 0.105 | 1.47 | 0.17 | 88.44 |
| 0.210 | 3.00 | 0.35 | 88.33 |
| Taft | 0.0525 | 0.51 | 0.09 | 82.35 |
| 0.105 | 1.28 | 0.12 | 90.63 |
| 0.210 | 2.84 | 0.23 | 91.90 |
| artificial wave | 0.0525 | 0.84 | 0.12 | 85.71 |
| 0.105 | 1.64 | 0.20 | 87.80 |
| 0.210 | 3.81 | 0.38 | 90.03 |
Table 7.
Maximum inter-story drift angles.
Table 7.
Maximum inter-story drift angles.
| Earthquake intensity | PGA/g | | |
|---|
| 7 frequent | 0.0525 | 1/2101 | 1/1908 |
| 8 frequent | 0.105 | 1/840 | 1/1000 |
| 9 frequent | 0.210 | 1/724 | 1/856 |
| 7 rare | 0.330 | 1/198 | 1/235 |
| 8 rare | 0.600 | 1/138 | 1/196 |
Table 8.
Maximum strain response of key parts (με).
Table 8.
Maximum strain response of key parts (με).
| Seismic Input | Position | Steel Wire | Concrete |
|---|
| CSS | DSS | reduction | CSS | DSS | reduction |
|---|
| El Centro | BC | 136 | 90 | 33.8% | 154 | 70 | 54.5% |
| EB | 211 | 75 | 64.5% | 192 | 68 | 64.6% |
| MB | 110 | 47 | 57.3% | 60 | 31 | 48.3% |
| Taft | BC | 138 | 93 | 32.6% | 161 | 78 | 51.6% |
| EB | 257 | 87 | 66.1% | 194 | 53 | 72.7% |
| MB | 102 | 43 | 57.8% | 52 | 30 | 42.3% |
| artificial wave | BC | 141 | 101 | 28.4% | 166 | 87 | 47.6% |
| EB | 240 | 98 | 59.2% | 176 | 95 | 46.0% |
| MB | 97 | 42 | 56.7% | 49 | 26 | 46.9% |
© 2019 by the authors. Licensee MDPI, Basel, Switzerland. This article is an open access article distributed under the terms and conditions of the Creative Commons Attribution (CC BY) license (http://creativecommons.org/licenses/by/4.0/).


