Stochastic Natural Frequency Analysis of Composite Structures Based on Micro-Scale and Meso-Scale Uncertainty


Abstract
1. Introduction
2. Material Statistics
2.1. Micro-Scale Statistics
2.2. Meso-Scale Statistics
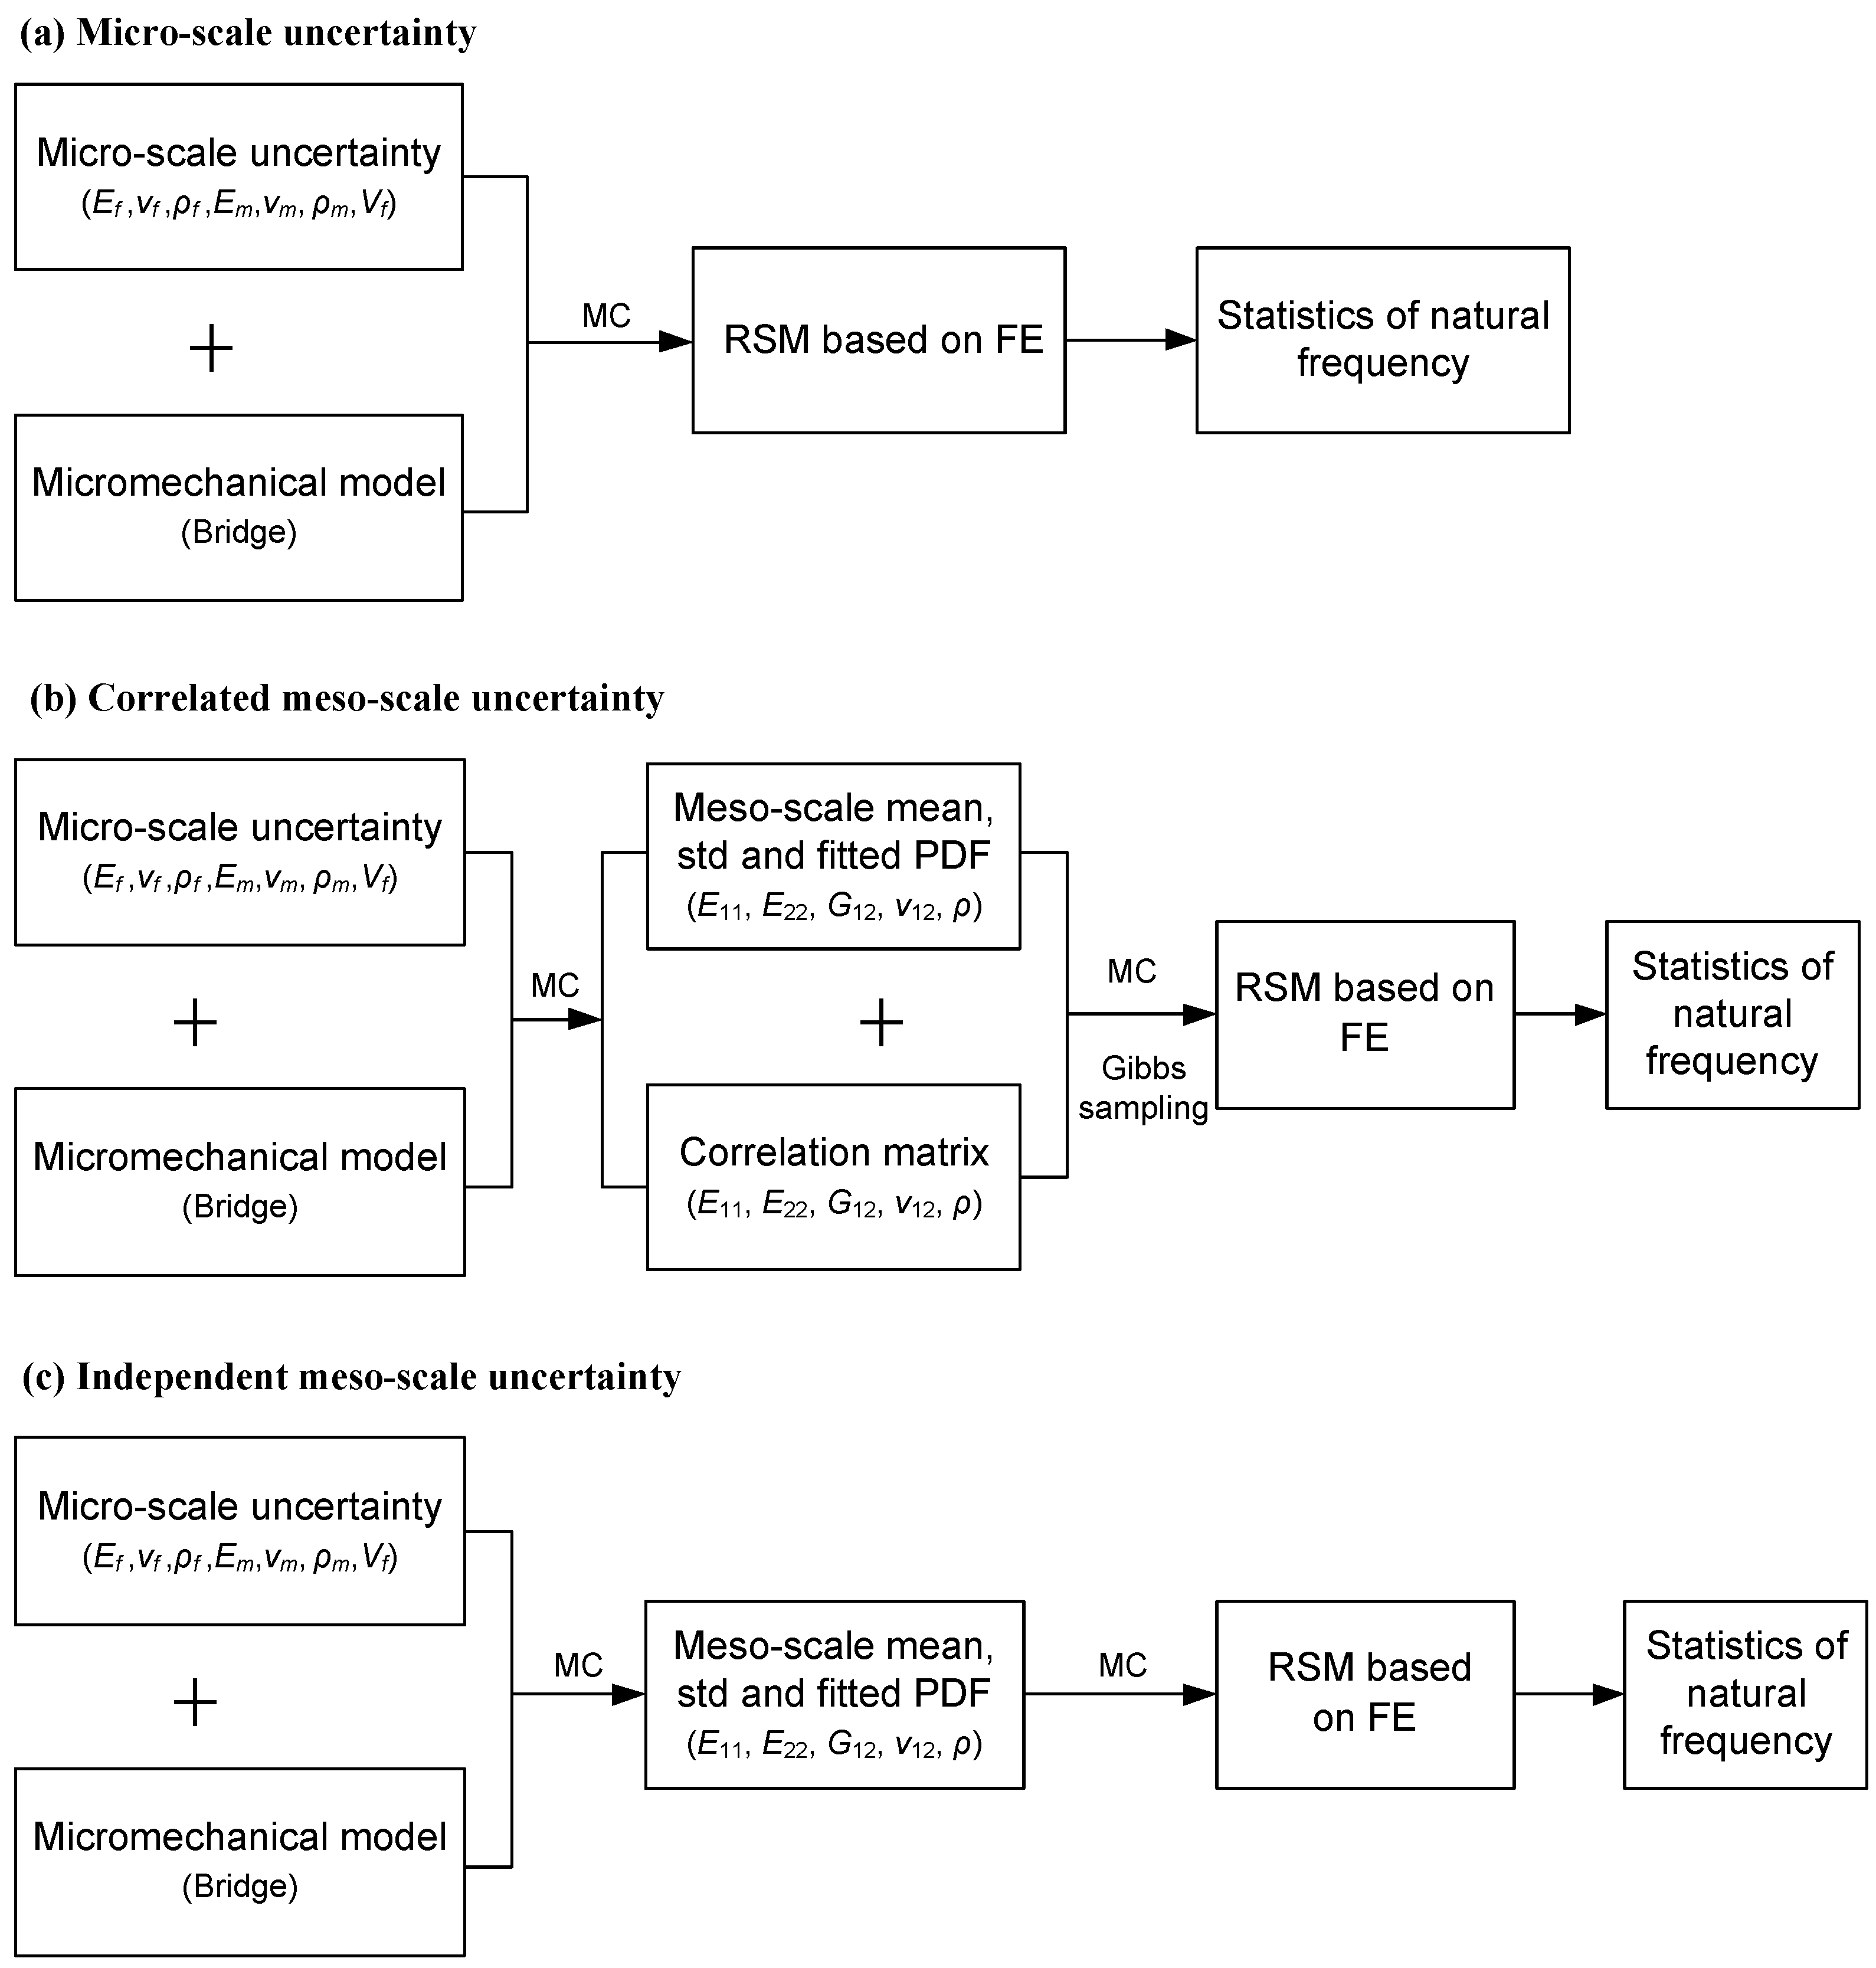
3. Analysis of Stochastic Natural Frequency
3.1. Laminated Plate
- (1)
- Initiation of random variable xi (i = 1, 2, …, n);
- (2)
- For t = 0, 1, 2, …, do the iterative sampling as follows:
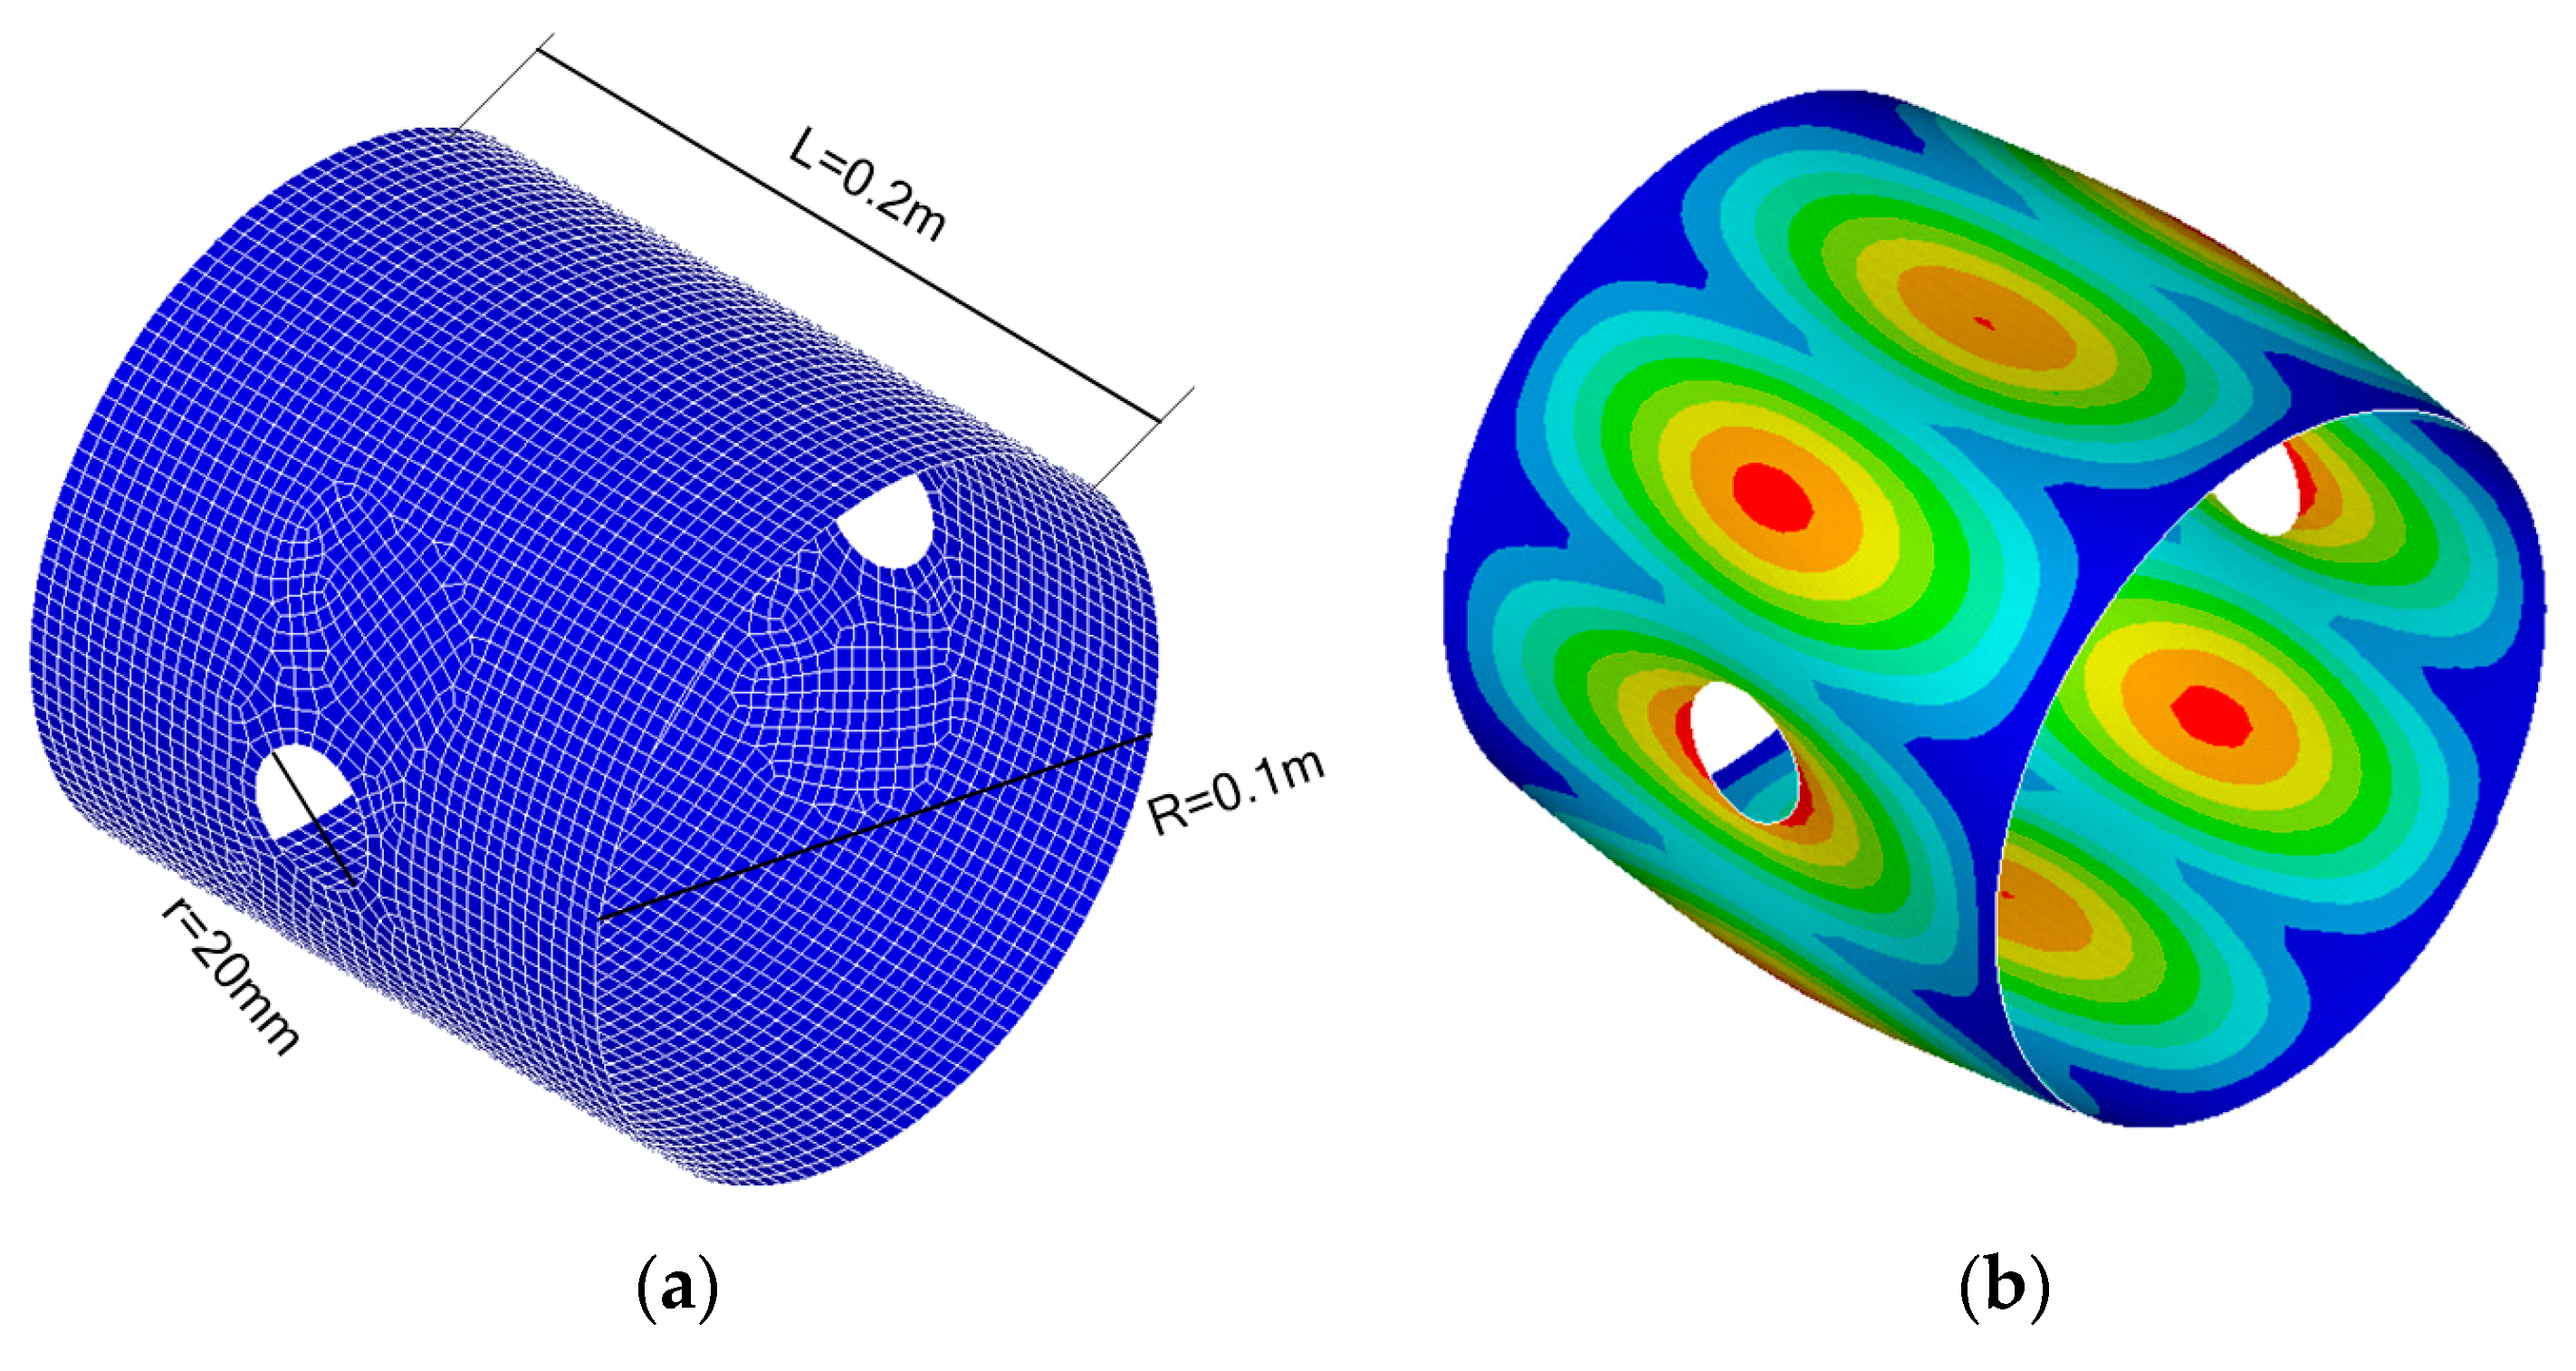
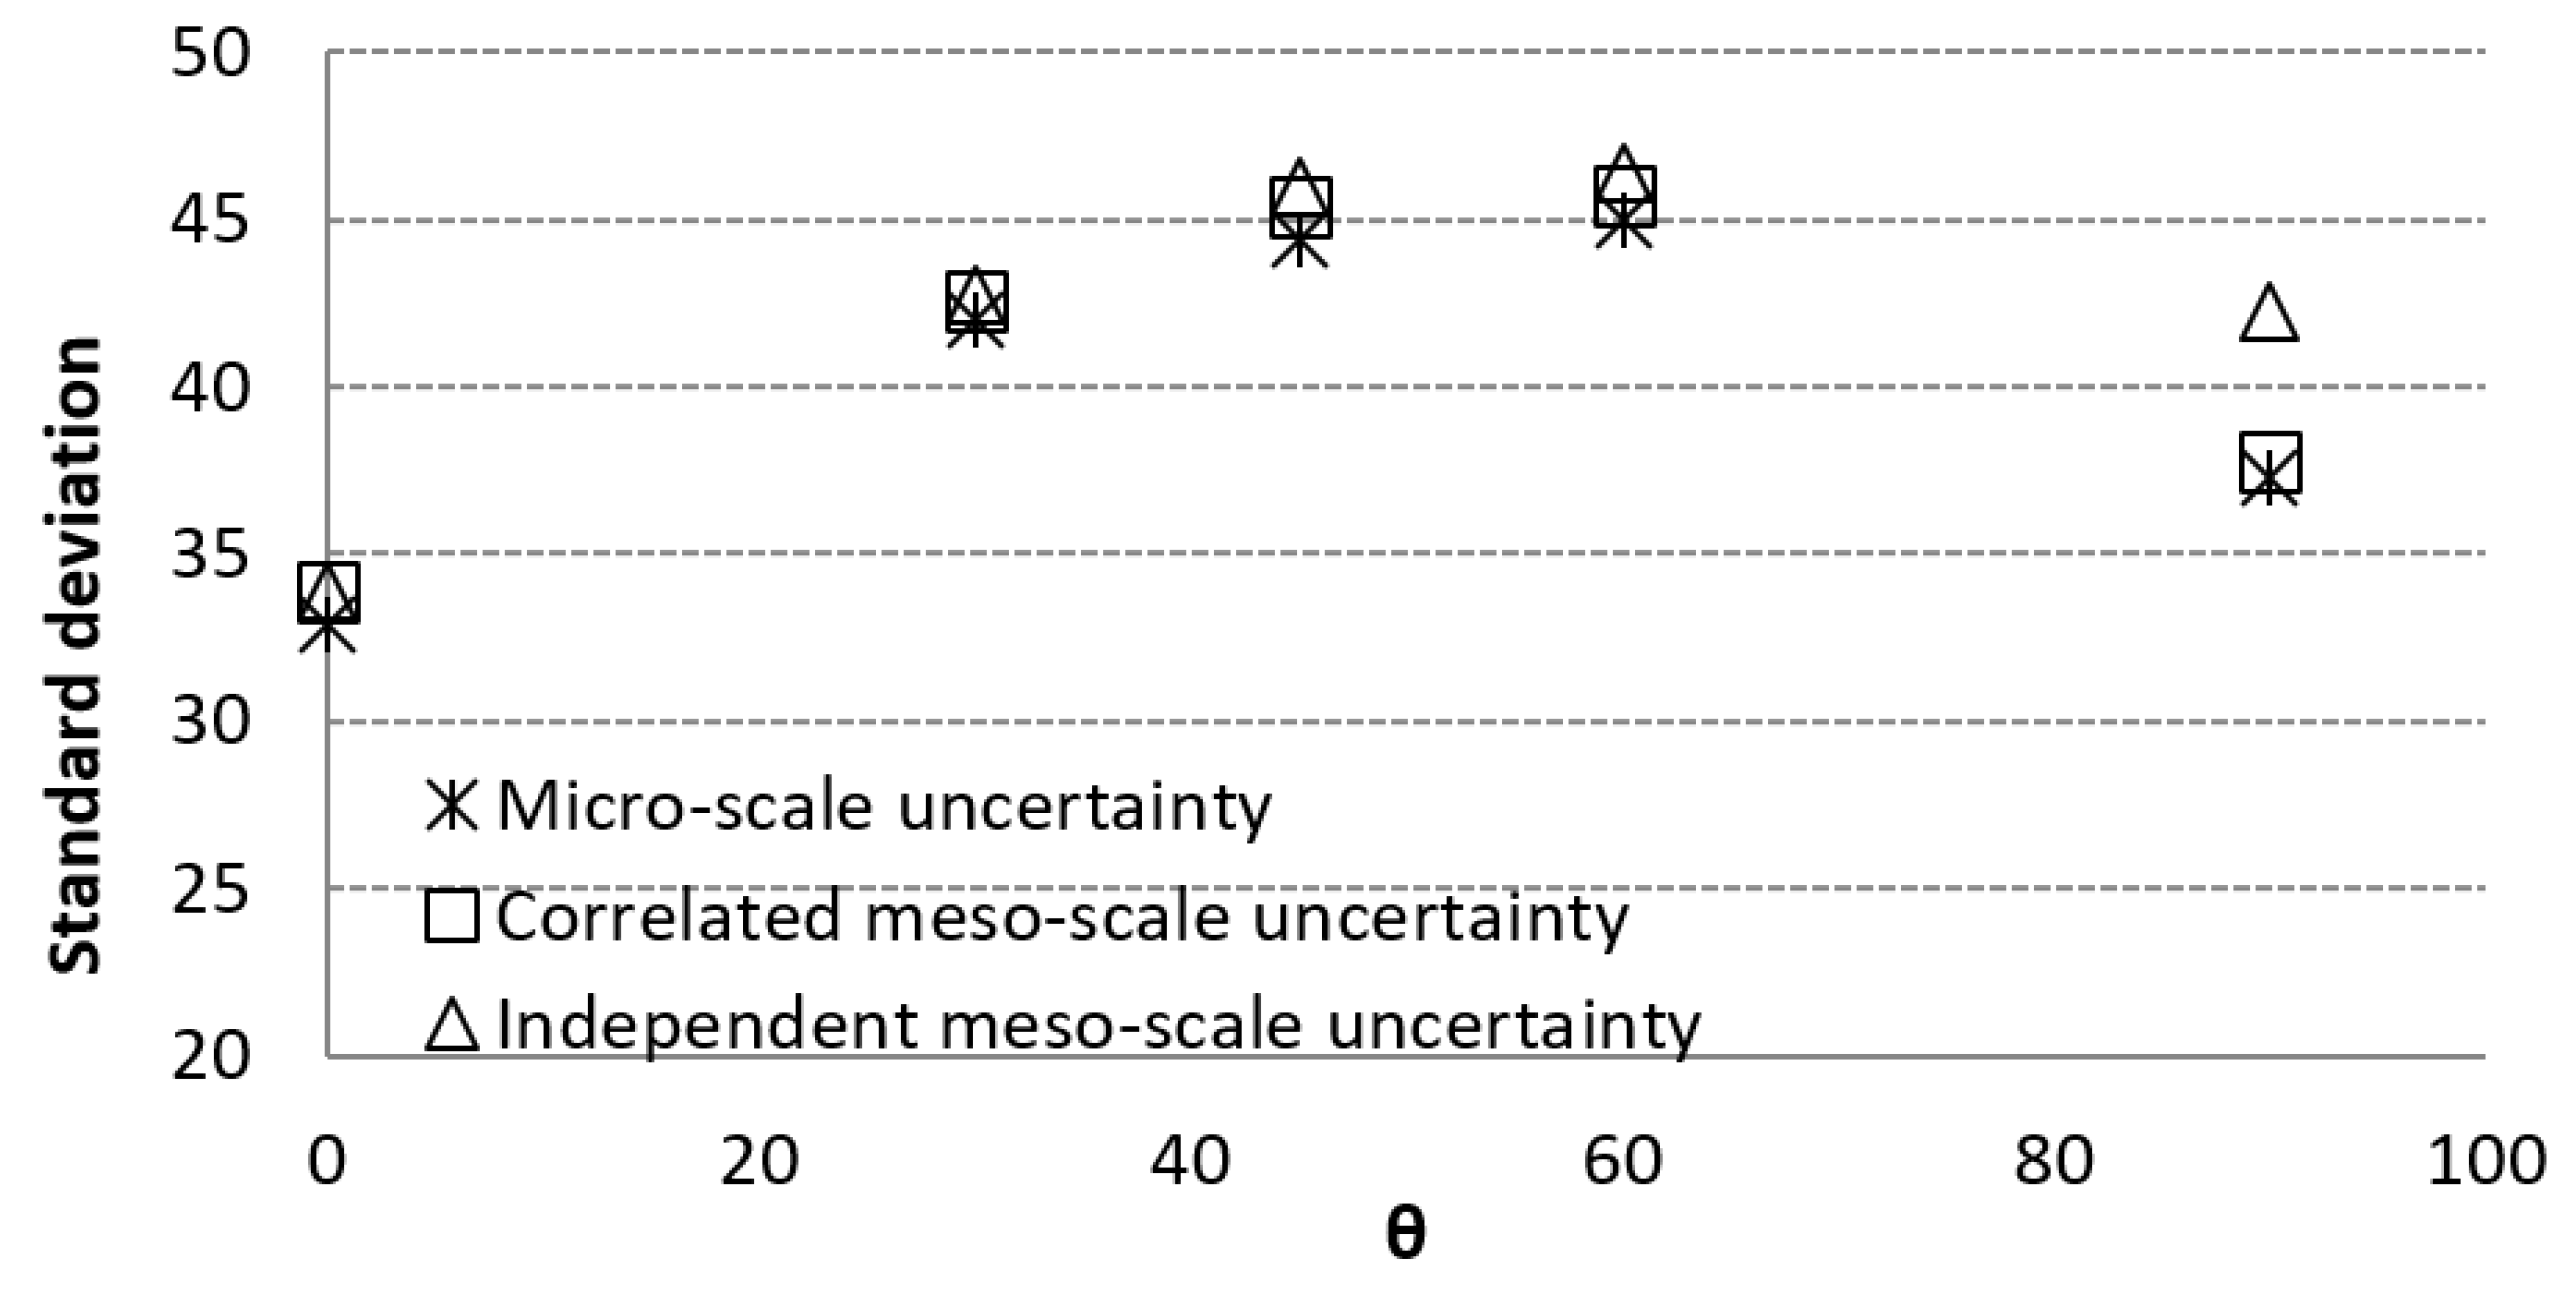
3.2. Laminated Cylindrical Shell
4. Discussion
5. Conclusions
- Natural frequency statistics of composite structures could be reasonably derived from either micro-scale random variables or meso-scale random variables but their statistical correlation needs to be well characterised;
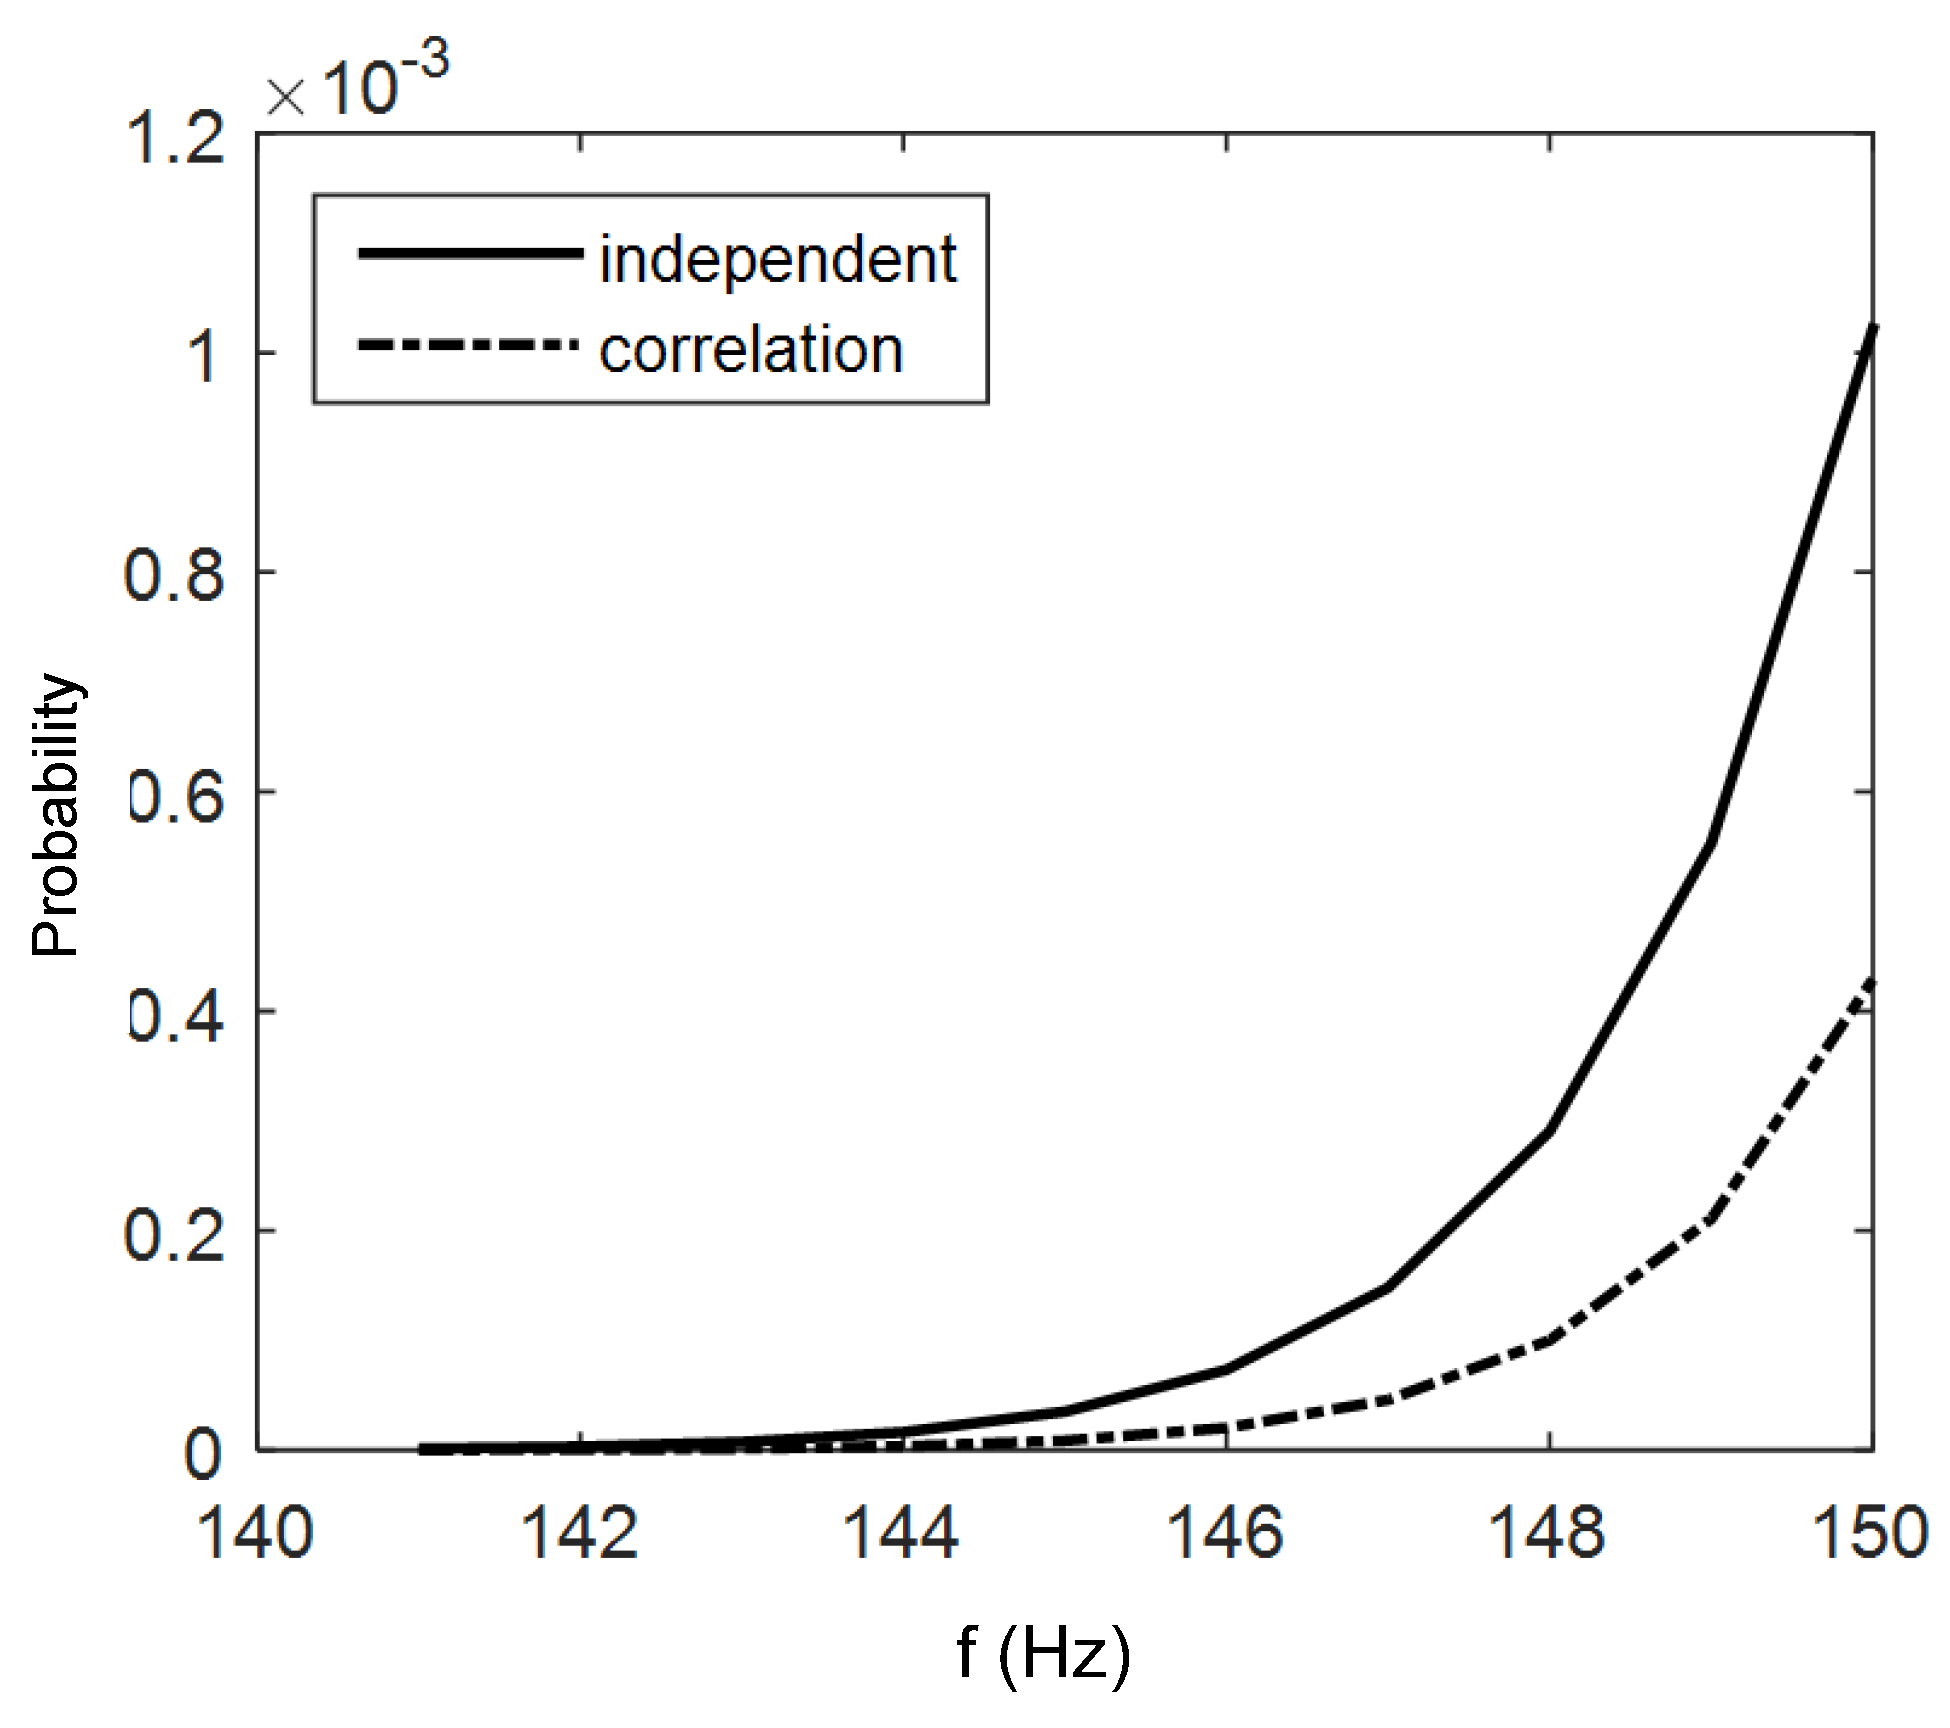
- Ignoring the statistical correlation between meso-scale uncertainty may result in large overestimation of standard deviation of structure natural frequency;
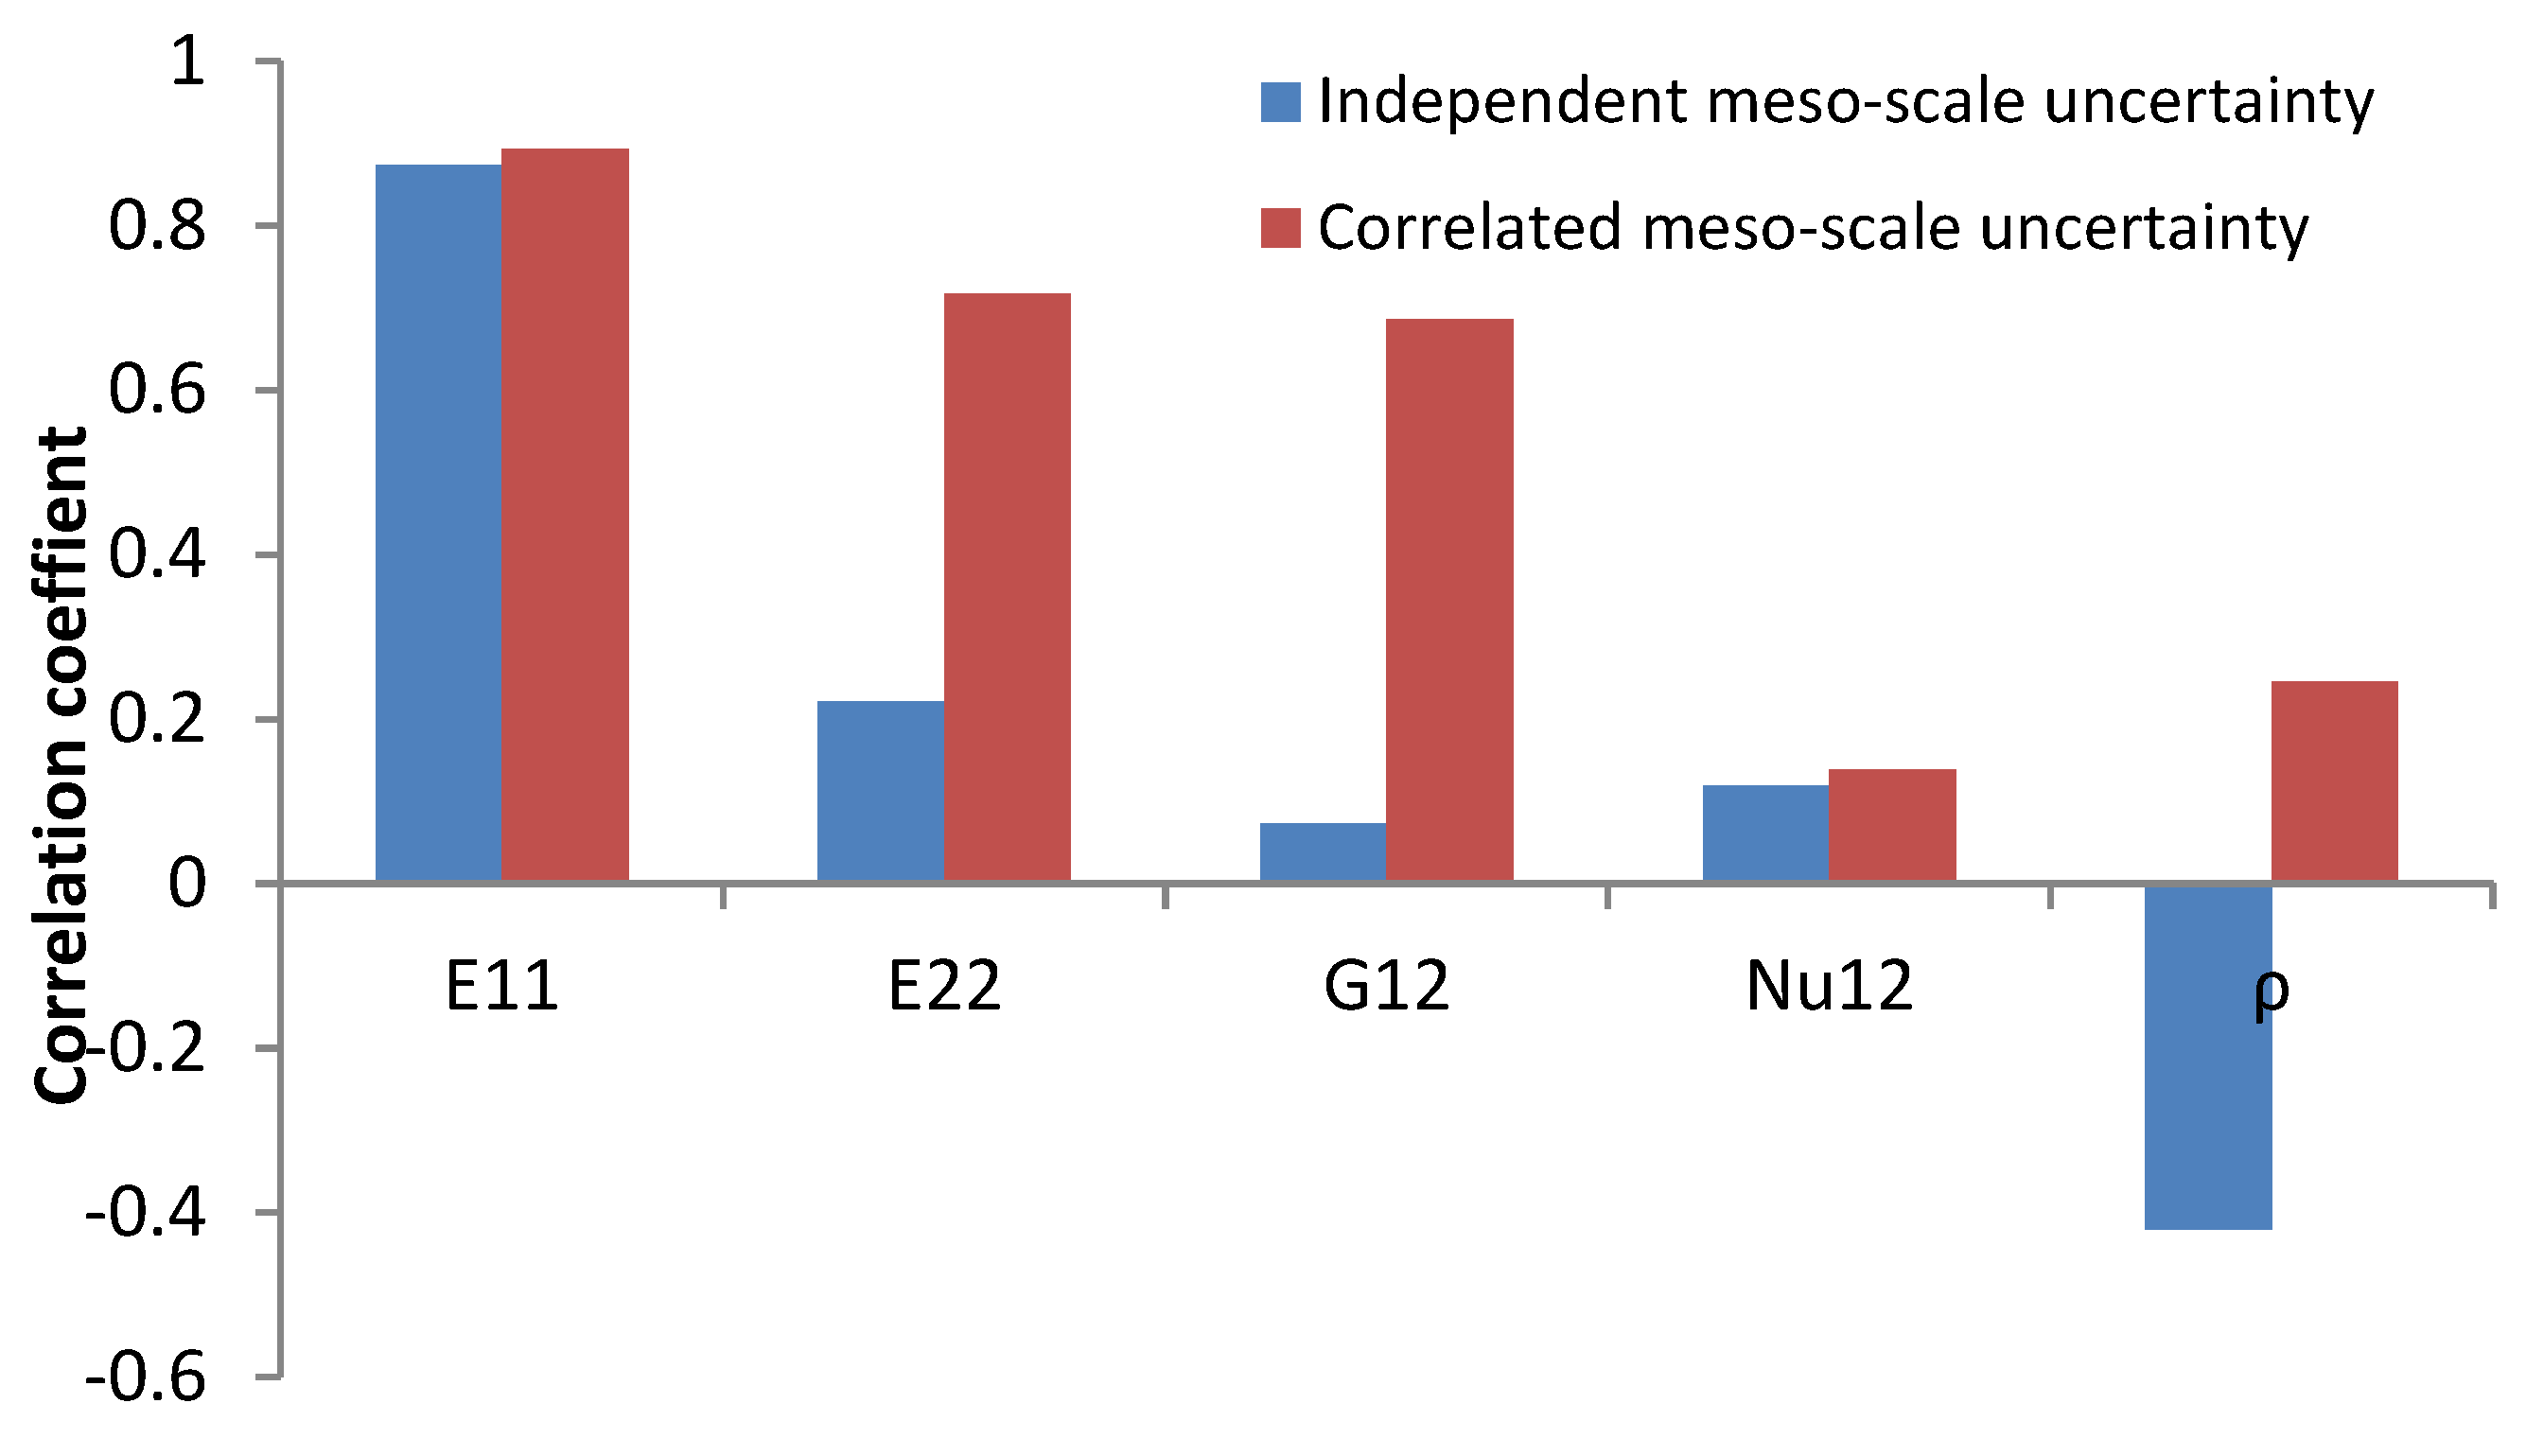
- If the natural frequency statistics of composite structures are calculated by meso-scale uncertainty, it is especially important to consider the statistical correlation associated with ply density, which is somehow not noticed by previous studies. It also shows that dependence of the stochastic variation of natural frequency over ply density is positive rather than negative.
Author Contributions
Funding
Conflicts of Interest
References
- Mustafa, G.; Suleman, A.; Crawford, C. Probabilistic micromechanical analysis of composite material stiffness properties for a wind turbine blade. Compos. Struct. 2015, 131, 905–916. [Google Scholar] [CrossRef]
- Hwang, T.-K.; Hong, C.-S.; Kim, C.-G. Probabilistic deformation and strength prediction for a filament wound pressure vessel. Compos. Part B Eng. 2003, 34, 481–497. [Google Scholar] [CrossRef]
- Chen, N.Z.; Sun, H.H.; Soares, C.G. Reliability analysis of a ship hull in composite material. Compos. Struct. 2003, 62, 59–66. [Google Scholar] [CrossRef]
- Frangopol, D.M.; Recek, S. Reliability of fiber-reinforced composite laminate plates. Probab. Eng. Eng. Mech. 2003, 18, 119–137. [Google Scholar] [CrossRef]
- Chamis, C.C.; Abumeri, G.H. Probabilistic dynamic buckling of composite shell structures. Compos. Part A Appl. Sci. Manuf. 2005, 36, 1368–1380. [Google Scholar] [CrossRef]
- Ganesan, R.; Kowda, V.K. Buckling of composite beam-columns with stochastic properties. J. Reinf. Plast. Compos. 2005, 24, 513–543. [Google Scholar] [CrossRef]
- Fan, Z.; Jiang, Y.; Zhang, S.; Chen, X. Experimental research on vibration fatigue of cfrp and its influence factors based on vibration testing. Shock Vib. 2017, 2017, 18. [Google Scholar] [CrossRef]
- Chiachio, M.; Chiachio, J.; Rus, G. Reliability in composites—A selective review and survey of current development. Compos. Part B Eng. 2012, 43, 902–913. [Google Scholar] [CrossRef]
- Oh, D.H.; Librescu, L. Free vibration and reliability of composite cantilevers featuring uncertain properties. Reliab. Eng. Syst. Safe. 1997, 56, 265–272. [Google Scholar] [CrossRef]
- Dey, S.; Mukhopadhyay, T.; Adhikari, S. Stochastic free vibration analysis of angle-ply composite plates—A rs-hdmr approach. Compos. Struct. 2015, 122, 526–536. [Google Scholar] [CrossRef]
- Dey, S.; Naskar, S.; Mukhopadhyay, T.; Gohs, U.; Spickenheuer, A.; Bittrich, L.; Sriramula, S.; Adhikari, S.; Heinrich, G. Uncertain natural frequency analysis of composite plates including effect of noise—A polynomial neural network approach. Compos. Struct. 2016, 143, 130–142. [Google Scholar] [CrossRef]
- Chakraborty, S.; Mandal, B.; Chowdhury, R.; Chakrabarti, A. Stochastic free vibration analysis of laminated composite plates using polynomial correlated function expansion. Compos. Struct. 2016, 135, 236–249. [Google Scholar] [CrossRef]
- Tawfik, M.E.; Bishay, P.L.; Sadek, E.A. Neural network-based second order reliability method (nnbsorm) for laminated composite plates in free vibration. Comp. Model. Eng. Sci. 2018, 115, 105–129. [Google Scholar]
- Yin, Q.; Lardeur, P.; Druesne, F. Performances assessment of the modal stability procedure for the probabilistic free vibration analysis of laminated composite structures. Compos. Struct. 2018, 203, 474–485. [Google Scholar] [CrossRef]
- Singh, B.N.; Yadav, D.; Iyengar, N.G.R. Free vibration of composite cylindrical panels with random material properties. Compos. Struct. 2002, 58, 435–442. [Google Scholar] [CrossRef]
- Tripathi, V.; Singh, B.N.; Shukla, K.K. Free vibration of laminated composite conical shells with random material properties. Compos. Struct. 2007, 81, 96–104. [Google Scholar] [CrossRef]
- Sriramula, S.; Chryssanthopoulos, M.K. Quantification of uncertainty modelling in stochastic analysis of frp composites. Compos. Part A Appl. Sci. Manuf. 2009, 40, 1673–1684. [Google Scholar] [CrossRef]
- Rollet, Y.; Bonnet, M.; Carrère, N.; Leroy, F.H.; Maire, J.F. Improving the reliability of material databases using multiscale approaches. Compos. Sci. Technol. 2009, 69, 73–80. [Google Scholar] [CrossRef]
- Shaw, A.; Sriramula, S.; Gosling, P.D.; Chryssanthopoulos, M.K. A critical reliability evaluation of fibre reinforced composite materials based on probabilistic micro and macro-mechanical analysis. Compos. Part B Eng. 2010, 41, 446–453. [Google Scholar] [CrossRef]
- Zhang, S.; Zhang, C.; Chen, X. Effect of statistical correlation between ply mechanical properties on reliability of fibre reinforced plastic composite structures. J. Compos. Mater. 2015, 49, 2935–2945. [Google Scholar] [CrossRef]
- Zhang, S.; Zhang, L.; Wang, Y.; Tao, J.; Chen, X. Effect of ply level thickness uncertainty on reliability of laminated composite panels. J. Reinf. Plast. Compos. 2016, 35, 1387–1400. [Google Scholar] [CrossRef]
- Zhang, S.; Wang, H.; Zhang, L.; Chen, X. Statistical correlation between elastic properties of plain-weave composite and its influence on structure reliability. Compos. Struct. 2018, 200, 939–945. [Google Scholar] [CrossRef]
- Zhou, X.Y.; Gosling, P.D.; Ullah, Z.; Kaczmarczyk, Ł.; Pearce, C.J. Exploiting the benefits of multi-scale analysis in reliability analysis for composite structures. Compos. Struct. 2016, 155, 197–212. [Google Scholar] [CrossRef]
- Zhou, X.Y.; Gosling, P.D.; Ullah, Z.; Kaczmarczyk, L.; Pearce, C.J. Stochastic multi-scale finite element based reliability analysis for laminated composite structures. Appl. Math. Model. 2017, 45, 457–473. [Google Scholar] [CrossRef]
- Naskar, S.; Mukhopadhyay, T.; Sriramula, S.; Adhikari, S. Stochastic natural frequency analysis of damaged thin-walled laminated composite beams with uncertainty in micromechanical properties. Compos. Struct. 2017, 160, 312–334. [Google Scholar] [CrossRef]
- Mounier, D.; Poilâne, C.; Bûcher, C.; Picart, P. Evaluation of transverse elastic properties of fibers used in composite materials by laser resonant ultrasound spectroscopy. In Proceedings of the 11th Congrès Français d’Acoustique (Acoustics 2012), Nantes, France, 23–27 April 2012; Available online: https://hal.archives-ouvertes.fr/hal-00811303/document (accessed on 6 June 2019).
- Sanei, S.H.R.; Fertig Iii, R.S. Length-scale dependence of variability in epoxy modulus extracted from composite prepreg. Polym. Test 2016, 50, 297–300. [Google Scholar] [CrossRef]
- Huang, Z. Micromechanical prediction of ultimate strength of transversely isotropic fibrous composites. Int. J. Solids Struct. 2001, 38, 4147–4172. [Google Scholar] [CrossRef]
- Rubinstein, R.Y.; Kroese, D.P. Simulation and the Monte Carlo Method, 2nd ed.; John Wiley & Sons: Hoboken, NJ, USA, 2007. [Google Scholar]
- Soden, P.D.; Hinton, M.J.; Kaddour, A.S. Lamina properties, lay-up configurations and loading conditions for a range of fibre-reinforced composite laminates. Compos. Sci. Technol. 1998, 58, 1011–1022. [Google Scholar] [CrossRef]
- Anderson, M.J.; Whitcomb, P.J. RSM simplified: Optimizing Processes Using Response Surface Methods for Design of Experiments, 2nd ed.; Taylor & Francis Group: London, UK, 2016. [Google Scholar]
- Reh, S.; Beley, J.-D.; Mukherjee, S.; Khor, E.H. Probabilistic finite element analysis using ansys. Struct. Saf. 2006, 28, 17–43. [Google Scholar] [CrossRef]
- Alfano, M.; Bisagni, C. Probability-based methodology for buckling investigation of sandwich composite shells with and without cut-outs. Int. J. Comput. Meth. Eng. Sci. Mech. 2017, 18, 77–90. [Google Scholar] [CrossRef]


| Mean Value | Standard Deviation | Distribution Type | |
|---|---|---|---|
| E-Glass Fibre | |||
| Ef | 72 GPa | 5 GPa [27] | Normal |
| νf | 0.25 | 0.05 [26] | Normal |
| ρf | 2540 kg/m3 | 127 kg/m3 | Normal |
| Epoxy | |||
| Em | 3.45 GPa | 0.086 GPa [27] | Normal |
| νm | 0.35 | 0.0175 | Normal |
| ρm | 1100 kg/m3 | 55 kg/m3 | Normal |
| Fibre Volume Ratio | |||
| Vf | 0.60 | 0.03 | Normal |
| Random Variables | Linear Correlation Coefficient | Mean | CoV | Experiment [30] | ||||
|---|---|---|---|---|---|---|---|---|
| E1 | E2 | G12 | υ12 | ρ | ||||
| E1 (GPa) | 1 | 44.5 | 0.083 | 45.6 | ||||
| E2 (GPa) | 0.65 | 1 | 13.2 | 0.077 | 16.2 | |||
| G12 (GPa) | 0.63 | 0.98 | 1 | 4.93 | 0.078 | 5.83 | ||
| υ12 | −0.06 | −0.10 | −0.20 | 1 | 0.29 | 0.107 | 0.28 | |
| ρ (kg/m3) | 0.43 | 0.72 | 0.71 | −0.07 | 1 | 1964 | 0.029 | |
| No. | Ply Thickness | Ply Orientation | Size | Boundary Condition |
|---|---|---|---|---|
| Laminate 1 | 0.45 mm | (0/90)4 | 0.6 × 0.2 m | Simply supported |
| Laminate 2 | 0.45 mm | [(±60)2]s | 0.6 × 0.2 m | Simply supported |
| Laminate 3 | 0.45 mm | [0/±45/90]s | 0.6 × 0.2 m | Clamped |
| Laminate 4 | 0.45 mm | [15/45/60/90/30/0/10/20] | 0.6 × 0.2 m | Clamped |
| No. | Micro-Scale | Correlated Meso-Scale | Independent Meso-Scale | |||
|---|---|---|---|---|---|---|
| Mean | Std | Mean | Std | Mean | Std | |
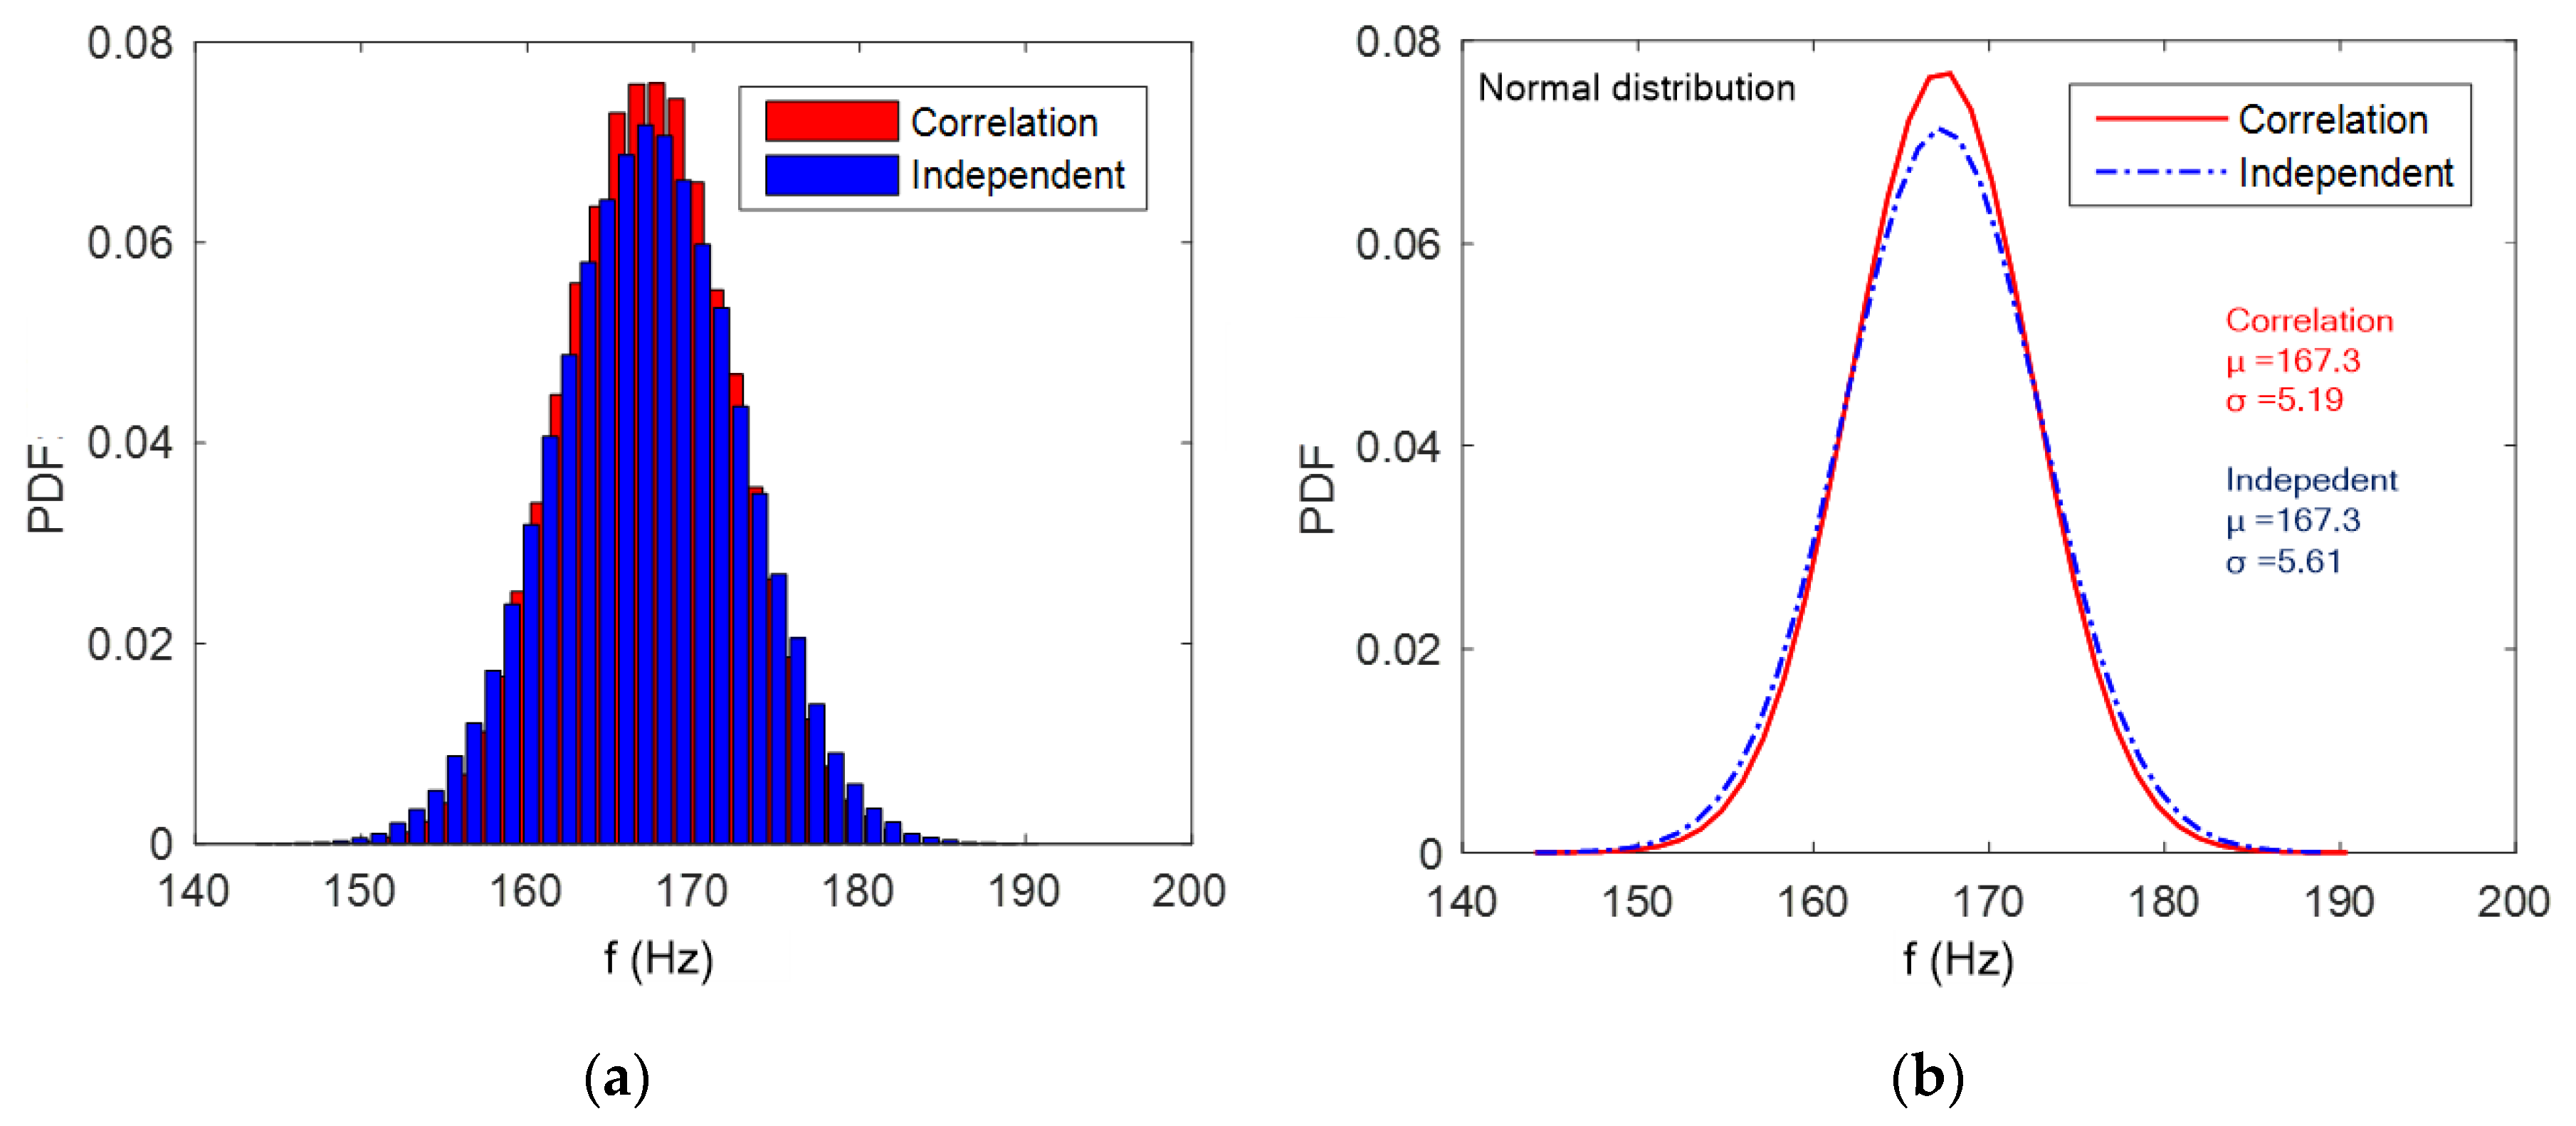
| Laminate 1 | 167.2 | 5.17 | 167.3 | 5.19 | 167.3 | 5.61 8.1% * |
| Laminate 2 | 181.0 | 5.89 | 181.0 | 6.00 | 181.0 | 6.53 8.8% * |
| Laminate 3 | 290.5 | 8.12 | 290.5 | 8.25 | 290.7 | 8.72 5.7% * |
| Laminate 4 | 275.6 | 7.65 | 275.7 | 7.88 | 275.8 | 8.88 12.7% * |
| Meso-Scale Correlation (E11, E22, G12, ν12, ρ) | Meso-Scale Correlation (E11, E22, G12, ν12) | Meso-Scale Independent | |
|---|---|---|---|
| (0/90)8 plate | 5.10 Hz | 6.70 Hz | 5.61 Hz |
| -- | (31.4%) * | (10.0%) * | |
| (90)8 cylindrical shell | 37.8 Hz | 56.0 Hz | 42.2 Hz |
| -- | (48.2%) * | (11.6%) * |
© 2019 by the authors. Licensee MDPI, Basel, Switzerland. This article is an open access article distributed under the terms and conditions of the Creative Commons Attribution (CC BY) license (http://creativecommons.org/licenses/by/4.0/).
Share and Cite
Zhang, S.; Chen, X. Stochastic Natural Frequency Analysis of Composite Structures Based on Micro-Scale and Meso-Scale Uncertainty. Appl. Sci. 2019, 9, 2603. https://doi.org/10.3390/app9132603
Zhang S, Chen X. Stochastic Natural Frequency Analysis of Composite Structures Based on Micro-Scale and Meso-Scale Uncertainty. Applied Sciences. 2019; 9(13):2603. https://doi.org/10.3390/app9132603
Chicago/Turabian StyleZhang, Shufeng, and Xun Chen. 2019. "Stochastic Natural Frequency Analysis of Composite Structures Based on Micro-Scale and Meso-Scale Uncertainty" Applied Sciences 9, no. 13: 2603. https://doi.org/10.3390/app9132603
APA StyleZhang, S., & Chen, X. (2019). Stochastic Natural Frequency Analysis of Composite Structures Based on Micro-Scale and Meso-Scale Uncertainty. Applied Sciences, 9(13), 2603. https://doi.org/10.3390/app9132603