Solving Nuisance Cyanobacteria Eutrophication Through Biotechnology

 ,
,  ,
, 

Abstract

1. Introduction
2. Materials and Methods
2.1. Sample Collection
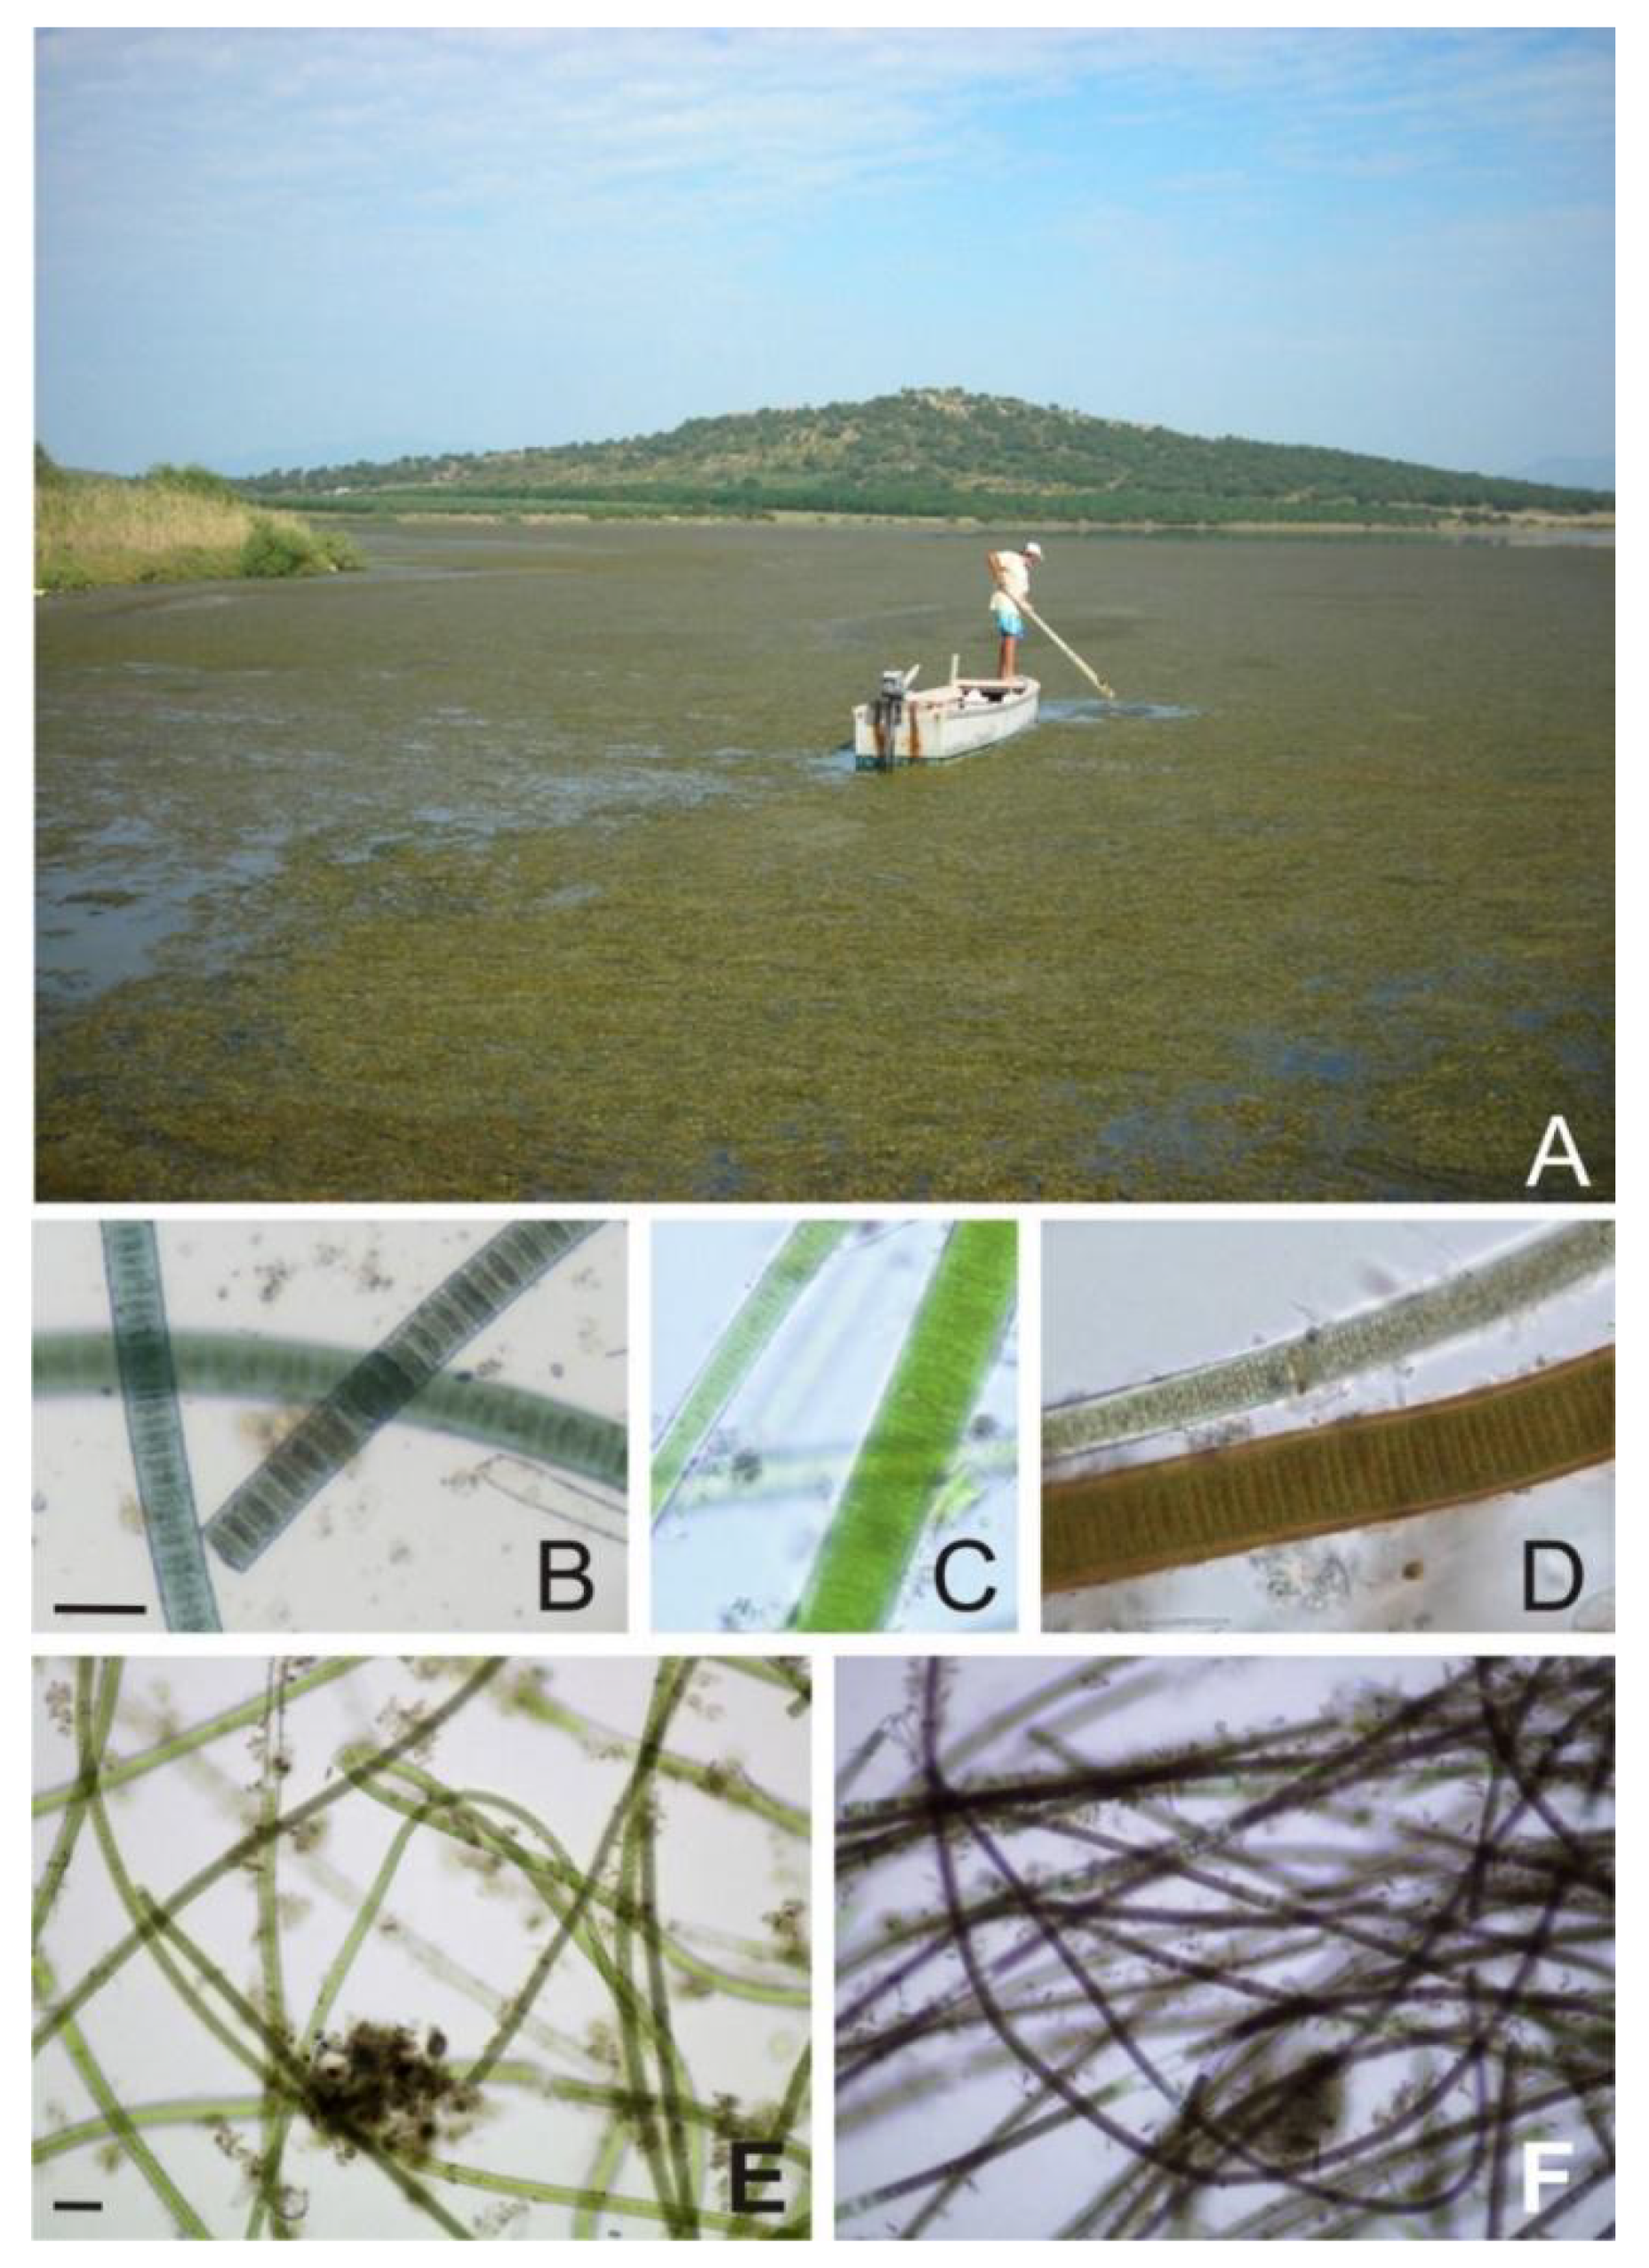
2.2. Species Composition
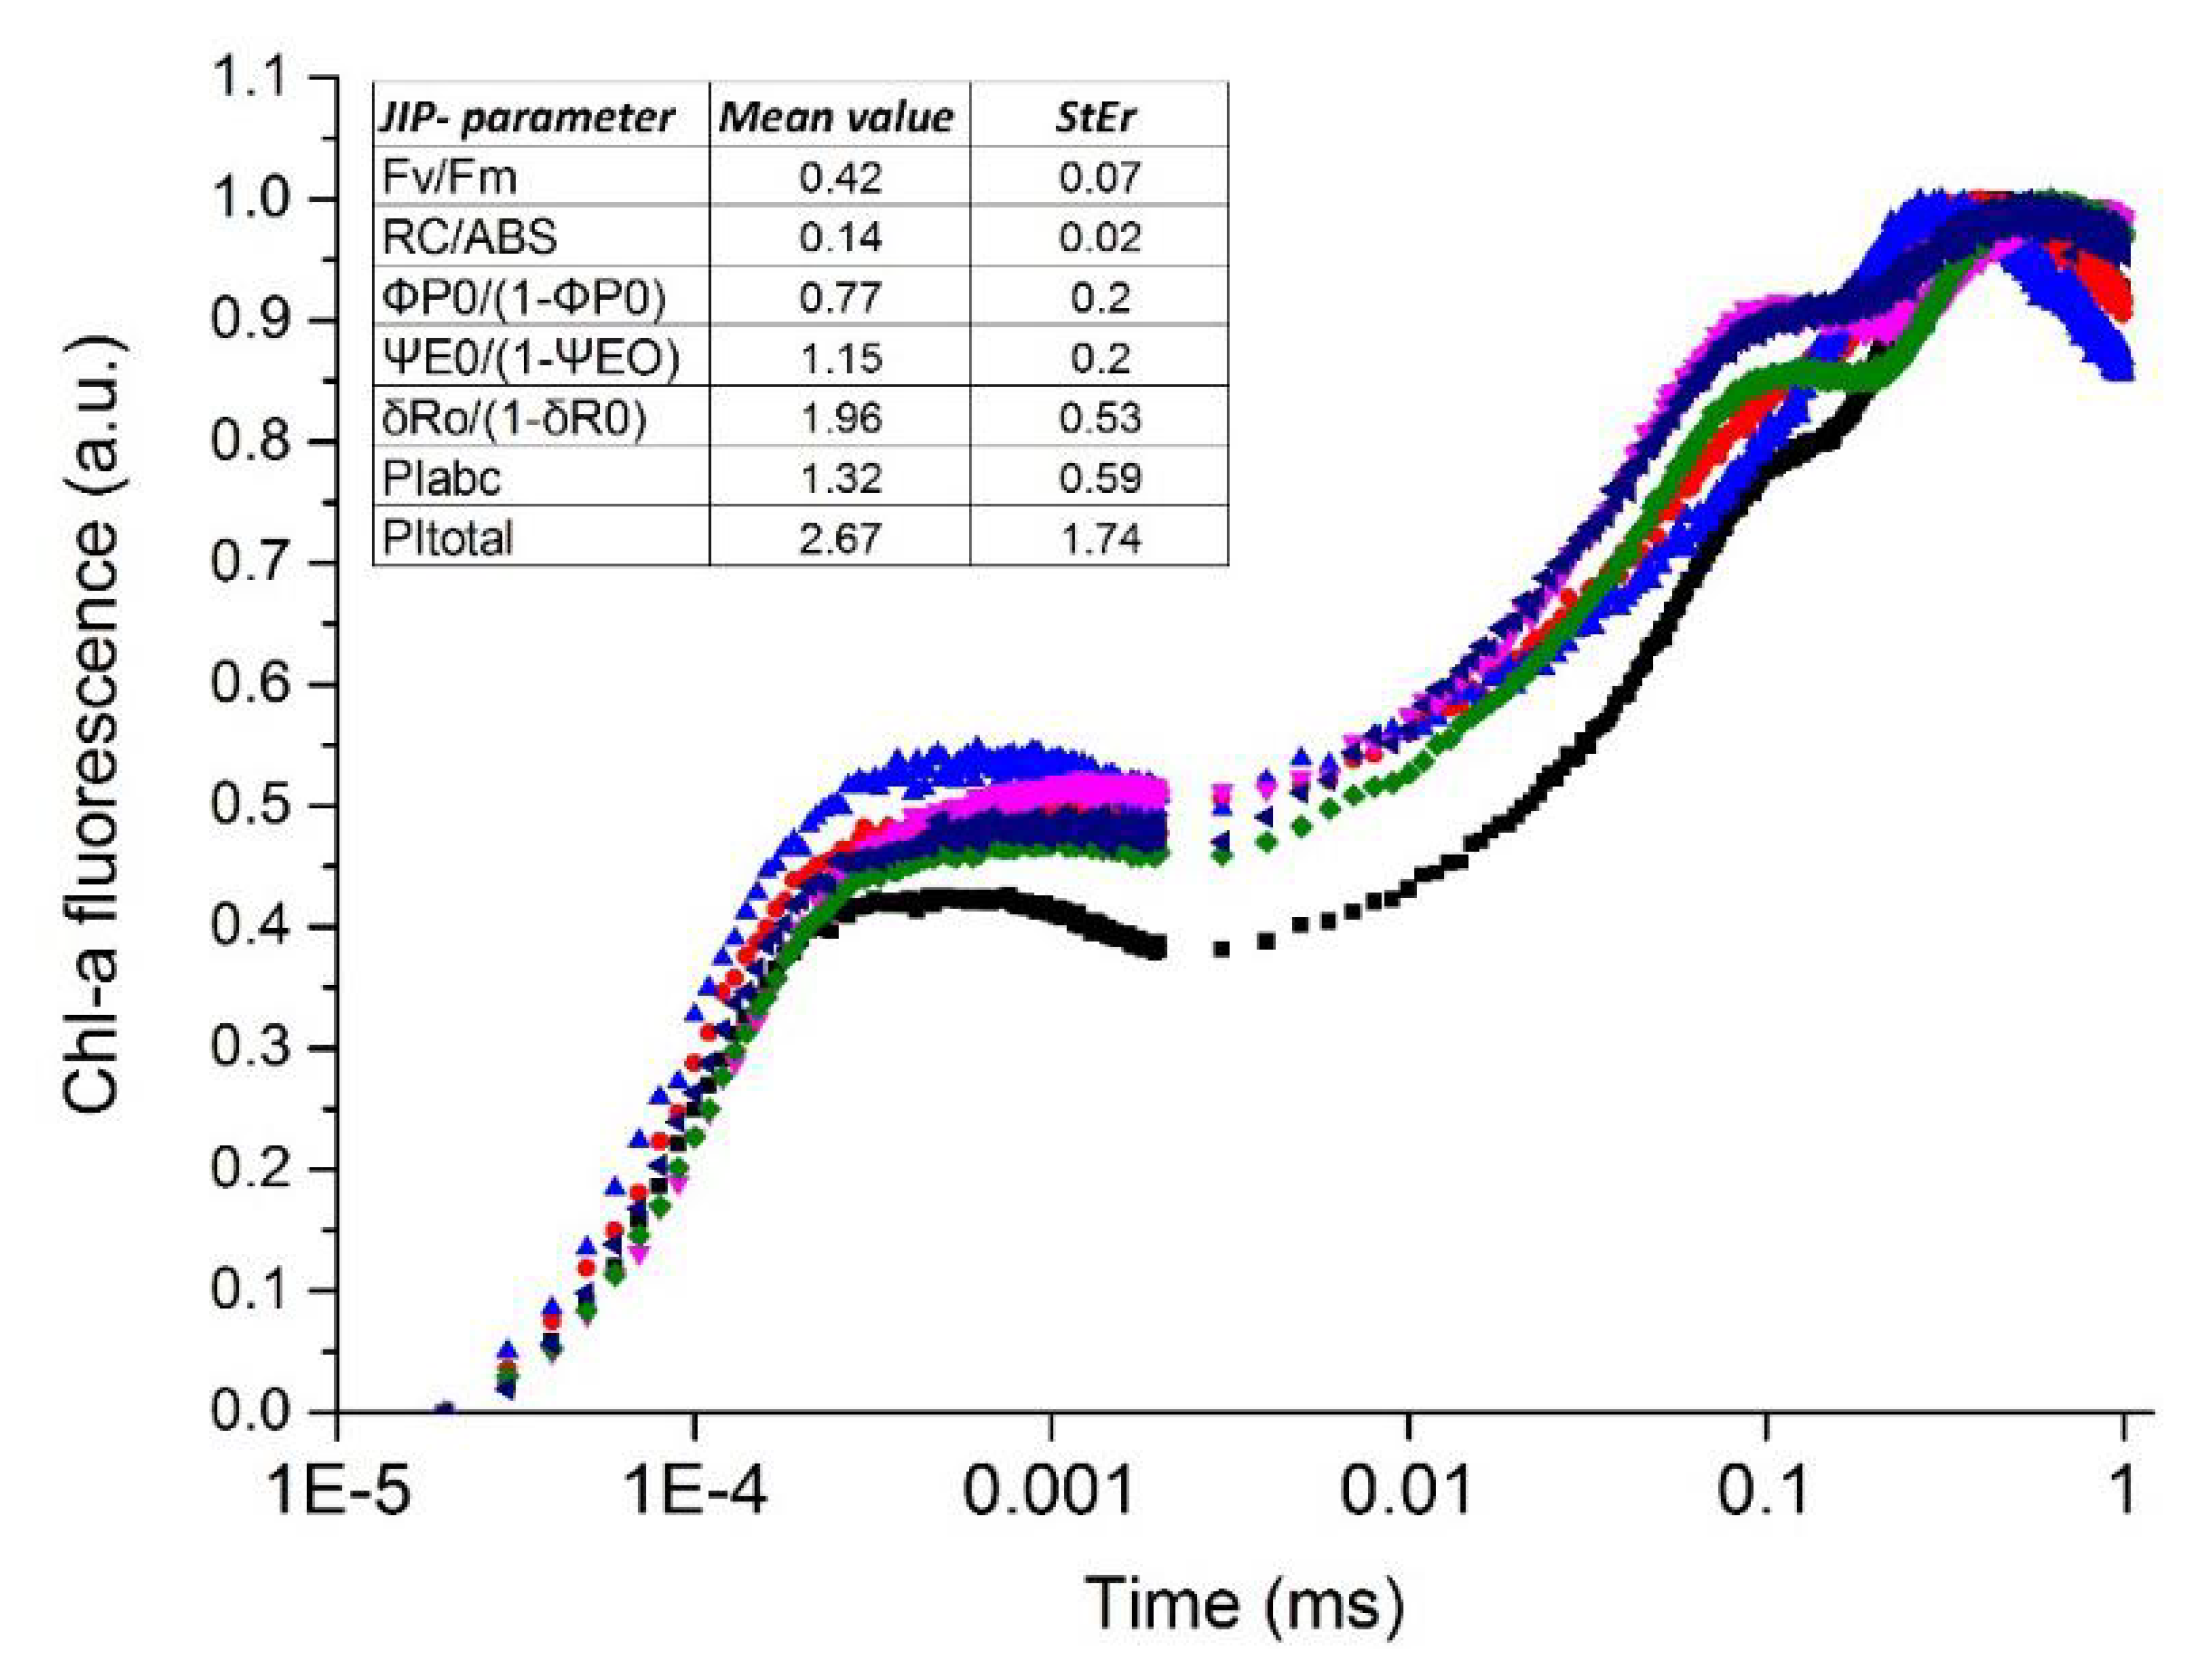
2.3. Fluorescence Induction Measurements of Chlorophyll a
2.4. Pigments, Dry Weight, and Organic Matter Estimations
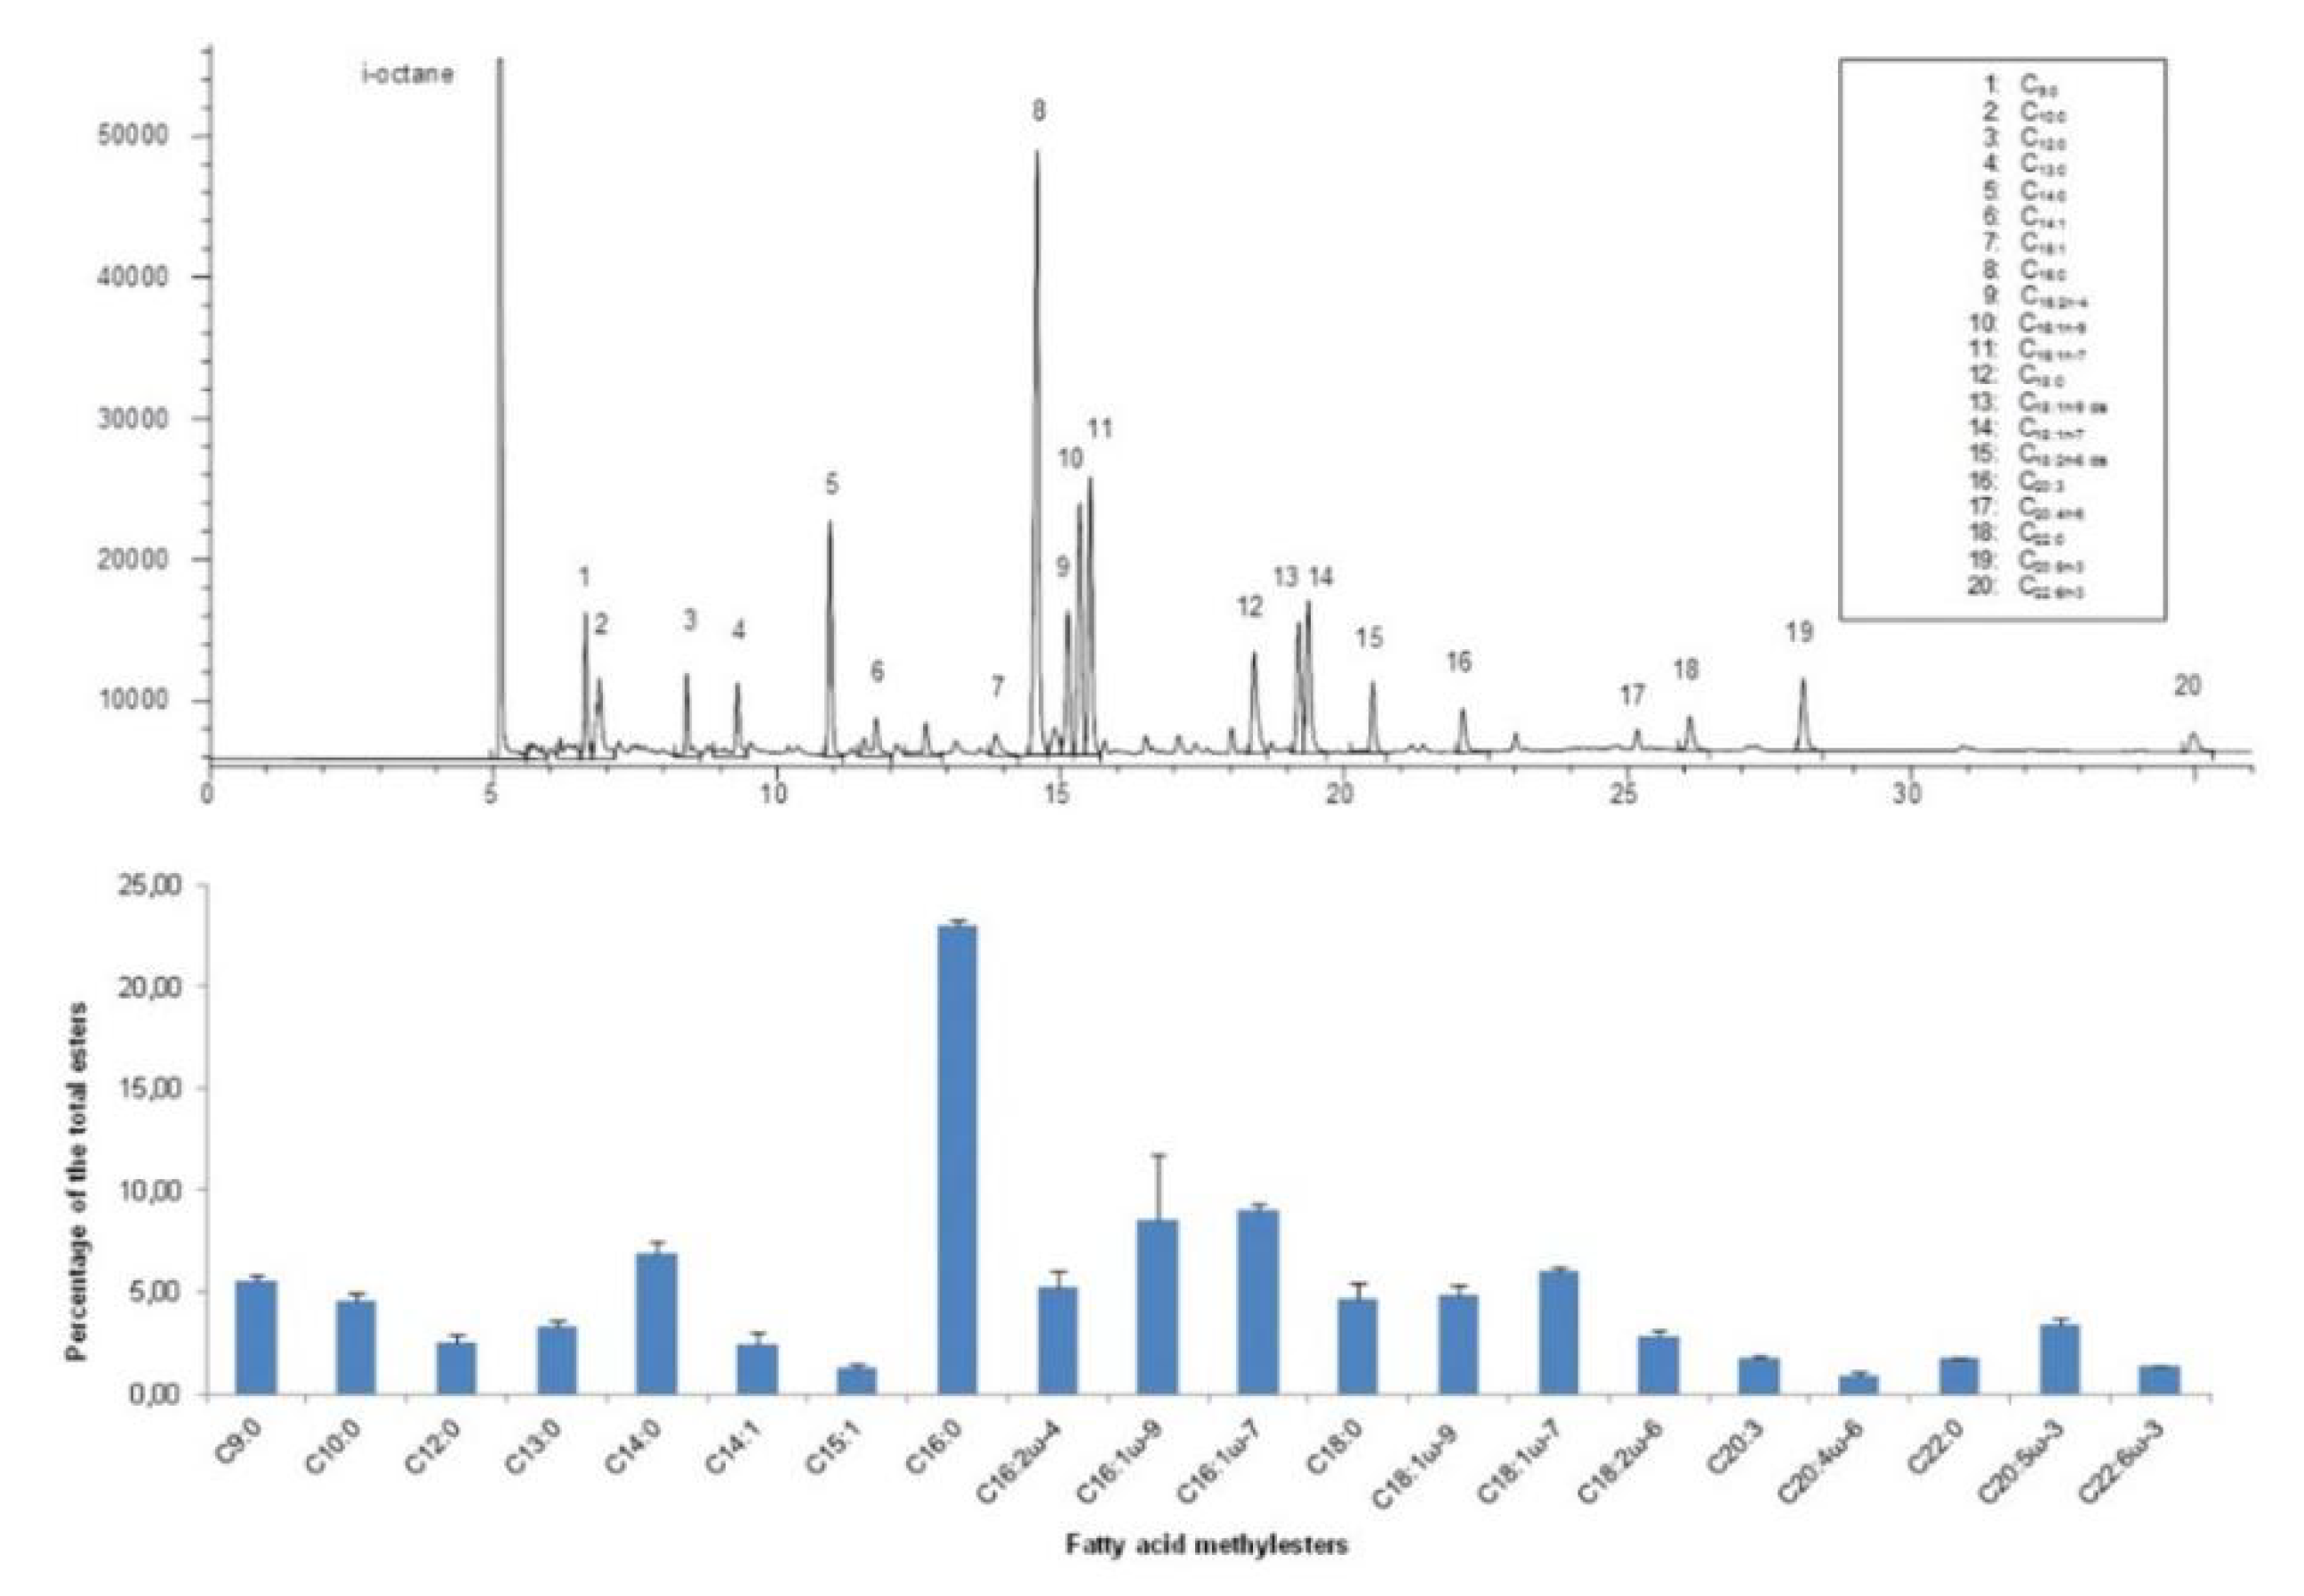
2.5. Fatty Acid Analysis and Methyl Esters Preparation
2.6. Gas Chromatographic (GC-FID) Analysis of Fatty Acid Methyl Esters
2.7. Carbohydrates Estimation
2.8. Experimental Procedure for Hydrogen (H2) Production
2.9. Gas Chromatographic (GC-TCD) Measurements of H2, O2, and Methane
3. Statistical Analysis
4. Results
4.1. Species Composition
4.2. Chlorophyll Fluorescence-Pigment Analysis-Water Content
4.3. Lipids
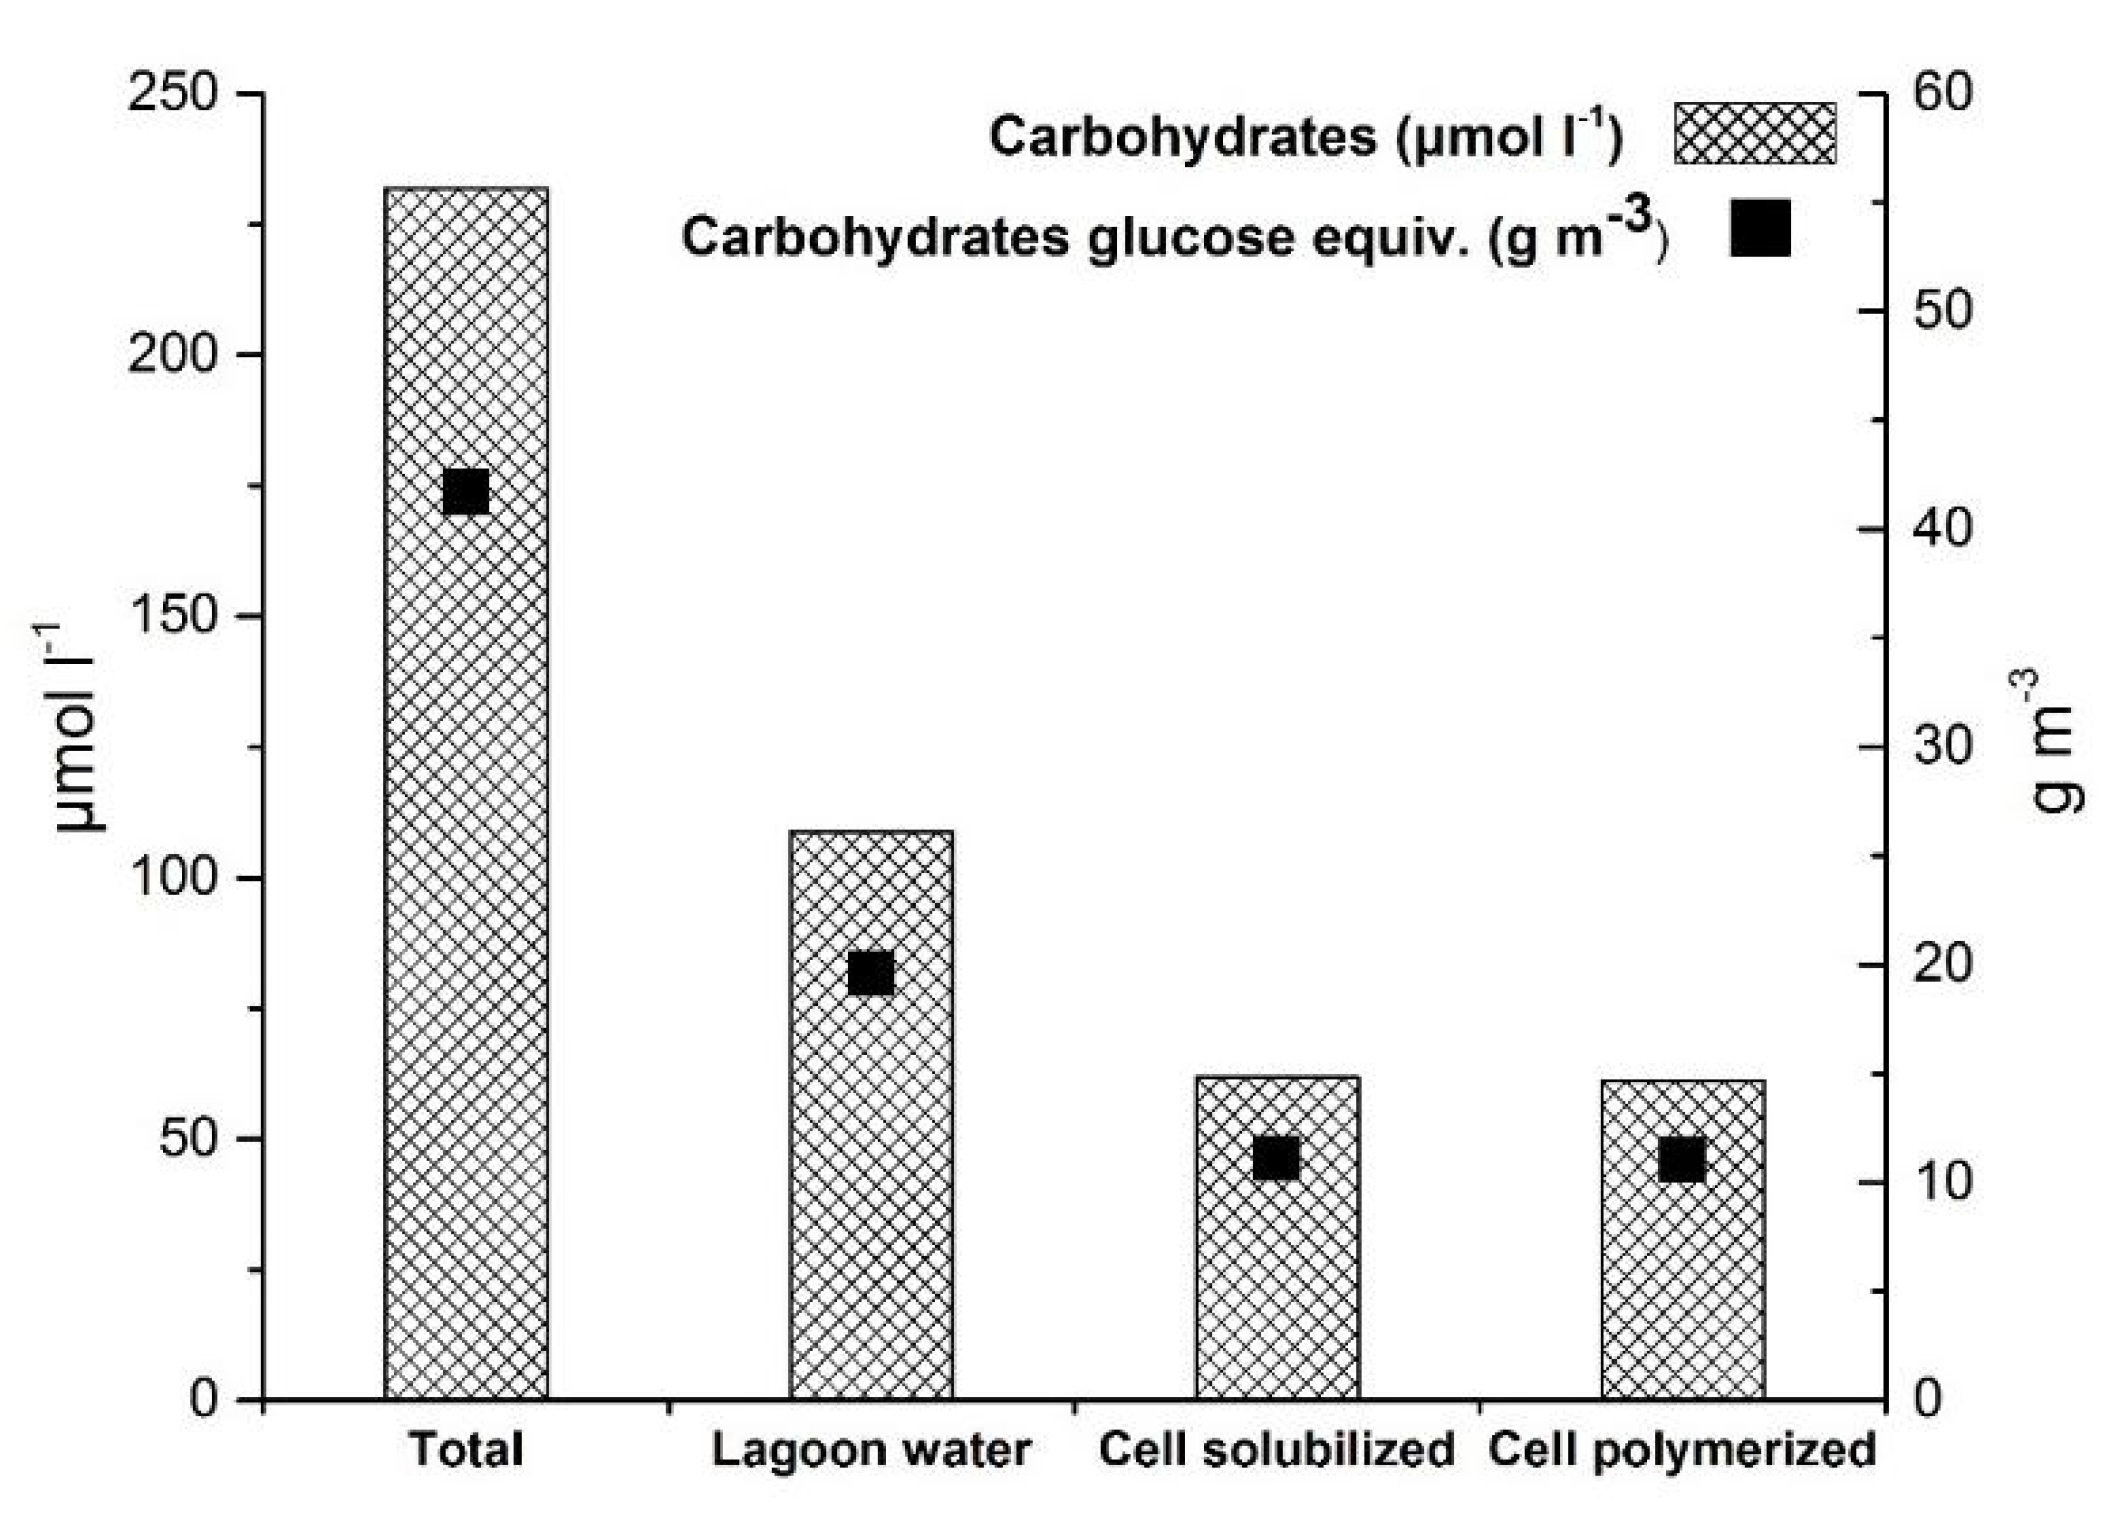
4.4. Carbohydrates
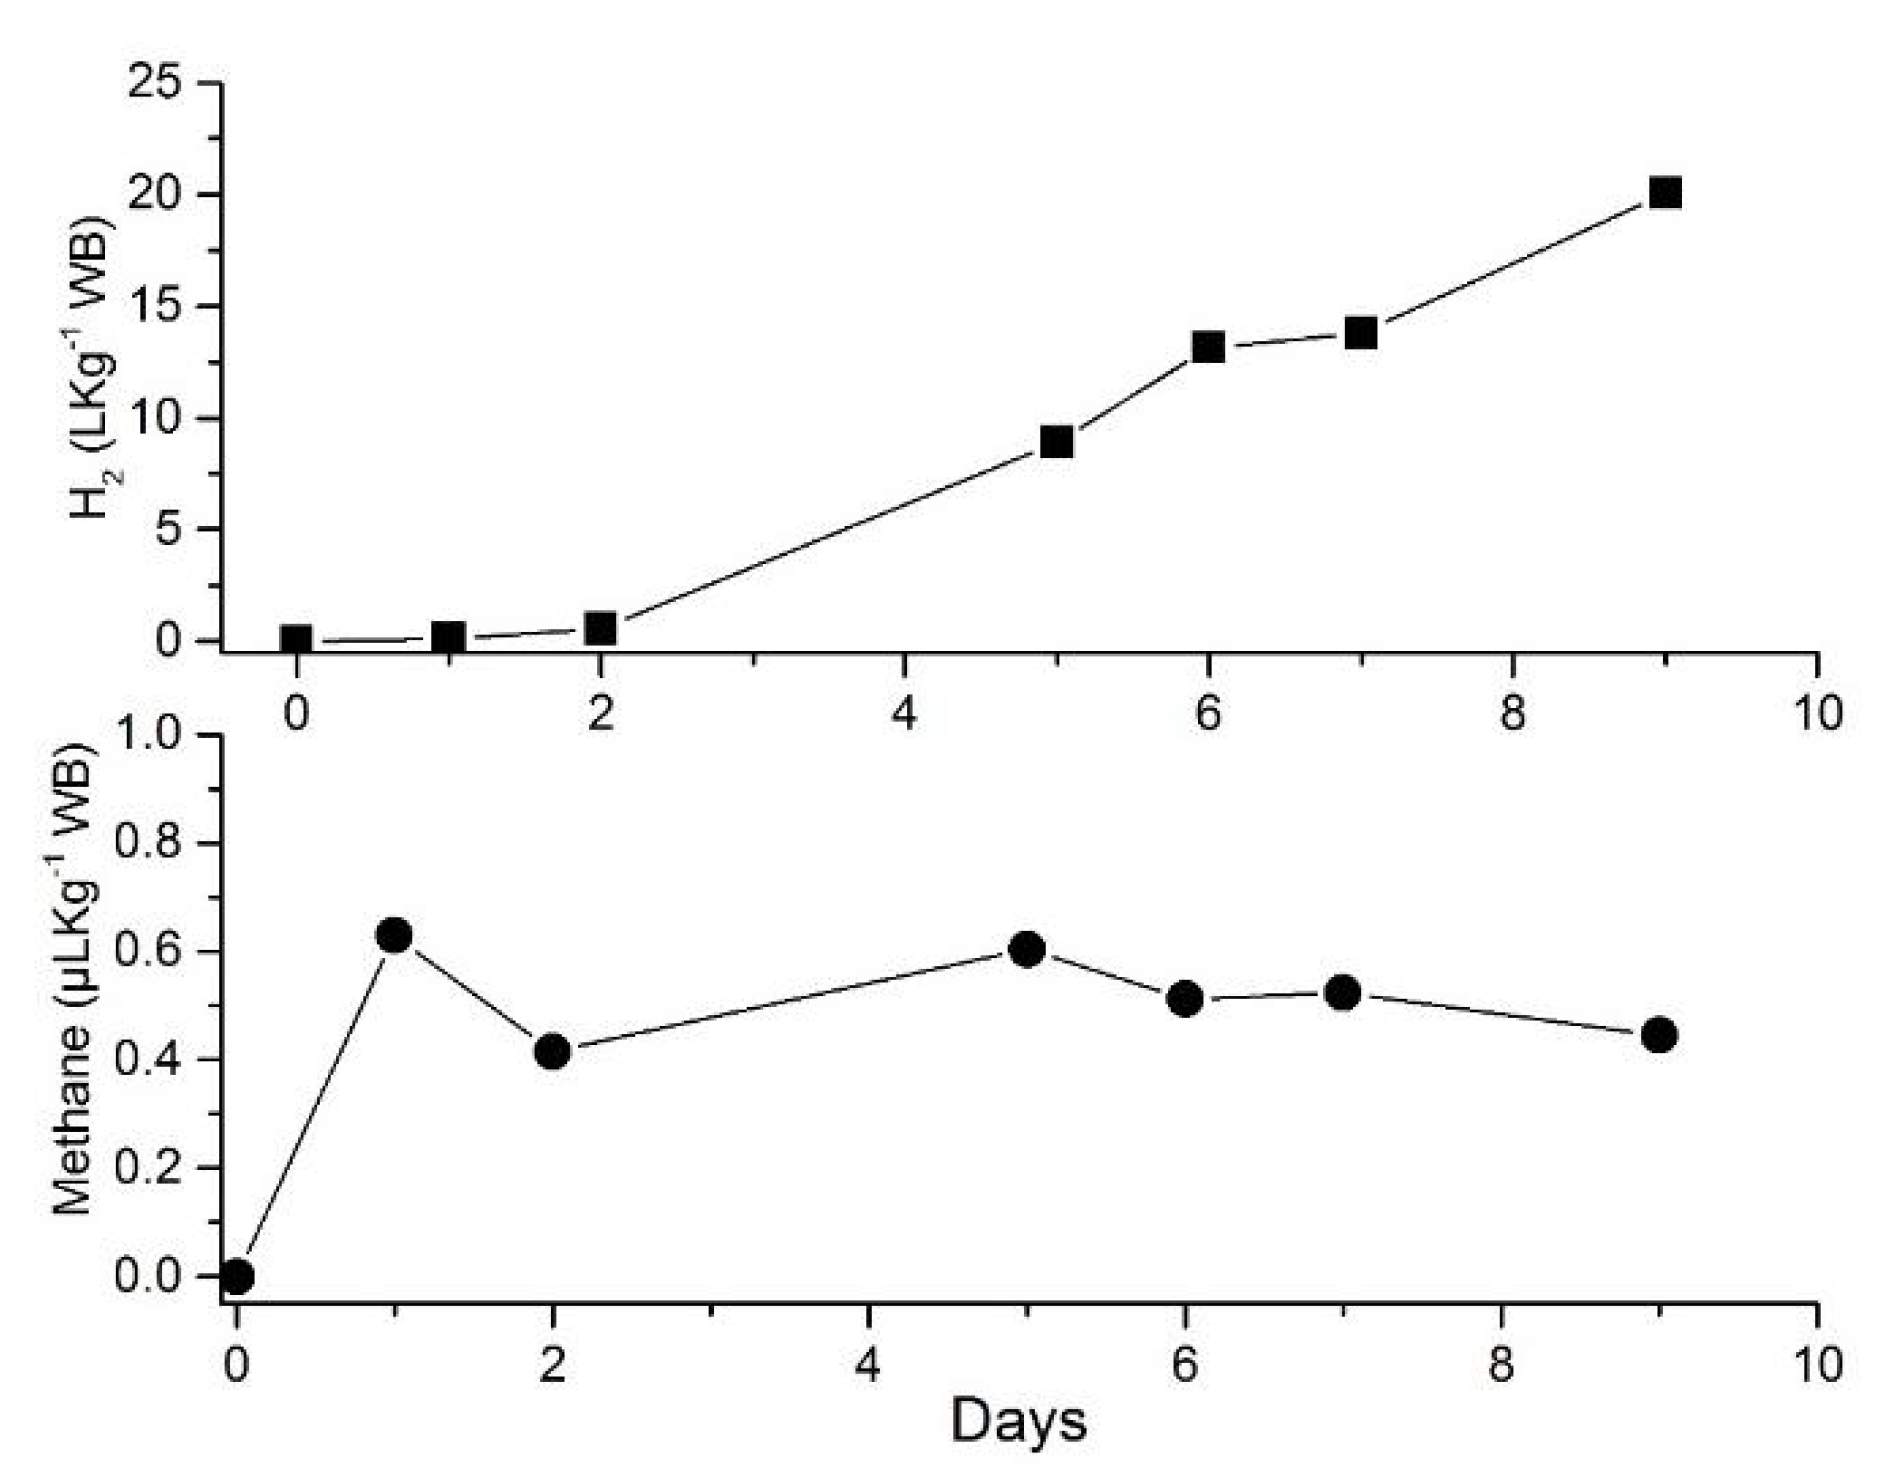
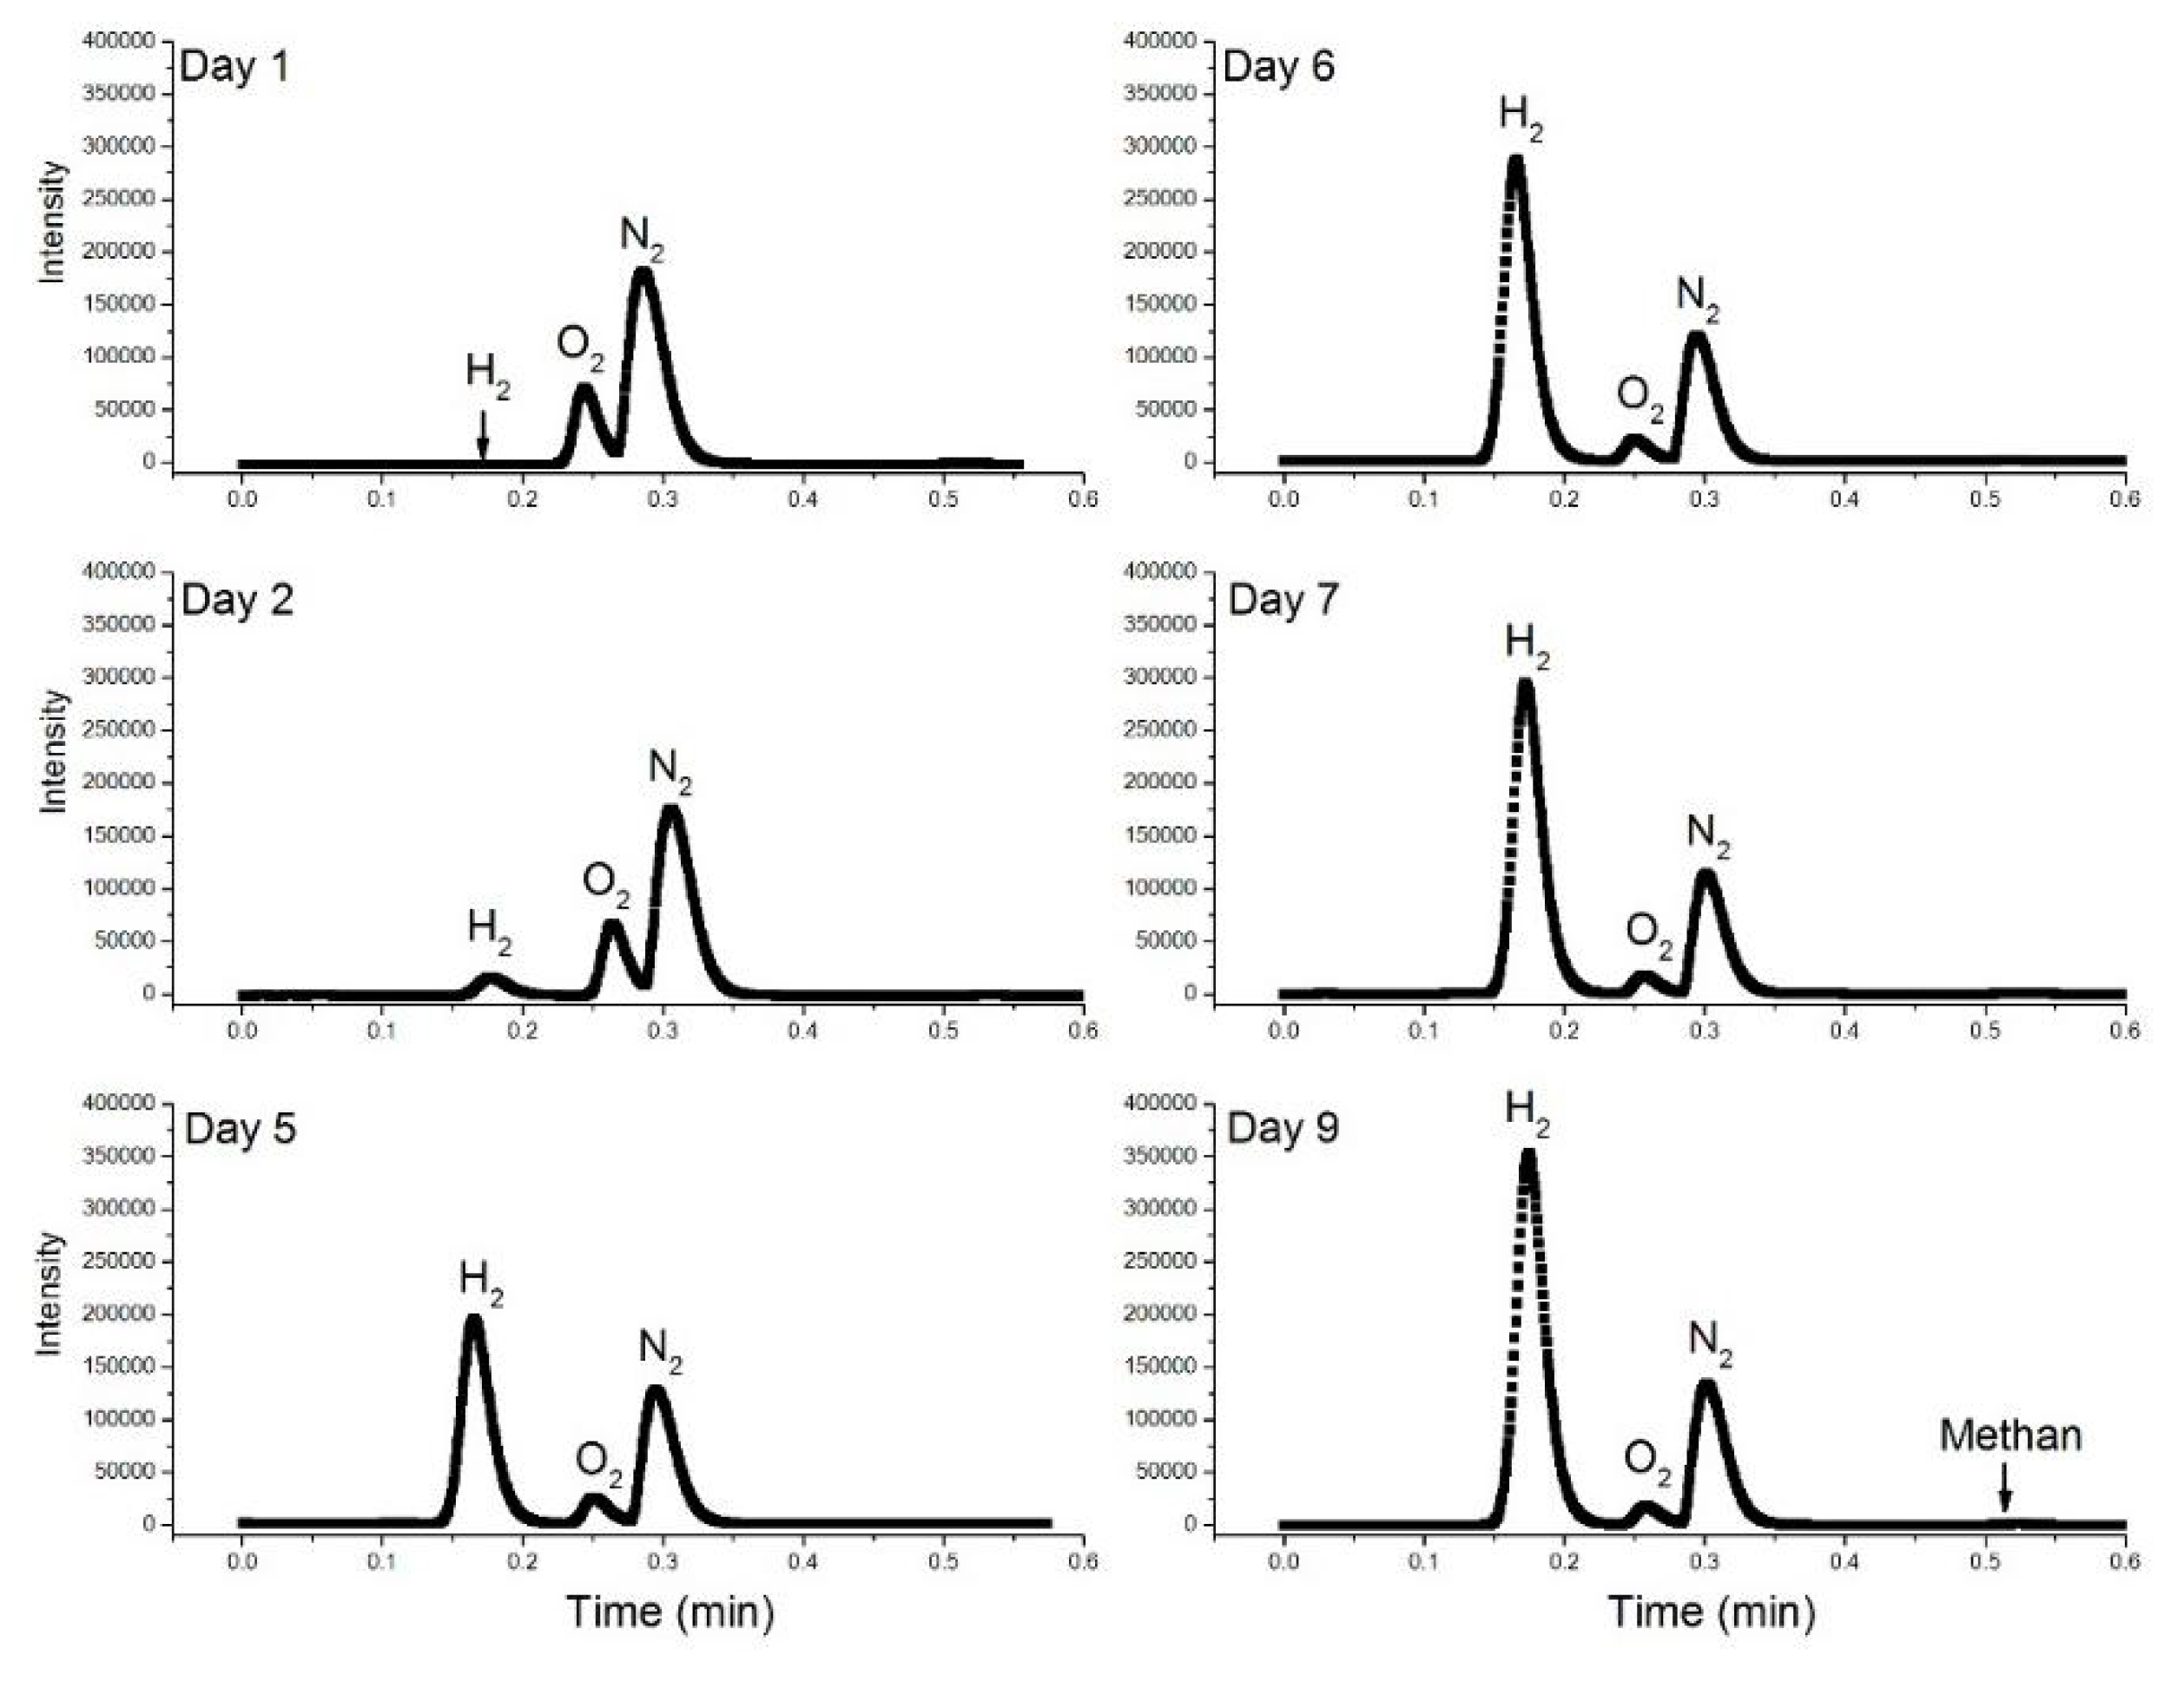
4.5. H2 Production
5. Discussion
Author Contributions
Funding
Acknowledgments
Conflicts of Interest
References
- Food and Agriculture Organization of the United Nations (FAO). Resource STAT-Fertilizer. 2009. Available online: http://faostat.fao.org/site/575/Desktop Default.aspx? PageID=575#ancor (accessed on 3 December 2009).
- Paerl, H.W. Coastal eutrophication and harmful algal blooms: Importance of atmospheric deposition and groundwater as ‘new’ nitrogen and other nutrient sources. Limnol. Oceanogr. 1997, 42, 1154–1165. [Google Scholar] [CrossRef]
- Vitousek, P.M.; Aber, J.; Howarth, R.W.; Likens, G.E.; Matson, P.A.; Schindler, D.W.; Schlesinger, W.H.; Tilman, G.D. Human alteration of the global nitrogen cycle: Causes and consequences. Ecol. Appl. 1997, 7, 737–750. [Google Scholar] [CrossRef]
- Schindler, D.W. Carbon, nitrogen, and phosphorus and the eutrophication of freshwater lakes. J. Phycol. 1971, 7, 321–329. [Google Scholar] [CrossRef]
- Cloern, J.E. Our evolving conceptual model of the coastal eutrophication problem. Mar. Ecol. Prog. Ser. 2001, 210, 223–253. [Google Scholar] [CrossRef]
- Paerl, H.W.; Huisman, J. Blooms like it hot. Science 2008, 320, 57–58. [Google Scholar] [CrossRef] [PubMed]
- Paerl, H.W.; Paul, V.J. Climate change: Links to global expansion of harmful cyanobacteria. Water Res. 2012, 46, 1349–1363. [Google Scholar] [CrossRef] [PubMed]
- De Jonge, V.N.; Elliott, M.; Orive, E. Causes, historical development, effects and future challenges of a common environmental problem: Eutrophication. Hydrobiologia 2012, 475, 1–19. [Google Scholar] [CrossRef]
- Viaroli, P.; Bartoli, M.; Giordani, G.; Naldi, M.; Orfanidis, S.; Zaldivar, J.M. Community shifts, alternative stable states, biogeochemical controls and feedbacks and in eutrophic coastal lagoons: A brief review. Aquat. Conserv.: Mar. Freshw. Ecosyst. 2008, 18, S105–S117. [Google Scholar] [CrossRef]
- Schramm, W.; Nienhuis, P.H. Marine Benthic Vegetation: Recent Changes and the Effects of Eutrophication; Ecological Studies 123; Springer: Berlin/Heidelberg, Germany, 1996; ISBN 978-3-642-61398-2. [Google Scholar]
- Nicolaidou, A.; Reizopoulou, S.; Koutsoubas, D.; Orfanidis, S.; Kevrekidis, T. Biological components of Greek lagoonal ecosystems: An overview. Mediterr. Mar. Sci. 2005, 6, 31–50. [Google Scholar] [CrossRef]
- Moustaka-Gouni, M.; Hiskia, A.; Genitsaris, S.; Katsiapi, M.; Manolidi, K.; Zervou, S.-K.; Christophoridis, C.; Triantis, T.M.; Kaloudis, T.; Orfanidis, S. First report of Aphanizomenon favaloroi occurrence in Europe associated with saxitoxins and a massive fish kill in Lake Vistonis, Greece. Mar. Freshw. Res. 2016, 68, 793–800. [Google Scholar] [CrossRef]
- Chen, Y.; Zou, R.; Su, H.; Bai, S.; Faizullabhoy, M.; Wu, Y.; Guo, H. Development of an Integrated Water Quality and Macroalgae Simulation Model for Tidal Marsh Eutrophication Control Decision Support. Water 2017, 9, 277. [Google Scholar] [CrossRef]
- Karyotis, T.; Orfanidis, S.; Reizopoulou, S. Marine benthic macrophytes as possible nitrogen source in agriculture. J. Plant Nutr. Soil Sci. 2006, 169, 557–563. [Google Scholar] [CrossRef]
- McGlathery, K.J.; Sundbäck, K.; Anderson, I.C. Eutrophication in shallow coastal bays and lagoons: The role of plants in the coastal filter. Mar. Ecol. Prog. Ser. 2007, 348, 1–18. [Google Scholar] [CrossRef]
- Ansari, A.A.; Sarvajeet, S.G.; Lanza, G.R.; Rast, W. Eutrophication: Causes, Consequences and Control; Springer: Dordrecht, The Netherlands; Heidelberg, Germany; London, UK; New York, NY, USA, 2011; ISBN 978-90-481-9625-8. [Google Scholar]
- Zhong, W.; Zhang, Z.; Luo, Y.; Qiao, W.; Xiao, M.; Zhang, M. Biogas productivity by co-digesting Taihu blue algae with corn straw as an external carbon source. Bioresour. Technol. 2012, 114, 281–286. [Google Scholar] [CrossRef] [PubMed]
- John, R.P.; Anisha, G.S.; Madhavan Nampoothiri, K.; Pandey, A. Micro and macroalgal biomass: A renewable source for bioethanol. Bioresour. Technol. 2011, 102, 186–193. [Google Scholar] [CrossRef] [PubMed]
- Marquez, G.P.B.; Santiañez, W.J.E.; Trono, G.C., Jr.; Montaño, M.N.E.; Araki, H.; Takeuchi, H.; Hasegawa, T. Seaweed biomass of the Philippines: Sustainable feed stock for biogas production. Renew. Sustain. Energy Rev. 2014, 38, 1056–1068. [Google Scholar] [CrossRef]
- Soleymani, M.; Rosentrater, K.A. Techno-Economic Analysis of Biofuel Production from Macroalgae (Seaweed). Bioengineering 2017, 4, 92. [Google Scholar] [CrossRef]
- Papazi, A.; Andronis, E.; Ioannidis, N.E.; Chaniotakis, N.; Kotzabasis, K. High yields of hydrogen production induced by meta-substituted dichlorophenols biodegradation from the green alga Scenedesmus obliquus. PLoS ONE 2012, 7, e49037. [Google Scholar] [CrossRef]
- Papazi, A.; Gjindali, A.-I.; Kastanaki, E.; Assimakopoulos, K.; Stamatakis, K.; Kotzabasis, K. Potassium deficiency, a “smart” cellular switch for sustained high yield hydrogen production by the green alga Scenedesmus obliquus. Int. J. Hyd. Energy 2014, 39, 19452–19464. [Google Scholar] [CrossRef]
- Argun, H.; Gokfiliz, P.; Karapinar, I. Biohydrogen Production Potential of Different Biomass Sources. In Biohydrogen Production: Sustainability of Current Technology and Future Perspective; Singh, A., Rathore, D., Eds.; Springer: New Delhi, India, 2017; pp. 11–48. [Google Scholar]
- Nayak, B.K.; Roy, S.; Das, D. Biohydrogen production from algal biomass (Anabaena sp. PCC 7120) cultivated in airlift photobioreactor. Int. J. Hyd. Energy 2014, 39, 7553–7560. [Google Scholar] [CrossRef]
- Guiry, M.D.; Blunden, G. Seaweed Resources in Europe: Uses and Potential; John Willery & Sons: Hoboken, NJ, USA, 1991; ISBN 978-0471929475. [Google Scholar]
- Möllers, K.B.; Cannella, D.; Jorgensen, H.; Frigaard, N.U. Cyanobacterial biomass as carbohydrate and nutrient feedstock for bioethanol production by yeast fermentation. Biotechnol. Biofuels 2014, 7, 64. [Google Scholar] [CrossRef] [PubMed]
- Amaro, H.M.; Guedes, A.; Malcata, F. Advances and perspectives in using microalgae to produce biodiesel. Appl. Energy 2011, 88, 3402–3410. [Google Scholar] [CrossRef]
- Borowitzka, M.A.; Moheimani, N.R. Algae for Biofuels and Energy; Springer: Dordrecht, The Netherlands, 2013. [Google Scholar]
- Antal, T.K.; Krendeleva, T.E.; Rubin, A.B. Acclimation of green algae to sulfur deficiency: Underlying mechanisms and application for hydrogen production. Appl. Microbiol. Biotechnol. 2011, 89, 3–15. [Google Scholar] [CrossRef] [PubMed]
- Ghirardi, M.L.; Togasaki, R.K.; Seibert, M. Oxygen sensitivity of algal H2-production. Appl. Biochem. Biotechnol. 1997, 63, 141–151. [Google Scholar] [CrossRef] [PubMed]
- Ghirardi, M.L.; Posewitz, M.C.; Maness, P.C.; Dubini, A.; Yu, J.P.; Seibert, M. Hydrogenases and hydrogen photoproduction in oxygenic photosynthetic organisms. Ann. Rev. Plant Biol. 2007, 58, 71–91. [Google Scholar] [CrossRef] [PubMed]
- Papazi, A.; Kotzabasis, K. “Rational” Management of Dichlorophenols Biodegradation by the Microalga Scenedesmus obliquus. PLoS ONE 2013, 8, e61682. [Google Scholar] [CrossRef]
- Komárek, J.; Zapomělová, E.; Šmarda, J.; Kopecký, J.; Rejmánková, E.; Woodhouse, J.; Neilan, B.A.; Komárková, J. Polyphasic evaluation of Limnoraphis robusta, a water-bloom forming cyanobacterium from Lake Atitlán, Guatemala, with a description of Limnoraphis gen. nov. Fottea 2013, 13, 39–52. [Google Scholar] [CrossRef]
- Hindak, F.; Moustaka, M. Planktic cyanophytes of Lake Volvi, Greece. Algol. Stud. /Arch. Für Hydrobiol. 1998, 80, 497–528. [Google Scholar]
- Rippka, R. Recognition and identification of cyanobacteria. Methods Enzymol. 1998, 167, 28–67. [Google Scholar] [CrossRef]
- Komárek, J.; Anagnostidis, K. Cyanoprokaryota. 2. Teil: Oscillatoriales. In Süßwasserflora von Mitteleuropa, Bd; Büdel, B., Gärtner, G., Krienitz, L., Schagerl, M., Eds.; Elsevier GmbH: München, Germany, 2005; Volume 19, pp. 1–759. [Google Scholar]
- Komárek, J. Review of the cyanobacterial genera implying planktic species after recent taxonomic revisions according to polyphasic methods: State as of 2014. Hydrobiologia 2016, 764, 259–270. [Google Scholar] [CrossRef]
- Strasser, R.J.; Tsimilli-Michael, M.; Srivastava, A. The fluorescence transient as a tool to characterize and screen photosynthetic samples. In Probing Photosynthesis: Mechanisms, Regulation and Adaptation; Yunus, M., Pather, U., Mohanly, P., Eds.; Taylor and Francis: London, UK, 2000; pp. 445–483. [Google Scholar]
- Sterman, N.T. Spectrophotometric and fluorometric chlorophyll analysis. In Experimental Phycology: A Laboratory Manual; Lobban, C.S., Chapman, D.J., Kremer, B.P., Eds.; Cambridge Univ. Press: New York, NY, USA, 1998; pp. 35–46. [Google Scholar]
- Bligh, E.G.; Dyer, W.J. A rapid method of total lipid extraction and purification. Can. J. Biochem. Physiol. 1959, 37, 911–917. [Google Scholar] [CrossRef] [PubMed]
- Kates, M. Techniques of Lipidology: Isolation, Analysis and Identification of Lipids; North-Holland Pub. Co.: New York, NY, USA, 1972. Available online: https://trove.nla.gov.au/work/18775582 (accessed on 10 February 2018).
- Metcalfe, L.D.; Schmitz, A.A.; Pelka, J.R. Rapid preparation of fatty acid esters from lipids for gas chromatographic analysis. Anal. Chem. 1966, 38, 514–516. [Google Scholar] [CrossRef]
- Oh, Y.-K.; Raj, S.M.; Jung, G.Y.; Park, S. Current status of the metabolic engineering of microorganisms for biohydrogen production. Bioresour. Technol. 2011, 102, 8357–8367. [Google Scholar] [CrossRef] [PubMed]
- Orfanidis, S.; Papathanasiou, V.; Tsioli, S.; Nakou, K.; Kosmidou, M.; Ofridopoulou, A.; Papadimitriou, A.; Stamatis, N. Marine Habitat Types Monitoring Project of EPAMATH Region (2012–2015).-Phase D’ Progress Report for the Tender no. 9/2012; National Park of East Macedonia and Thrace: Porto Lagos, Greece, 2015; pp. 1–94. [Google Scholar]
- Koutrakis, E.T.; Conides, A.; Parpoura, A.C.; Van Ham, E.H.; Katselis, G.; Koutsikopoulos, C. Lagoon Fisheries’ Resources in Hellas. In State of Hellenic Fisheries; Papaconstantinou, C., Zenetos, A., Vassilopoulou, V., Tserpes, G., Eds.; Hellenic Centre for Marine Research: Athens, Greece, 2007; pp. 223–234. [Google Scholar]
- Hurd, C.L.; Harrison, P.J.; Bischof, K.; Lobban, C.S. Seaweed Ecology and Physiology; Cambridge University Press: Cambridge, UK, 2014. [Google Scholar] [CrossRef]
- Conrad, R.; Aragno, M.; Sciler, W. Production and consumption of hydrogen in a eutrophic lake. Appl. Environ. Microbiol. 1983, 45, 502–510. [Google Scholar] [PubMed]
- Gaffron, H. Reduction of CO2 with H2 in green plants. Nature 1939, 143, 204–205. [Google Scholar] [CrossRef]
- Gfeller, R.P.; Gibbs, M. Fermentative metabolism of Chlamydomonas reinhardtii: I. Analysis of fermentative products from starch in dark and light. Plant Physiol. 1984, 75, 212–218. [Google Scholar] [CrossRef] [PubMed]
- Catalanotti, C.; Yang, W.; Posewitz, M.C.; Grossman, A.R. Fermentation metabolism and its evolution in algae. Front. Plant Sci. 2013, 4, 150. [Google Scholar] [CrossRef] [PubMed]
- Papazi, A.; Kastanaki, E.; Pirintsos, S.; Kotzabasis, K. Lichen Symbiosis: Nature’s High Yielding Machines for Induced Hydrogen Production. PLoS ONE 2015, 10, e0121325. [Google Scholar] [CrossRef]
- Tamagnini, P.; Leitão, E.; Oliveira, P.; Ferreira, D.; Pinto, F.; Harris, D.J.; Heidorn, T.; Lindblad, P. Cyanobacterial hydrogenases: Diversity, regulation and applications. Fems Microbiol. Rev. 2007, 31, 692–720. [Google Scholar] [CrossRef]
- Schramm, W. Seaweeds for waste water treatment and recycling of nutrients. In Seaweed Resources in Europe: Uses and Potential; Guiry, M., Blunden, G., Eds.; John Wiley and Sons Ltd.: New York, NY, USA, 1991; pp. 149–168. [Google Scholar]
- Vargas, M.A.; Rodriguez, H.; Moreno, J.; Olivares, H.; Del Campo, J.A.; Rivas, J.; Guerrero, M.G. Biochemical composition and fatty acid content of filamentous nitrogen fixing cyanobacteria. J. Phycol. 1998, 34, 812–817. [Google Scholar] [CrossRef]
- Caudales, R.; Wells, J.M.; Butterfield, J.E. Cellular fatty acid composition of cyanobacteria assigned to subsection II, order Pleurocapsales. Int. J. Syst. Evol. Microbiol. 2000, 50, 1029–1034. [Google Scholar] [CrossRef] [PubMed]
- Sassaki, G.L.; Gorin, P.A.J.; Reis, R.A.; Serrato, R.V.; Elifio, S.L.; Iacomini, M. Carbohydrate, glycolipid and lipid components from the photobiont (Scytonema sp.) of the lichen, Dictyomema glabratum. Carbohydr. Res. 2005, 340, 1808–1817. [Google Scholar] [CrossRef] [PubMed]
- Guil-Guerrero, J.L.; Belarbi, H.; Rebolloso-Fuentes, M.M. Eicosapentaenoic and arachidonic acids purification from the red microalga Porphyridium cruentum. Bioseparation 2001, 9, 299–306. [Google Scholar] [CrossRef]
- Rebolloso-Fuentes, M.M.; Navarro-Pérez, A.; Garcia-Camacho, F.; Ramos-Miras, J.J.; Guil-Guerrero, J.L. Biomass nutrient profiles of the microalga Nannochloropsis. J. Agric. Food Chem. 2001, 49, 2966–2972. [Google Scholar] [CrossRef] [PubMed]
- Guedes, A.C.; Amaro, H.M.; Barbos, C.R.; Pereira, R.D.; Malcata, F.X. Fatty acid composition of several wild microalgae and cyanobacteria, with a focus on eicosapentaenoic, docosahexaenoic and α-linolenic acids for eventual dietary uses. Food Res. Int. 2011, 44, 2721–2729. [Google Scholar] [CrossRef]
- Abed, R.M.; Dobretsov, S.; Sudesh, K. Applications of cyanobacteria in biotechnology. J. Appl. Microbiol. 2009, 106, 1–12. [Google Scholar] [CrossRef]
- Chen, H.; Burke, J.M.; Mosindy, T.; Fedorak, P.M.; Preras, E.E. Cyanobacteria and microcystin-LR in a complex lake system representing a range in trophic status: Lake of the Woods, Ontario, Canada. J. Plankton Res. 2009, 31, 993–1008. [Google Scholar] [CrossRef]
- Grobbelaar, J.U. Quality control and assurance: Crucial for the sustainability of the applied phycology industry. J. Appl. Phycol. 2003, 15, 209–215. [Google Scholar] [CrossRef]
- Kim, J.K.; Kottuparambil, S.; Moh, S.H.; Lee, T.K.; Kim, Y.-J.; Rhee, J.-S.; Choi, E.-M.; Kim, B.H.; Yu, Y.J.; Yarish, C.; et al. Potential applications of nuisance microalgae blooms. J. Appl. Phycol. 2014, 27, 1223–1234. [Google Scholar] [CrossRef]


© 2019 by the authors. Licensee MDPI, Basel, Switzerland. This article is an open access article distributed under the terms and conditions of the Creative Commons Attribution (CC BY) license (http://creativecommons.org/licenses/by/4.0/).
Share and Cite
Orfanidis, S.; Stamatis, N.; Parasyri, A.; Mente, M.S.; Zerveas, S.; Pigada, P.; Papadimitriou, A.; Paschou, M.; Nisiforou, O.; Papazi, A.; et al. Solving Nuisance Cyanobacteria Eutrophication Through Biotechnology. Appl. Sci. 2019, 9, 2566. https://doi.org/10.3390/app9122566
Orfanidis S, Stamatis N, Parasyri A, Mente MS, Zerveas S, Pigada P, Papadimitriou A, Paschou M, Nisiforou O, Papazi A, et al. Solving Nuisance Cyanobacteria Eutrophication Through Biotechnology. Applied Sciences. 2019; 9(12):2566. https://doi.org/10.3390/app9122566
Chicago/Turabian StyleOrfanidis, S., N. Stamatis, A. Parasyri, M. S. Mente, S. Zerveas, P. Pigada, A. Papadimitriou, M. Paschou, O. Nisiforou, A. Papazi, and et al. 2019. "Solving Nuisance Cyanobacteria Eutrophication Through Biotechnology" Applied Sciences 9, no. 12: 2566. https://doi.org/10.3390/app9122566
APA StyleOrfanidis, S., Stamatis, N., Parasyri, A., Mente, M. S., Zerveas, S., Pigada, P., Papadimitriou, A., Paschou, M., Nisiforou, O., Papazi, A., Moustaka-Gouni, M., & Kotzabasis, K. (2019). Solving Nuisance Cyanobacteria Eutrophication Through Biotechnology. Applied Sciences, 9(12), 2566. https://doi.org/10.3390/app9122566