Article

Indium Tin Oxide Nanoparticle: TiO2: Air Layers for One-Dimensional Multilayer Photonic Structures

by
Ilka Kriegel
1 and
Francesco Scotognella
2,3,*
1
Department of Nanochemistry, Istituto Italiano di Tecnologia (IIT), 16163 Genova, Italy
2
Dipartimento di Fisica, Politecnico di Milano, 20133 Milano, Italy
3
Center for Nano Science and Technology@PoliMi, Istituto Italiano di Tecnologia, 20133 Milan, Italy
*
Author to whom correspondence should be addressed.
Appl. Sci. 2019, 9(12), 2564; https://doi.org/10.3390/app9122564
Submission received: 17 May 2019 / Revised: 19 June 2019 / Accepted: 20 June 2019 / Published: 24 June 2019
(This article belongs to the Section Optics and Lasers)

Abstract

:
In this work we study the optical properties of one-dimensional photonic crystals in which layers of silica nanoparticles are alternated with layers of indium tin oxide nanoparticle (ITO)/titania nanoparticle mixture, using the transfer matrix method. The dielectric function of the mixed ITO/TiO2 nanoparticle layer is carefully accounted for with a generalized Rayleigh equation for the ternary mixture ITO:TiO2:air. We studied the light transmission of the multilayer photonic crystal as a function of the ITO/TiO2 ratio. We observe that, by increasing the ITO content and its carrier density in the three-phase mixture, the intensity of the plasmon resonance in the near infrared (NIR) increases and the intensity of the photonic band gap (visible) decreases. Thus, our study is of major importance for the realization of electrochromic smart windows, in which separate and independent NIR and visible light control is required.

1. Introduction

Porous nanoparticle based multilayer photonic crystals are produced by very simple and versatile fabrication methods, as for example spin coating [1,2] and sputtering [3]. Their photonic band gap [4,5,6] can be modified by exploiting the properties of the constituent nanoparticles as well as the multilayer porosity, of interest for sensing, lasing, and switching [7,8]. The refractive index contrast between the two layers accounts for the photonic stop band and can be adjusted to deliver a targeted optical response. This becomes particularly interesting when implementing refractive index tunable materials, such as transparent conducting oxides (TCOs) [9,10,11]. A very interesting property of such materials is the near infrared (NIR) plasmonic response due to the free carrier density in the range of 1026–1027 m−3. This latter can be manipulated by the applying an electric [12] or an electrochemical potential [13]. In this way, carriers are injected in a capacitive manner adding to the predefined carrier density, resulting in enhanced NIR absorption [9]. In a porous multilayer photonic crystal, this modification of the dielectric response automatically affects the refractive index contrast and therefore provides a means to actively manipulate the photonic stop band [14,15]. Gaining the independent control over the photonic bandgap and the plasmonic absorption (in the NIR) would be of major interest for the application in electrochromic smart windows that can expel separately either heat or sunlight by applying a potential.
Recent works addressed this target by implementing NbOx glasses as matrix [16]. This involves an additional chemical step in the coloration, and thus, the devices become more prone to degradation. Implementing a physical effect such as the photonic bandgap in the coloration therefore is a highly attractive approach. In this work, we study the light transmission properties of a multilayer photonic crystal made by alternating silica nanoparticle layers and of electrochemically tunable indium tin oxide (ITO) nanoparticle/titania (TiO2) nanoparticle layers. The implementation of the three material mixture (ITO:TiO2:air) delivers an additional ingredient to fine tune the optical response of the entire structure due to the option to further modify the refractive index of this layer. We predict that the tuning of the ITO nanoparticle dielectric function in the three-phase mixture, and thus the overall refractive index of this layer, will modify both the plasmon resonance of ITO in the NIR and the photonic band gap of the overall structure. Remarkably, for the ITO:TiO2:air 60:10:30 ratio, the increase of the number of carriers of ITO induces a simultaneous increase of the plasmon resonance intensity and decrease of the photonic band gap intensity, thus taking a step towards the independent control over the optical signatures of our multilayer structure.

2. Methods

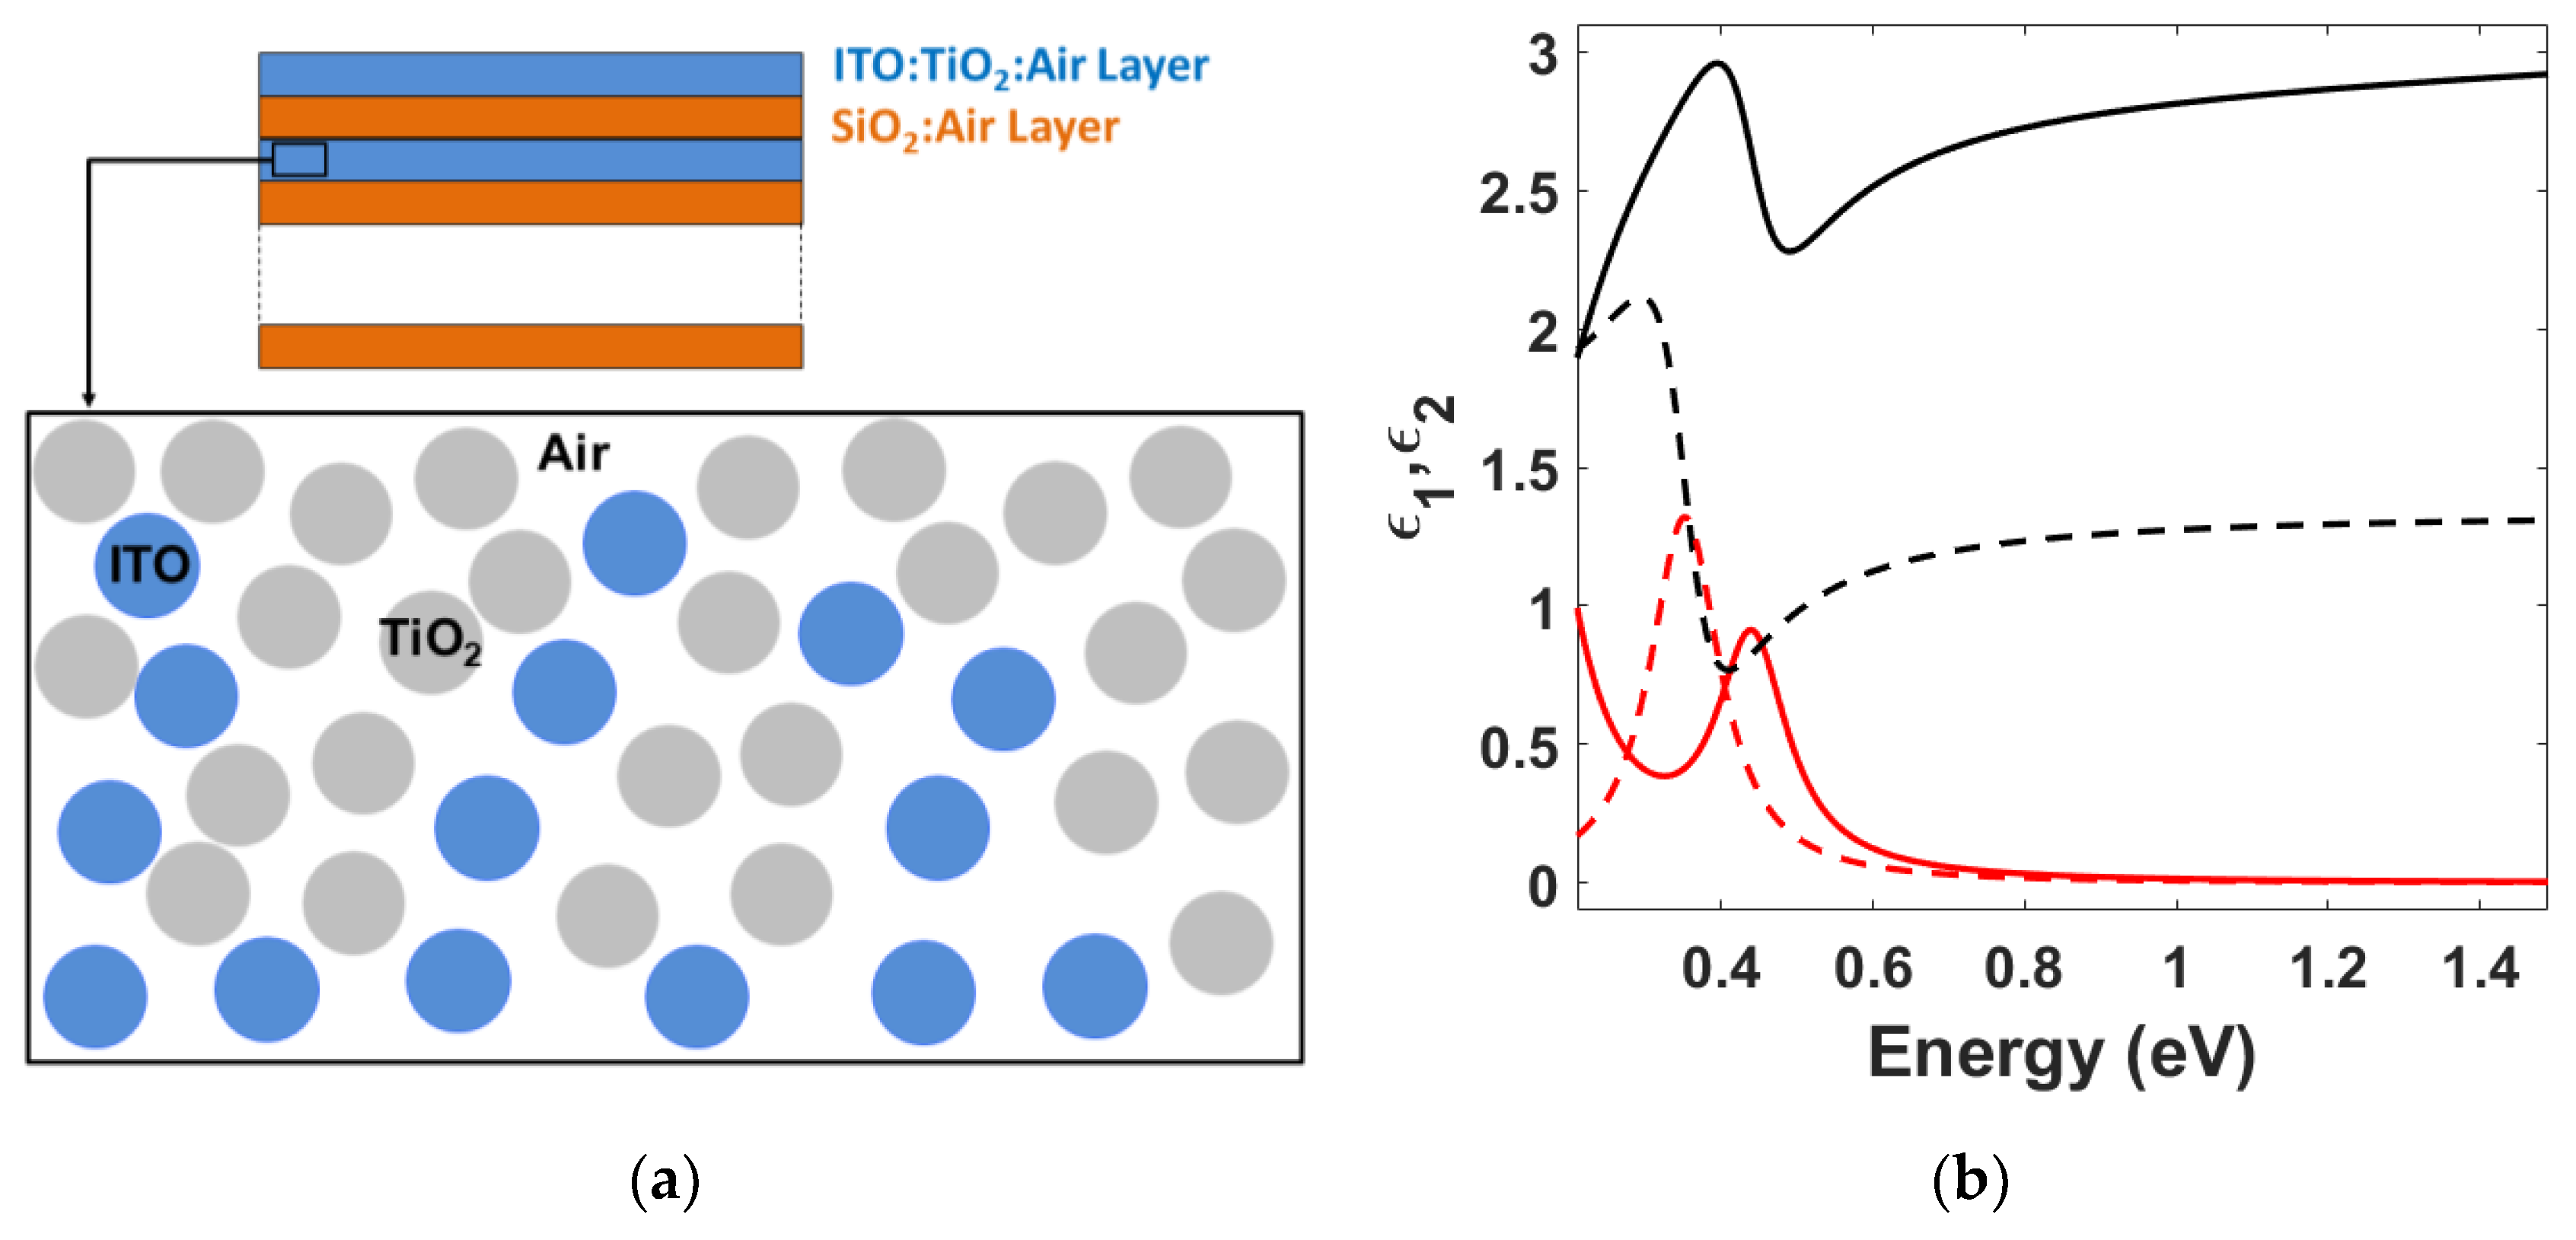
2.1. ITO:TiO2:Air Layer Refractive Index

According to the Drude model to describe the plasmonic response [17], the frequency dependent complex dielectric function of ITO can be written as:
ε I T O , ω = ε 1 , ω + i ε 2 , ω
where
ε 1 , ω = ε ω P 2 ( ω 2 Γ 2 )
and
ε 2 , ω = ω P 2 Γ ω ( ω 2 Γ 2 )
where ω P is the plasma frequency and Γ is the free carrier damping. The plasma frequency is ω P = N e 2 / m * ε 0 , with N number of charges, e the electron charge, m * the effective mass, and ε 0 the vacuum dielectric constant. For ITO, we use N = 2.49   ×   10 26   charges / m 3 (and we start from this value when we increase the number of carriers in this study), m * = 0.4   ×   m 0 , with m 0 = 9.1   ×   10 31   kg . For the free carrier damping, we use Γ = 0.1132   eV . The parameters for ITO nanoparticles are taken from [9,18]; the value of the high frequency dielectric constant, ε = 4 , is taken from [19].
The wavelength dependent refractive index of TiO2 can be written [20]:
n T i O 2 ( λ ) = ( 4.99 + 1 96.6 λ 1.1 + 1 4.60 λ 1.95 ) 1 / 2
where λ is the wavelength [in micrometers, and ε T i O 2 ( λ ) = n T i O 2 2 ( λ ) ].
To determine the dielectric function of the layer made of ITO nanoparticles, TiO2 nanoparticles, and air—ITO:TiO2:air (we call it ε e f f 1 , ω )—we use a generalized Rayleigh mixing formula for a three-phase mixture [21]:
ε e f f 1 , ω ε A i r ε e f f 1 , ω + 2 ε A i r = ( f I T O + f T i O 2 ) f I T O ( ε I T O , ω ε A i r ) + f T i O 2 t 12 , ω ( ε T i O 2 , ω ε A i r ) f I T O ( ε I T O , ω + 2 ε A i r ) + f T i O 2 t 12 , ω ( ε T i O 2 , ω + 2 ε A i r )
with
t 12 , ω = 3 ε I T O , ω ε T i O 2 , ω + 2 ε I T O , ω
where f I T O is the volume fraction (filling factor) occupied by ITO nanoparticles and f T i O 2 is the volume fraction occupied by TiO2 nanoparticles. The frequency dependent complex refractive index of the ITO:TiO2:air layer is determined considering that n e f f 1 , ω = ε e f f 1 , ω .

2.2. SiO2:Air Layer Refractive Index

The wavelength dependent refractive index of SiO2 can be described by the following Sellmeier Equation [22]:
n S i O 2 2 ( λ ) 1 = 1.9558 λ 2 λ 2 0.15494 2 + 1.345 λ 2 λ 2 0.0634 2 + 10.41 λ 2 λ 2 27.12 2
where λ is the wavelength in micrometers. To determine the effective dielectric function of the SiO2:air layer (we call it ε e f f 2 , ω ) we use the Bruggeman effective medium approximation [23,24]:
f S i O 2 ε A i r ε e f f 2 , ω ε e f f 2 , ω + L m ( ε A i r ε e f f 2 , ω ) + ( 1 f S i O 2 ) ε S i O 2 , ω ε e f f 2 , ω ε e f f 2 , ω + ( ε S i O 2 , ω ε e f f 2 , ω ) / 3 = 0
where f S i O 2 is the filling factor of the SiO2 nanoparticles (i.e., the fraction of layer volume occupied by the nanoparticles) and in this study we choose f S i O 2 = 0.7 . Lm is the depolarization factor, equal to 1/3 if we assume a film of SiO2 spherical nanoparticles. The photon energy dependent complex refractive index of the SiO2:air layer was determined considering that n e f f 2 , ω = ε e f f 2 , ω .
The ITO:TiO2:air layers and the SiO2:air layers can be considered as random networks of nanoparticles. Thus, a filling factor up to 0.7 is a reliable value [25].

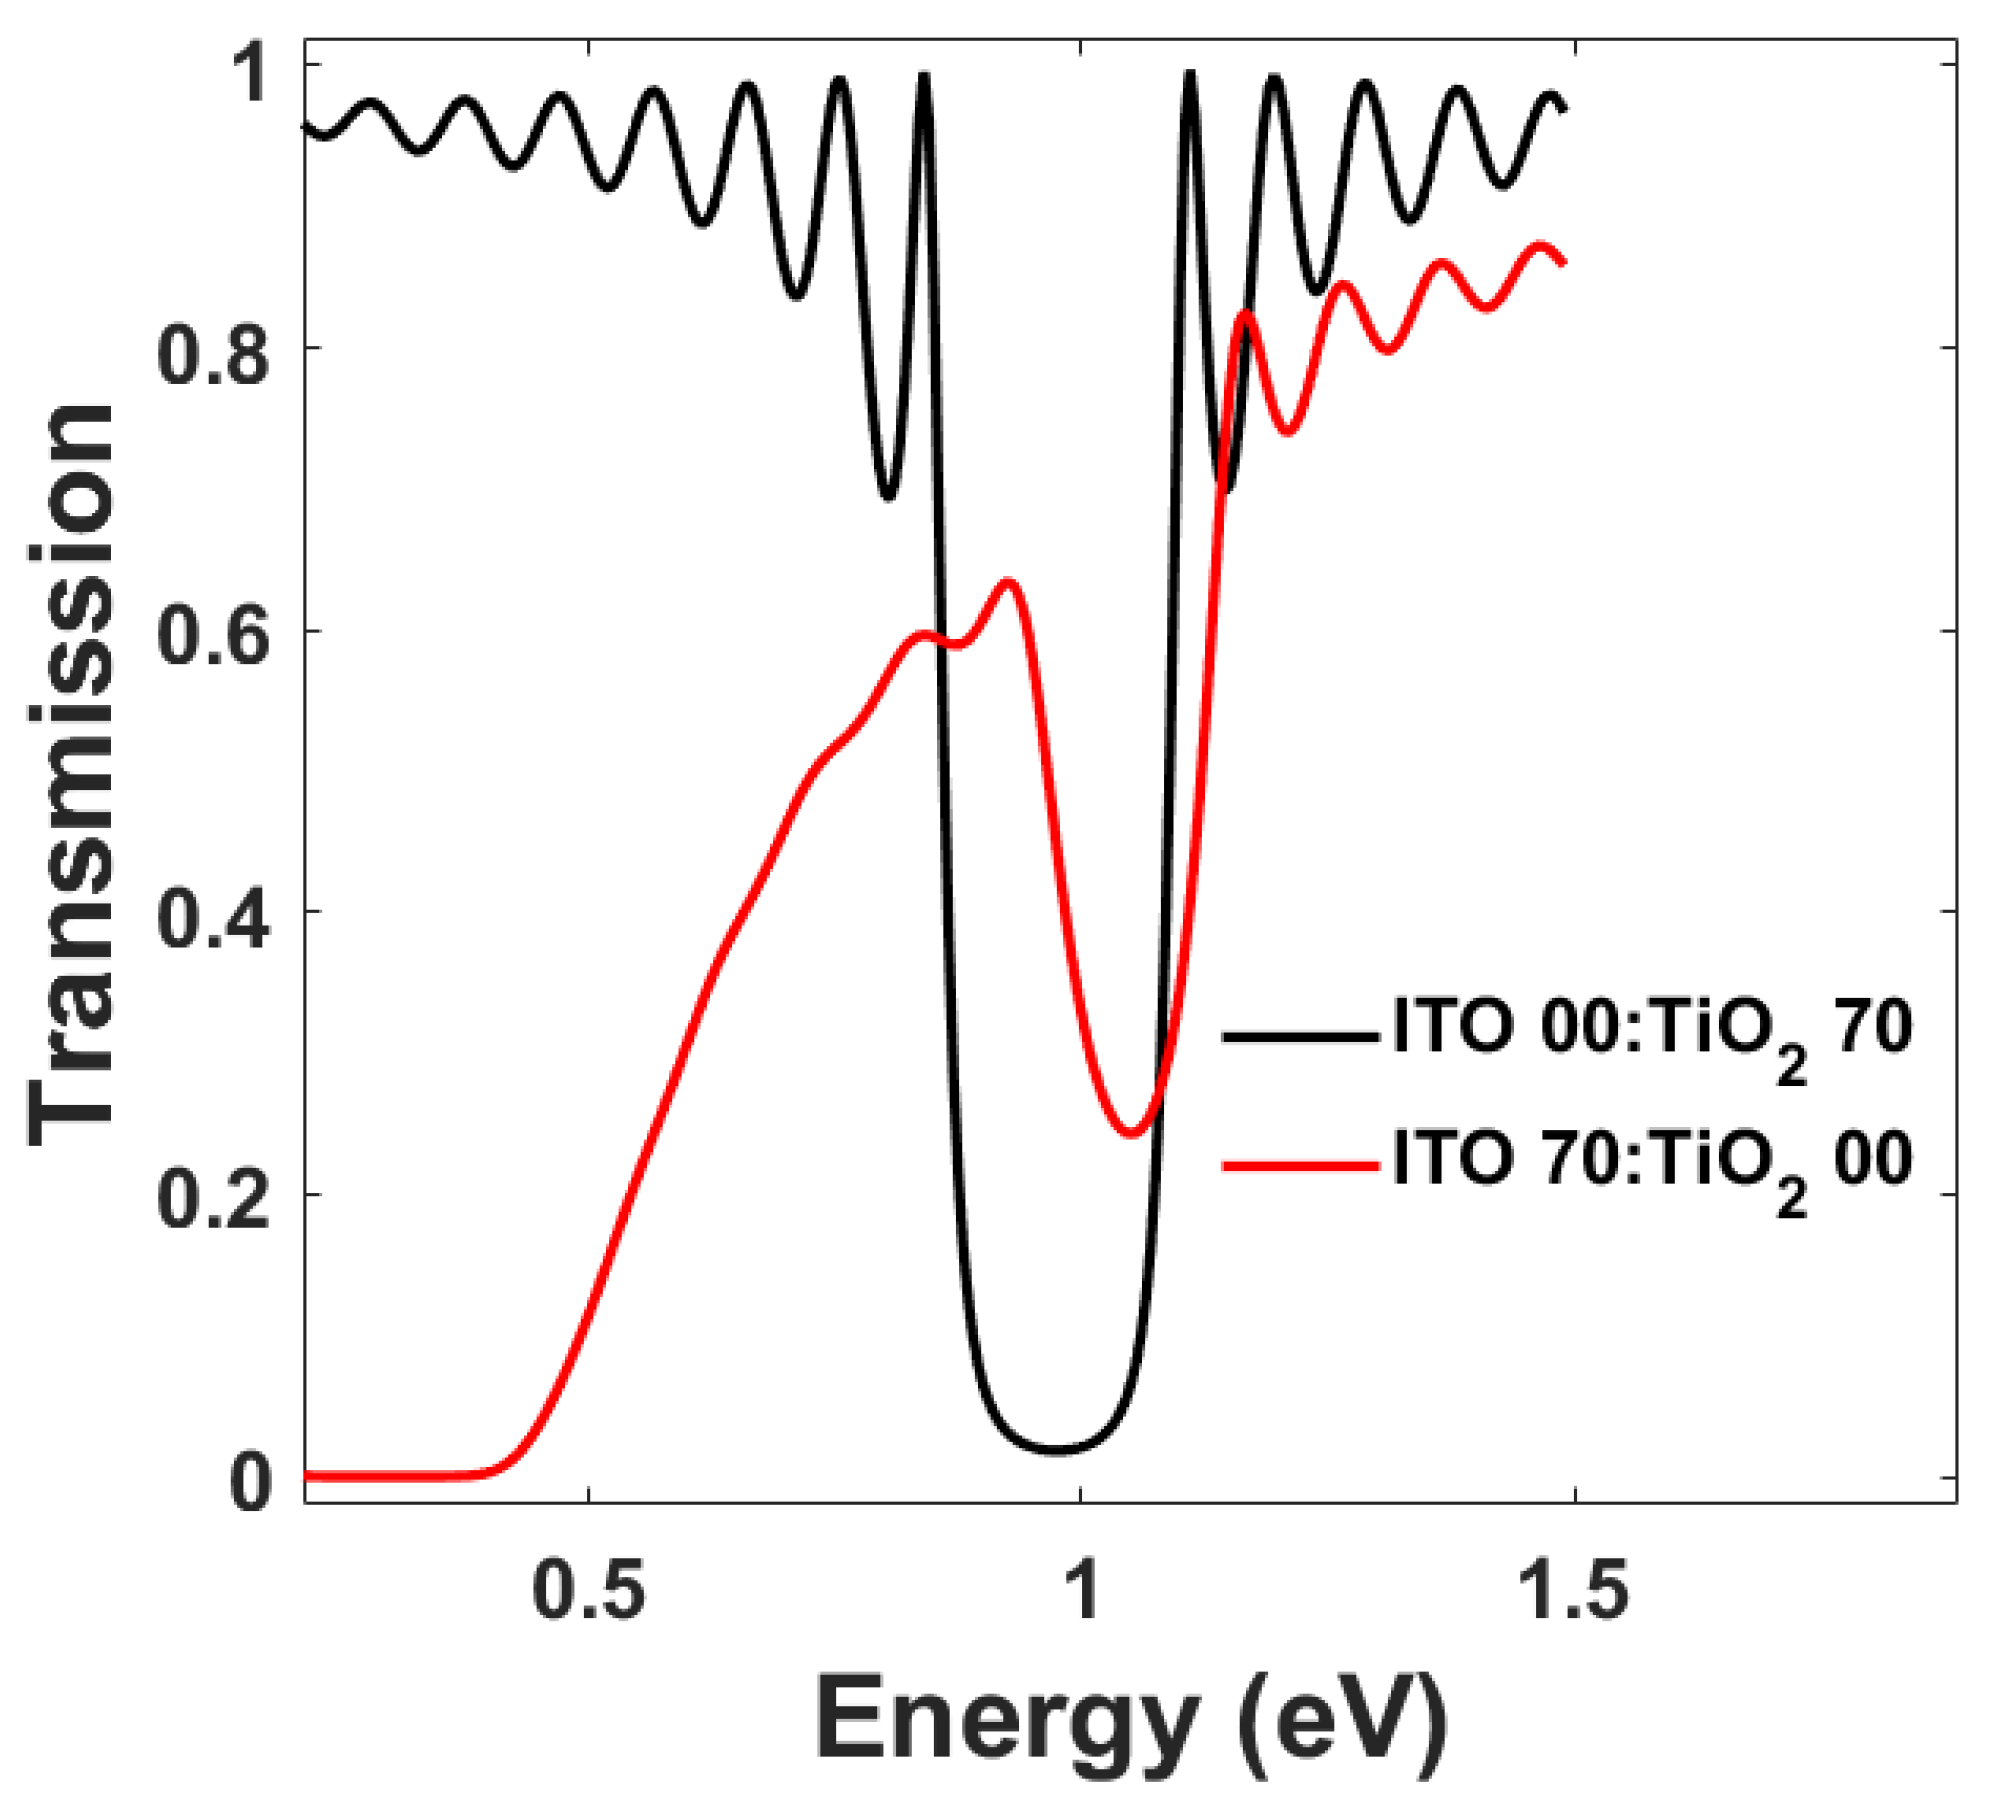
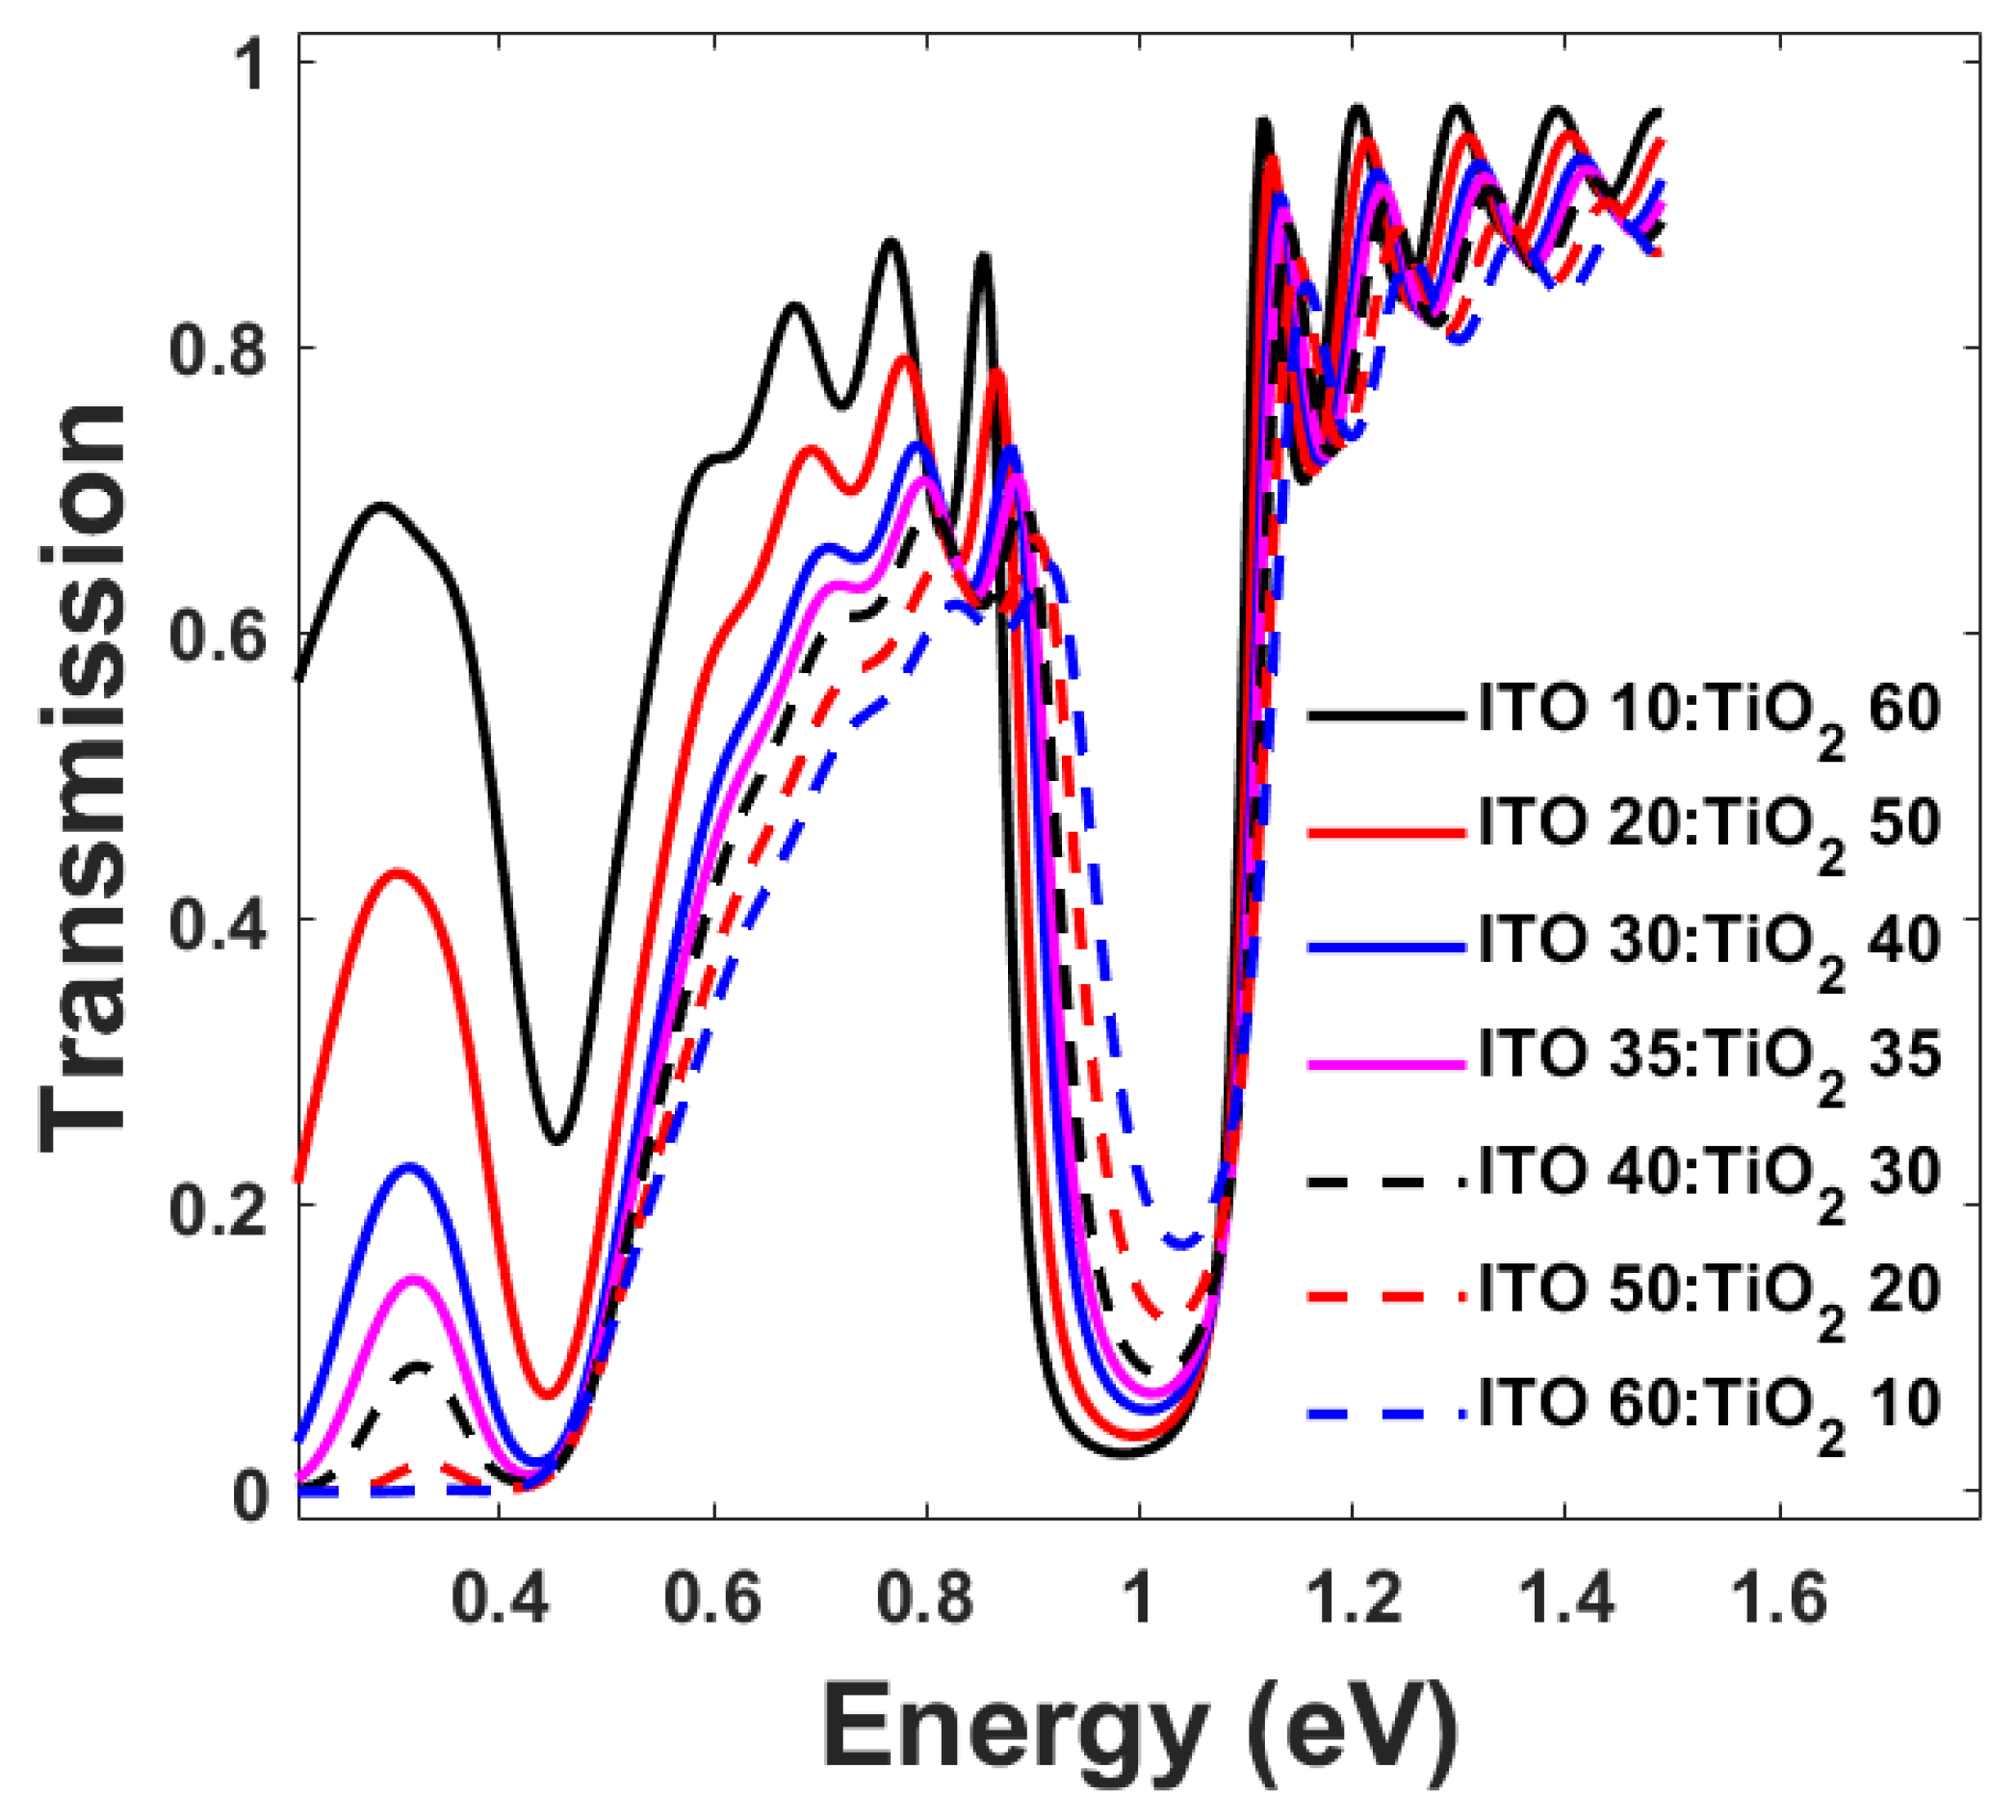
2.3. Transmission of the Multilayer Photonic Crystal

We used the two refractive indexes n e f f 1 , ω and n e f f 2 , ω for the ITO:TiO2:air layers and for the SiO2:air layers, respectively, to study the light transmission through the photonic structure by employ the transfer matrix method [8,26,27]. For a transverse electric (TE) wave the transfer matrix for the kth layer is given by:
M k = [ c o s ( 2 π λ n k d k ) i n k s i n ( 2 π λ n k d k ) i n k s i n ( 2 π λ n k d k ) c o s ( 2 π λ n k d k ) ]
with nk the refractive index and dk the thickness of the layer. In this study the thickness of the ITO:TiO2:Air layers is 185.63 nm, while the thickness of the SiO2:Air layers is 238.46 nm.
The product M = M 1 M 2 M k M s = [ m 11 m 12 m 21 m 22 ] gives the matrix of the multilayer (of s layers). The transmission coefficient is:
t = 2 n s ( m 11 + m 12 n 0 ) n s + ( m 21 + m 22 n 0 )
with ns the refractive index of the substrate (in this study n s = 1.46 ) and n0 the refractive index of air. Thus, the light transmission of the multilayer photonic crystal is:
T = n 0 n s | t | 2
In this work the number of bilayers selected was 10 (i.e., the ITO:TiO2:air/SiO2:air bilayer repeated 10 times), which means 20 layers and a total thickness of about 4,241 nm.

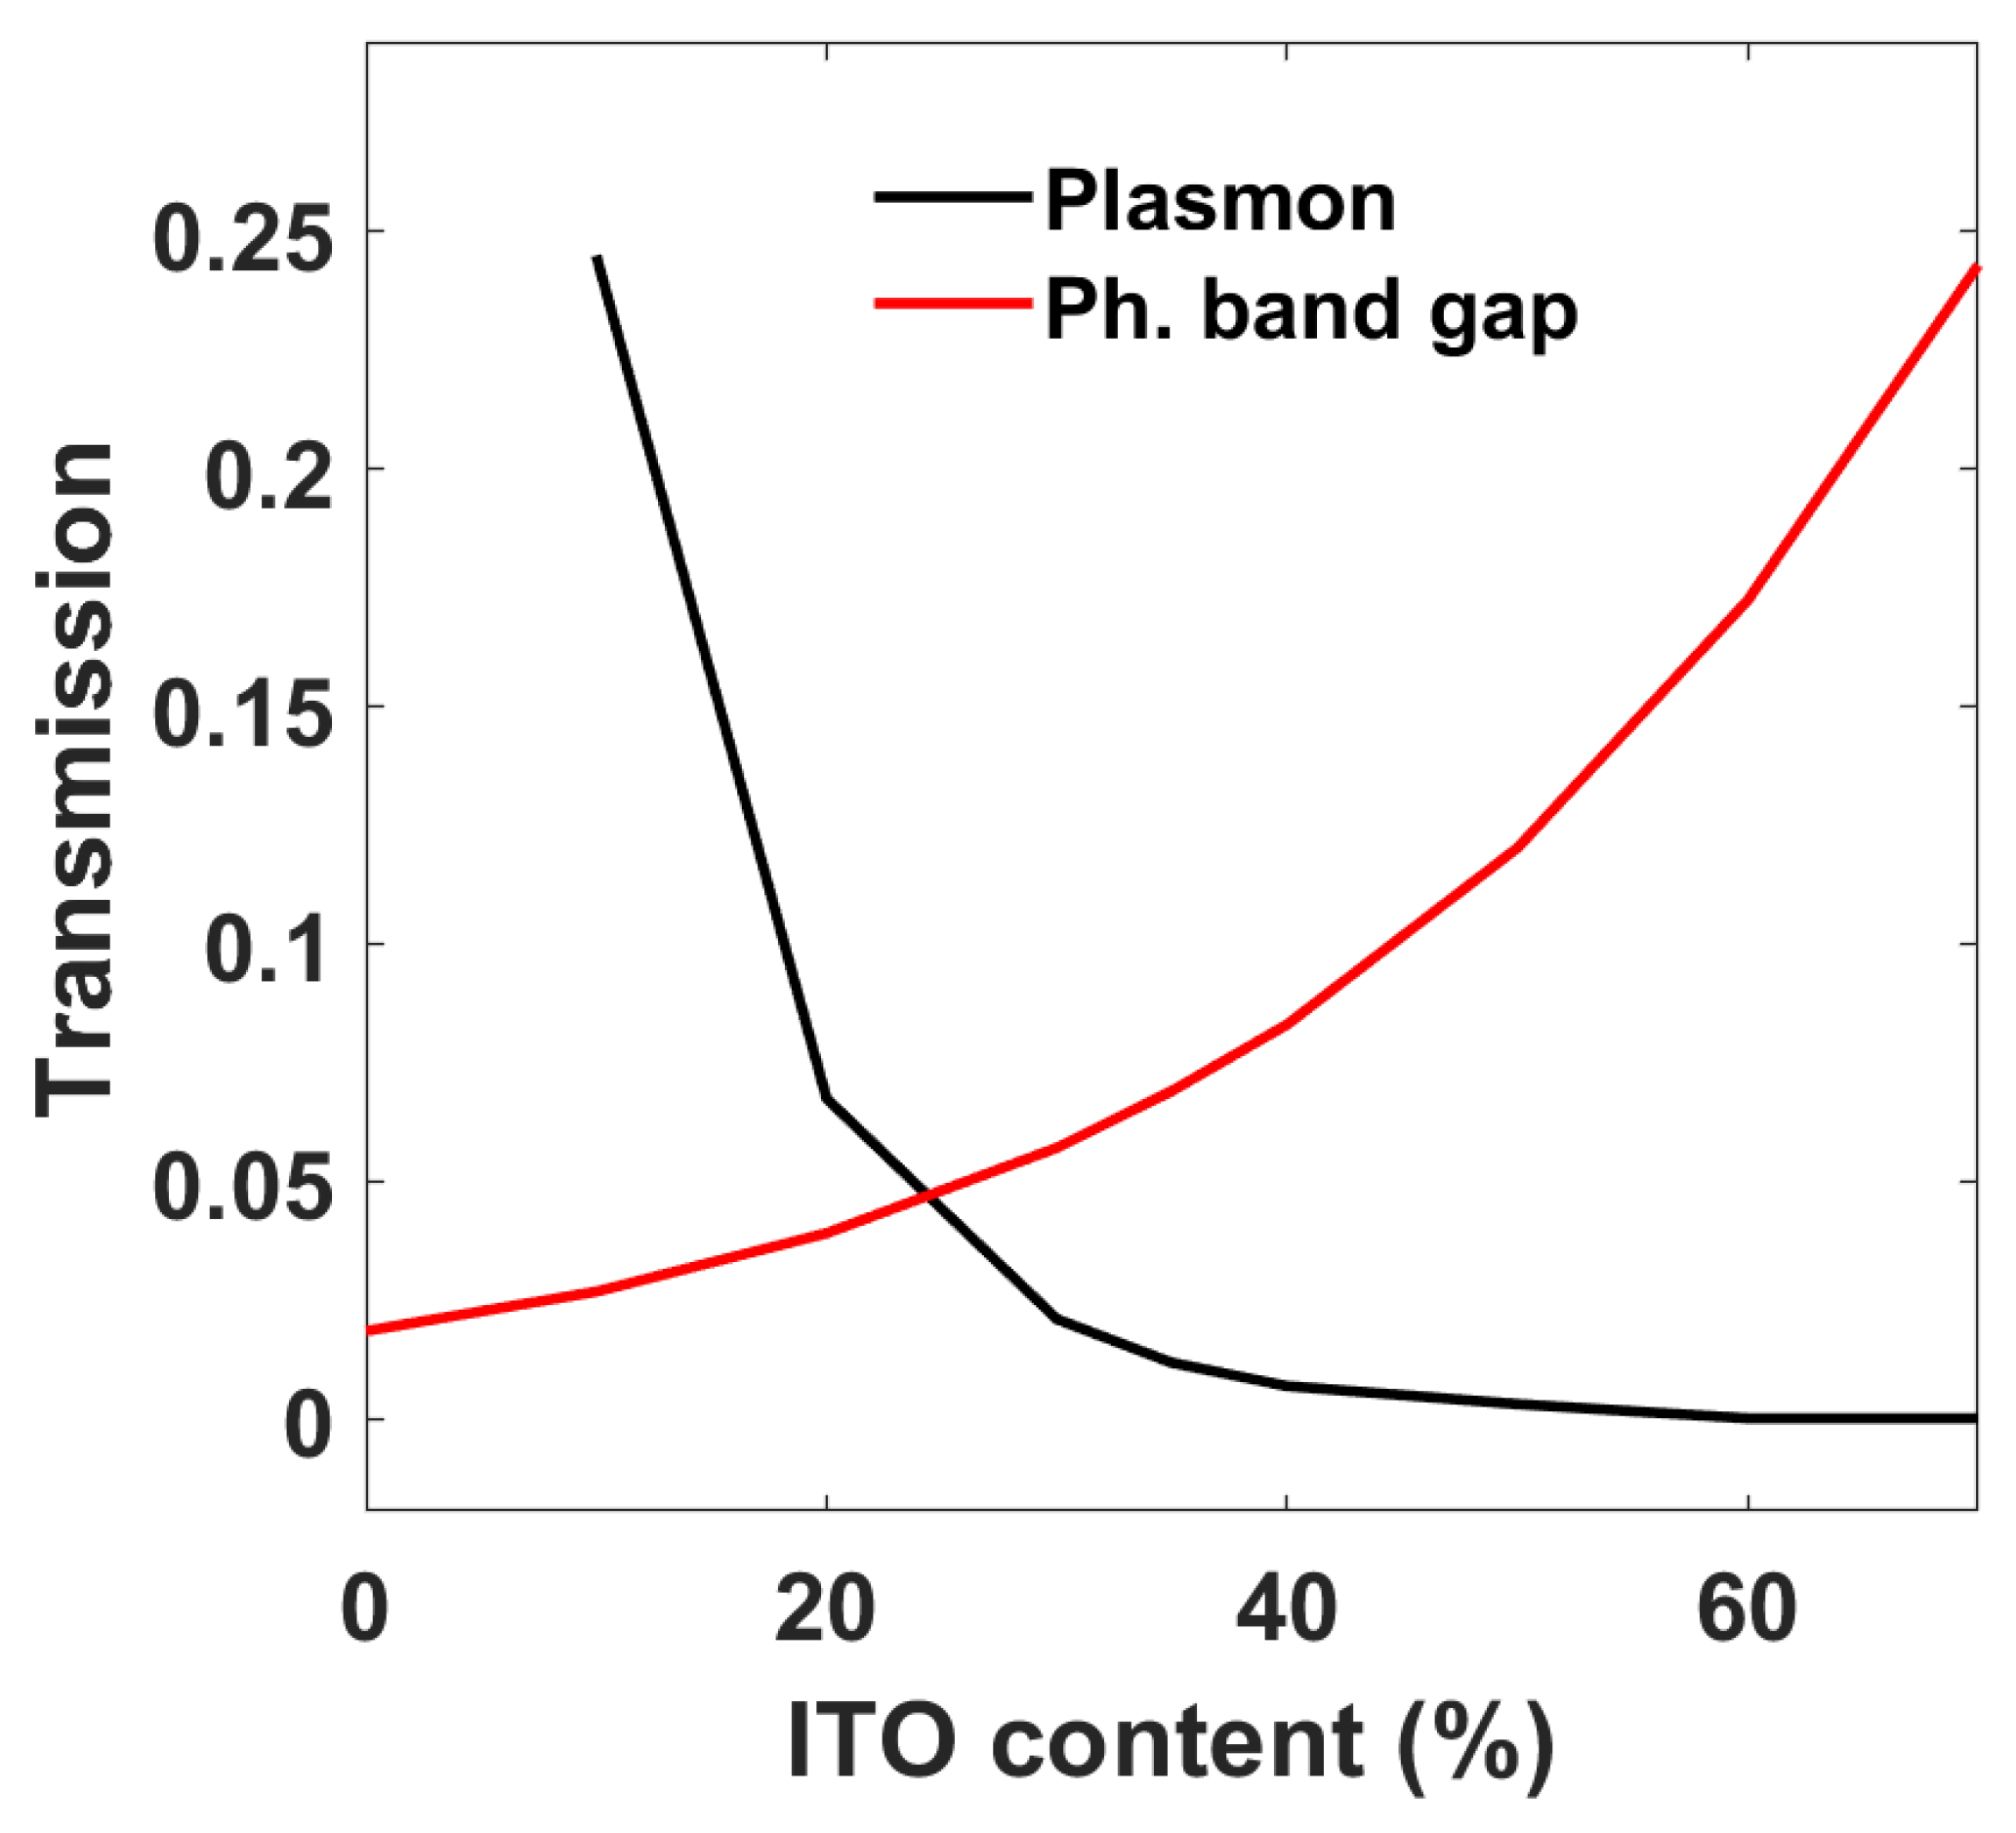
3. Results and Discussion

Figure 1a represents a sketch of a ITO:TiO2:air/SiO2:air multilayer structure and a magnification of an ITO:TiO2:air layer. The blue dots indicate the ITO nanoparticles, while the grey dots indicate the TiO2 nanoparticles. The white interstitial volume depicts the air voids between the nanoparticles. To determine the effective refractive index of the layer we used a generalized Rayleigh Equation for a three-phase mixture (Equation (5)).
In Figure 1b, the dashed curve represents the real (black) and imaginary (red) part of the dielectric function of an ITO:air two-phase mixture, which is a dispersion of ITO nanoparticles, with a filling factor of 0.2, in air. This two-phase mixture refractive index is determined with the Bruggeman effective medium theory [23,24]. Instead, the solid curves in Figure 1b represent the real (black) and imaginary (red) part of the effective dielectric function of an ITO:TiO2:air mixture. It is clear that the resonance related to the ITO plasmonic peak shows a splitting, and one resonance shifts towards higher energies in the three-material mixture evidencing the possibility to further tailor the optical response of ITO nanostructures.
In Figure 2 we show the difference between a photonic crystal with layers of silica nanoparticles alternated with layers of titania nanoparticles (black curve), and a photonic crystal with layers of silica nanoparticles alternated with a layer of ITO nanoparticles (red curve).
The silica/ITO photonic crystal shows a strong transmission valley at lower energy due to the plasmon resonance of ITO. Moreover, the silica/ITO photonic crystal shows a less intense photonic band gap with respect to the one of the silica/titania photonic crystal because of the smaller refractive index contrast. We can now relate to the two spectra in Figure 2 as the two extremes of a three-phase mixture of ITO nanoparticles, TiO2 nanoparticles, and air in which we keep constant the volume of air and we change the ITO:TiO2 ratio. We show this ratio variation in Figure 3, where the increasing content of ITO relates to an increase in the transmission valley intensity due to the plasmon resonance. Interestingly, the plasmon resonance is blue shifted with respect to the one of the ITO:air layer.
In Figure 4 we show the transmission value in correspondence of the plasmon resonance and the photonic band gap of the structure as a function of the ITO content, highlighting a cross over between f I T O = 0.2 and f I T O = 0.3 (corresponding to the red and blue curves in Figure 3).
By changing the carrier density in ITO we can further modulate the light transmission of the photonic crystal, since the change in the number of carriers leads to a change in the plasma frequency, and thus the dielectric function of ITO. This results in a simultaneous change of the plasmon resonance and of the photonic band gap.
Figure 5 depicts changes to modulation in the number of carriers in ITO for photonic crystals where the ratio in the ITO:TiO2:air layer is 10:60:30 (Figure 5a), 30:40:30 (Figure 5b), and 60:10:30 (Figure 5c). We change the number of carriers from 2.49 to 5.49 × 10 26   charges / m 3 . This change in the number of carriers can be for example induced via an electrochemical [18] or optical [28] way.
If we use the photonic crystal where the ITO:TiO2:air layer has a ratio 60:10:30 (Figure 5c) as a filter for the Sun irradiation (direct and circumsolar [29]), we see that in the three bands in the range between 0.6 and 1.1 eV the light transmission is switched for two doping levels (Figure 6).
We need to consider that a layer in which ITO nanoparticles and TiO2 nanoparticles are in close contact can be seen as a bulk heterojunction, with a large contact surface between the two materials, in which plasmon-induced hot electron generation can occur [30,31]. In a future work, for a more precise description of this interesting entangled multicomponent nanostructure, we should take into account this type of interaction.

4. Conclusions

In this work we show the light transmission properties of a one-dimensional multilayer photonic crystal made by alternating silica nanoparticle layers and ITO nanoparticle:TiO2 nanoparticle layers. We have calculated the effective refractive index of the silica layer considering it as a two-phase mixture and the one of the ITO:titania layer, considering it as a three-phase mixture. We use the calculated effective refractive indexes in the transfer matrix method to determine the light transmission of the multilayer structure. The ITO content and carrier density in the ITO:TiO2:air mixture affects both the intensity of the plasmon resonance and the photonic band gap, highlighting their use as tunable filters where light transmission can be switched, depending on the carrier density. Future works can be focused on the interaction, in terms of plasmon-induced hot electron extraction, in indium tin oxide—TiO2 nanoheterojunctions.

Author Contributions

Conceptualization, I.K. and F.S.; Methodology, I.K. and F.S.; Writing—original draft, I.K. and F.S.; Writing—review & editing, F.S.

Funding

This project received funding from the European Research Council (ERC) under the European Union’s Horizon 2020 research and innovation programme (grant agreement No. [816313]).

Conflicts of Interest

The authors declare no conflict of interest.

References

  1. von Freymann, G.; Kitaev, V.; Lotsch, B.V.; Ozin, G.A. Bottom-up assembly of photonic crystals. Chem. Soc. Rev. 2013, 42, 2528–2554. [Google Scholar] [CrossRef] [PubMed]
  2. Lova, P.; Manfredi, G.; Comoretto, D. Advances in Functional Solution Processed Planar 1D Photonic Crystals. Adv. Opt. Mater. 2018, 6, 1800730. [Google Scholar] [CrossRef]
  3. Chiasera, A.; Tosello, C.; Moser, E.; Montagna, M.; Belli, R.; Gonçalves, R.R.; Righini, G.C.; Pelli, S.; Chiappini, A.; Zampedri, L.; et al. Er3+/Yb3+-activated silica–titania planar waveguides for EDPWAs fabricated by rf-sputtering. J. Non-Cryst. Solids 2003, 322, 289–294. [Google Scholar] [CrossRef]
  4. John, S. Strong localization of photons in certain disordered dielectric superlattices. Phys. Rev. Lett. 1987, 58, 2486–2489. [Google Scholar] [CrossRef] [PubMed] [Green Version]
  5. Yablonovitch, E. Inhibited Spontaneous Emission in Solid-State Physics and Electronics. Phys. Rev. Lett. 1987, 58, 2059–2062. [Google Scholar] [CrossRef] [PubMed] [Green Version]
  6. Joannopoulos, J.D. Photonic Crystals: Molding the Flow of Light; Princeton University Press: Princeton, NJ, USA, 2008. [Google Scholar]
  7. Nucara, L.; Greco, F.; Mattoli, V. Electrically responsive photonic crystals: A review. J. Mater. Chem. C 2015, 3, 8449–8467. [Google Scholar] [CrossRef]
  8. Bellingeri, M.; Chiasera, A.; Kriegel, I.; Scotognella, F. Optical properties of periodic, quasi-periodic, and disordered one-dimensional photonic structures. Opt. Mater. 2017, 72, 403–421. [Google Scholar] [CrossRef] [Green Version]
  9. Kriegel, I.; Scotognella, F.; Manna, L. Plasmonic doped semiconductor nanocrystals: Properties, fabrication, applications and perspectives. Phys. Rep. 2017, 674, 1–52. [Google Scholar] [CrossRef]
  10. Naik, G.V.; Shalaev, V.M.; Boltasseva, A. Alternative Plasmonic Materials: Beyond Gold and Silver. Adv. Mater. 2013, 25, 3264–3294. [Google Scholar] [CrossRef]
  11. Pedroni, M.; Canetti, M.; Chiarello, G.L.; Cremona, A.; Inzoli, F.; Luzzati, S.; Pietralunga, S.M.; Tagliaferri, A.; Zani, M.; Vassallo, E.; et al. Tungsten oxide thin film photo-anodes by reactive RF diode sputtering. Thin Solid Film. 2016, 616, 375–380. [Google Scholar] [CrossRef]
  12. Feigenbaum, E.; Diest, K.; Atwater, H.A. Unity-Order Index Change in Transparent Conducting Oxides at Visible Frequencies. Nano Lett. 2010, 10, 2111–2116. [Google Scholar] [CrossRef] [PubMed]
  13. Agrawal, A.; Kriegel, I.; Runnerstrom, E.L.; Scotognella, F.; Llordes, A.; Milliron, D.J. Rationalizing the Impact of Surface Depletion on Electrochemical Modulation of Plasmon Resonance Absorption in Metal Oxide Nanocrystals. ACS Photonics 2018, 5, 2044–2050. [Google Scholar] [CrossRef]
  14. Kriegel, I.; Scotognella, F. Tunable light filtering by a Bragg mirror/heavily doped semiconducting nanocrystal composite. Beilstein J. Nanotechnol. 2015, 6, 193–200. [Google Scholar] [CrossRef] [PubMed] [Green Version]
  15. Guduru, S.S.K.; Kriegel, I.; Ramponi, R.; Scotognella, F. Plasmonic Heavily-Doped Semiconductor Nanocrystal Dielectrics: Making Static Photonic Crystals Dynamic. J. Phys. Chem. C 2015, 119, 2775–2782. [Google Scholar] [CrossRef]
  16. Llordés, A.; Garcia, G.; Gazquez, J.; Milliron, D.J. Tunable near-infrared and visible-light transmittance in nanocrystal-in-glass composites. Nature 2013, 500, 323–326. [Google Scholar] [CrossRef]
  17. Müller, J.; Sönnichsen, C.; von Poschinger, H.; von Plessen, G.; Klar, T.A.; Feldmann, J. Electrically controlled light scattering with single metal nanoparticles. Appl. Phys. Lett. 2002, 81, 171–173. [Google Scholar] [CrossRef]
  18. Lounis, S.D.; Runnerstrom, E.L.; Bergerud, A.; Nordlund, D.; Milliron, D.J. Influence of Dopant Distribution on the Plasmonic Properties of Indium Tin Oxide Nanocrystals. J. Am. Chem. Soc. 2014, 136, 7110–7116. [Google Scholar] [CrossRef]
  19. Mendelsberg, R.J.; Garcia, G.; Li, H.; Manna, L.; Milliron, D.J. Understanding the Plasmon Resonance in Ensembles of Degenerately Doped Semiconductor Nanocrystals. J. Phys. Chem. C 2012, 116, 12226–12231. [Google Scholar] [CrossRef]
  20. Scotognella, F.; Chiasera, A.; Criante, L.; Aluicio-Sarduy, E.; Varas, S.; Pelli, S.; Łukowiak, A.; Righini, G.C.; Ramponi, R.; Ferrari, M.; et al. Metal oxide one dimensional photonic crystals made by RF sputtering and spin coating. Ceram. Int. 2015, 41, 8655–8659. [Google Scholar] [CrossRef]
  21. Sihvola, A.; Lindell, I.V. Polarizability and Effective Permittivity of Layered and Continuously Inhomogeneous Dielectric Spheres. J. Electromagn. Waves Appl. 1989, 3, 37–60. [Google Scholar] [CrossRef]
  22. Malitson, I.H. Interspecimen Comparison of the Refractive Index of Fused Silica. J. Opt. Soc. Am. 1965, 55, 1205–1208. [Google Scholar] [CrossRef]
  23. Niklasson, G.A.; Granqvist, C.G. Optical properties and solar selectivity of coevaporated Co-Al2O3 composite films. J. Appl. Phys. 1984, 55, 3382–3410. [Google Scholar] [CrossRef]
  24. Smith, G.B.; Niklasson, G.A.; Svensson, J.S.E.M.; Granqvist, C.G. Noble-metal-based transparent infrared reflectors: Experiments and theoretical analyses for very thin gold films. J. Appl. Phys. 1986, 59, 571–581. [Google Scholar] [CrossRef]
  25. Scotognella, F.; Puzzo, D.P.; Monguzzi, A.; Wiersma, D.S.; Maschke, D.; Tubino, R.; Ozin, G.A. Nanoparticle One-Dimensional Photonic-Crystal Dye Laser. Small 2009, 5, 2048–2052. [Google Scholar] [CrossRef] [PubMed]
  26. Born, M.; Wolf, E. Principles of Optics: Electromagnetic Theory of Propagation, Interference and Diffraction of Light; Cambridge University Press: Cambridge, UK, 2000. [Google Scholar]
  27. Xiao, X.; Wenjun, W.; Shuhong, L.; Wanquan, Z.; Dong, Z.; Qianqian, D.; Xuexi, G.; Bingyuan, Z. Investigation of defect modes with Al2O3 and TiO2 in one-dimensional photonic crystals. Optik 2016, 127, 135–138. [Google Scholar] [CrossRef]
  28. Paternò, G.M.; Iseppon, C.; D’Altri, A.; Fasanotti, C.; Merati, G.; Randi, M.; Desii, A.; Pogna, E.A.A.; Viola, D.; Cerullo, G.; et al. Solution Processable and Optically Switchable 1D Photonic Structures. ArXiv171103192 Cond-Mat Physicsphysics. Available online: http://arxiv.org/abs/1711.03192 (accessed on 5 December 2017).
  29. Solar Spectral Irradiance: Air Mass 1.5, (n.d.). Available online: http://rredc.nrel.gov/solar/spectra/am1.5/ (accessed on 14 February 2018).
  30. Clavero, C. Plasmon-induced hot-electron generation at nanoparticle/metal-oxide interfaces for photovoltaic and photocatalytic devices. Nat. Photonics 2014, 8, 95–103. [Google Scholar] [CrossRef]
  31. Leenheer, A.J.; Narang, P.; Lewis, N.S.; Atwater, H.A. Solar energy conversion via hot electron internal photoemission in metallic nanostructures: Efficiency estimates. J. Appl. Phys. 2014, 115, 134301. [Google Scholar] [CrossRef] [Green Version]
Figure 1. (a) Sketch of an indium tin oxide (ITO):TiO2:air layer, with ITO nanoparticles (blue dots), TiO2 nanoparticles (grey dots), and air (white interstitial volume); (b) real part (solid black curve) and imaginary part (solid red curve) of the dielectric function of a ITO:TiO2:air (20:50:30 ratio) layer, calculated with the Rayleigh mixing formula, and real part (dashed black curve) and imaginary part (dashed red curve) of a ITO:air (20:80 ratio) layer, calculated with the Bruggeman approximation.
Applsci 09 02564 g001
Figure 2. Light transmission spectrum of a SiO2 nanoparticle/TiO2 nanoparticle photonic crystal (black curve) both with a filling factor of 0.7, and light transmission spectrum of a SiO2 nanoparticle/ITO nanoparticle photonic crystal (red curve) both with a filling factor of 0.7.
Applsci 09 02564 g002
Figure 3. Light transmission spectra of ITO:TiO2:air/SiO2:air multilayer photonic crystals with different ITO:TiO2 ratios, keeping constant the sum of f I T O + f T i O 2 = 0.7 .
Applsci 09 02564 g003
Figure 4. Transmission minima of the plasmon resonance and of the photonic band gap as a function of the ITO nanoparticles, keeping constant the sum of f I T O + f T i O 2 = 0.7 .
Applsci 09 02564 g004
Figure 5. Light transmission spectra of the photonic crystal as a function of the doping level ( 2.49 × 10 26   charges / m 3 , 3.49 × 10 26   charges / m 3 , 4.49 × 10 26   charges / m 3 , 5.49 × 10 26   charges / m 3 ) for the ITO:TiO2 ratio (a) 10:60, (b) 30:40, and (c) 60:10.
Applsci 09 02564 g005
Figure 6. Transmission of the Sun (direct and circumsolar irradiation [29]) without the photonic crystal filter (blue curve), with an ITO:TiO2 60:10 sample characterized by a doping level of 2.49 × 10 26   charges / m 3 (red curve) and 5.49 × 10 26   charges / m 3 (yellow curve).
Applsci 09 02564 g006

