1. Introduction
All-solid-state neodymium doped yttrium aluminum garnet Nd:YAG lasers pumped by laser diodes (LDs) have been studied extensively for various applications, including material processing [
1], nonlinear optics [
2,
3], lidars [
4], the military domain [
5,
6], and medical surgery [
7] due to their inherent advantages of a high output power, good beam quality, and high stability. The internal parameters of a laser, especially the small-signal gain, internal optical losses, and saturation parameter, and the optimization of a laser’s output coupler are essential to the production, maintenance, and design of Nd:YAG laser systems.
A variety of methods for measuring the small-signal gain and internal round-trip loss have been presented [
8,
9,
10,
11,
12,
13,
14,
15,
16,
17,
18]. The first one was single-pass measurement, in which a probe laser beam is injected into the laser being measured [
8,
9,
10]. In single-pass measurement, a probe laser line should be strictly aligned with the laser line being measured. However, it is not easy in fact to satisfy the condition because of the difficulty in constructing identical laser systems [
11]. The most popular one was proposed by Findlay and Clay [
12]. By using a few sets of output couplers with different transmittances, the corresponding threshold pump powers are recorded, the intra-cavity round-trip loss is obtained by a numeric calculation, and then the small-signal gain as a function of the input power is plotted. In Findlay and Clay’s approach, the work of measurement is heavy because the output couplers need to be frequently replaced, leading to the inevitable realignment of the resonator [
13,
14]. Some variable intra-cavity loss methods [
14,
15,
16,
17,
18] were further developed by observing the dependence of the input or output powers on some adjustable loss parameters, such as introducing internal reflective loss by a rotatable plate [
15,
16], introducing internal modulation loss by nonlinear loss [
14], and using an adjustable interferometer output coupler [
17,
18]. In these intra-cavity loss methods, the output coupler of a laser is often replaced by an adjustable loss device, e.g., the rotatable plate with a total reflector as an output coupler in [
16] and the adjustable interferometer as an output coupler, which are suitable for a laser optimization design process. The adjustable loss output device would be replaced by an optimized cavity mirror, except as part of a laser product. Furthermore, the intra-cavity round-trip loss is usually determined by the Findlay and Clay approach of recording the threshold pump powers [
18]. However, the power supply of a pump source is often integrated into a laser product, such as a laser range finder, lidar, and industrial lasers. Thus, the pump power is fixed after the optimization of a laser’s design because the laser parameters are dependent on the input pump powers. Therefore, the above methods are difficult to apply to online measurement of internal parameters, especially the measurement of Nd:YAG laser products. Although the relaxation oscillation spikes frequency measurements (ROF) method is available for in situ small-signal gain determination of continuous-wave (CW) solid-state lasers [
11], it is not easy to use in high pump power and pulsed lasers, where the serious thermal effects would change the ROF frequency [
14]. Consequently, it is necessary to find a simple and practical online measurement method.
In this paper, we present a simple online method for measuring the internal parameters of a quasi-CW diode-pumped Nd:YAG laser. A measurement cell that produces variable polarization reflective loss is introduced. A theoretical model is derived and the internal parameters are measured online. Experiments to investigate validity and the optimization of an output coupler are conducted, and the results are discussed and analyzed. The experimental investigations verify the good measurement accuracy and the applicability of the online measurement method.
2. Materials and Methods
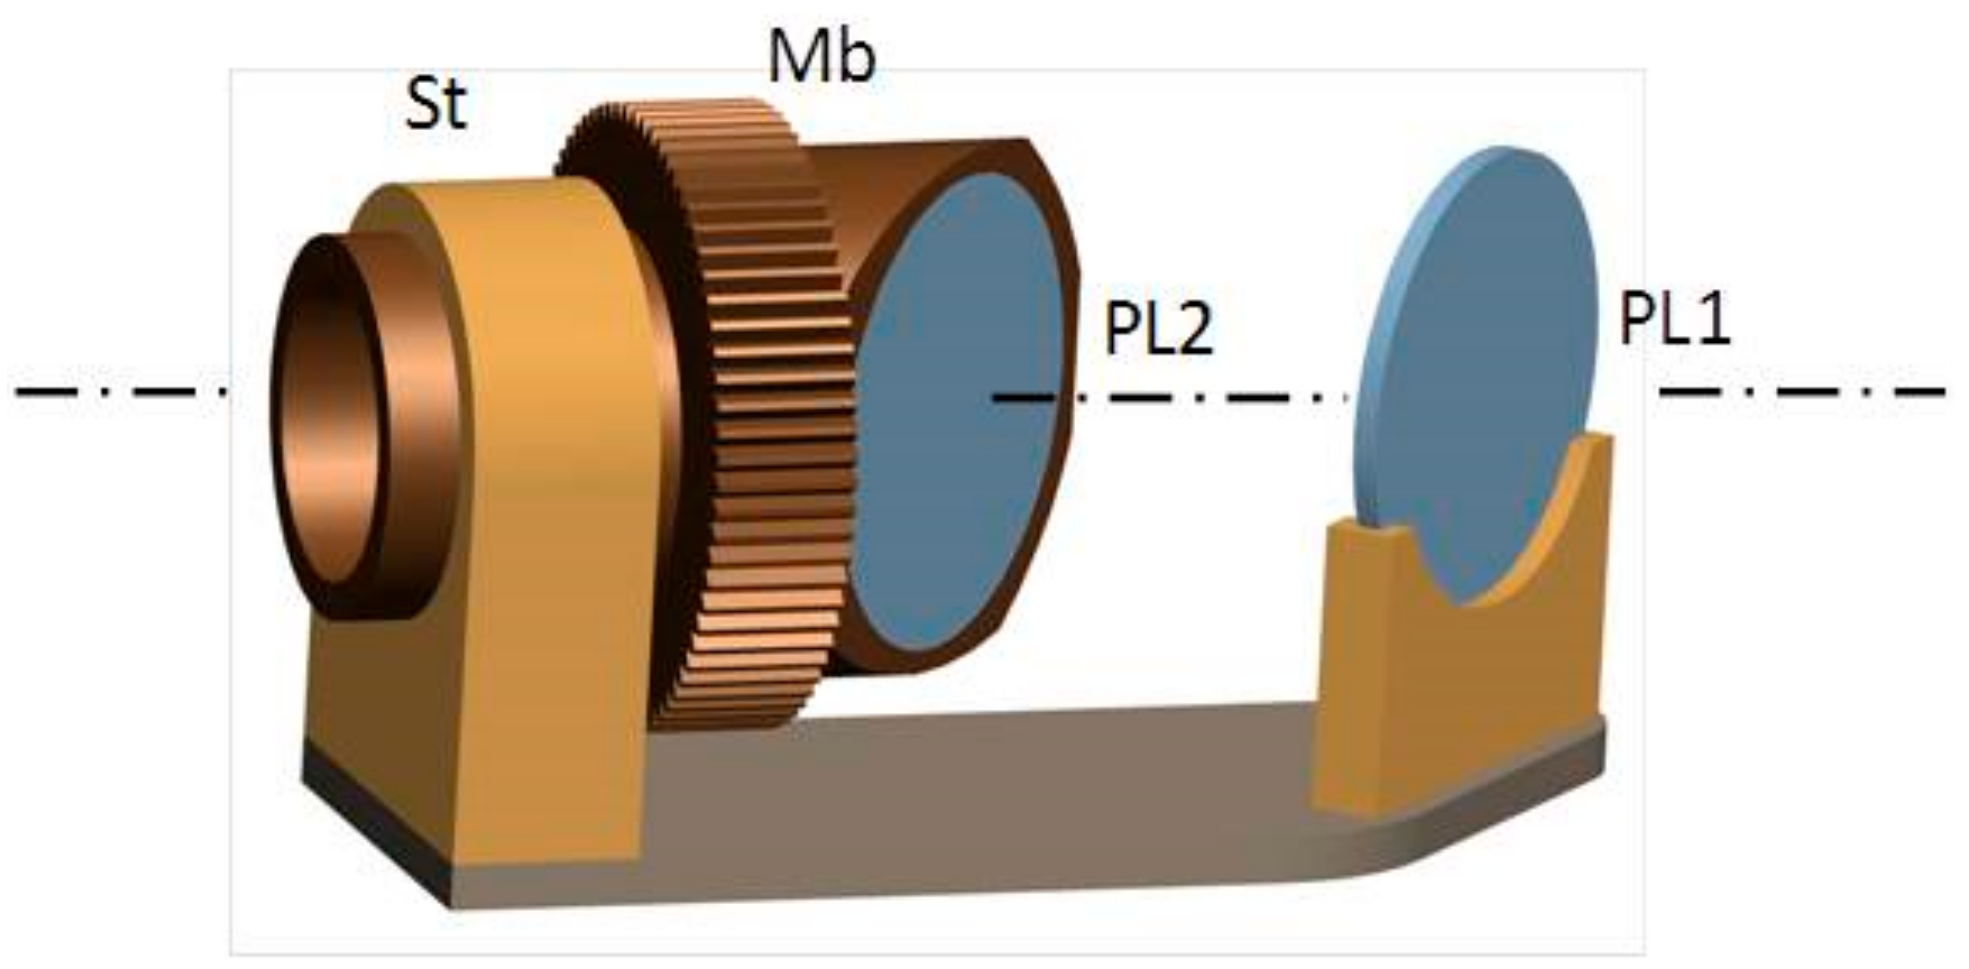
The measurement cell illustrated in
Figure 1a consists of a linear polarizer (PL1) and a linear polarization analyzer (PL2), in which PL2 rotates about the laser propagation axis and thus polarization reflective loss
is generated. The linear polarization direction of PL1 is parallel to the X axis as shown in
Figure 1a and the rotating angle
θ of the analyzer PL2 is defined as an angle between the linear polarization directions of PL2 and PL1. Therefore, PL2 has the vertical axis (the X axis) at the rotating angle of 0 degrees and the horizontal axis (the Y axis) at 90 degrees. The polarization reflective loss
varies with the rotating angle
θ of the analyzer PL2 while the measurement cell is placed in a laser resonator. As a result, the measurement cell actually serves as another variable output coupler in a laser system.
According to the Malus Law, an equivalent transmittance
T(
θ) of the measurement cell after a laser beam makes a round trip is
The equivalent transmittance
T(
θ) of the measurement cell as a function of the rotating angle
θ of the PL2 analyzer is shown in
Figure 1b. The curve of
T(
θ) is mirror symmetrical in four quadrants, and a wide range of equivalent transmittance from 0 to 100% is provided within the limits of the rotating angle of 90 degrees in a quadrant. So, we can conveniently choose any one of the four quadrants to complete the measurements of the internal parameters in a laser.
For a four-level solid-state laser employing the Nd:YAG crystal active medium shown in
Figure 2, the power density saturation is predominantly due to a homogeneous broadening mechanism [
13]. The homogeneous broadening mechanisms of Nd:YAG have a frequency dependence on the Lorentzian lineshape for a atomic response. So, a saturated gain [
19] is reduced according to
where
is the saturated gain coefficient depending on the frequency
and the power density
, and
is the unsaturated gain coefficient at the center frequency of the atomic lineshape.
is the full width at half-maximum of the unsaturated Lorentzian, and
is the saturation parameter.
With some algebra, the frequency term was incorporated into the gain and saturation parameters. Equation (2) can be rewritten as
where
is the unsaturated gain coefficient at the frequency of
, given by
where the expression in the square bracket is the Lorentzian frequency factor. The parameter
defines a saturation power density in the active material at which the unsaturated gain coefficient
is reduced by one-half [
13], given by
From Equation (3), we see that the transition will saturate uniformly under the influence of a sufficiently strong signal applied anywhere within the atomic linewidth of the Lorentzian line shape.
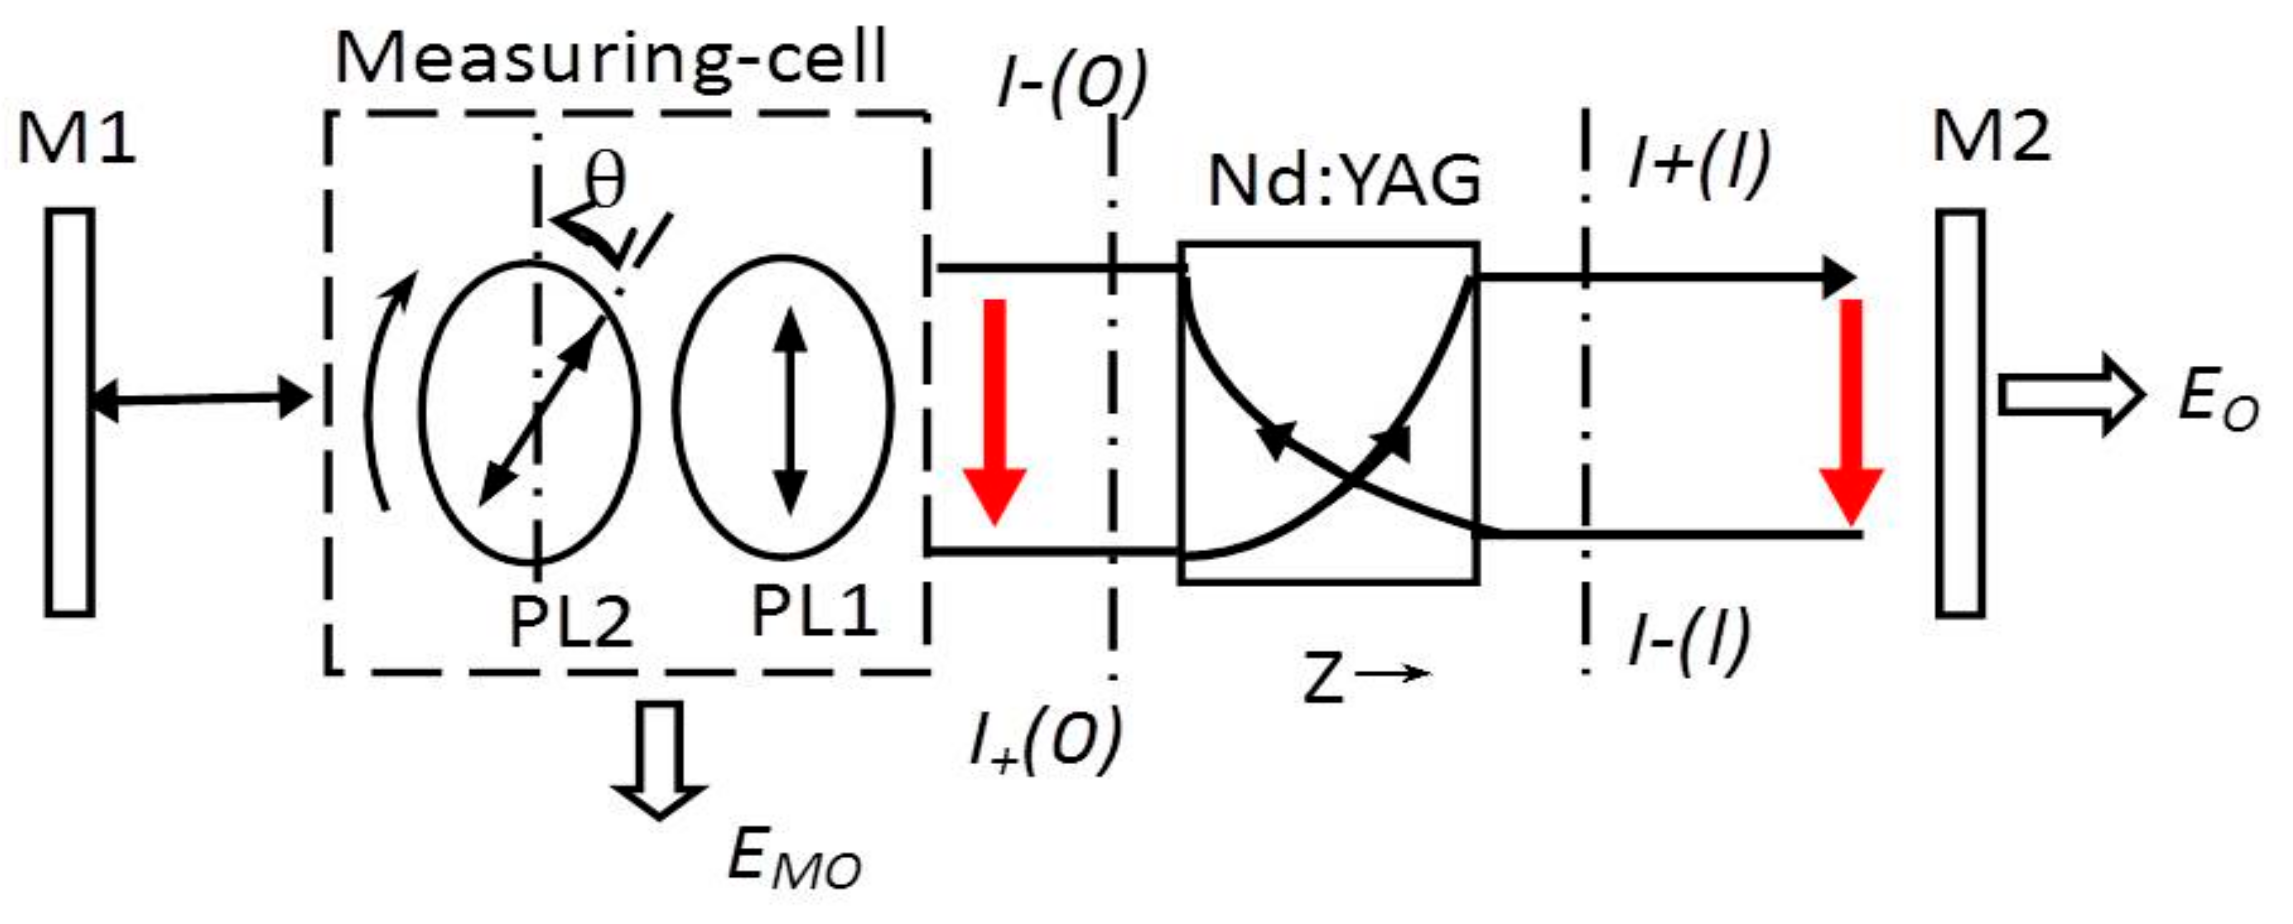
Figure 2 illustrates a laser power circulating in a laser oscillator. The mirror M1 is a total reflector with a high reflectivity and the mirror M2 is an output coupler with a partial transmission in a laser oscillator. We denote the power densities of
in the
and
directions of laser propagation by the wave traveling to the right from
to
and the wave traveling to the left from
to
, respectively. The two-side laser output losses of the Nd:YAG active medium have the
from the measurement cell and
EO from mirror M2.
In
Figure 2, the equations governing the power density of the wave traveling to the right
and the power density of the wave traveling to the left
in the Nd:YAG active medium [
19] are written together as
where
is the absorption loss coefficient of the Nd:YAG crystal.
The gain equations of Equation (6) are transcendental equations because of the absorption loss coefficient
in the gain medium. The solution to Equation (6) is obtained by Rigrod’s approach that the losses of the resonator are assumed to be concentrated near the mirrors [
20]. The round-trip net optical loss of the Nd:YAG crystal is assumed to be uniformly distributed at mirrors M1 and M2. The location of the measurement cell is between mirror M1 and the Nd:YAG crystal, and therefore the polarization reflective transmittance loss and round-trip insertion loss of the measurement cell, as well as the round-trip net optical loss distributed at mirror M1, are concentrated as an effective reflectance loss
of mirror M1 at location Z of 0. An effective reflectance loss
of mirror M2 at location Z of
l includes the transmittance of mirror M2 and the round-trip net optical loss distributed at mirror M2. The effective reflectance losses of
and
in the two sides of the Nd:YAG crystal at locations Z of 0 and
l, respectively, are expressed as
where
is the round-trip insertion loss of the measurement cell, which must be calibrated beforehand,
is the transmittance of the cavity mirror M2, and
is the round-trip net optical loss of the Nd:YAG crystal, given by
where
l is the length of the Nd:YAG crystal.
Oscillations will then stabilize at a level that satisfies the boundary conditions
In a standing wave laser resonator, the power densities will increase up to the steady-state point where the saturated gain equals the total losses. Under a steady-state oscillation condition, the intra-cavity power density as a function of the location Z in a laser resonator as shown in
Figure 2 is fully described by Equations (6), (7), and (9) and the laser outputs are further derived by Rigrod’s approach.
Using Rigrod’s approach [
20], the single-pulse output energy
from the mirror M2 and the output loss
from the measurement cell in a quasi-CW diode-pumped Nd:YAG laser are solved in the form
where
is the integrated small-signal gain coefficient in multimode oscillators and the saturation fluence parameter of
is given by
where
is the fluorescence lifetime,
A is the beam cross-section in the Nd:YAG crystal, and
is the integrated saturation power density parameter in multimode oscillators.
From Equation (10), the output ratio is derived as
Applying Equation (7) into Equation (12), the round-trip net optical loss
is derived as
where
.
If we obtain the transmittance of mirror M2, the round-trip net optical loss δ of the laser medium is determined by Equation (13). The absorption loss coefficient of the Nd:YAG crystal is further obtained by Equation (8).
The two sides of the Nd:YAG crystal have the same loss in a symmetrical resonator defined by
. From Equation (7), one has
The behavior of variable polarization reflective loss generated by the rotation of the analyzer actually functions as another variable cavity mirror. A rotating angle of
, which meets
, is obtained from
The transmittance of the coupling-cavity mirror M2 in a laser system is measured by Equations (14) and (15).
The threshold condition of a laser oscillator with a measurement cell is written as
where
is the losses produced by the measurement cell to make the laser just cease to oscillate and
is the corresponding rotating angle.
is determined by
The internal optical loss of
is the sum of the coupling-out loss of mirror M2 and the round-trip net optical loss
of a Nd:YAG crystal, written as
With the help of Equation (16), the small-signal gain coefficient of is measured. Applying the measured parameters of , , and to the expression of in Equation (10), the saturation fluence parameter of is further obtained and the saturation parameter of is determined by Equation (11).
By virtue of the obtained results of
, δ, and
, the single-pulse output energy
of the Nd:YAG laser product without the measurement cell is described as
With the aid of Equation (19), we can optimize the output coupler and maintain a laser product.
The details of the online measurement process are described as follows. The first step is to measure the transmittance of cavity mirror M2. Rotate the PL2 of the measurement cell to find the angle of at which the condition of Equation (15) is satisfied and then record the values of . The transmittance of the output mirror is measured with the help of Equations (1) and (14). The second step is the measurement of the round-trip net optical loss δ and the small-signal gain coefficient of . Rotate PL2 to make the laser just cease to oscillate and then record . Next, rotate PL2 to the direction of diminishing and find the angles of at which the outputs of and are both large enough and stable enough to reduce the measurement error and then record the values of and . The round-trip net optical loss δ is determined by Equations (1) and (13). Further, obtain the absorption loss coefficient of the Nd:YAG crystal by Equation (8). Then, apply the parameters determined of , , and to Equation (16) and measure the small-signal gain coefficient of . The final step is the measurement of saturation parameter . Apply the measurement results of , and to the expression of in Equation (10), then calculate the saturation fluence parameter of by the recorded values of . Finally, determine the saturation parameter of by Equation (11).
4. Results and Discussion
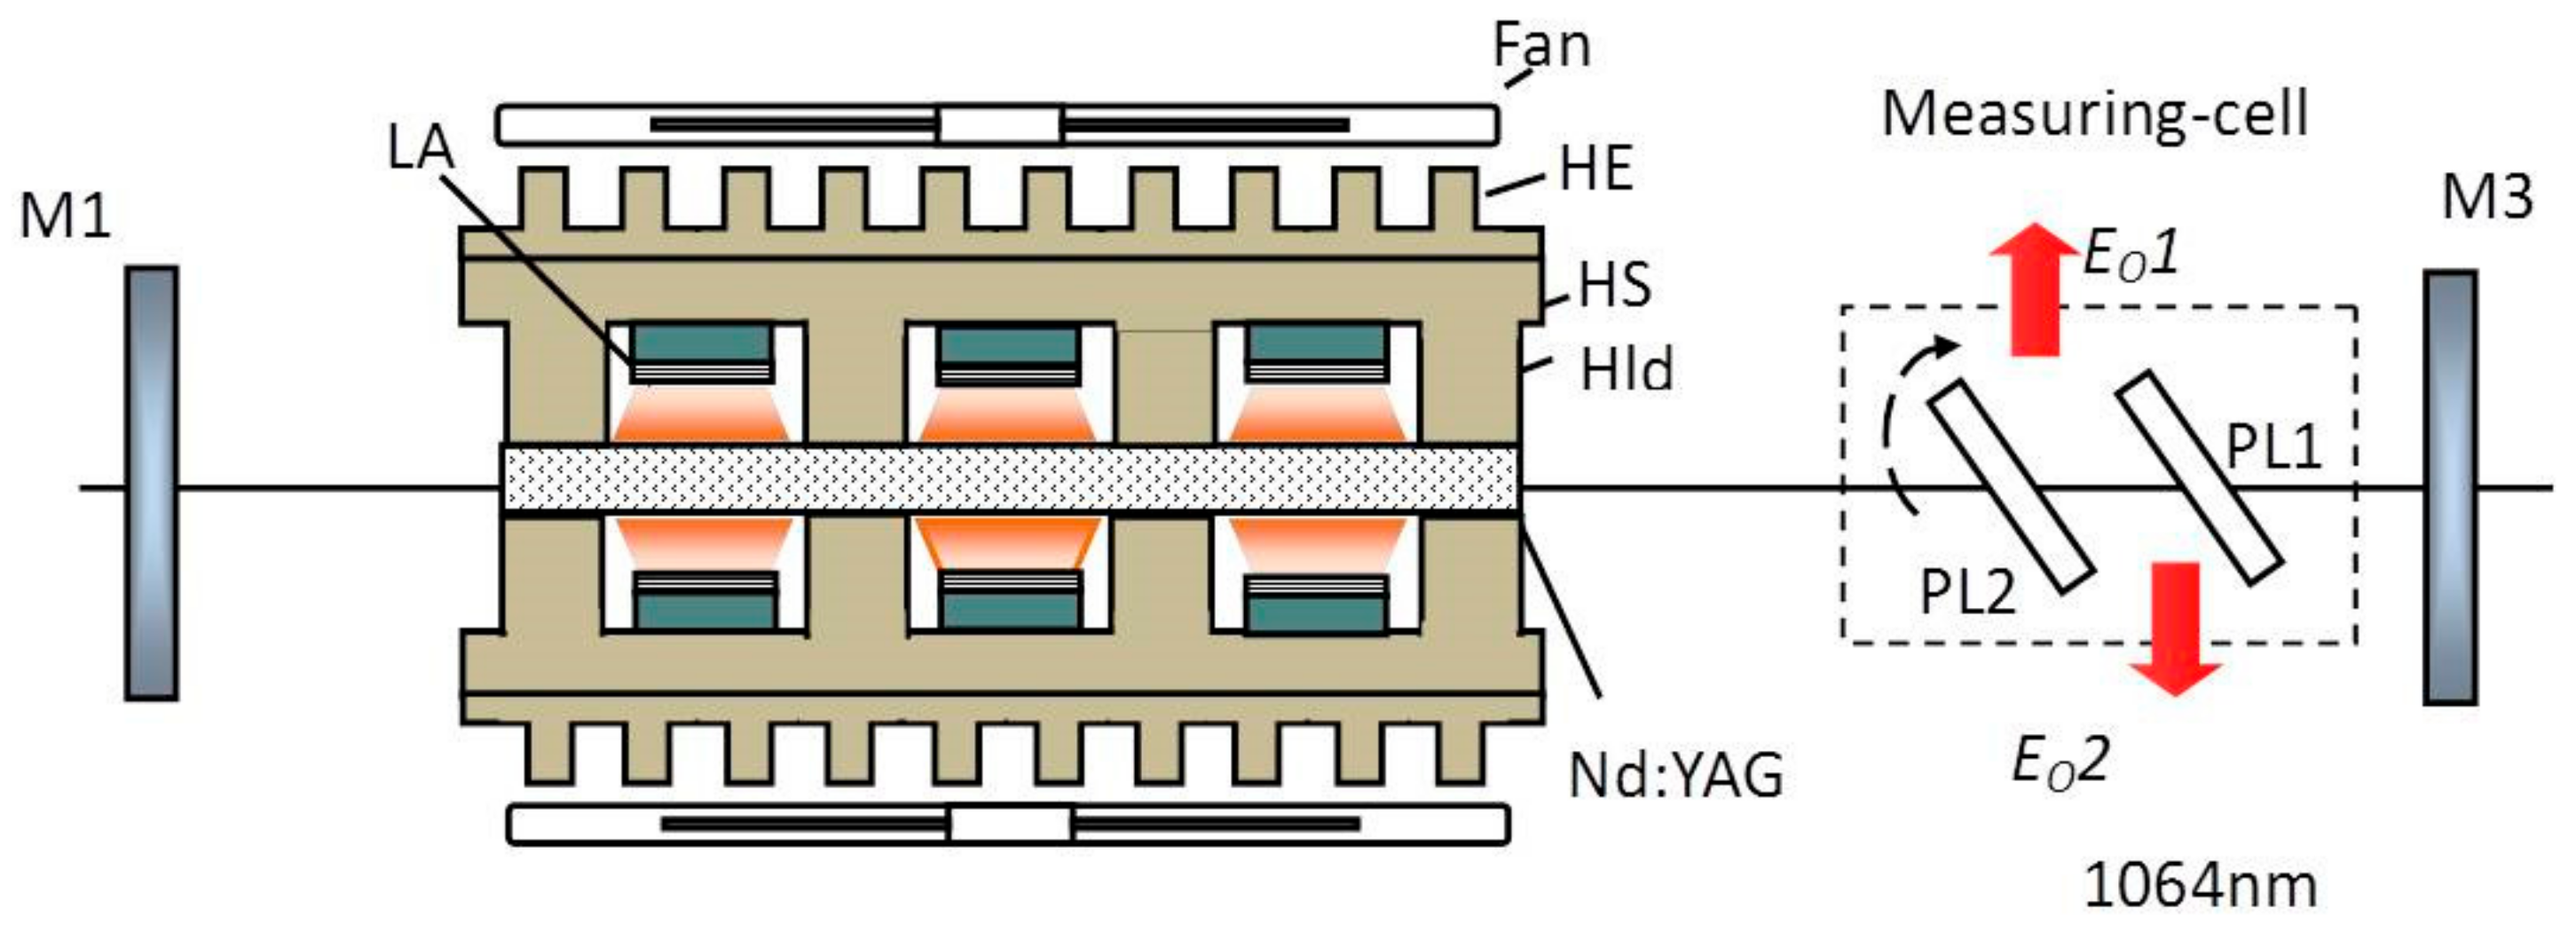
We performed online measurements of the internal parameters of a Nd:YAG solid-state laser employing the method of introducing variable polarization reflective loss. The experimental arrangement for the measurements is shown in
Figure 3. The laser outputs were recorded by an EPM2000 energy detector. We used a quasi-CW pump and an incident pump current of 45 A, which corresponds to single-pulse incident pump energy of 500 mJ. The results of the measurement of the parameters are listed in
Table 1.
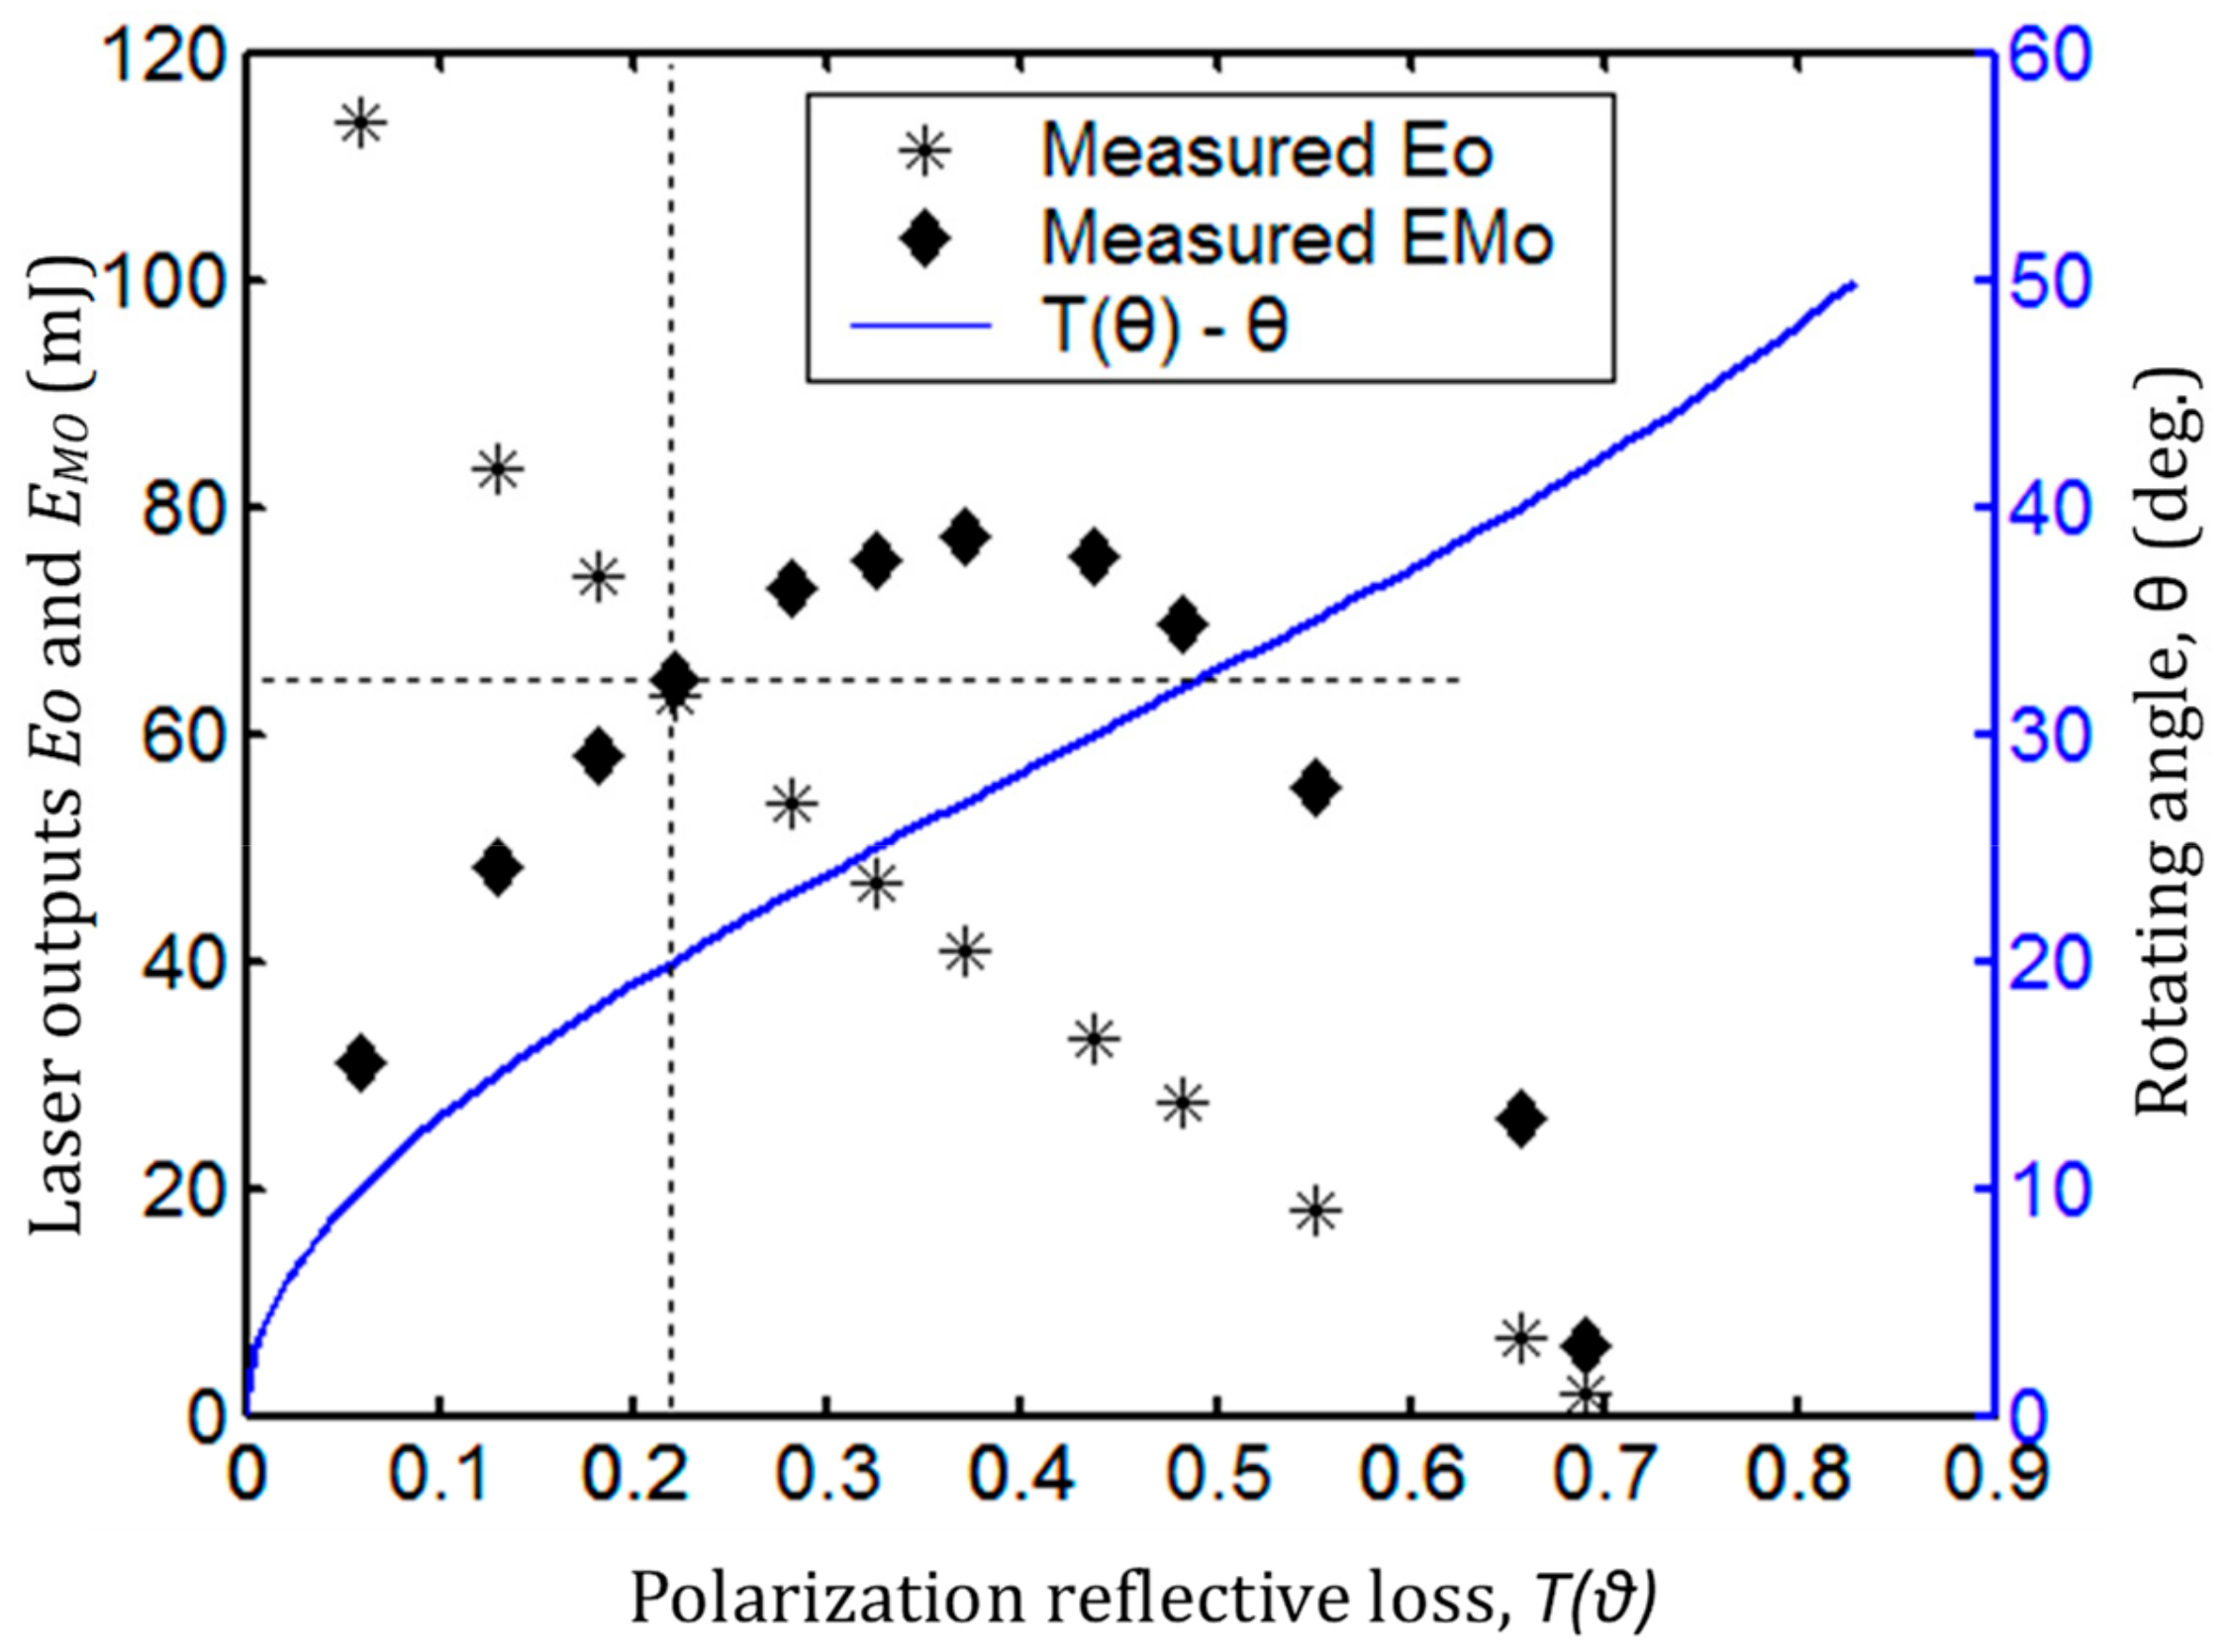
Under quasi-CW pumping, the recorded single-pulse outputs
from mirror M2 and
from the measurement cell as functions of the variable polarization reflective loss
and the polarization reflective loss
with respect to the rotating angle of
θ are illustrated in
Figure 6.
The laser outputs
and
have the same value of 63.5 mJ, which corresponds to a polarization reflective loss
of 21.65% as shown in
Figure 6. A transmittance
of mirror M2 of 22.45% is obtained by applying the measured
and calibrated
to Equation (14). Comparing the measured value of 22.45% with the calibrated transmittance value of 23.8% of mirror M2, the measurement error is around 1.35%.
Figure 6 shows that the curve of
T(
θ) has a linear zone from 20% to 60%, which corresponds to the rotating angle
θ from 20° to 38°. There is a nonlinear zone in the curve at
and a near oscillation stop zone (also a nonlinear zone in the curve) at
. Applying the transmittance
of 22.45% and the recorded outputs of
and
within the linear zone of the curve to Equation (13), the round-trip net optical loss
δ of 0.0336 was determined as shown in
Figure 7.
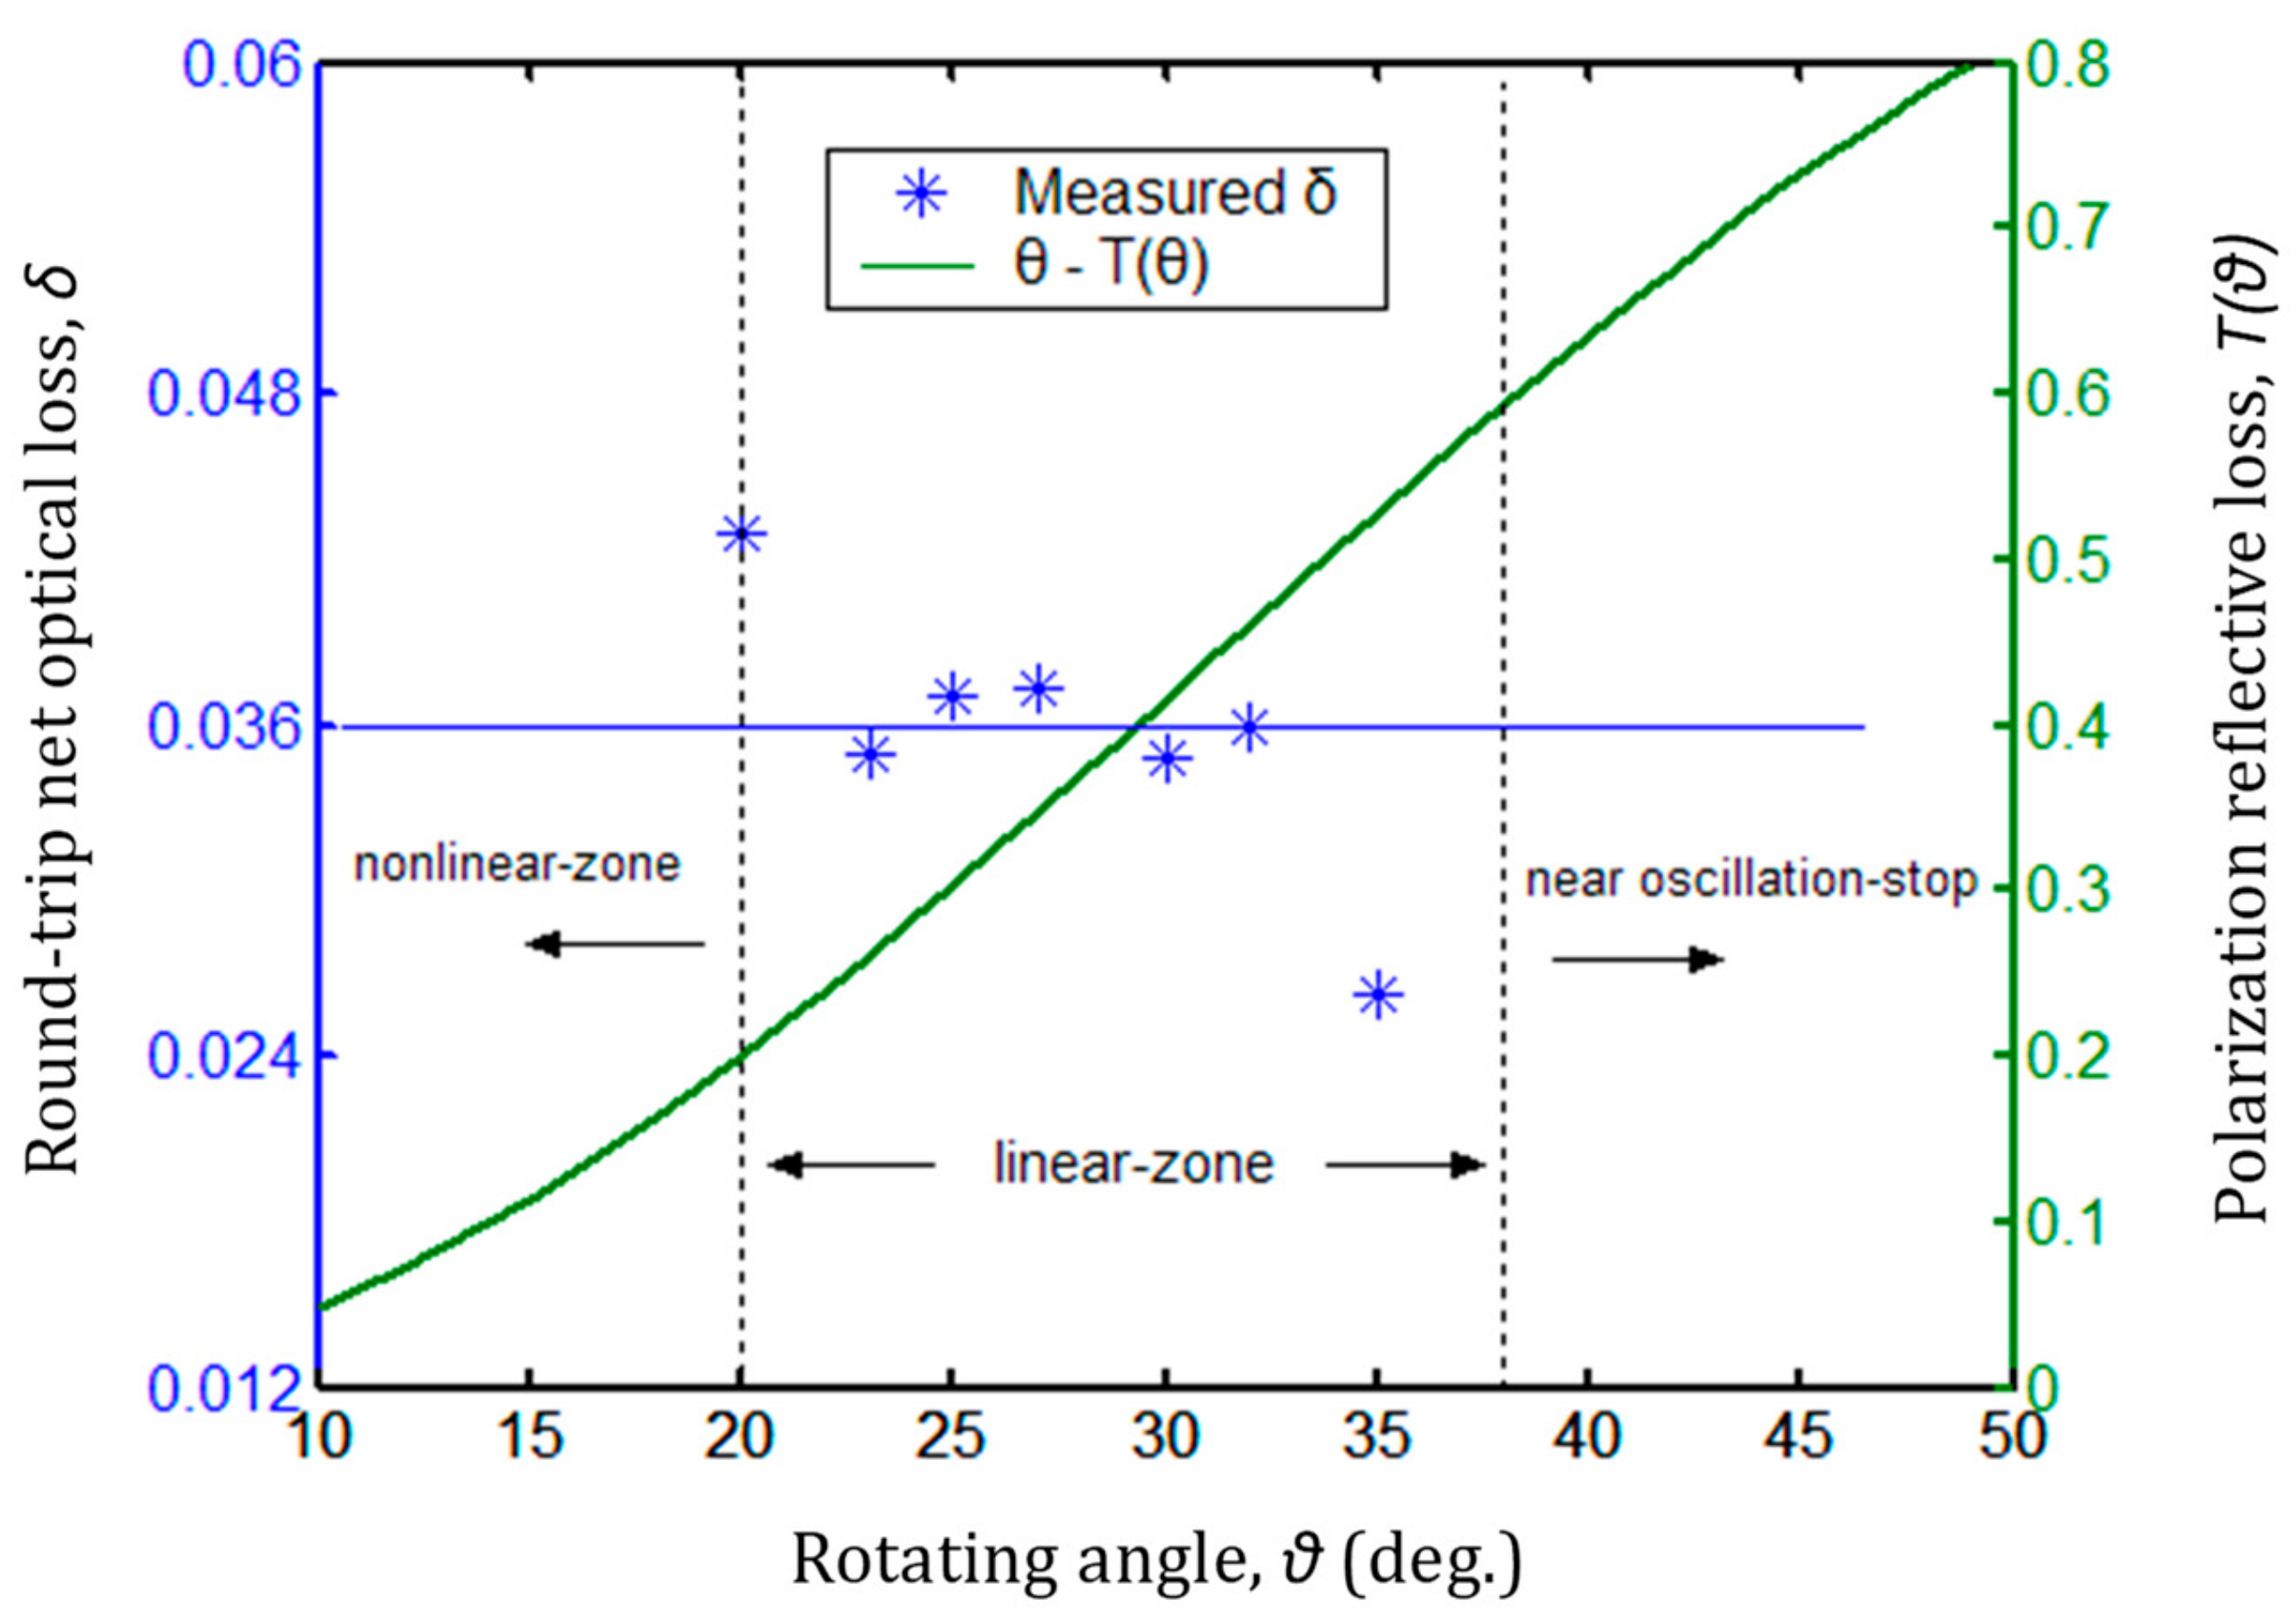
Figure 7 shows the measured round-trip net optical loss
δ as a function of the rotating angle
θ, and the rotating angle
θ with respect to the polarization reflective loss
T(
θ). The measured data of
δ have a better convergence at the fitted-data value of 0.0336 between the rotating angles
θ of 23° and 32° and some divergence at the values of 0.043 and 0.0262 corresponding to the rotating angles of 20° and 35°, which are near the nonlinear region and the oscillation stop zone, respectively. In the nonlinear region, the indication error of the measurement cell is the main factor in the measurement of
δ. In the near oscillation stop zone, the measurement error of
is the main factor due to the unstable output of the laser.
The absorption coefficient of the laser crystal of 0.0028 cm−1, obtained by applying the fitted-data value of 0.0336 to Equation (8), falls within the scope of the Nd:YAG datasheet values and thus has a better agreement with the values in the datasheet. The total optical loss of 0.2611 was determined by applying the results of and to Equation (18).
Upon rotating PL2 to make the laser just cease to oscillate, an oscillation-stop of about 43° was recorded. Applying the measurement results of and and the calibrated to Equation (17) and Equation (16), the small-signal gain coefficient of 0.1993 cm−1 was obtained.
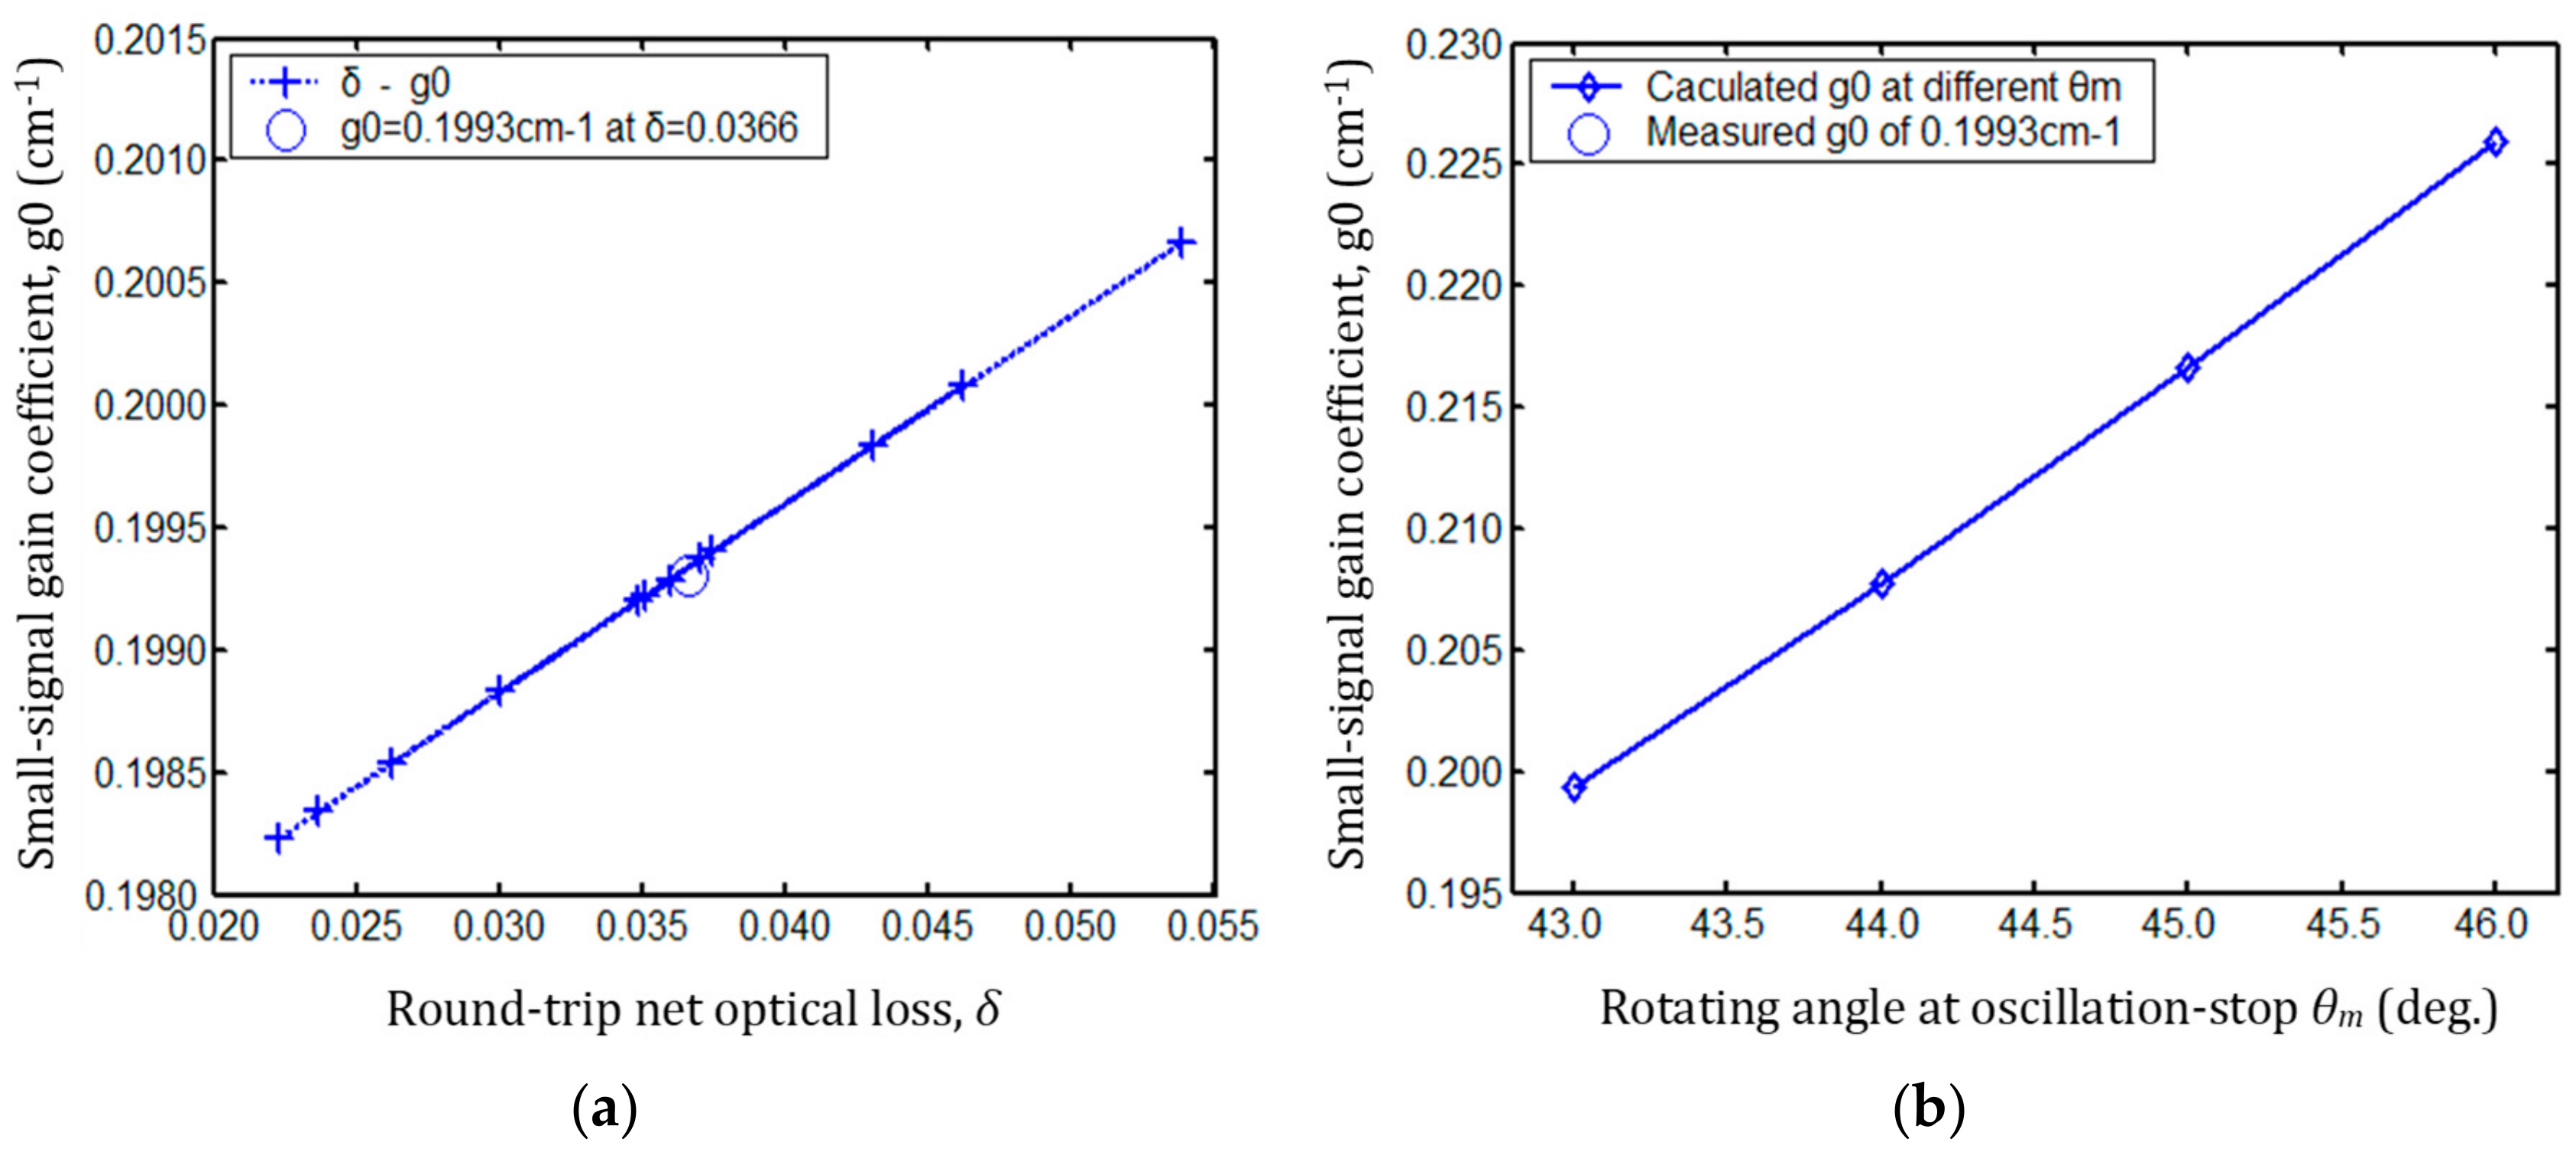
The influence of the measured errors of
δ on the small-signal gain coefficient
was investigated.
Figure 8a illustrates the small-signal gain coefficient
with respect to different values of
δ. The measured
is 0.1993 cm
−1 at the fitted-data value
δ of 0.0366, and the maximum deviation of
is less than 1.7‰. Therefore, the measurement of
, influenced by the measured deviation of
δ, must be ignored in a high pump power laser. We also investigated the influence of the measurement errors of the oscillation-stop angle
on the measurement of
. The maximum measured deviation of
produced by a rotating angle error of approximately 1° is less than 1% as shown in
Figure 8b. Thus, the accuracy of the measurement cell meets the measurement requirement of
.
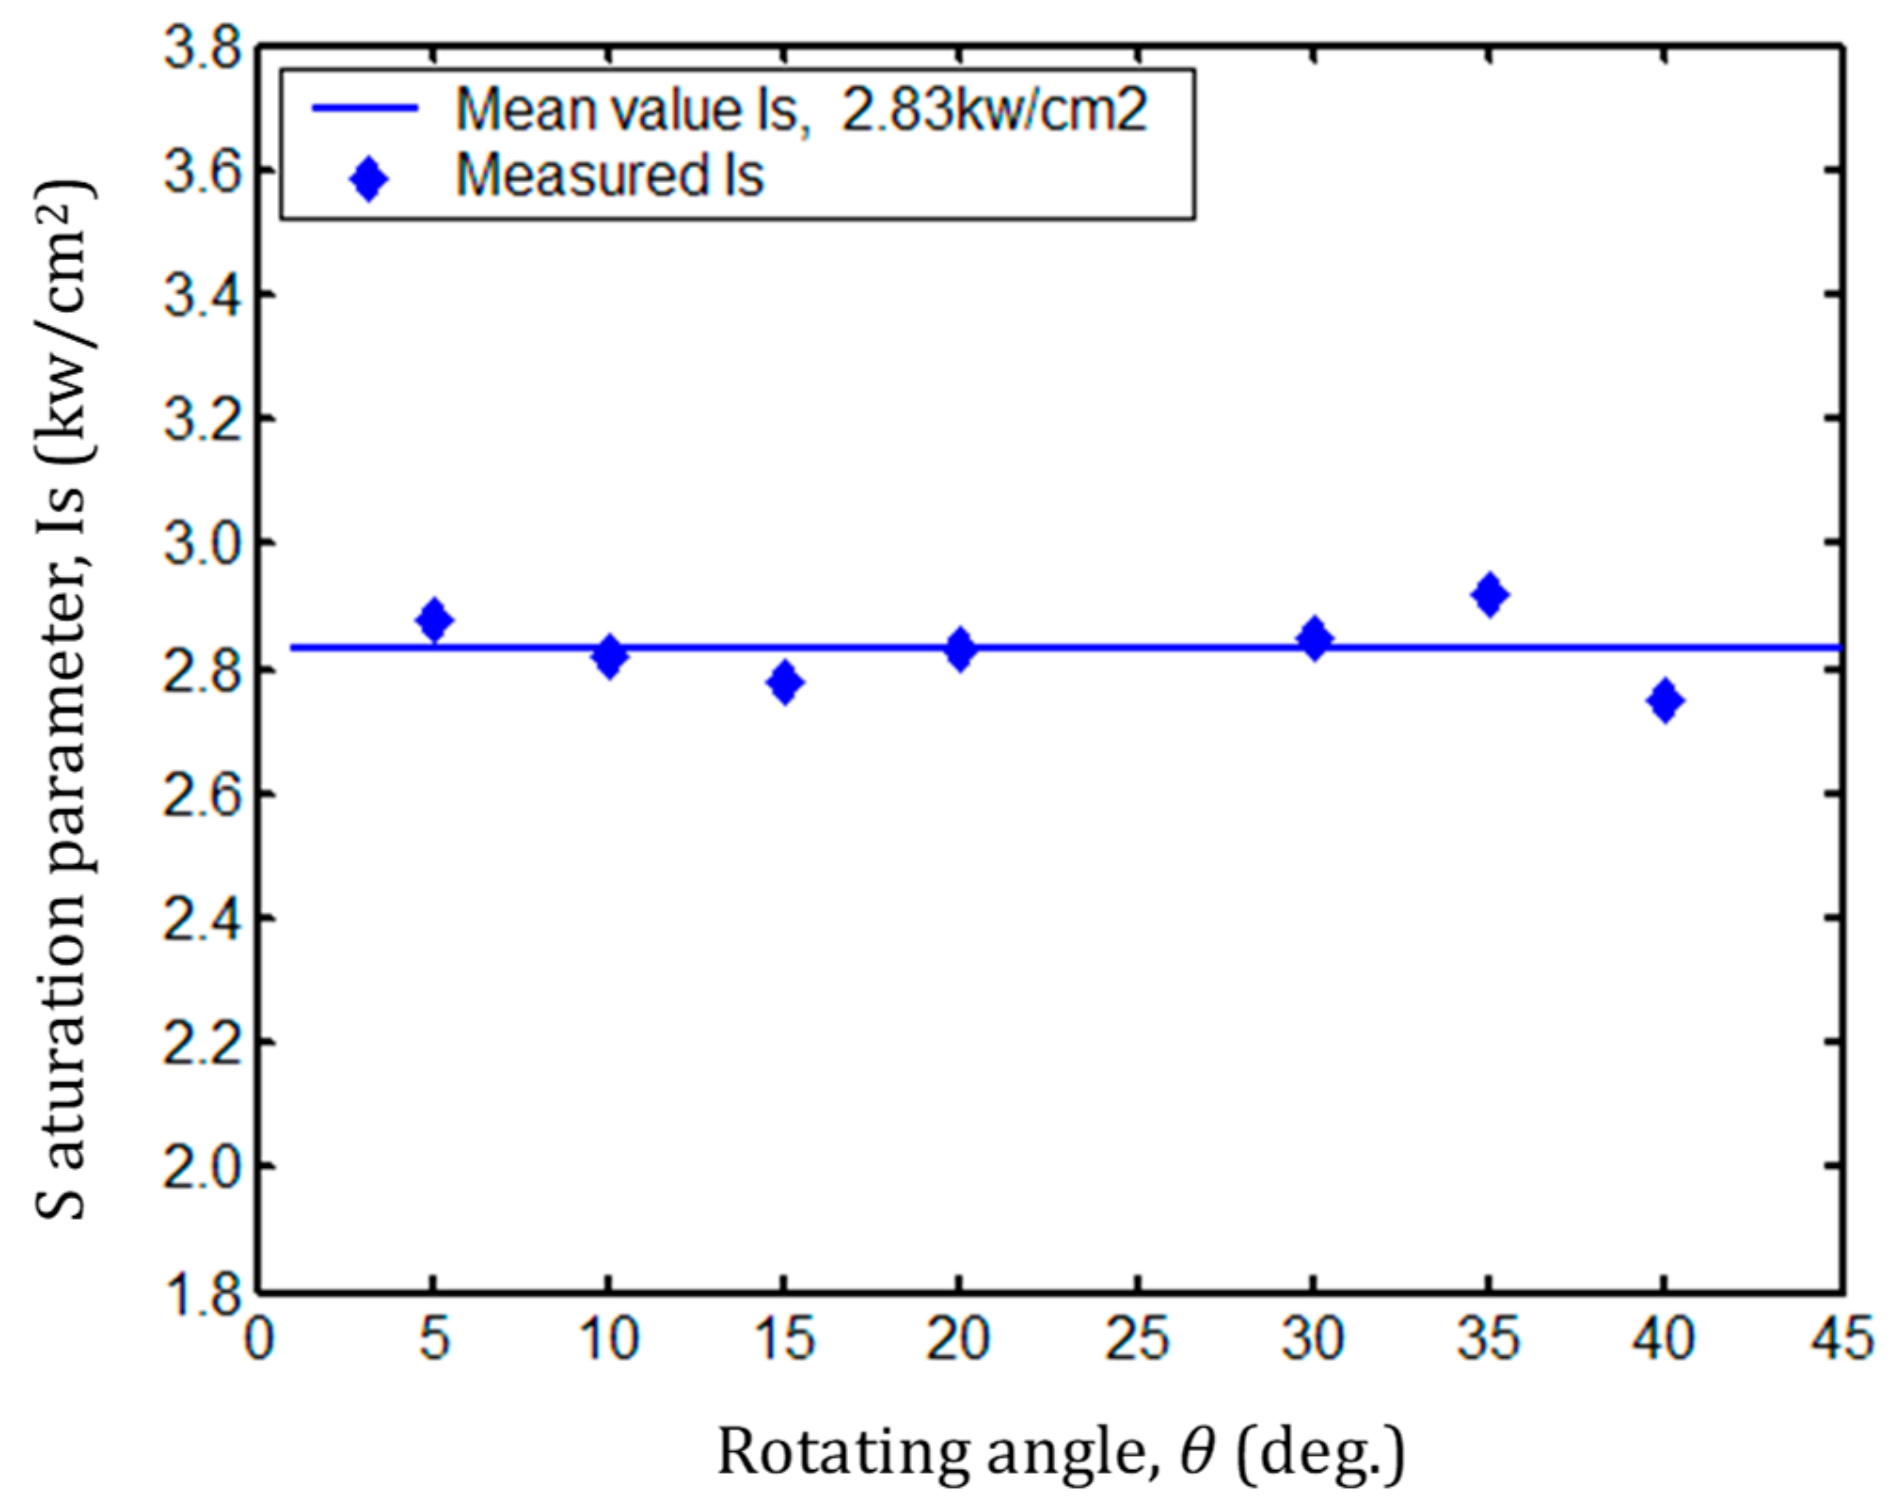
Applying the measurement results of
,
and
to Equations (10) and (11), the saturation parameter
of 2.83 kW/cm
2 was determined. The saturation parameter
as a function of the rotating angle
θ of the measurement cell is shown in
Figure 9. The measured
has a minor fluctuation around the mean value of 2.83 kW/cm
2 as the rotating angle
θ varies from 5° to 40°. The maximum difference in measured
was calculated to be approximately 0.2 kW/cm
2 with an oscillation wavelength of 1064 nm and at a room temperature of 25 °C. For a homogeneously broadened four-level system that employs the Nd:YAG active medium, the saturation parameter
is given by [
13] as
. The saturation parameter is only a function of the transmission cross-section
, the laser transmission frequency
, and the fluorescence lifetime
between the laser transmission levels. Therefore, the saturation parameter
Is will remain a constant value as the intra-cavity loss varies. The saturation parameter value obtained in our experiments agrees with the theoretical value of 2.9 kW/cm
2 in the data sheets.
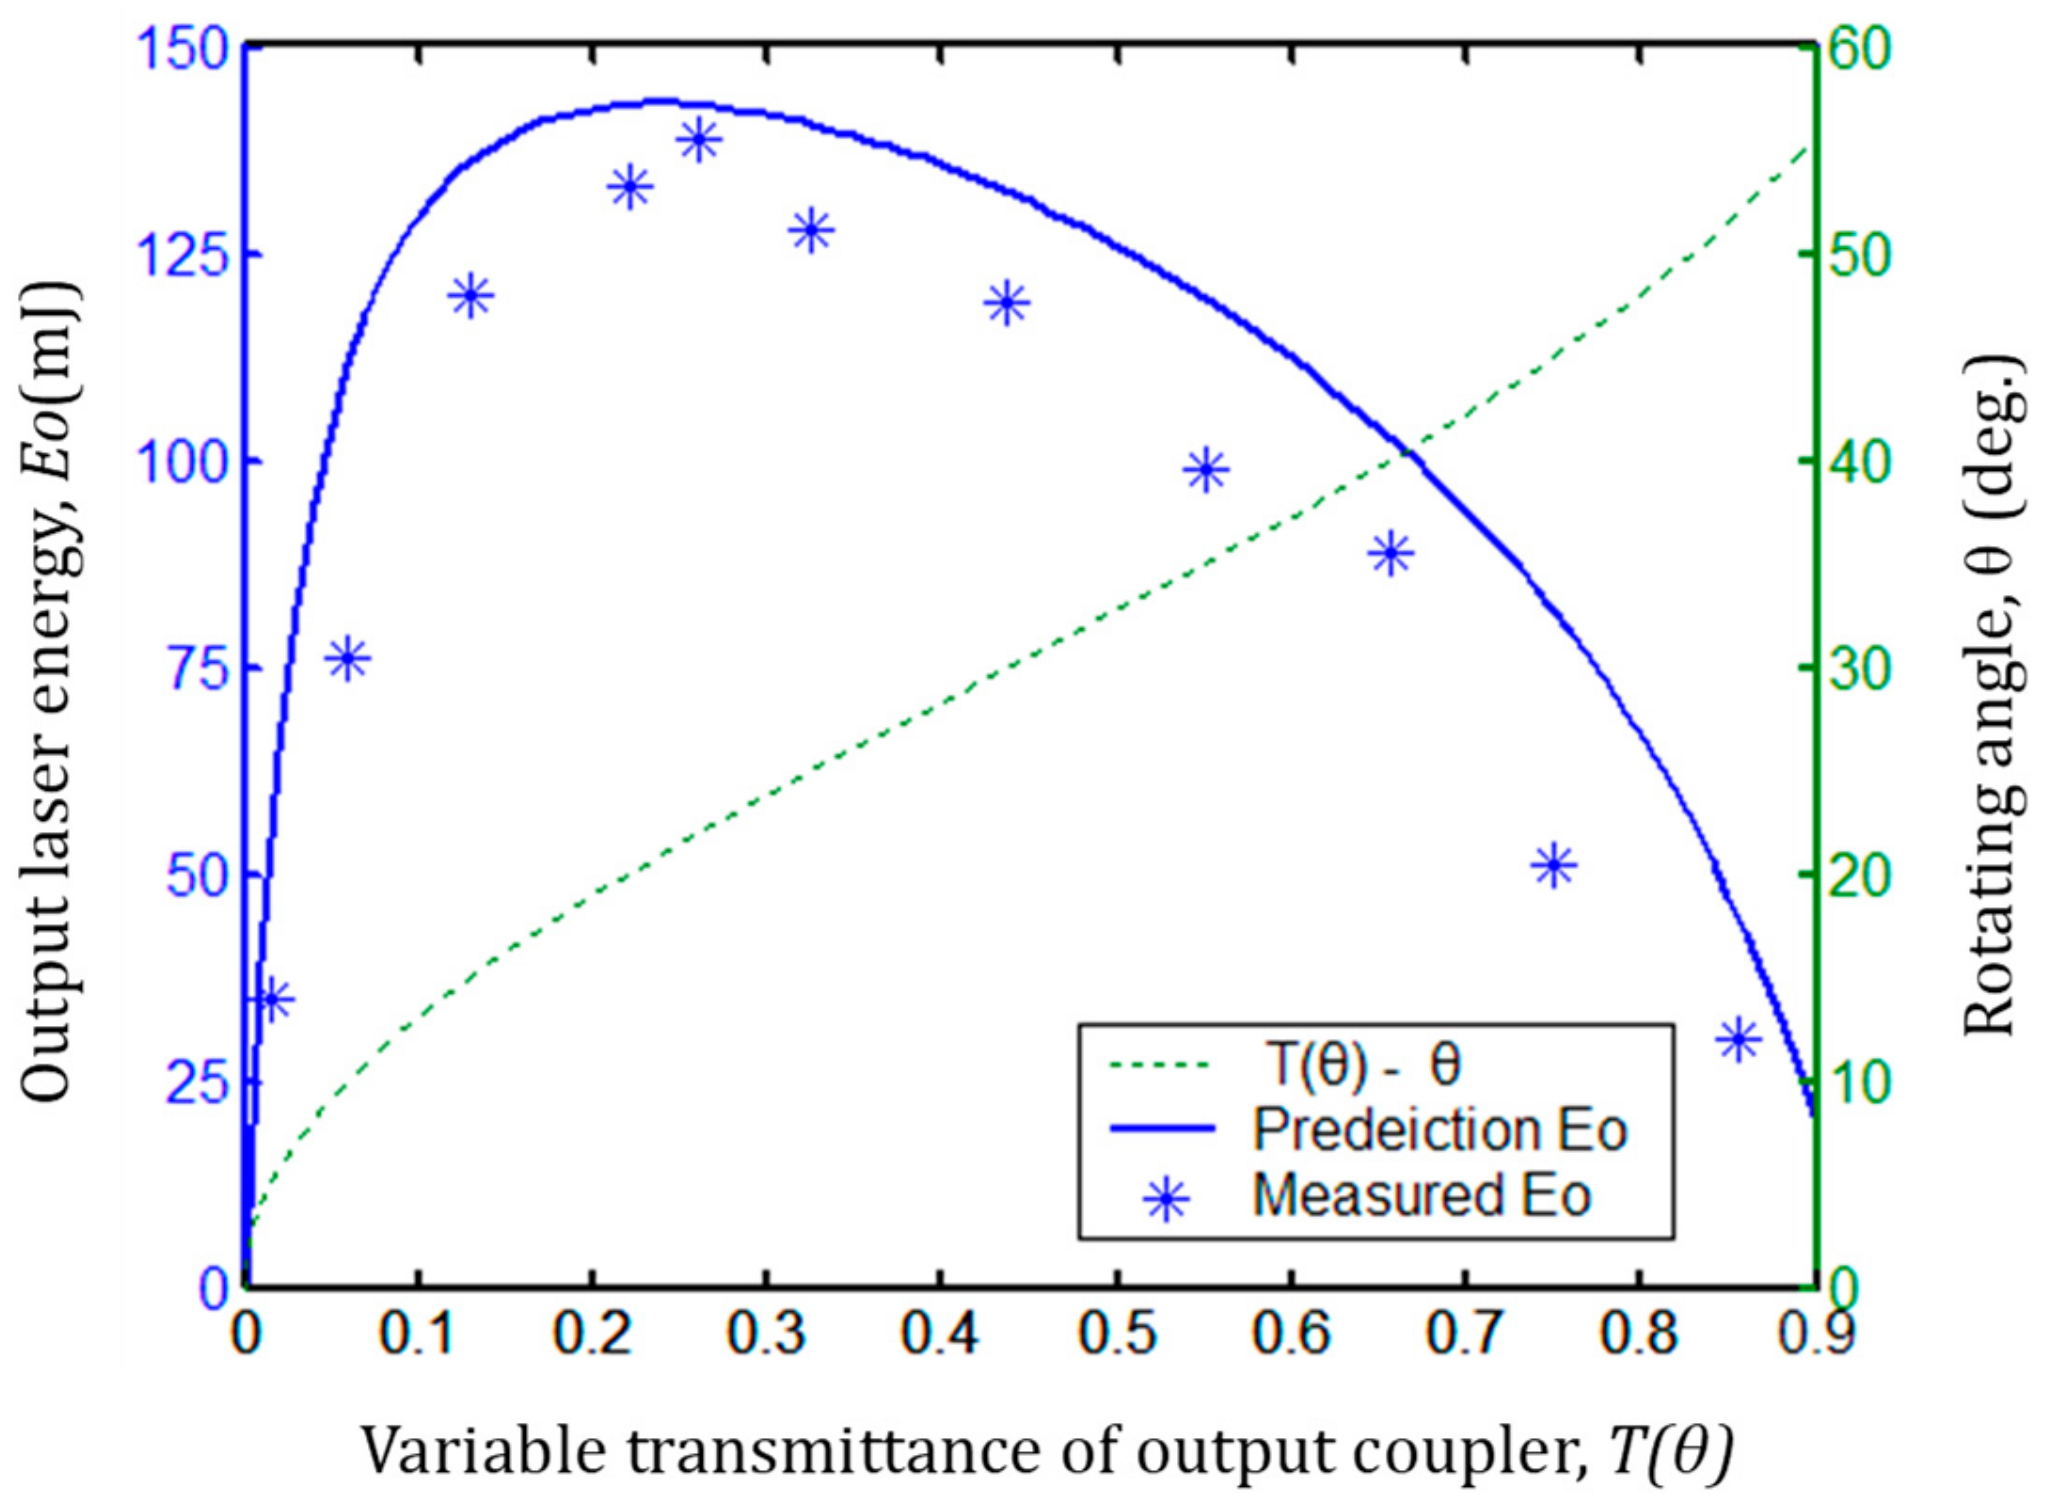
A validity investigation is usually done by comparing the laser output experimental data with the predictions of a suitable laser model using the measurement results of gain, losses, and the saturation parameter. Thus, a laser output energy curve, which is obtained by applying the results of
, δ, and
in
Table 1 to Equation (19), was compared with the experimental outputs of
recorded by a laser energy meter to justify the measurement method as shown in
Figure 10. The experimental setup is shown in
Figure 5.
Figure 10 shows the predicted output curve of
and the single-pulse output energy of
recorded by an EPM2000 energy meter as functions of the variable transmittances
T(
θ) of the output coupler and the variable transmittances
T(
θ) with respect to the rotating angle
θ. Although the measured values of
are slightly smaller than the values in predicted output curve, the measured values of
are, overall, in good agreement with the predicted output curve of
. The minimum measurable value of the energy detector was about 1.5 mJ in our measurements, which will result in smaller measured values of the oscillation-stop angle
and the small-signal gain coefficient
. Therefore, the reason for the smaller measured value of
is the detection sensitivity of the energy meter detector. We optimized the transmittance of the coupling output mirror according to the experimental arrangement in
Figure 5 as well. An optimum transmittance
of 25% from the predicted output curve and 26% from the measured output of
were obtained at the incident pump energy of 500 mJ, which correspond to single-pulse output energies of 143 mJ and 139 mJ, respectively. The error of the optimum transmittance
was about 1%.
The experimental investigation verifies that the measurement cell has efficiently evaluated the internal parameters of the Nd:YAG laser.


