Analysis and Design of Helmholtz Protector to Improve High-Frequency Response of Insert Earphone


Abstract
:1. Introduction
2. Analysis Method
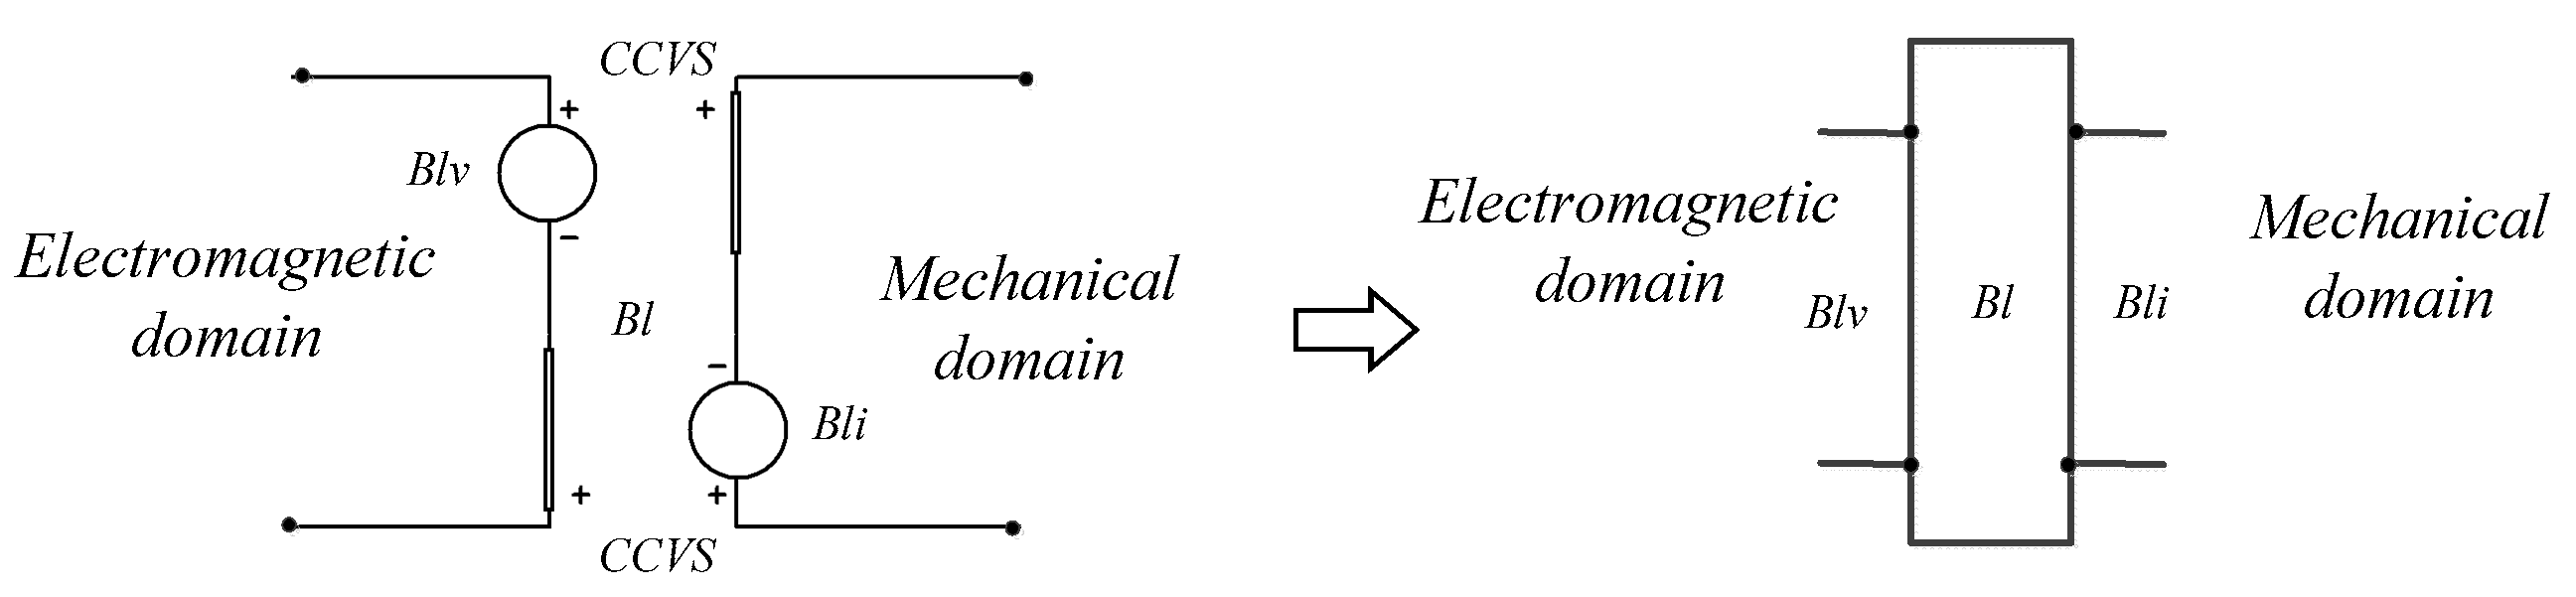
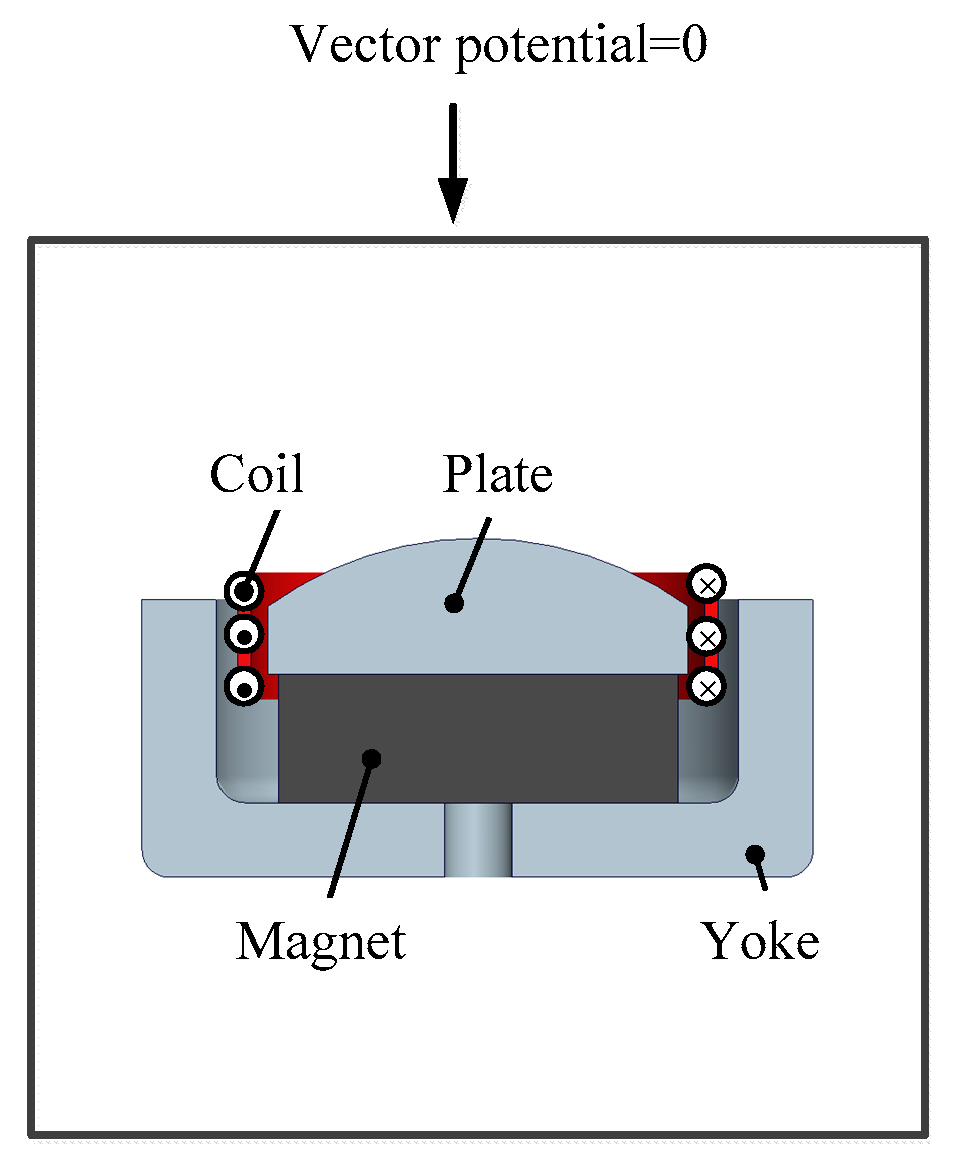
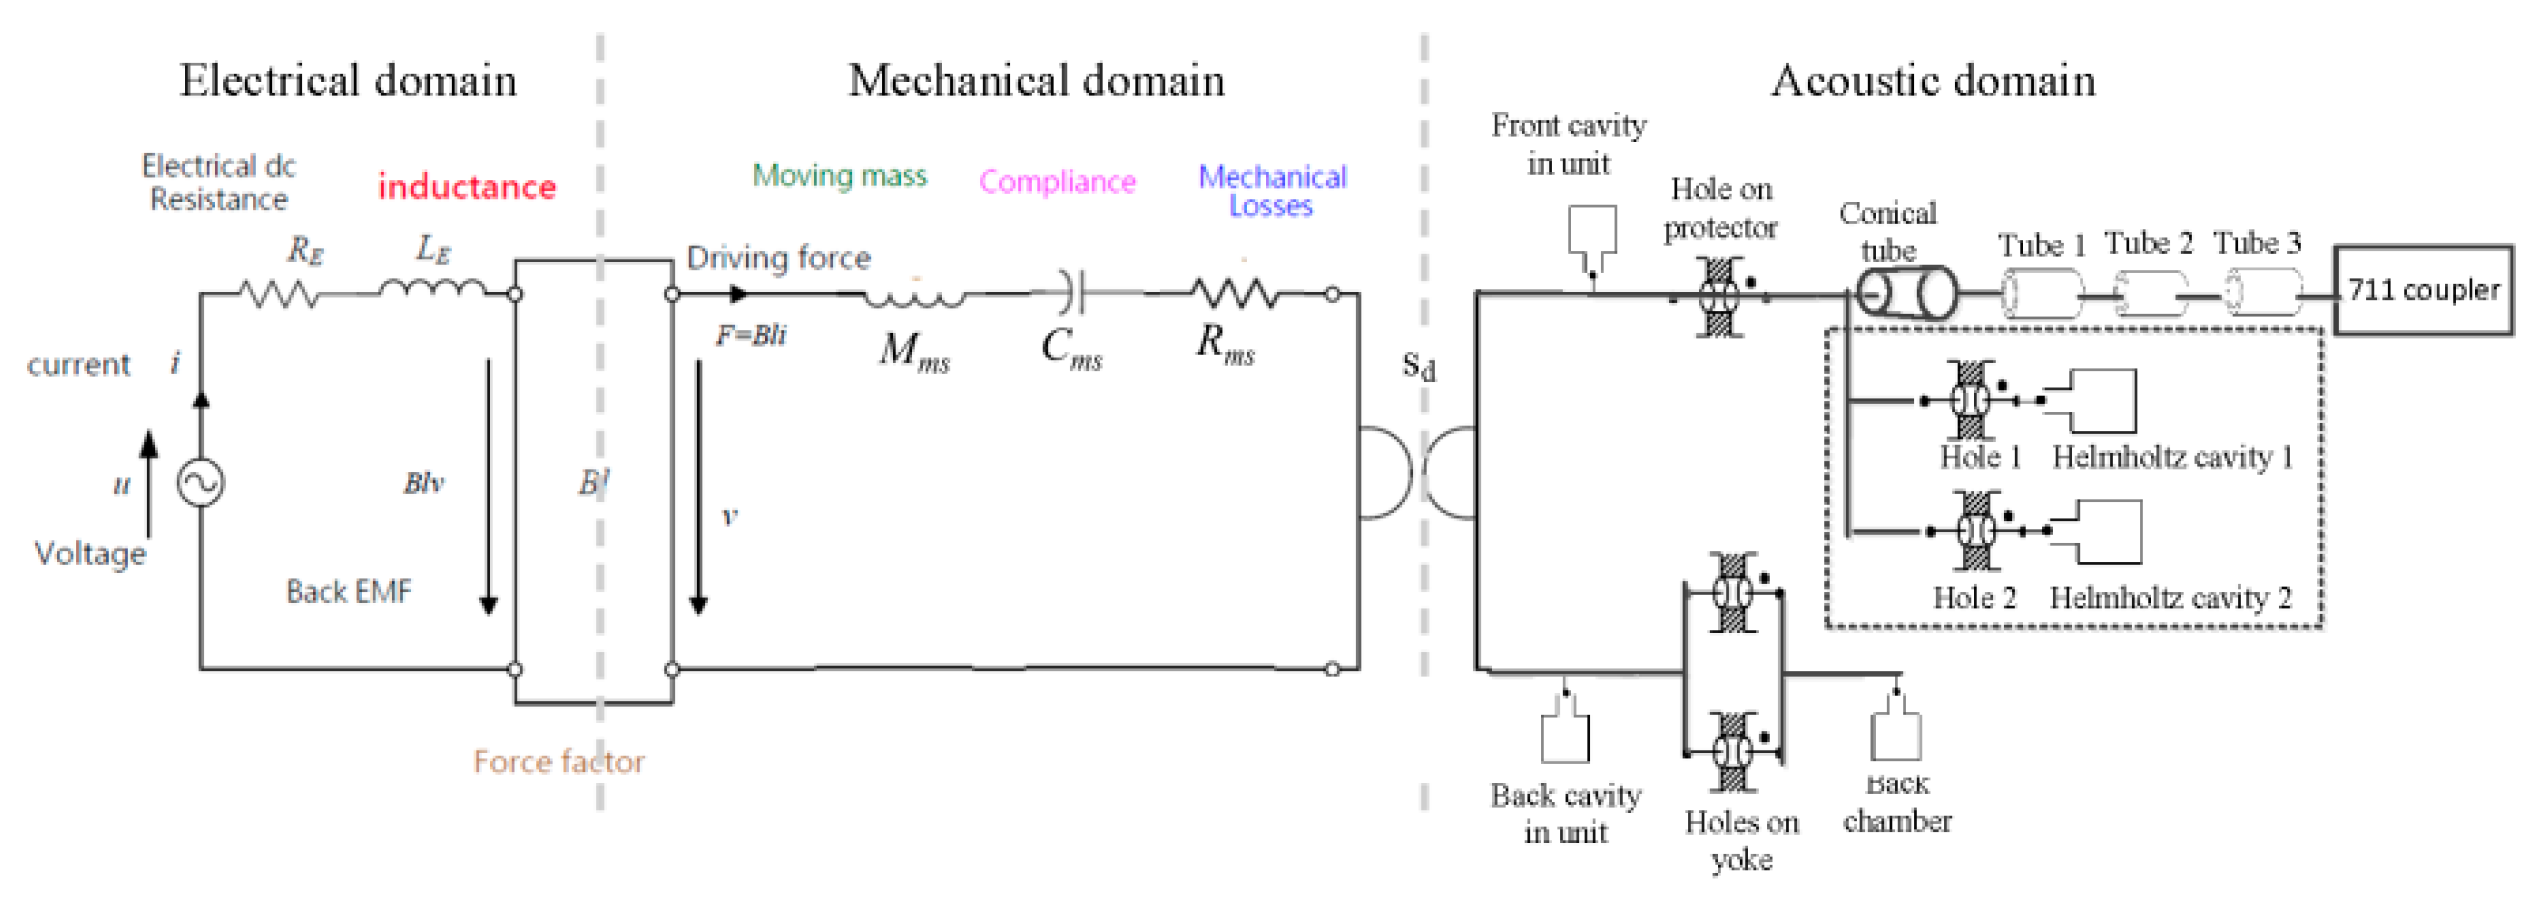
2.1. Electromagnetic Modeling
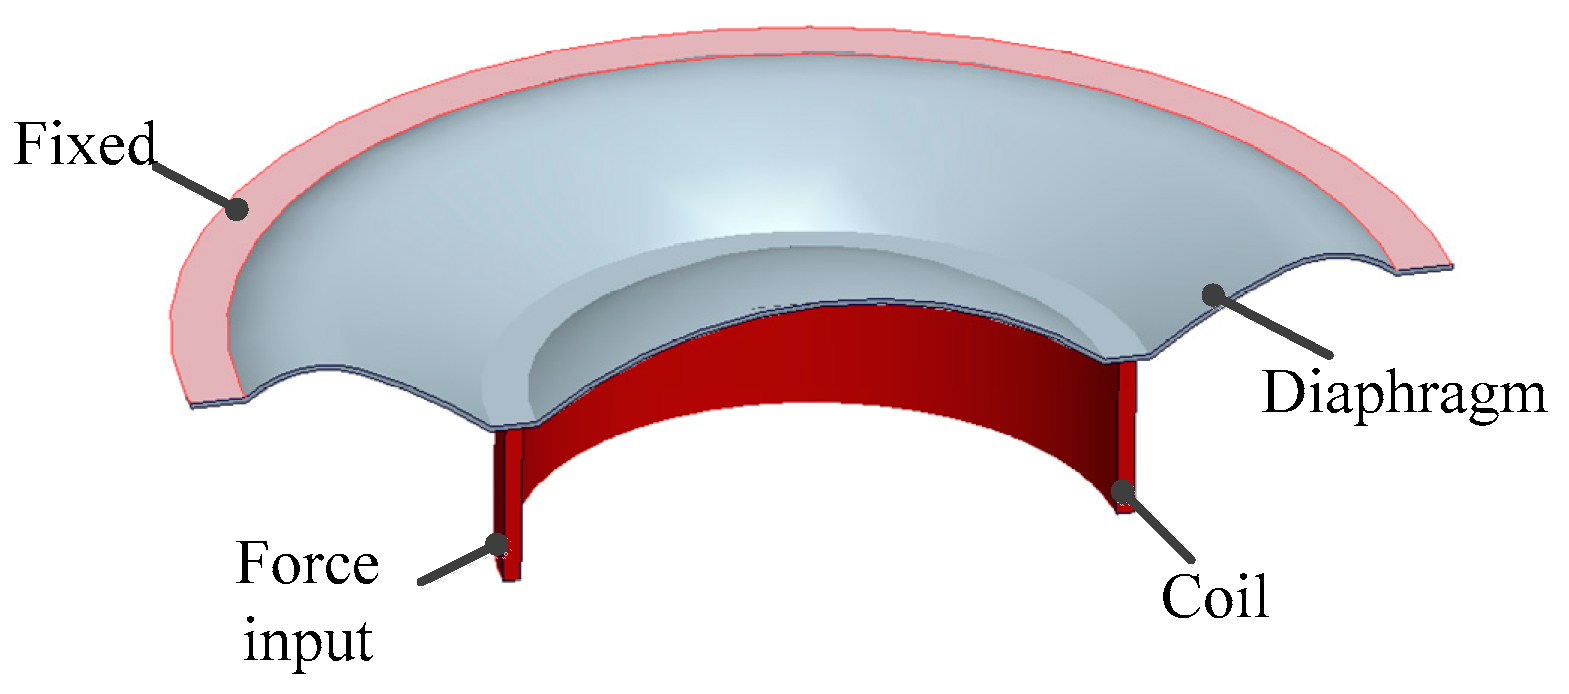
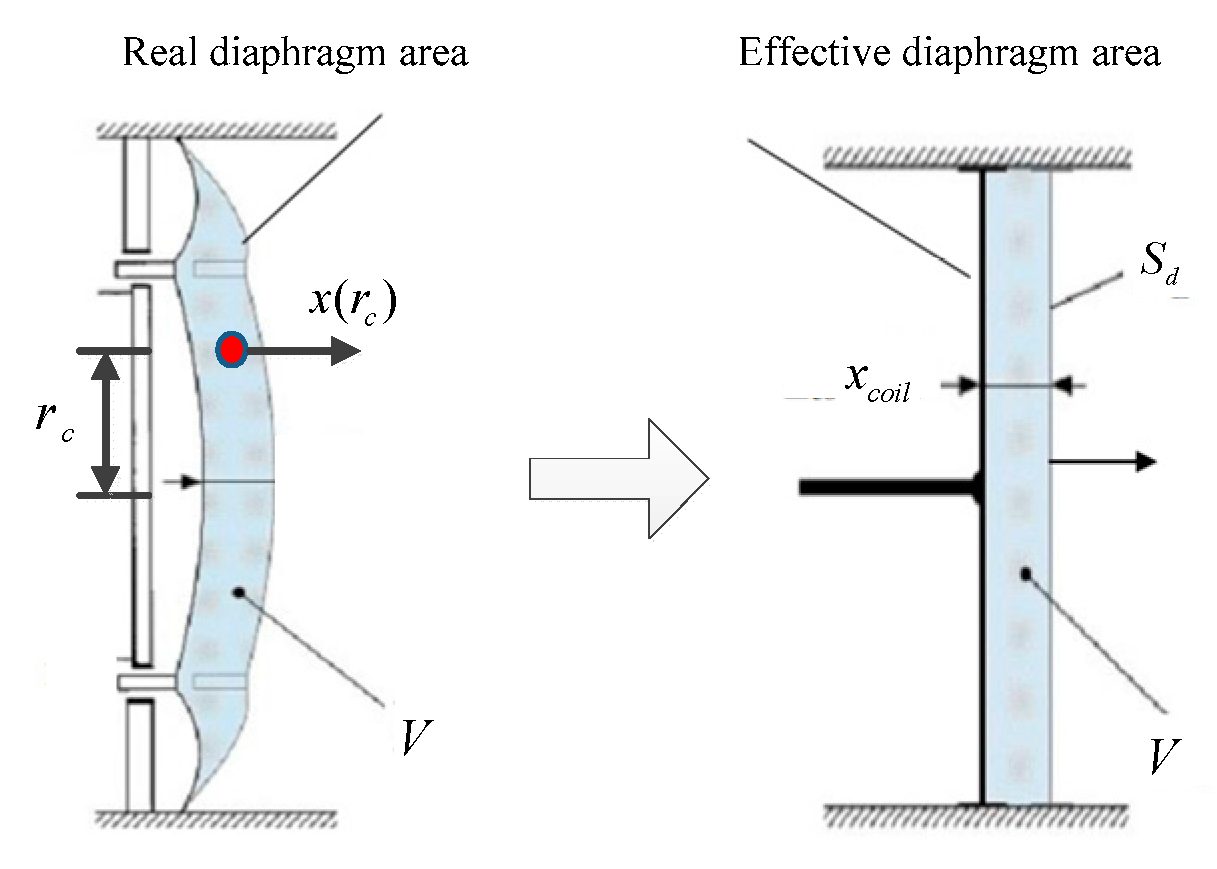
2.2. Mechanical Modeling
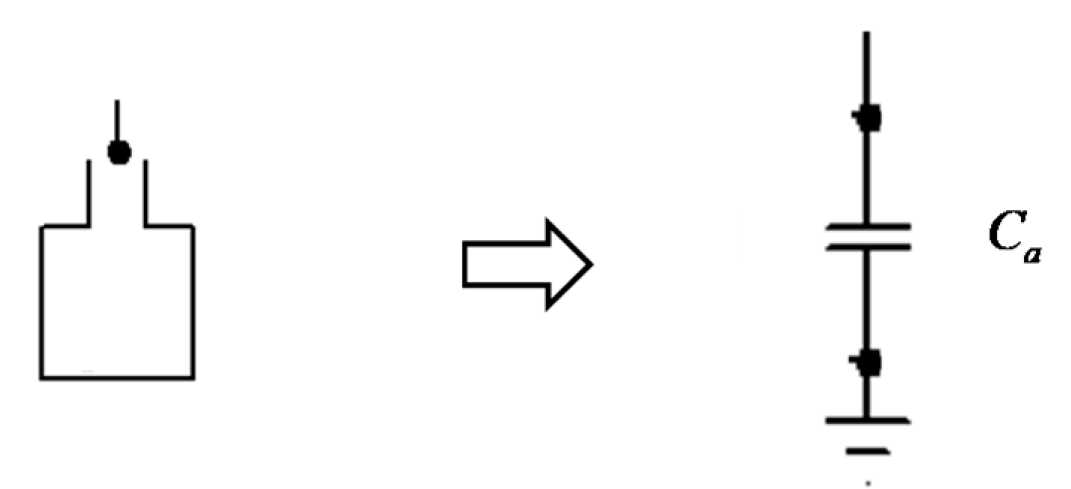
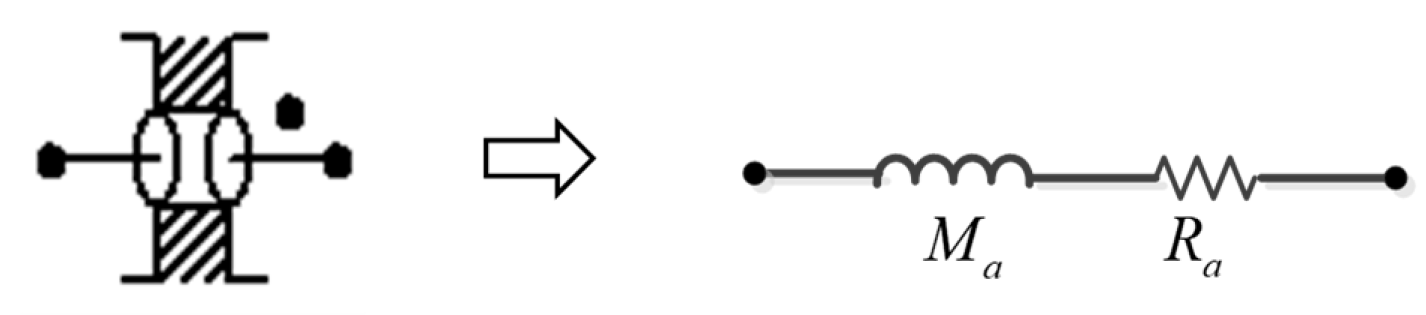
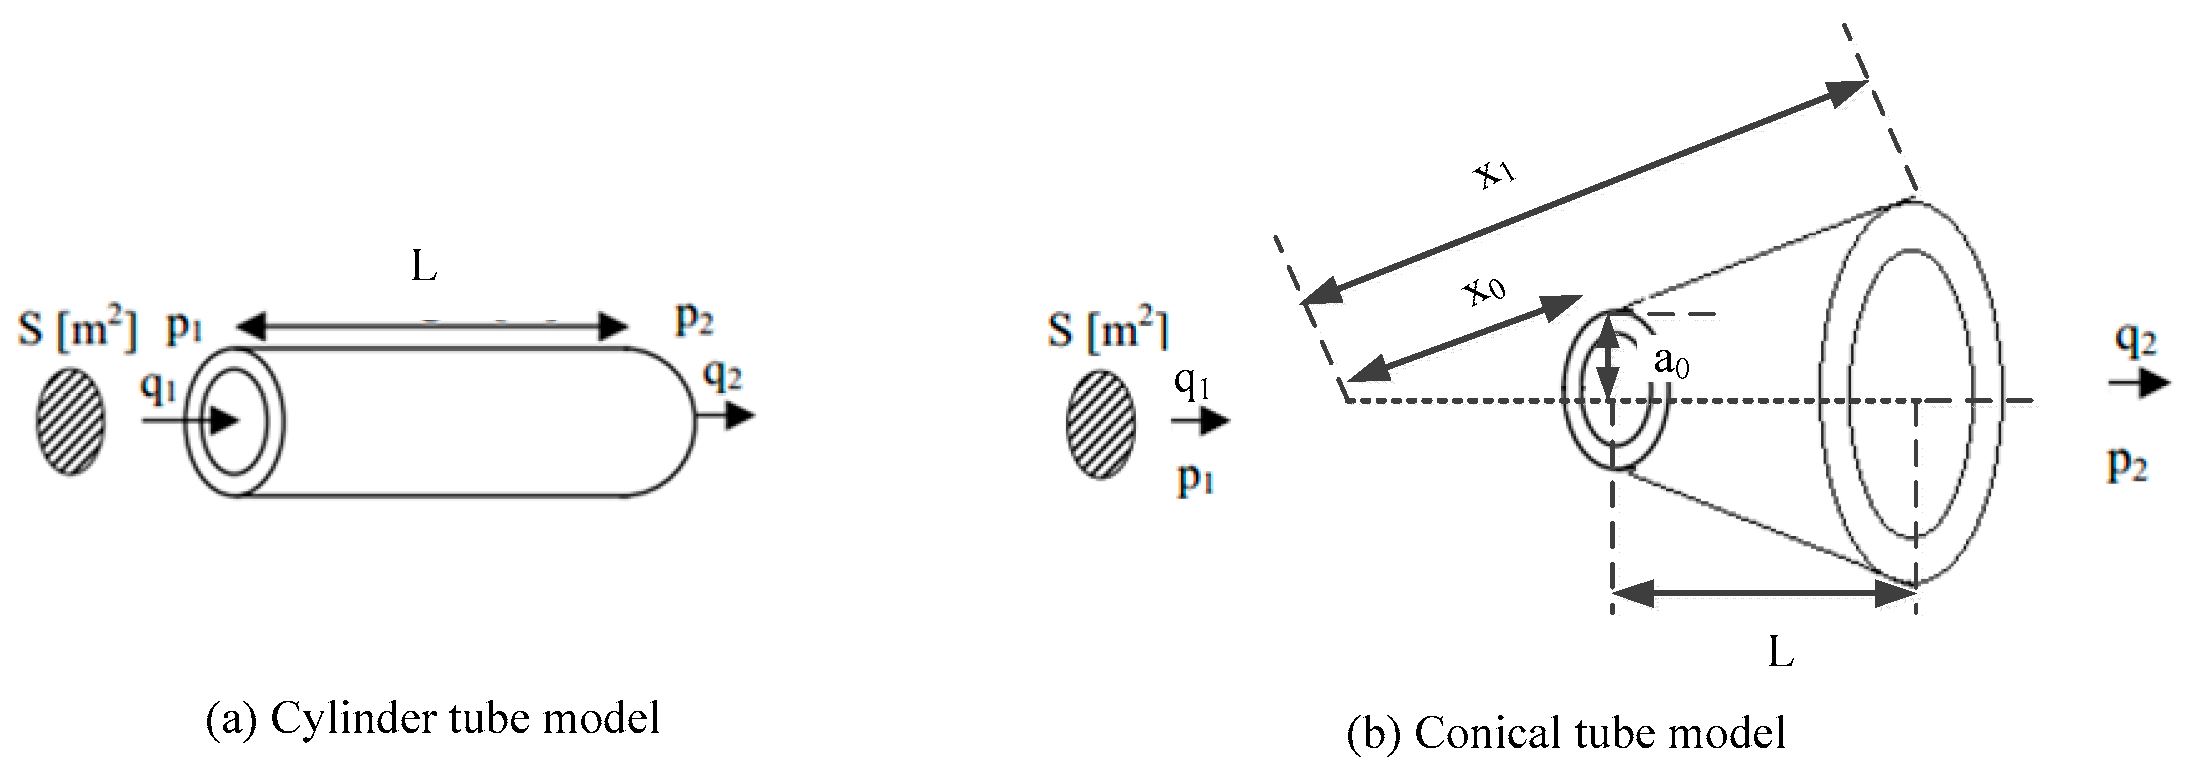
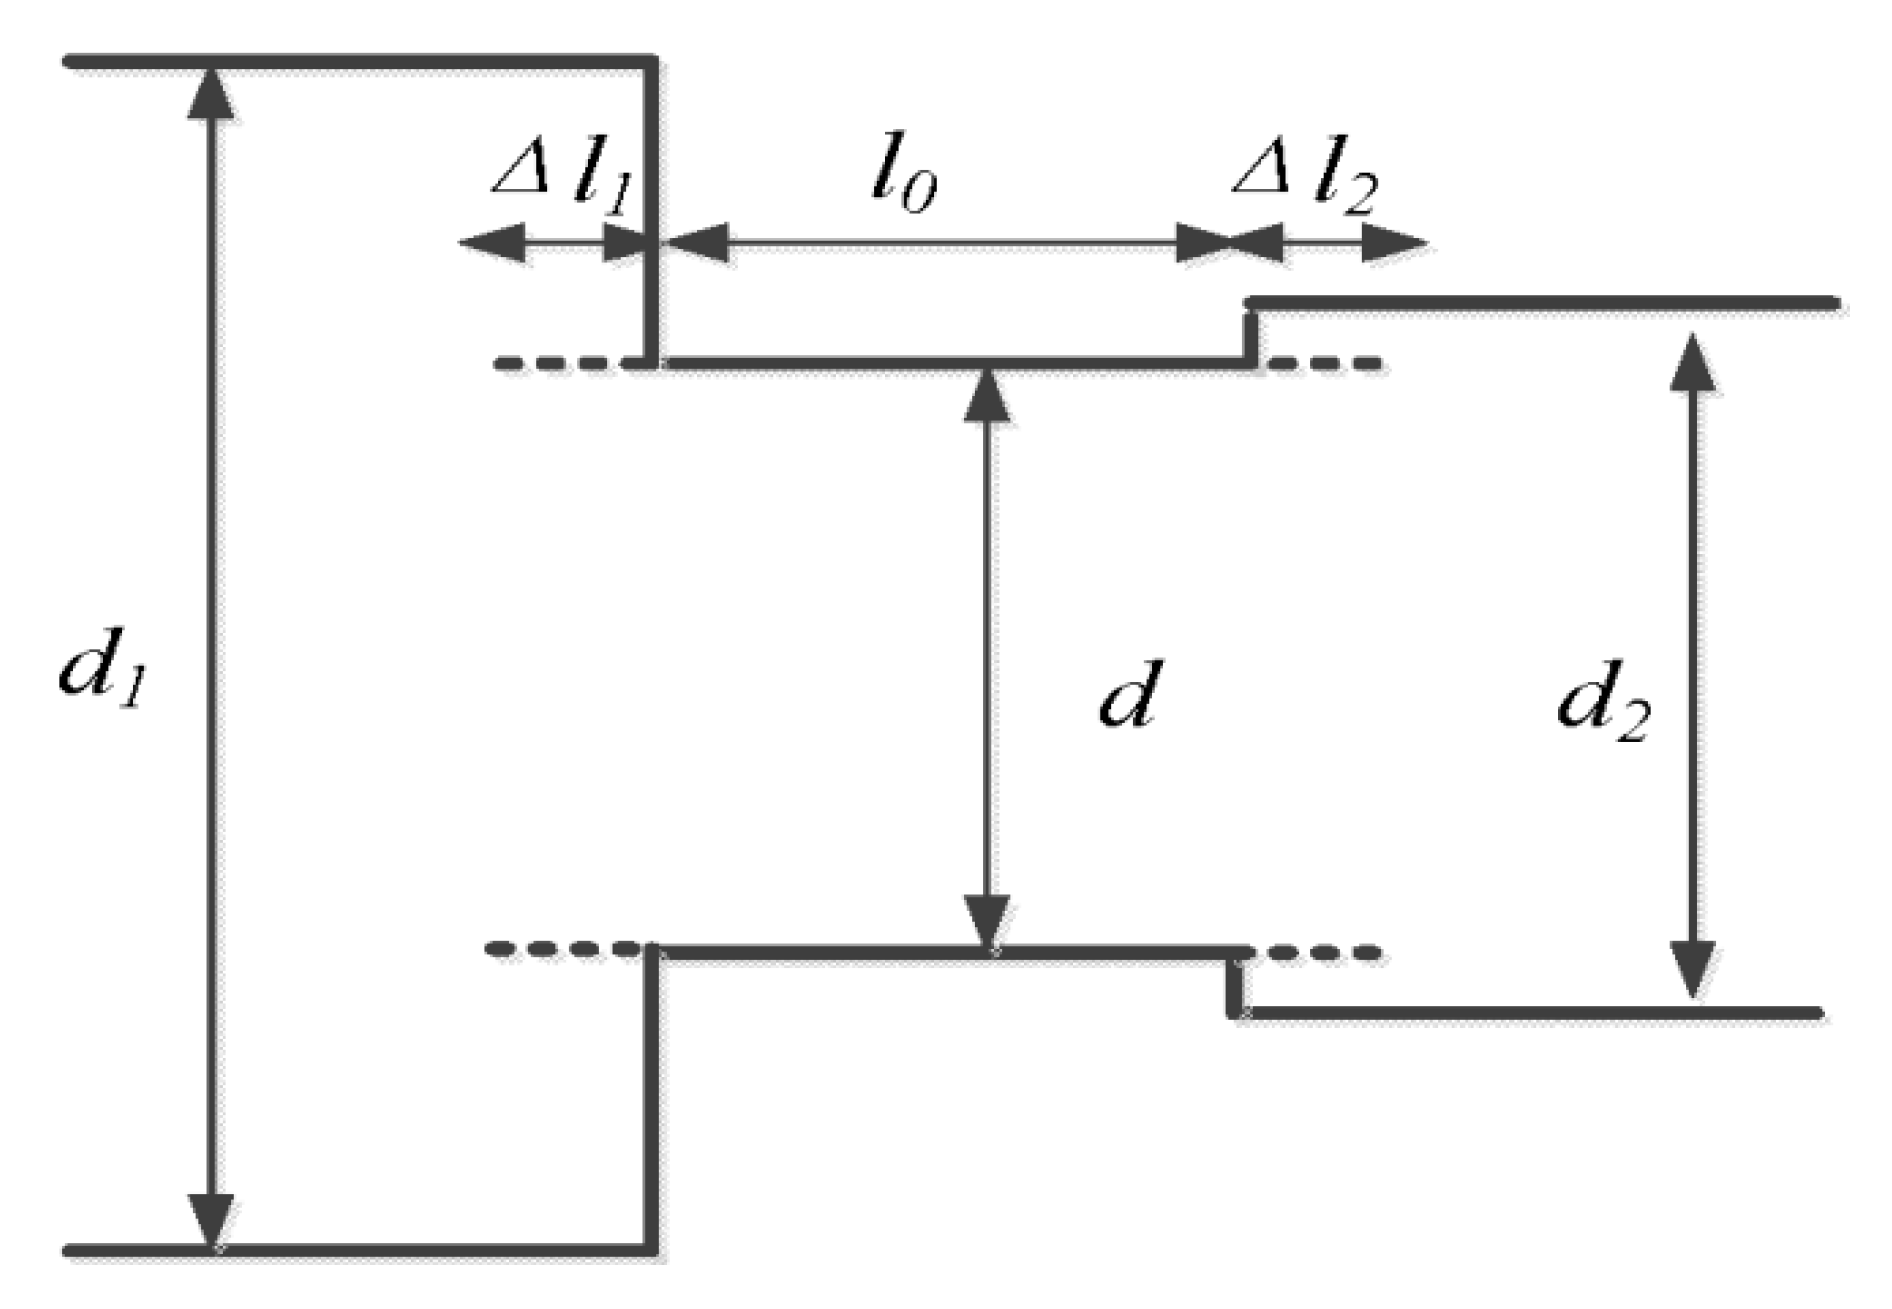
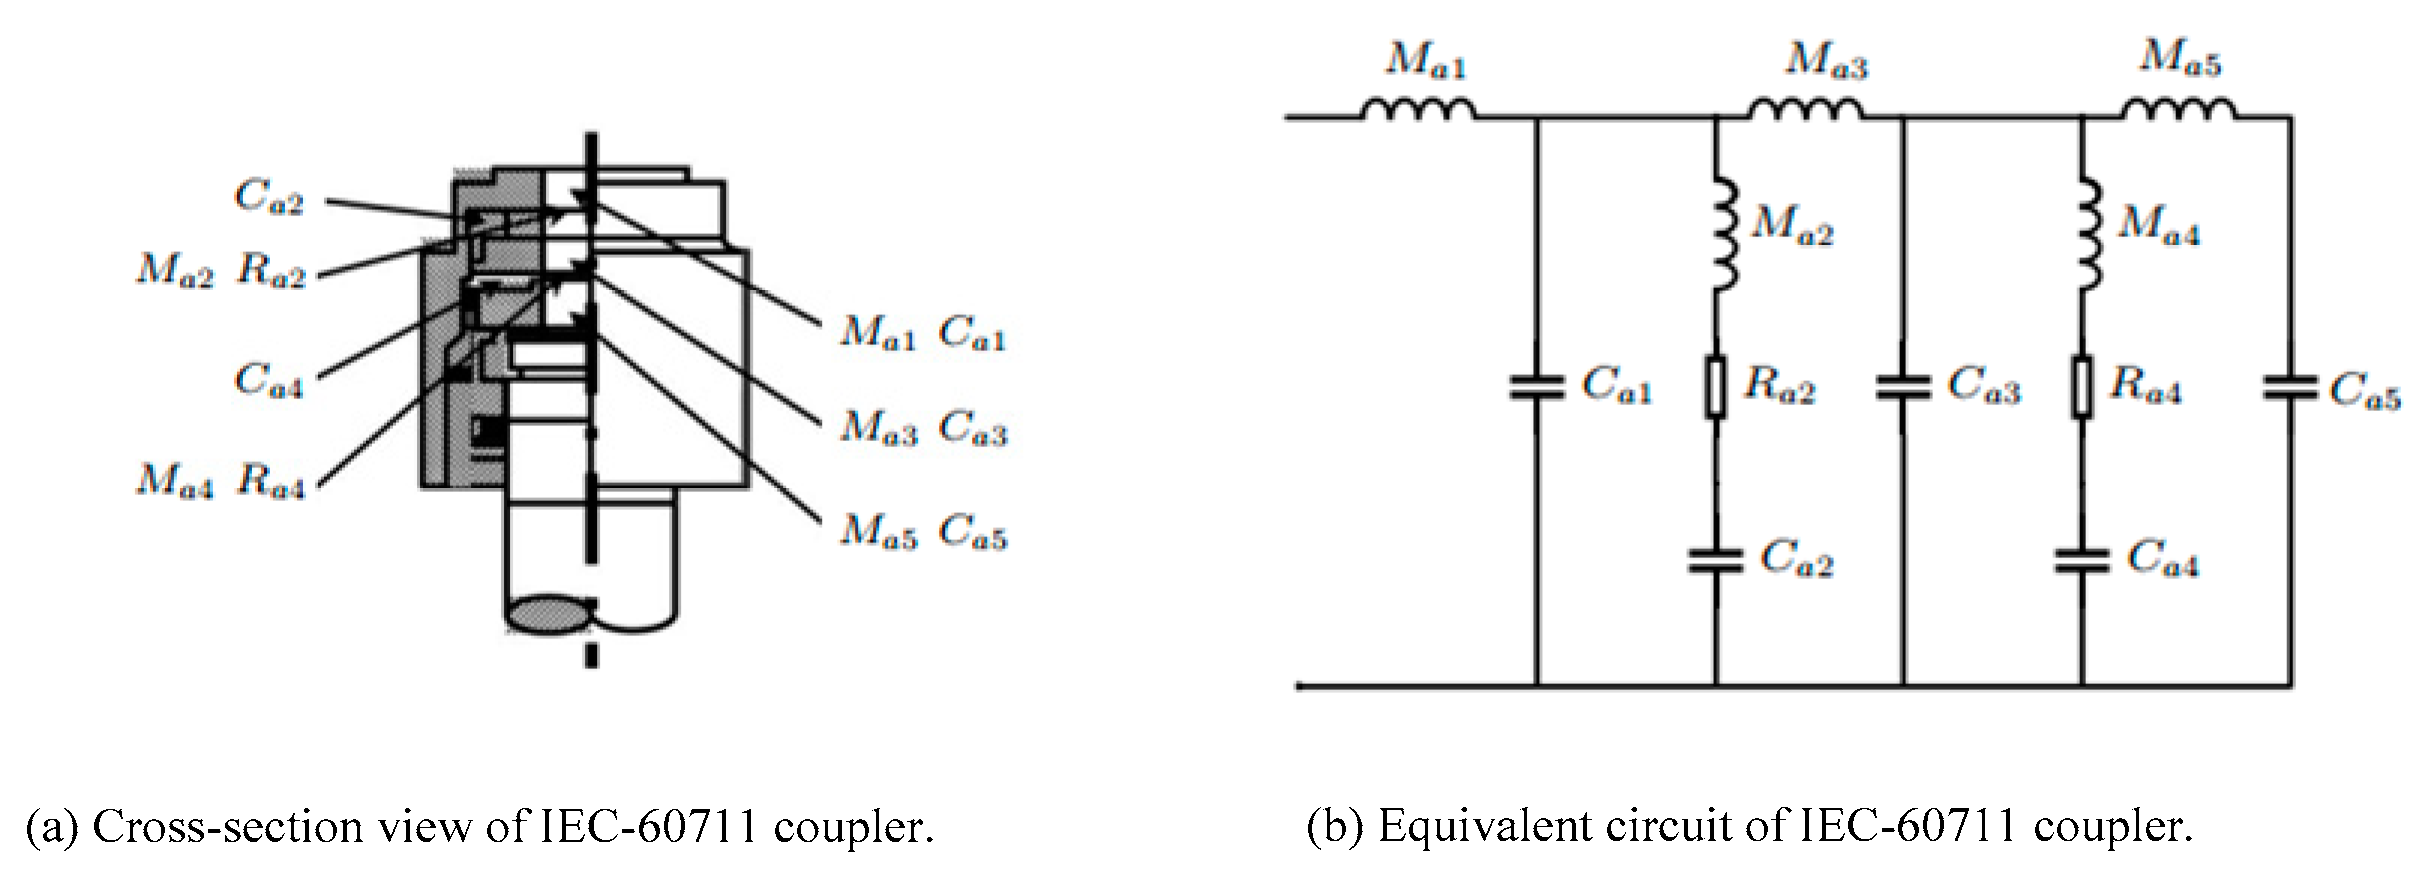
2.3. Acoustic Modeling
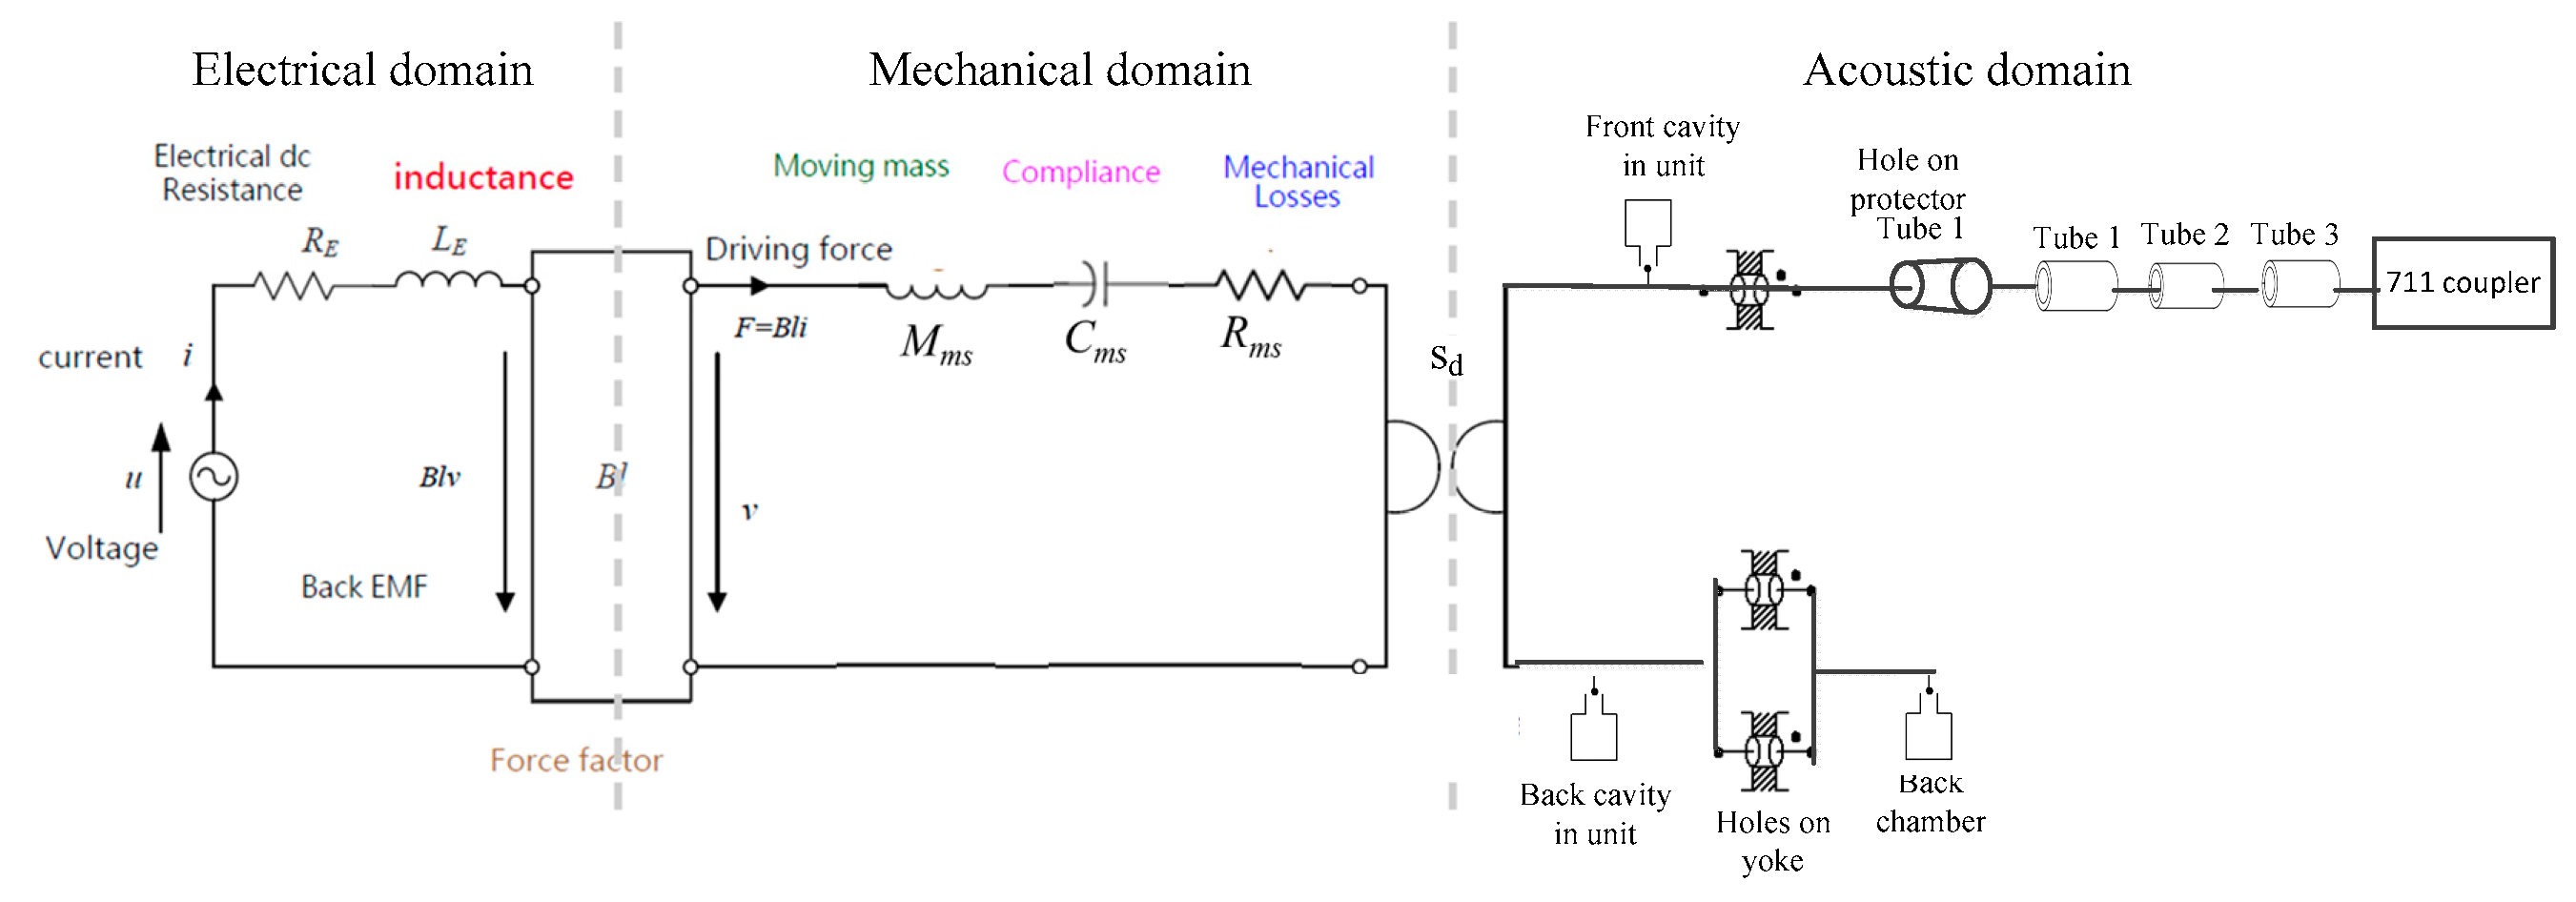
2.4. Electromagnetic-Mechanical-Acoustic Coupling
3. Parameter Identification
3.1. Electromagnetic Parameter Identification
3.2. Mechanical Parameter Identification
3.3. Acoustic Parameter Identification
3.4. Electromagnetic-Mechanical-Acoustic Coupling Parameter Identification
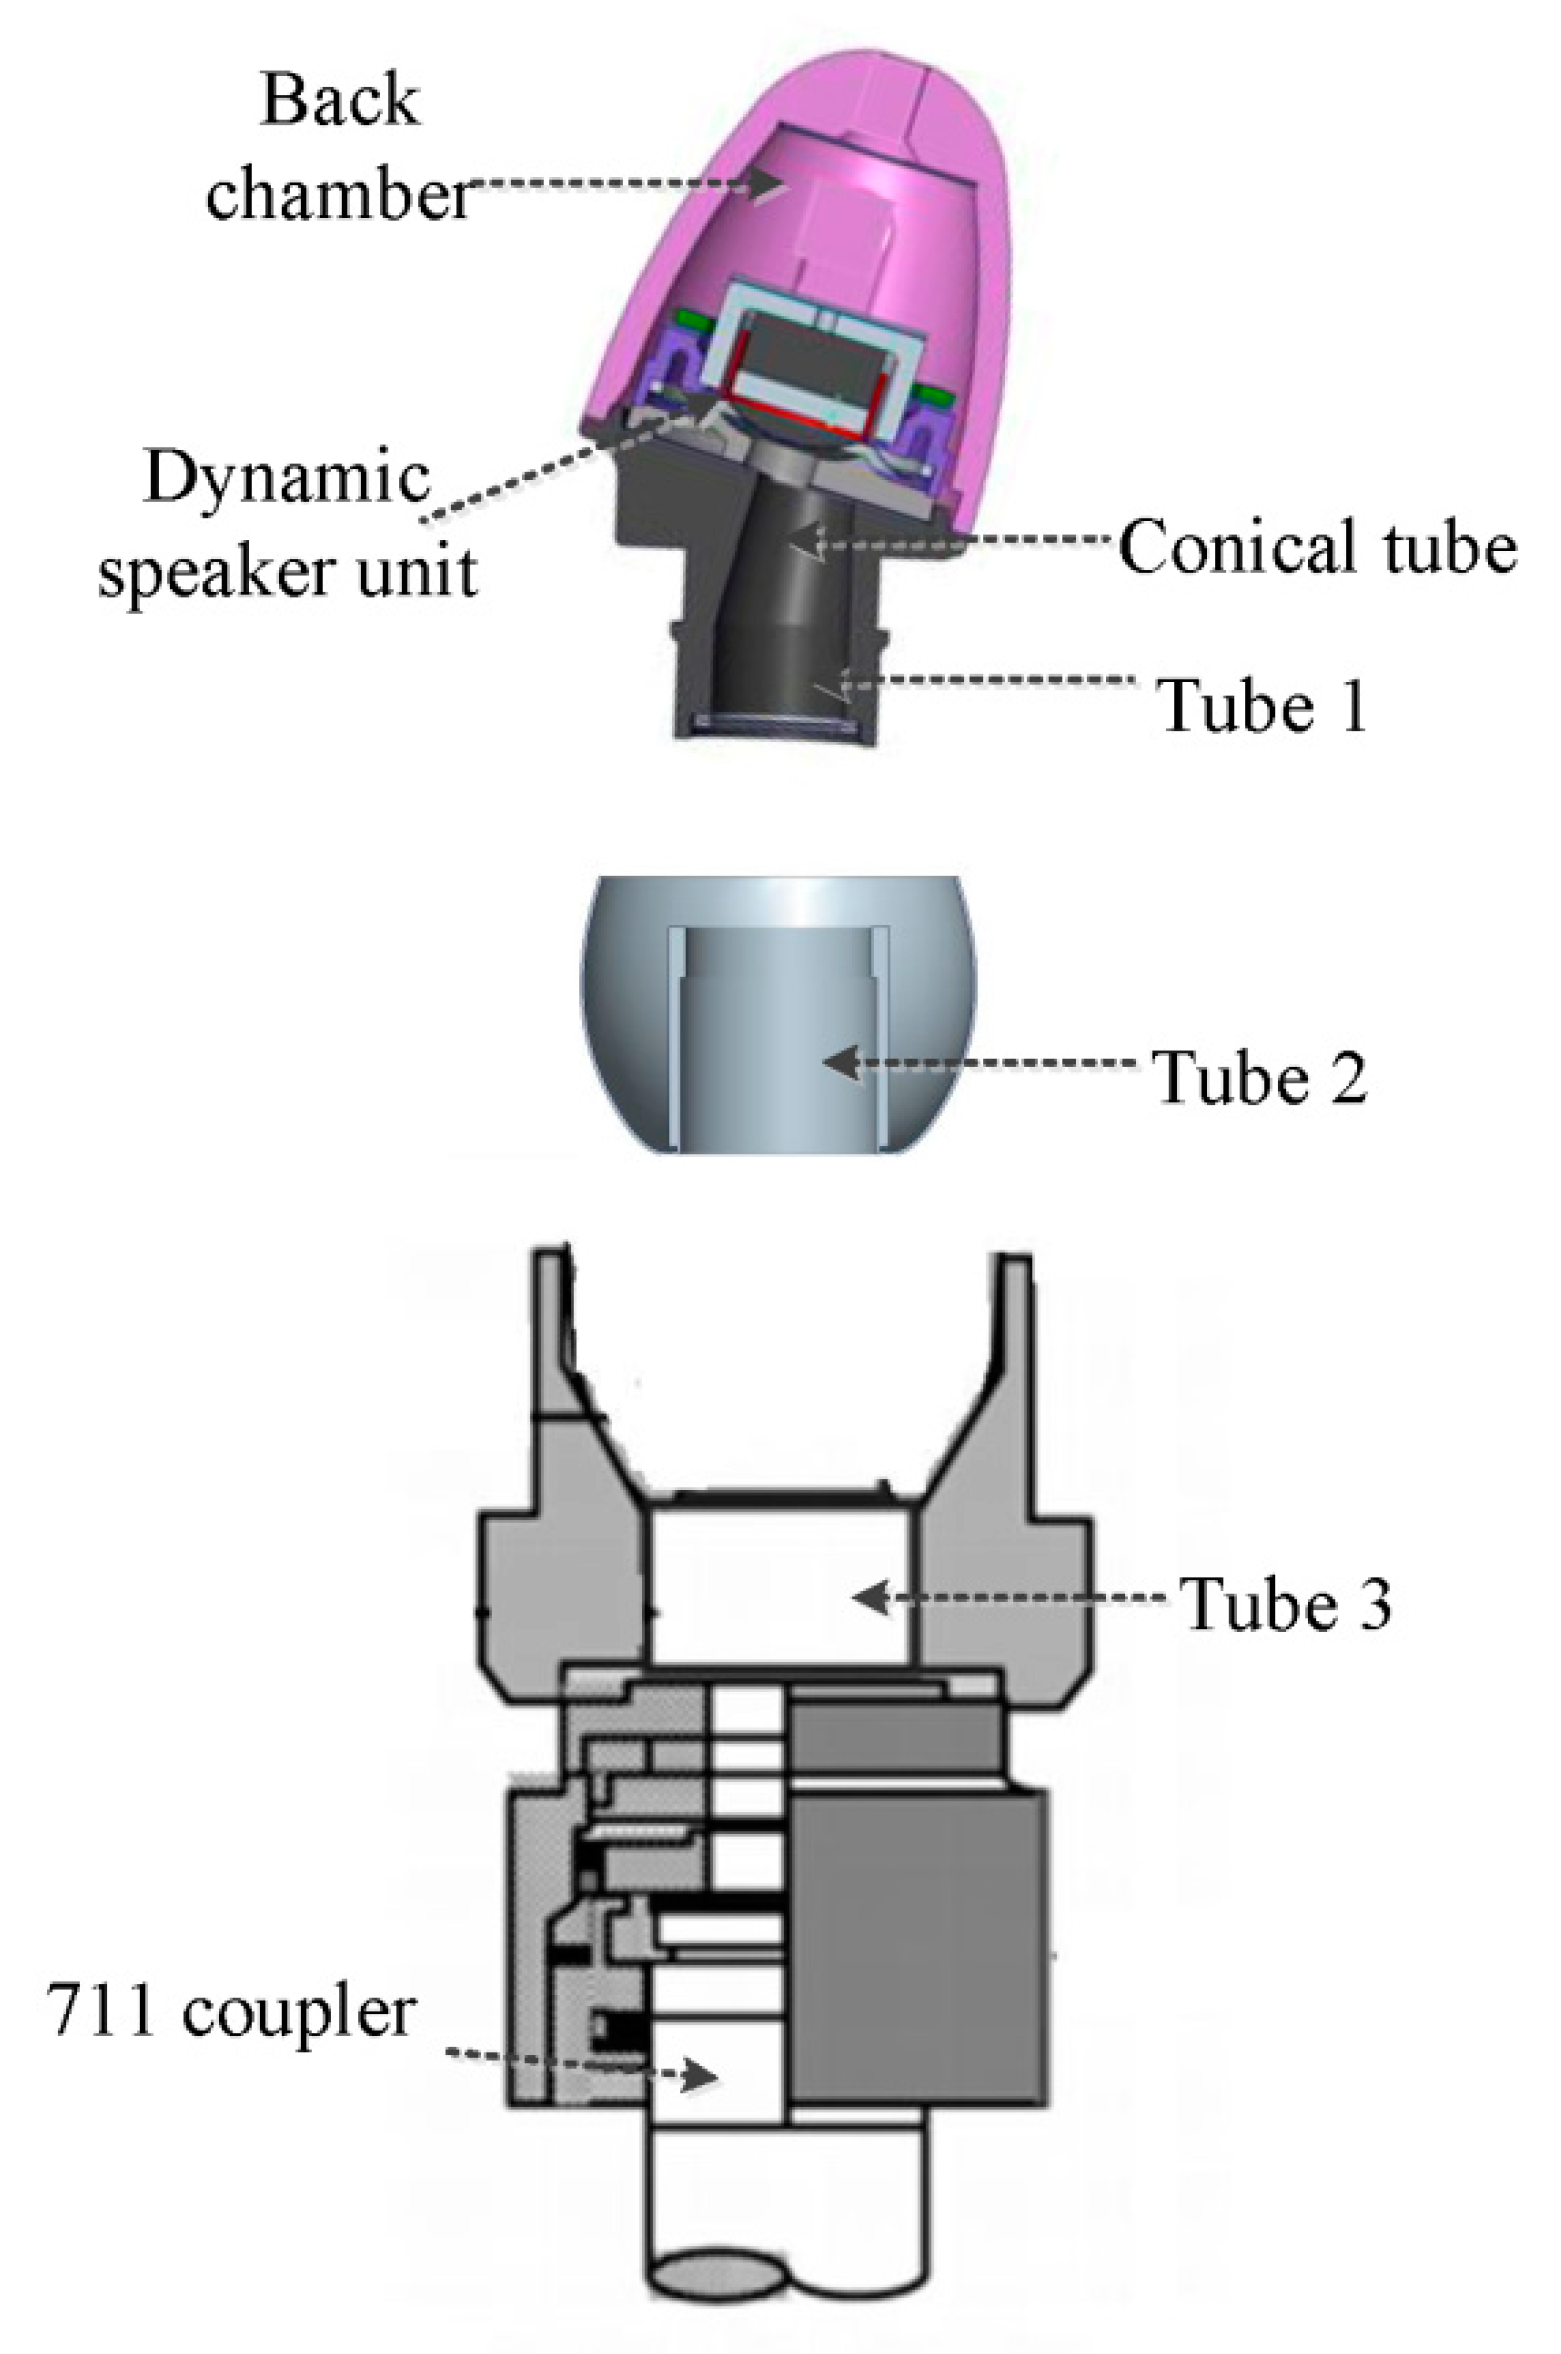
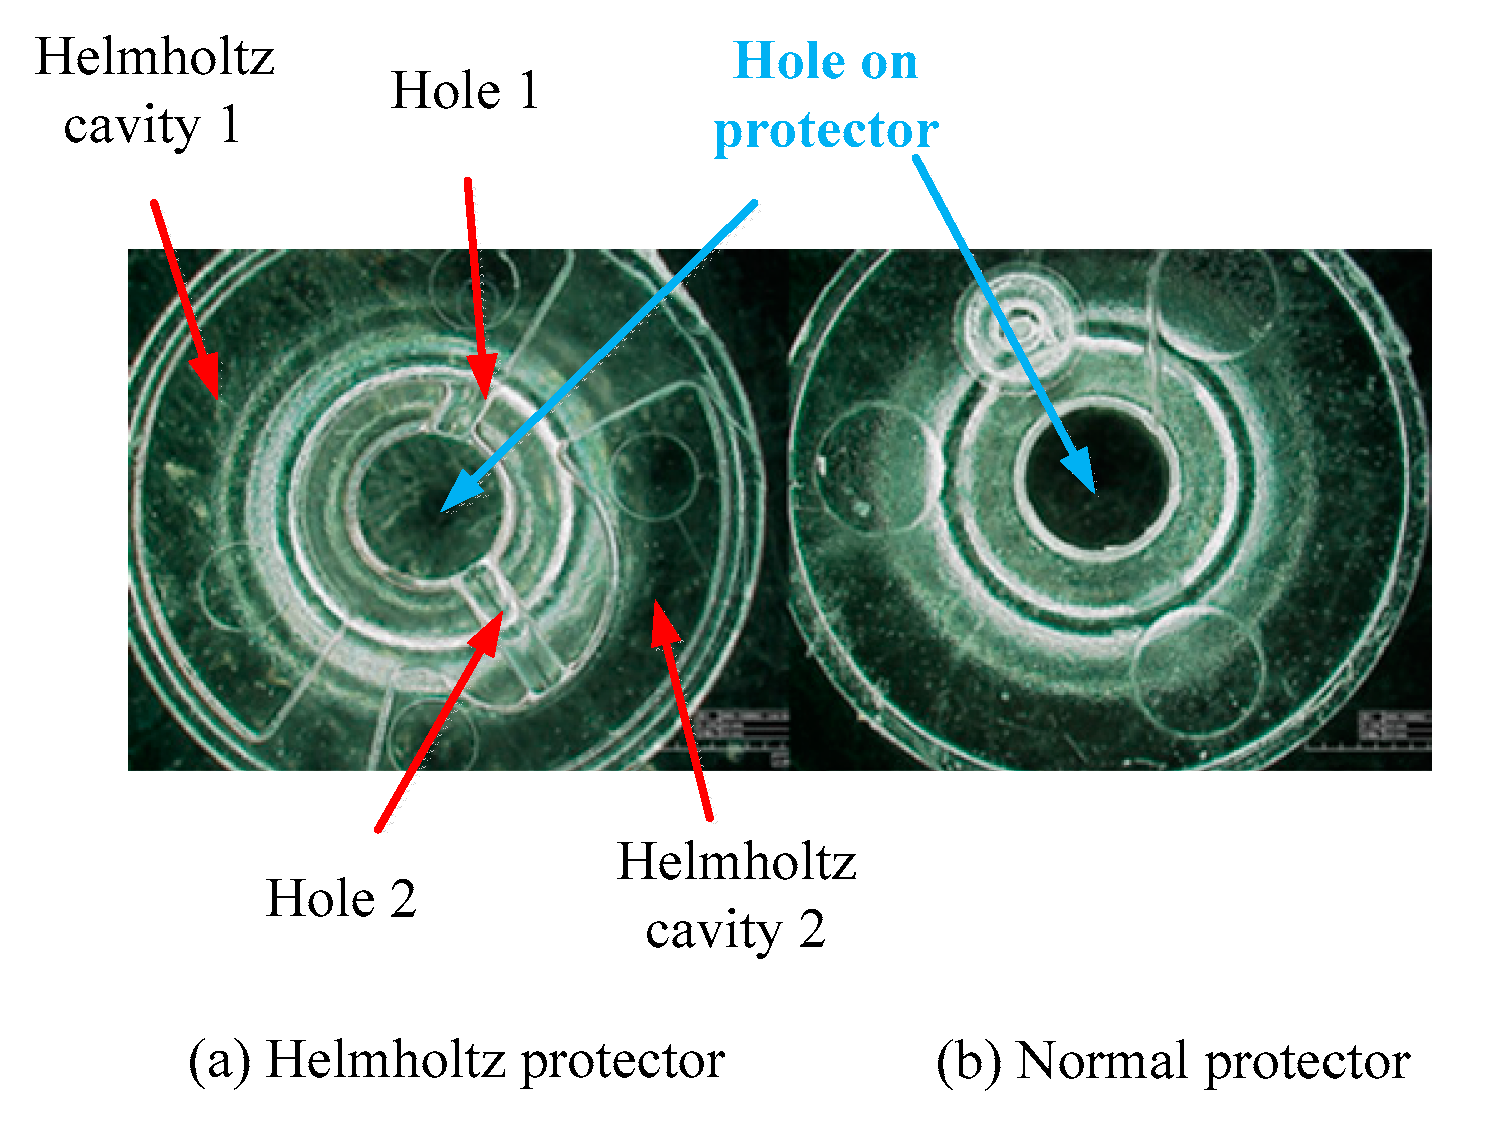
4. Design of Helmholtz Protector
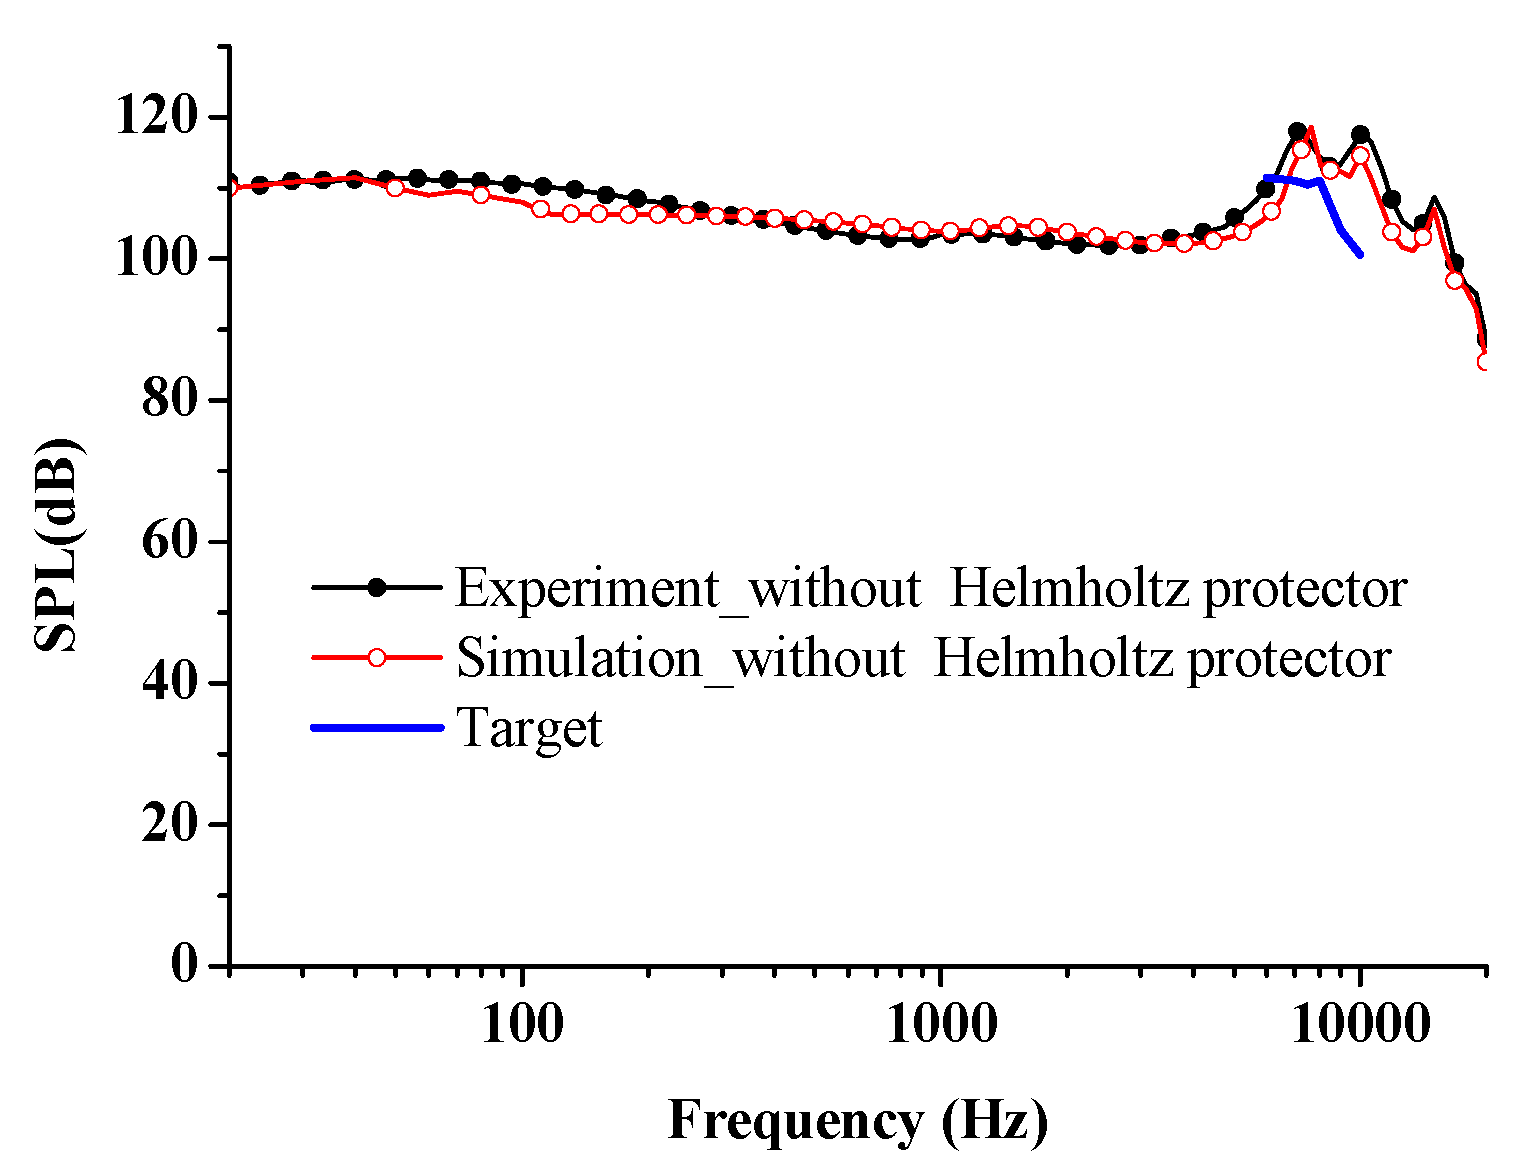
5. Experiment
6. Conclusions
Author Contributions
Funding
Conflicts of Interest
Abbreviations
| SPL | Sound pressure level |
| MEMS | Micro-Electro-Mechanical System |
| HATS | Head and Torso Simulator |
| FFT | Fast Fourier Transform |
References
- Männchen, A.; Stoppel, F.; Beer, D.; Niekiel, F.; Wagner, B. In-ear headphone system with piezoelectric mems driver. In Proceedings of the 145th Audio Engineering Society Convention, New York, NY, USA, 17–20 October 2018. [Google Scholar]
- Jiang, Y.W.; Xu, D.P.; Hwang, S.M. Electromagnetic-mechanical analysis of a balanced armature receiver by considering the nonlinear parameters as a function of displacement and current. IEEE Trans. Magn. 2018, 99, 1–4. [Google Scholar]
- White, J. Considerations in high-fidelity moving-coil earphone design. IEEE Trans. Audio 1963, 6, 188–194. [Google Scholar] [CrossRef]
- Biba, D.; Opitz, M. Development of a finite element headphone model. In Proceedings of the 122nd Audio Engineering Society Convention, Vienna, Austria, 5–8 May 2007. [Google Scholar]
- Bauer, B.B. Equivalent circuit analysis of mechano-acoustic structures. J. Audio Eng. Soc. 1976, 24, 643–652. [Google Scholar]
- Leach, W.M., Jr. Analogous circuits for acoustical systems and analogous circuits for mechanical systems. In Introduction to Electroacoustic and Audio Amplifer Design, 3rd ed.; Kendall Hunt Publishing: Dubuque, IA, USA, 2003; pp. 33–62. [Google Scholar]
- Huang, C.H.; Pawar, S.J.; Hong, Z.J.; Huang, J.H. Insert earphone modeling and measurement by IEC-60711 coupler. IEEE Trans. Ultrason. Ferroelectr. Freq. Control 2011, 58, 461–469. [Google Scholar] [CrossRef] [PubMed]
- Huang, C.-H.; Pawar, S.J.; Hong, Z.-J.; Huang, J.H. Earbud-type earphone modeling and measurement by head and torso simulator. Appl. Acoust. 2012, 73, 461–469. [Google Scholar] [CrossRef]
- Blanchard, L.; Agerkvist, F. Concha headphones and their coupling to the ear. In Proceedings of the 126th Audio Engineering Society Convention, Munich, Germany, 7–10 May 2009. [Google Scholar]
- Avis, M.R.; Kelly, L.J. Principles of headphone design—A tutorial review. In Proceedings of the UK 21st Conference: Audio at Home, Cambridge, UK, 6–8 April 2006. [Google Scholar]
- Tsai, Y.; Shiah, Y.; Huang, J.H. Effects of porous materials in an insert earphone on its frequency response-experiments and simulations. IEEE Trans. Ultrason. Ferroelectr. Freq. Control 2012, 59, 2537–2547. [Google Scholar] [PubMed]
- Bai, M.R.; Kuo, Y.C. Acoustical design of a bluetooth earphone using simulated annealing optimization. J. Audio Eng. Soc. 2010, 58, 583–589. [Google Scholar]
- Olive, S.; Welti, T.; Khonsaripour, O. The preferred low frequency response of in-ear headphones. In Proceedings of the Audio Engineering Society Conference: 2016 AES International Conference on Headphone Technology, Aalborg, Denmark, 24–26 August 2016. [Google Scholar]
- Olive, S.; Welti, T.; Khonsaripour, O. The influence of program material on sound quality ratings of in-ear headphones. In Proceedings of the 142nd Audio Engineering Society Convention, Berlin, Germany, 20–23 May 2017. [Google Scholar]
- Kinsler, L.E.; Frey, A.R.; Coppens, A.B.; Sanders, J.V. Fundamentals of acoustics. In Fundamentals of Acoustics, 4th ed.; Wiley: Hoboken, NJ, USA, 1999. [Google Scholar]
- Slotte, B. Acoustics Simulation in Mobile Phone Audio Design. Master’s Thesis, Science, Helsinki University of Technology, Espoo, Finland, 1999. [Google Scholar]
- Nielsen, L.; Schuhmacher, A.; Liu, B.; Jonsson, S. Simulation of the iec 60711 occluded ear simulator. In Proceedings of the 116th Audio Engineering Society Convention, Berlin, Germany, 8–11 May 2004. [Google Scholar]
- Jiang, Y.-W.; Kwon, J.-H.; Kim, H.-K.; Hwang, S.-M. Analysis and optimization of micro speaker-box using a passive radiator in portable device. Arch. Acoust. 2017, 42, 753–760. [Google Scholar] [CrossRef]


| Item | Value |
|---|---|
| Ma1 (kg·m−4) | 82.9 |
| Ma2 (kg·m−4) | 9400 |
| Ma3 (kg·m−4) | 130.3 |
| Ma4 (kg·m−4) | 983.8 |
| Ma5 (kg·m−4) | 133.4 |
| Ca1 (m5·N−1) | 0.943 × 10⁻¹² |
| Ca2 (m5·N−1) | 1.9 × 10⁻¹² |
| Ca3 (m5·N−1) | 1.479 × 10⁻¹² |
| Ca4 (m5·N−1) | 2.1 × 10⁻¹² |
| Item | Value |
|---|---|
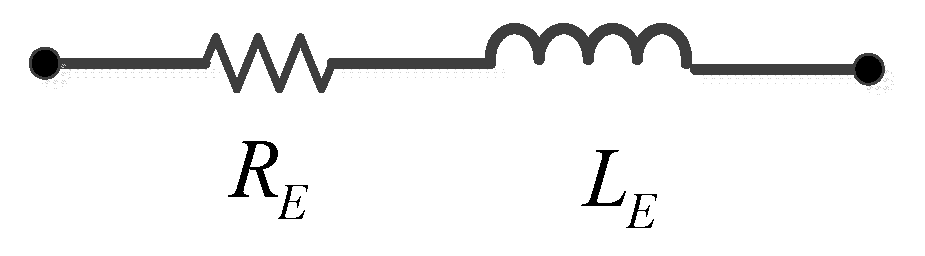
| RE (Ohm) | 15 |
| LE (mH) | 0.02 |
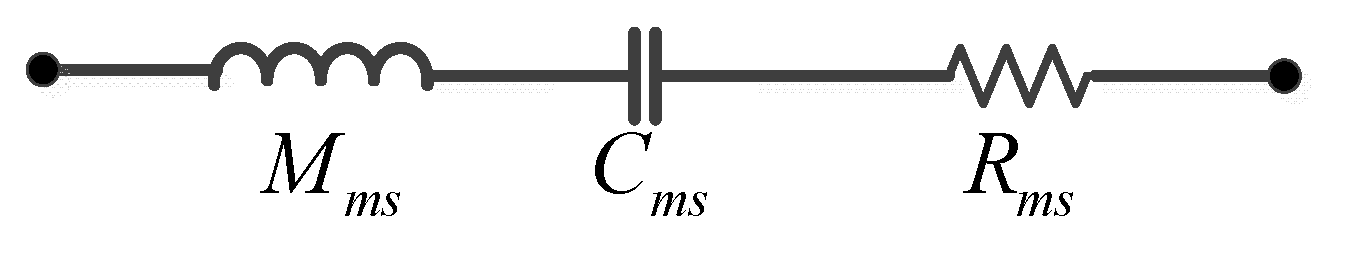
| Mms (g) | 0.006 |
| Rms (kg/s) | 0.35 |
| Cms (mm/N) | 3.597 |
| Kms (N/mm) | 0.278 |
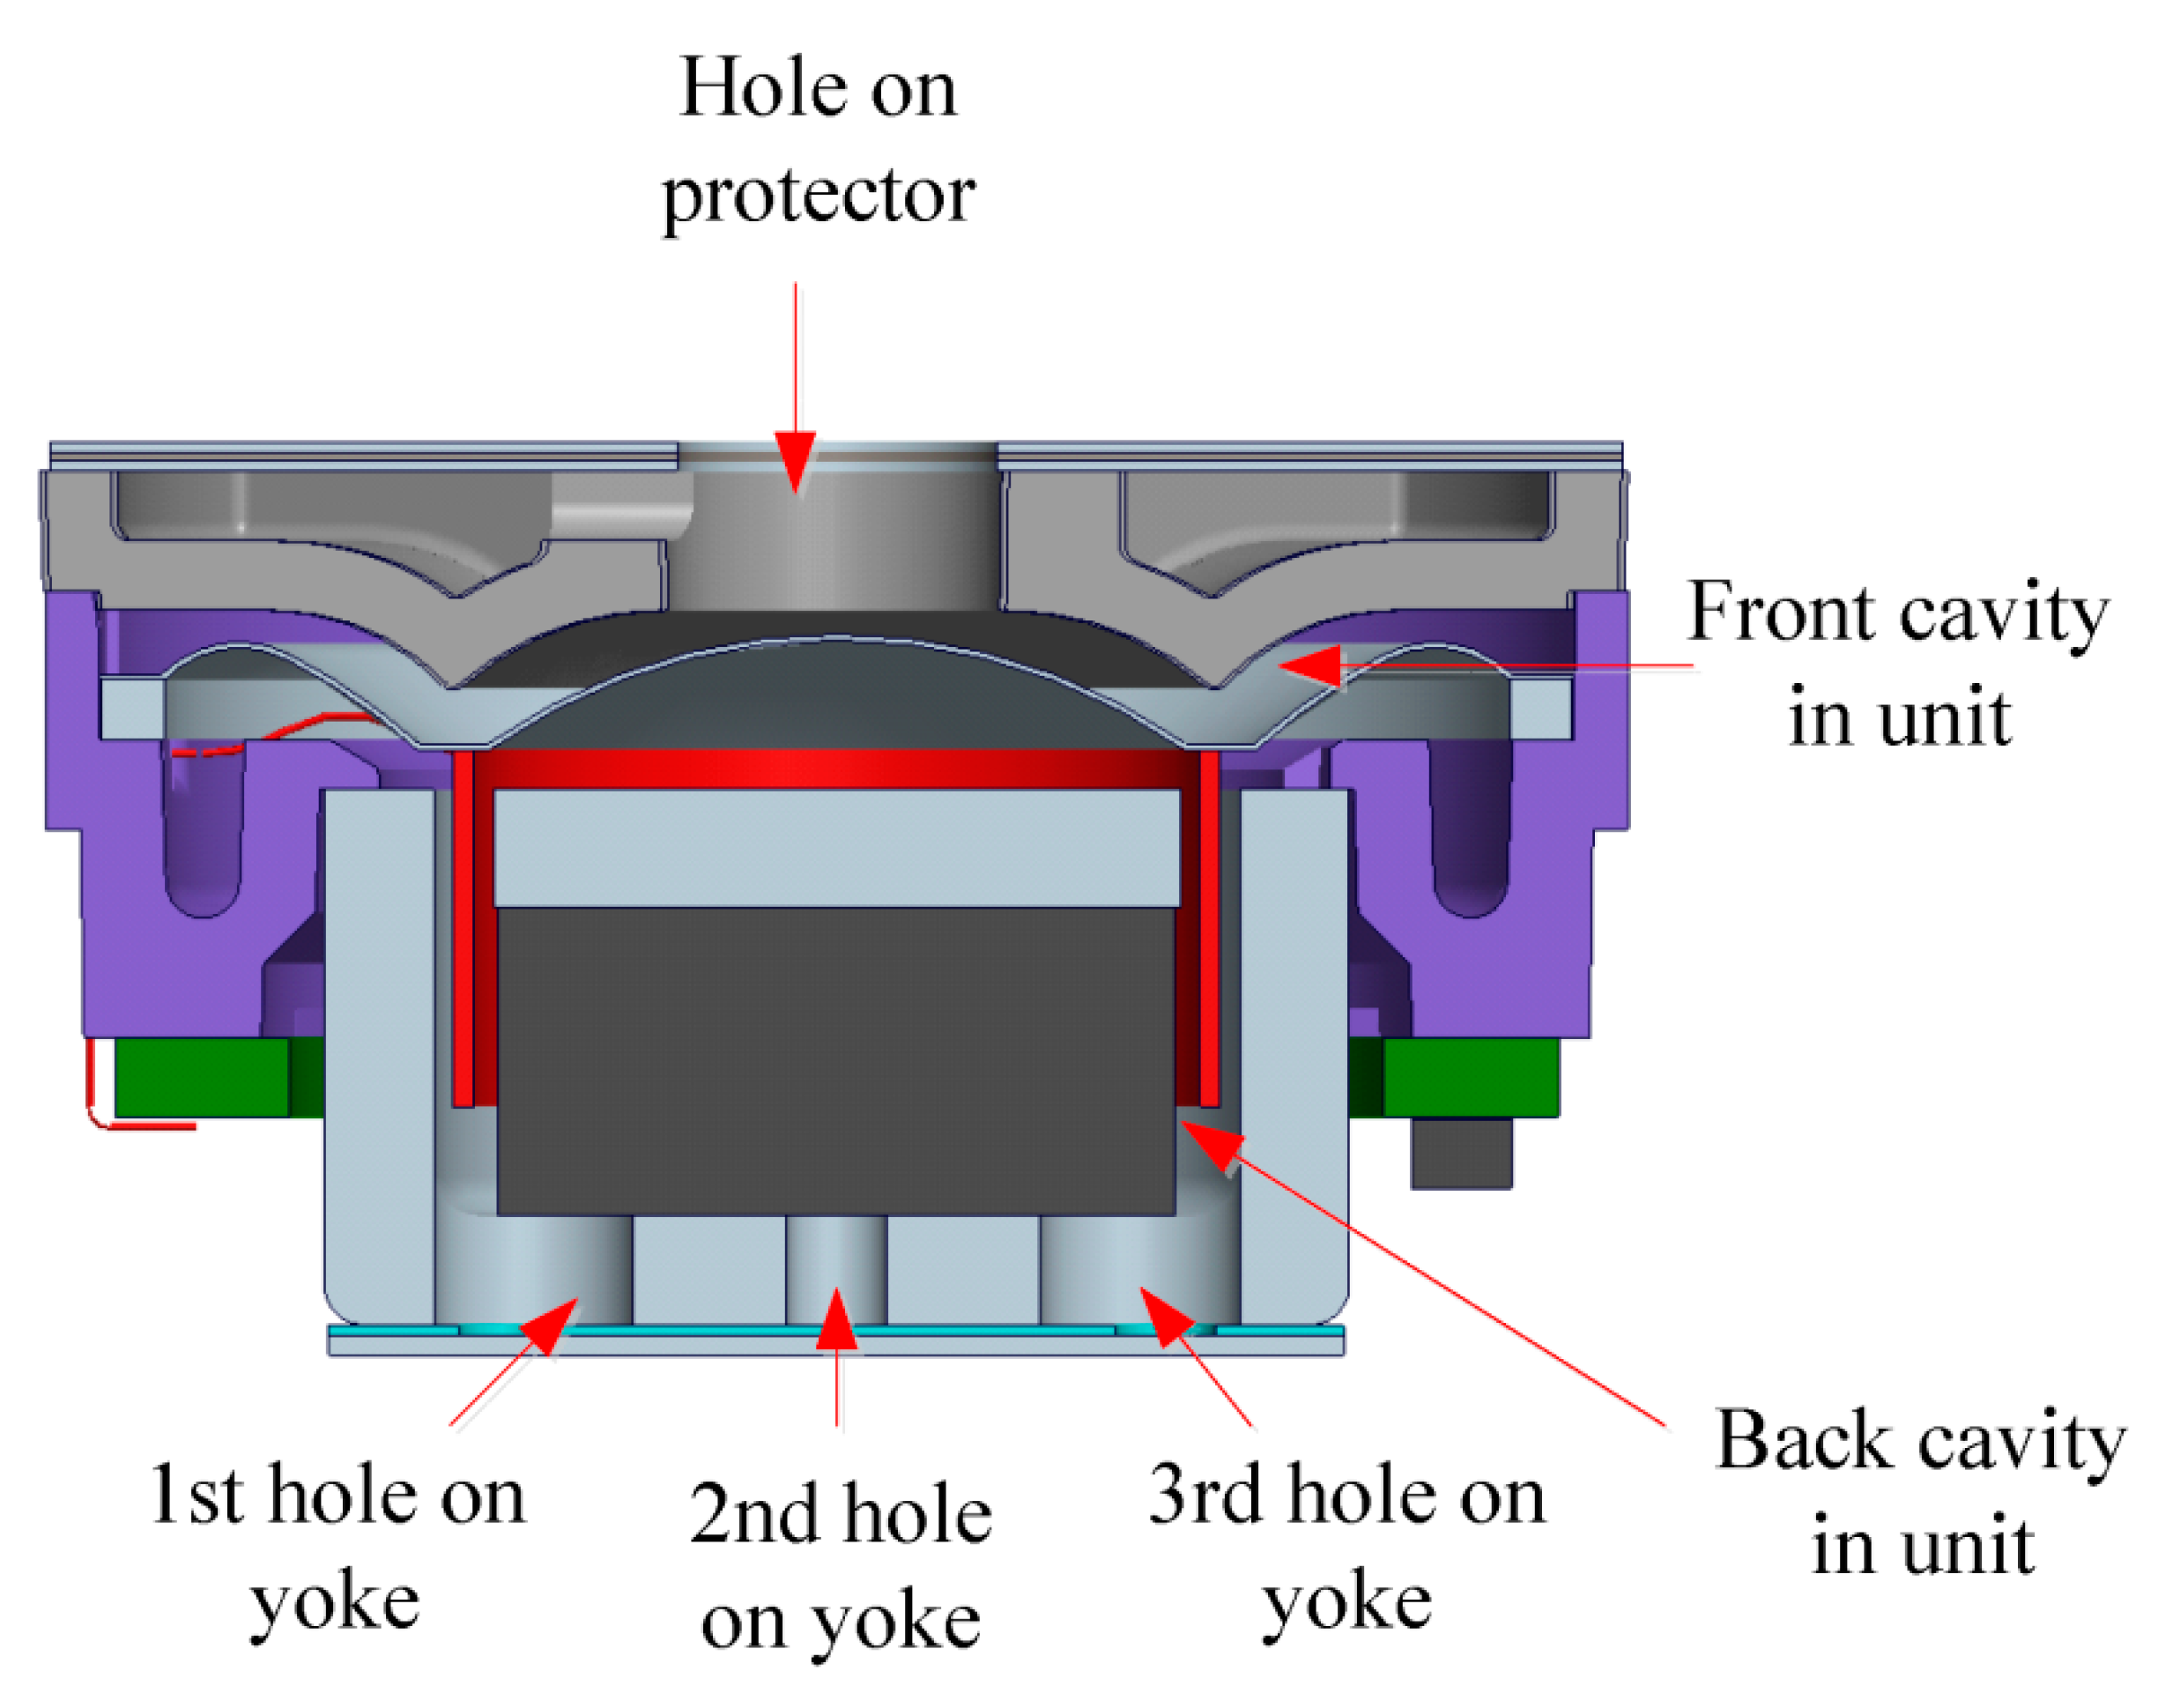
| Item | Length (mm) | Diameter (mm) |
|---|---|---|
| 1st hole on yoke | 0.55 | 1 |
| 2nd hole on yoke | 0.55 | 0.5 |
| 3rd hole on yoke | 0.55 | 1 |
| Hole on protector | 0.9 | 1.7 |
| tube 1 | 2.3 | 2.5 |
| tube 2 | 4 | 2.8 |
| tube 3 | 6.5 | 7.4 |
| Item | Value |
|---|---|
| Front cavity in unit (mm3) | 11.11 |
| Back cavity in unit (mm3) | 25.14 |
| Back chamber (mm3) | 159 |
© 2019 by the authors. Licensee MDPI, Basel, Switzerland. This article is an open access article distributed under the terms and conditions of the Creative Commons Attribution (CC BY) license (http://creativecommons.org/licenses/by/4.0/).
Share and Cite
Jiang, Y.-W.; Xu, D.-P.; Jiang, Z.-X.; Kim, J.-H.; Hwang, S.-M. Analysis and Design of Helmholtz Protector to Improve High-Frequency Response of Insert Earphone. Appl. Sci. 2019, 9, 2541. https://doi.org/10.3390/app9122541
Jiang Y-W, Xu D-P, Jiang Z-X, Kim J-H, Hwang S-M. Analysis and Design of Helmholtz Protector to Improve High-Frequency Response of Insert Earphone. Applied Sciences. 2019; 9(12):2541. https://doi.org/10.3390/app9122541
Chicago/Turabian StyleJiang, Yuan-Wu, Dan-Ping Xu, Zhi-Xiong Jiang, Jun-Hyung Kim, and Sang-Moon Hwang. 2019. "Analysis and Design of Helmholtz Protector to Improve High-Frequency Response of Insert Earphone" Applied Sciences 9, no. 12: 2541. https://doi.org/10.3390/app9122541
APA StyleJiang, Y.-W., Xu, D.-P., Jiang, Z.-X., Kim, J.-H., & Hwang, S.-M. (2019). Analysis and Design of Helmholtz Protector to Improve High-Frequency Response of Insert Earphone. Applied Sciences, 9(12), 2541. https://doi.org/10.3390/app9122541