Abstract
In order to solve the problems brought upon by off-shore wind-power plants, it is important to improve fault ride-through capability when an on-shore fault occurs in order to prevent DC overvoltage. In this paper, a coordinated control strategy is implemented for a doubly-fed induction generator (DFIG)-based off-shore wind farm, which connects to on-shore land by a modular multilevel converter (MMC)-based high voltage direct current (HVDC) transmission system during an on-shore fault. The proposed control strategy adjusts the DC voltage of the off-shore converter to ride through fault condition, simultaneously varying off-shore AC frequency. The grid-side converter detects the frequency difference, and the rotor-side converter curtails the output power of the DFIG. The surplus energy will be accumulated at the rotor by accelerating the rotor speed and DC link by rising DC voltage. By the time the fault ends, energy stored in the rotor and energy stored in the DC capacitor will be released to the on-shore side to restore the normal transmission state. Based on the control strategy, the off-shore wind farm will ride through an on-shore fault with minimum rotor stress. To verify the validity of the proposed control strategy, a DFIG-based wind farm connecting to the on-shore side by an MMC HVDC system is simulated by PSCAD with an on-shore Point of Common Coupling side fault scenario.
1. Introduction
In the proliferation of renewable energy, worldwide total wind-power installations in 2017 were about 52 GW, bringing the global total to nearly 540 GW. The off-shore segment showed an 87% increase on the 2016 market, recording 4334 MW in a year [1]. The electricity generation by renewable sources is expected to take up 40% of total electricity in the U.S. by 2030, and approximately half of it will be generated by wind turbine generators [2]. For South Korea, renewable energy capacity grew by as much as 13,846 MW in 2016, and the Korean government put forward the 3020 Project, which presents its objective for the portion of renewable energy source penetration from 7% to more than 20% of total generation by 2030. This means approximately 60 GW of renewable energy facility is required [3].
Multimegawatt wind farms are an attractive choice for renewable energy generation options. In addition, off-shore wind farms are preferable to on-shore solutions, because larger and more constant wind energy potential exists off-shore. To bring generated electric power on-shore, HVDC solutions are clearly taking their place [4]. Recently, an HVDC transmission system based on a modular multilevel converter (MMC) has been widely used given its improved controllability, advantage on smooth waveforms, and high voltage possibility by its modular topology. Therefore, it is expected that long-distance off-shore wind farms will be connected to the mainland by MMC HVDC [5].
For reliable operation, wind farms should not compromise the grid stability. System frequency or voltage stability must be sustained even though small disturbance occurs. That is, the wind farm should not have lost its generation by a small disturbance.
The objective of grid codes is to improve voltage and frequency stability by mandating wind farms to provide ancillary services [6,7]. The grid codes require wind-energy sources to stay connected in voltage sags according to a guided time-voltage profile, named a “low-voltage ride-through” (LVRT) profile. To satisfy the LVRT code, DC overvoltage and overcurrent and off-shore AC grid stability issues should be addressed. There have been numerous studies conducted to mitigate these problems [8,9,10].
The most commonly-used strategies are the crowbar and the DC chopper. The crowbar can dissipate surplus power when a fault occurs with the rotor-side converter [8,9]. A DC chopper can expend excessive energy by using a chopper resistor implemented in a DC link [10]. However, they are not necessary if the kinetic energy controls studied by Yang et al. [11] are implemented. In the study of Yang et al [11], if surplus energy was stored in a rotor mass, even in the absence of the crowbar or DC chopper, a wind farm could ride through on-shore faults. There are also prior research works on using the stored kinetic energy of a rotor mass [12]. Deloading of a fully-rated converter wind turbine as an FRT strategy was introduced by Ramtharan et al. [13], and they employed a wind turbine-connected full-scale VSC converter DC link as an energy storage component. To broaden the versatility, a DC link can operate as a temporary energy-storage device, but needs fast and reliable communication.
Frequency was used as a signal medium in Silva et al. [14], who achieved communication-free control by changing the reference frequency of an off-shore grid-forming converter. However, it used DC choppers to dissipate excessive energy generated from wind turbines. In Yang et al. [11], energy was stored in a wind turbine rotor, but it also needed fast and reliable communication. In this paper, the proposed coordinated control strategy stores excessive generated power in two energy storage mediums when an on-shore fault occurs in both a VSC converter DC link and a wind turbine rotor, while signaling control references in frequency droop. The proposed control has the following contributions:
- DC chopper, crowbar-free operation by energy control in a DC link and a wind turbine.
- Minimizing rotor acceleration by controlled energy storage in a DC link
- Communication-free operation between the MMC off-shore converter and DFIG by on-shore voltage-off-shore frequency-wind turbine power droop
The organization of this work is as follows: Section 2 is about the control and modeling of MMC HVDC and DFIG and their characteristics. Section 3 discusses the proposed coordinated droop control scheme. Section 4 discusses the simulation conducted based on PSCAD/EMTDC, and Section 5 discusses the conclusion.
2. Control and Modeling of the OSWF System
Based on the largest market share across the world, four types of wind turbines are defined [15]. Type 1 is a fixed-speed induction machine with a capacitor bank. It is the oldest type, with a simple structure and control system. In Type 2, a variable rotor resistor is added to control rotor speed. The main feature of Types 3 and 4 is the use of an AC-DC-AC power converter. Both types can control rotor speed and output turbine power. The difference between Types 3 and 4 is the full coverage of turbine power by a power converter.
A variable-speed wind turbine has several advantages compared to fixed-speed wind turbines [16], as it can operate under its rated speed and can extract maximum power by a control named maximum power point tracking (MPPT). The control can be achieved by adjusting rotor speed to the maximum power tracking point according to varying wind speed.
Specifically, a Type-3 doubly-fed induction generator (DFIG) has some beneficial characteristics. It can control its rotor speed, so variable speed operation is attainable. Moreover, it has a small-scale power converter to control active-reactive power from the turbine. Although there is a full-scale converter-connected permanent magnet synchronous generator (PMSG)-type wind turbine, a DFIG costs less because of its small power rating. Furthermore, as PMSG power converters should be rated the same as generator capacity, the size and complexity of the overall system increases, and the losses are higher, which leads to low efficiency [17].
In transient conditions, PMSG-type wind turbines can cope with fault conditions by controlling their full-scale converter. However, for a DFIG, direct connections of the grid to the stator side can damage the equipment. Therefore, special protection schemes, like a DC chopper or crowbar, are used. Moreover, because a DFIG is a commonly-used device in the commercial wind turbine market, it is helpful to use a DFIG for analyzing off-shore wind farm systems.
The off-shore wind farm-connected MMC-HVDC is schematically shown in Figure 1. Since the off-shore side system topology does not change and the focus of this study is limited to a maximum of a few hundred milliseconds of on-shore fault, the DFIG wind turbine models are aggregated in the simulation [18]. MMC HVDC connects the on-shore side system to the off-shore side system. The MMC HVDC off-shore side converter outer-loop controller forms the off-shore grid and controls the off-shore AC voltage. Simultaneously, the on-shore side converter outer-loop controller controls the DC voltage of HVDC and the AC voltage of the on-shore grid.
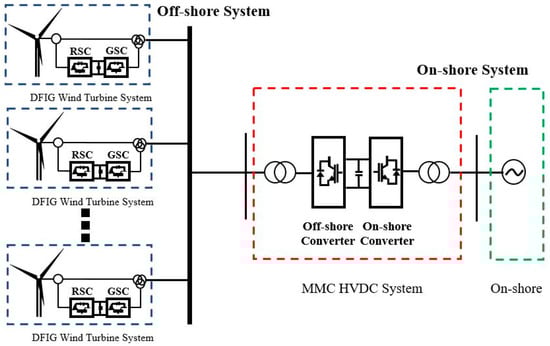
Figure 1.
Off-shore doubly-fed induction generator (DFIG) wind farm with MMC.
As introduced in [14], there are various studies of controlled off-shore frequency for various purposes [19,20,21]. In [19], a Line Commutated Converter HVDC-connected off-shore wind farm PMSG inverter controlled off-shore frequency for smooth LCC HVDC operation. In [20], HVDC controlled off-shore frequency for optimal operation of wind turbines. A Q/frequency droop control was used in [21] to obtain a reference frequency at PCC.
2.1. MMC HVDC Outer Loop and Energy Control
The basic outer controller schemes were well expressed in [22]. The on-shore side converter operated as an inverter providing power to the grid, while the off-shore side converter operated as a grid former, which synthesizes the AC voltage by a predetermined frequency for Off-shore Wind Farm. There were studies [23,24] that varied the grid-forming parameters for the intended control purposes, but the basis was to generate a fixed frequency and voltage for grid synchronization. The off-shore side converter acted as an infinite voltage source to absorb generated power from wind turbines. Furthermore, it established the off-shore frequency and AC voltage of the grid.
Because this paper deals with DC voltage as the energy storage, capacitor voltage and its stored energy should be defined. In Figure 2, the overall MMC converter structure and submodule configurations are displayed. If the capacitors are well balanced and sized identically, each MMC arm can be represented as an aggregated equivalent capacitor [25]. To calculate energy stored in a DC capacitor, an equivalent capacitor and measured capacitor voltage sum are required. The average voltage of arm capacitors can be expressed as:
where , and represent the average arm voltage and the upper and lower arm average voltage. The total equivalent capacitance is then derived to calculate total stored energy in the MMC:
where represent equivalent capacitance, total arm capacitance, submodule capacitance, and submodule number. Assuming no losses in the MMC, the variation of the total energy in the converter can be expressed as a power difference:
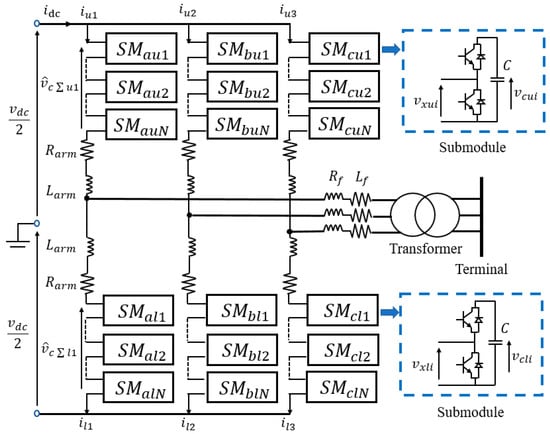
Figure 2.
MMC HVDC converter configuration.
2.2. DFIG Power and Current Control
In a DFIG wind turbine, a wound rotor machine with a back-to-back-type converter with 30% scale for rotor winding feeding was used. Each side converter is called the rotor side converter (RSC) and the grid side converter (GSC). The stator side was directly connected to the AC grid side, and the rotor side was connected to the rotor-side converter. Therefore, rotor current can control wind turbine output active and reactive power [26,27] as if the rotating magnetic-field magnitude remained constant, and neglecting rotor resistance, where mean stator resistance and flux speed. Therefore, electrical torque and output power are represented as:
3. Advanced FRT Strategy
The objective of the proposed FRT strategy is to ride through an on-shore fault by rotor acceleration and minimize the burden on the rotor by DC voltage control of the DC capacitor. Figure 3 shows the overall FRT algorithm’s flowchart. When a fault occurs, MMC HVDC catches the voltage dip and compares the measured fault voltage to threshold voltage . Then, it calculates off-shore power reference by precalculated DC energy. After calculating , the reference is then calculated for off-shore frequency reference , the and off-shore side MMC converter changes the off-shore frequency for DFIG deloading. The GSC of DFIG picks up the changed off-shore frequency, and the RSC current reference order changes for deloading. Finally, the DFIG rotor will deload by the calculated deload order.
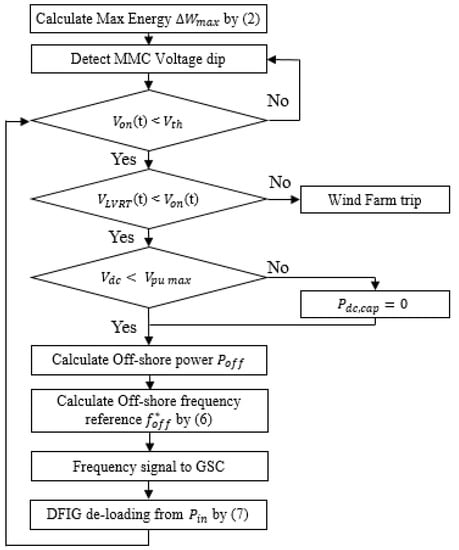
Figure 3.
Coordinated droop control algorithm.
3.1. Unbalanced Power Calculation for DC Voltage Control
A DC capacitor can store surplus electrical power. MMC HVDC can relieve the burden of the DFIG turbine. When the fault occurs at an on-shore site, both MMC HVDC and the rotor will store surplus power in the DC capacitor and the rotor mass. Assuming the capacitance of the DC line is much smaller than that of the MMC converter, the initial energy stored in DC can be calculated as:
If an on-shore fault occurs, the MMC on-shore side cannot handle the amount of output power because of low on-shore voltage, so the difference from the off-shore power transfer amount will cause DC voltage variation as:
When the power difference is persistent, energy stored in the DC capacitor can be calculated as:
Absorbing the unbalanced power during the fault can be dangerous because it can easily induce DC overvoltage. To prevent such a disaster, calculating the unbalanced power and off-shore power reference is required. Typical MMC on-shore side power is depicted in Figure 4. There is response time for power system dynamics and remaining power during the fault because of the remaining voltage. The main purpose of the proposed control strategy was absorbing as much power as possible during the fault to the DC link, but not reaching the overvoltage limit. To do this, maximum off-shore power should be calculated first. However, there is communication latency between MMC converters and response time for deloading, so those time delays should be considered.
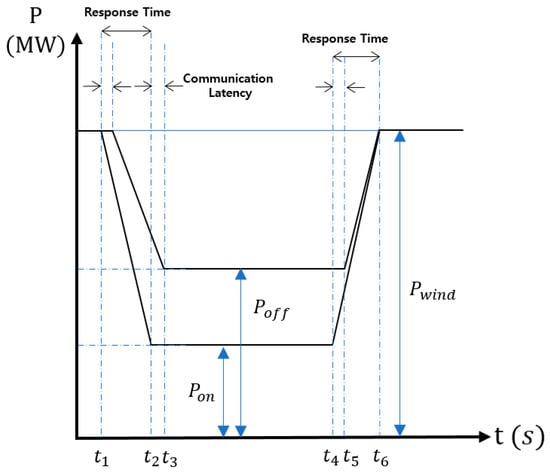
Figure 4.
Studied system model of the off-shore wind farm.
To calculate off-shore power reference , total energy during the fault should be calculated, and the energy can be calculated by summing time interval energies. The energies at each interval are expressed as:
The total energy during the fault can be calculated by summing (8)~(12):
Finally, the off-shore power reference can be calculated through (13). The proposed control strategy cannot be performed when is negative, which means too large communication latency typically above 50 ms.
If losses are considered, more power can be allocated to the HVDC. However, for safe operation, not including those losses can be a margin for not intruding into the DC overvoltage. Moreover, converter loss calculation is complicated research and outside the scope of this paper.
3.2. Voltage-Frequency Droop Control
In this paper, the proposed control took the frequency droop control by on-shore voltage. That is, when on-shore AC voltage dropped due to a disturbance, off-shore frequency rose by the droop signal. This control enabled frequency to be a medium for the global signal for a specific parameter.
where mean off-shore reference frequency, pre-set frequency, frequency control droop constant, and the frequency compensation term for DC voltage control.
3.3. Deloading by Rotor Current Droop
The deloading technique for DFIG in a fault condition was introduced in papers like [28,29,30,31]. Deloading by rising frequency is proposed in this paper. First, the stator-side frequency rose when an on-shore fault occurred, as described in Section 3.1. Then, the electromagnetic torque of the generator would be decreased as:
By Equation (18), increased frequency reduces the electrical torque of the DFIG turbine. Then, by the swing equation, rotor speed rises, and finally, mechanical torque will settle at the equilibrium point. In this case, increased and reduce the power coefficient, and thus, will also decrease. The deloading process operates automatically, which can be called a natural response. Second, the rotor-side converter (RSC) controller caught the frequency difference and reduced the q-axis current order of RSC by a preset droop. The overall control schemes and strategy is shown in Figure 5.
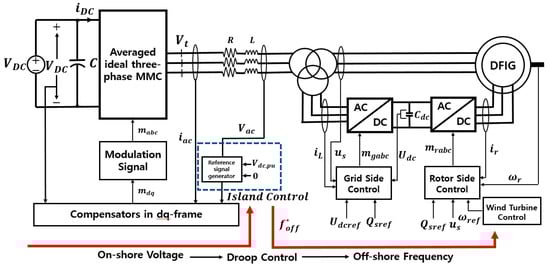
Figure 5.
Off-shore DFIG wind farm with the MMC HVDC controller scheme.
Therefore, if maximum frequency (55 Hz in this paper) was detected, the rotor current order set to zero. That is, at maximum frequency, no active power would be generated from the DFIG.
4. Simulation of the Proposed Control
To verify the effect of the proposed control strategy, an off-shore DFIG wind farm connected to the grid via an MMC HVDC system was studied. In Figure 6, the overall simulation system is depicted. For an on-shore system, the on-shore grid was expressed as an aggregated voltage source over equivalent reactance. The MMC HVDC connected the on-shore system to the off-shore wind farm. Aggregated DFIG consisted of the off-shore wind farm and RSC, and a GSC average model was used. In the proposed control strategy, a phase-shifted pulse-width modulation (PSPWM)-based MMC HVDC was used. For the DFIG system, only an outer current controller was used; an inner voltage controller was assumed to operate ideally; and an average model-based DFIG turbine was used based on a PSCAD/EMTDC program. The parameters used in simulation is described in Table 1 and Table 2.
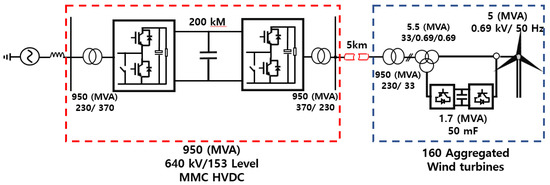
Figure 6.
Studied system model of the off-shore wind farm.

Table 1.
Parameters of the simulated DFIG system.
Table 2.
Parameters of the simulated MMC HVDC system.
4.1. Study Cases
Three different control-strategy cases were compared to verify the appropriacy of the proposed control strategy in this paper. For each case, a symmetric three-phase to ground fault on the on-shore PCC side was simulated. To satisfy the LVRT requirements of various countries, Germany and China LVRT requirements were applied in this paper [32]. The three different strategies are expressed in Table 3. Firstly, a case for a DC chopper and surge arrestor implemented system to ride through a fault was simulated. Secondly, a fast DFIG turbine deloading control strategy with a fast communication case was simulated. Finally, the proposed coordinated droop control strategy was simulated. The simulation scenarios are outlined in Table 4. For Scenario A, an on-shore-side 150-ms fault with 0.001Ω fault resistance was simulated. For Scenario B, a fault with a 2.95Ω fault resistance with the same location and fault duration was simulated. In Scenario C, the same fault location and resistance as Scenario B for a 625-ms fault duration was simulated. Finally, a 0.001Ω fault resistance case for 150 ms with a 400-MW wind turbine generation case was simulated. In Figure 6 and Figure 7, waveforms for nearly zero fault resistance are shown, and larger fault resistance case waveforms are shown in Figure 8 and Figure 9.
Table 3.
Simulation cases.
Table 4.
Simulation scenarios.
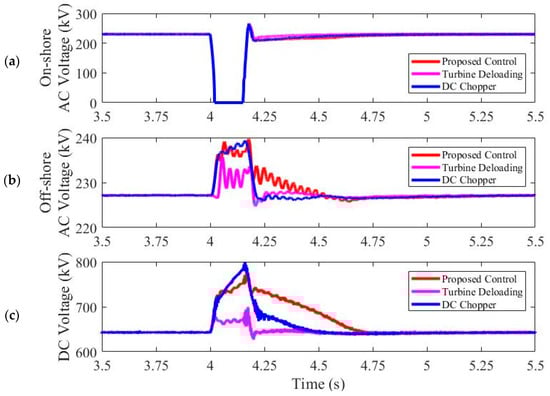
Figure 7.
Simulation results of the on-shore fault scenario with 0.001Ω fault resistance. (a) On-shore AC voltage for each simulation case. (b) Off-shore AC voltage for each simulation case. (c) Rectifier-side DC voltage for each simulation case.
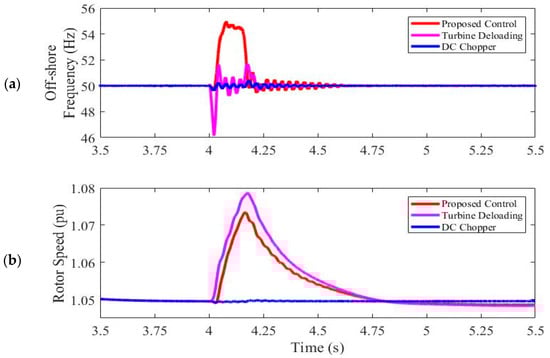
Figure 8.
Simulation results of the on-shore fault scenario with a 0.001Ω fault resistance. (a) Off-shore frequency for each simulation case. (b) DFIG rotor turbine acceleration for each simulation case.
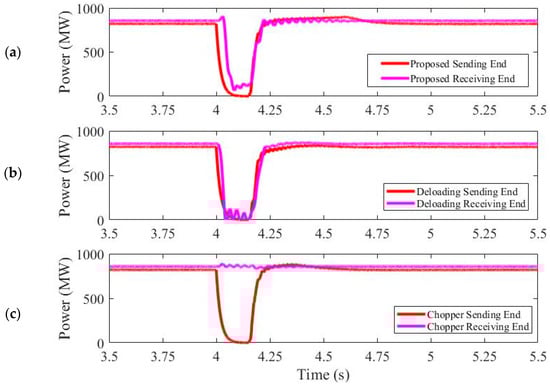
Figure 9.
Simulation results of the on-shore fault scenario with a 0.001Ω fault resistance. (a) On-shore and off-shore power with the proposed control strategy case. (b) On-shore and off-shore power with the deloading control strategy case. (c) On-shore and off-shore power with the DC chopper strategy case.
4.2. Case A: Implemented DC Chopper
The traditional FRT strategy was simulated in the simulation Case A. A 150-ms three-phase fault was simulated in the on-shore converter PCC side at t = 4 s (see Figure 6). The PCC voltage dropped to about 0 pu when the fault occurred. To ride through the fault, a DC chopper at the HVDC inverter side was operated by the DC threshold voltage. The DC voltage vibrated when the fault occurred, because the DC chopper did a chop-and-release operation on the DC side. When the DC chopper was not operating, the DC voltage went up by the power difference between the on-shore and off-shore sides. The chopper resistance (1kΩ) was implemented between the positive and negative DC sides, so power went through the DC chopper, which caused the DC voltage to decrease. Therefore, during the operating period, the DC voltage went between chopper activation and deactivation voltage (1.06~1.10 pu). For the off-shore part, the wind turbine still generated power because the DC chopper handled the surplus power, which led to rotor speed not changing in this case. Hence, the DFIG rotor did not participate in reducing the surplus power to ride through the on-shore fault. The chopper had a 500-MW chopping rating, so if unbalanced power exceeded 500-MW, it could not operate properly. This means the chopper rating must be increased.
4.3. Case B: Turbine Deloading with Fast Communication
For Case B, the same fault scenario as the deloading control case was studied. When the fault occurred, the on-shore side converter detected the AC voltage dip and communicated with the DFIG turbine to decrease the power generation. Once the on-shore low voltage was detected, the RSC converter current reference was reduced by the voltage. Finally, the DFIG electrical power was reduced by the rotor current reference of RSC. By deloading the turbine, power transferred through the off-shore converter was reduced, resulting in stabilized DC voltage. Compared to the DC chopper case, a stable DC voltage was observed in this case. The consequence of deloading was that the DFIG rotor accelerated.
4.4. Case C: Coordinated Droop Control
To minimize rotor acceleration, surplus electrical power generated from a wind turbine was stored in both the DC capacitor and the turbine rotor. The DC capacitor participated in storing surplus energy to reduce rotor acceleration by rising DC voltage. As the DC link stored surplus energy during the fault period, the DC voltage continuously rose by a certain slope until the fault terminated. By dividing surplus generated wind energy with an MMC DC capacitor, less energy was stored in the DFIG turbine rotor, and less acceleration was observed. This means that mechanical rotor torque can be minimized with MMC DC capacitor participation. In the simulation, no case showed an overvoltage at the DC side when the proposed control strategy was implemented. That is, DC voltage control did not worsen FRT capability and moreover relieved turbine acceleration stress.
4.5. Simulation Result
Four different scenarios to ride through an on-shore fault are shown in Figure 7, Figure 8, Figure 9, Figure 10, Figure 11, Figure 12, Figure 13, Figure 14, Figure 15, Figure 16, Figure 17 and Figure 18. In each case, on-shore and off-shore AC voltages and DC voltages were measured. Moreover, off-shore frequency was measured at the GSC of DFIG, and rotor speed was expressed. Finally, power from the on-shore side and off-shore side was measured in each case.
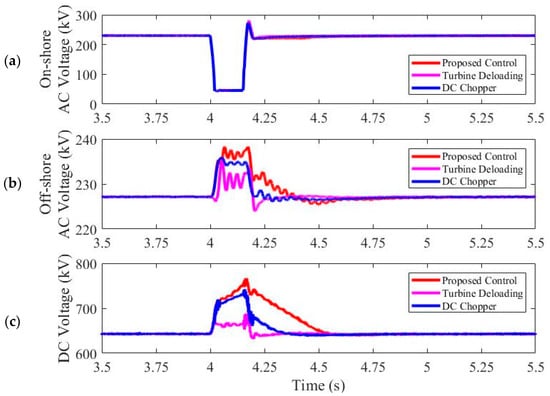
Figure 10.
Simulation results of the on-shore fault scenario with a 2.95Ω fault resistance. (a) On-shore AC voltage for each simulation case. (b) Off-shore AC voltage for each simulation case. (c) Rectifier-side DC voltage for each simulation case.
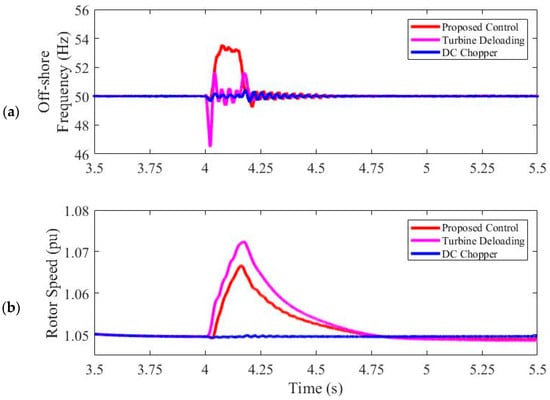
Figure 11.
Simulation results of the on-shore fault scenario with a 2.95Ω fault resistance. (a) On-shore AC voltage for each simulation case. (b) Off-shore AC voltage for each simulation case. (c) Rectifier-side DC voltage for each simulation case.
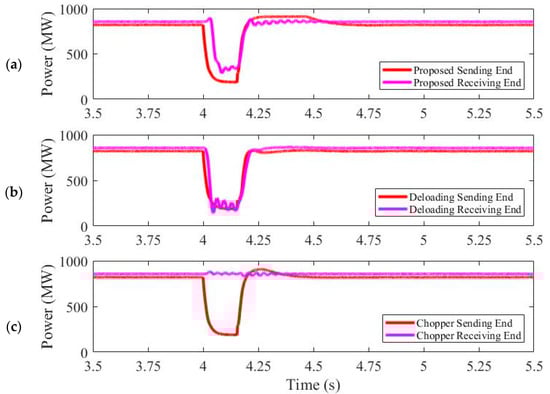
Figure 12.
Simulation results of the on-shore fault scenario with a 2.95Ω fault resistance. (a) On-shore and off-shore power with the proposed control strategy case. (b) On-shore and off-shore power with the deloading control strategy case. (c) On-shore and off-shore power with the DC chopper strategy case.
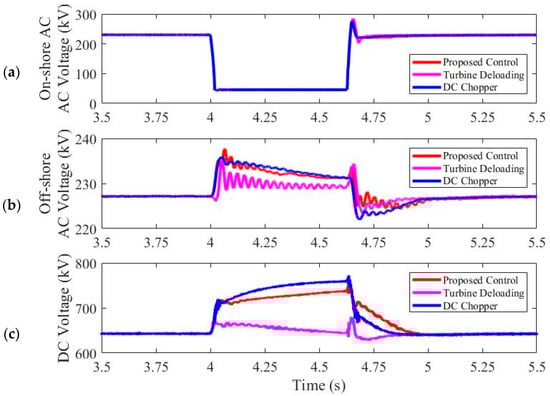
Figure 13.
Simulation results of the on-shore fault scenario with a 2.95Ω fault resistance. (a) On-shore AC voltage for each simulation case. (b) Off-shore AC voltage for each simulation case. (c) Rectifier-side DC voltage for each simulation case.
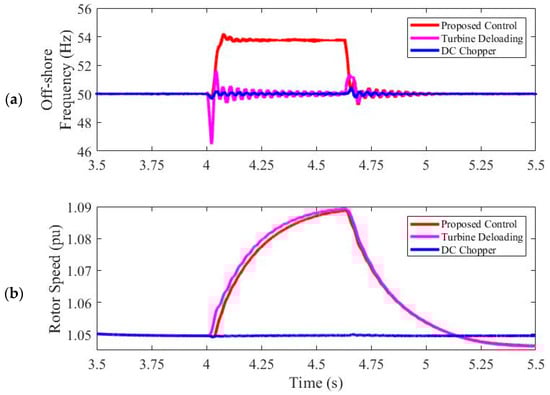
Figure 14.
Simulation results of the on-shore fault scenario with a 2.95Ω fault resistance. (a) On-shore AC voltage for each simulation case. (b) Off-shore AC voltage for each simulation case. (c) Rectifier-side DC voltage for each simulation case.
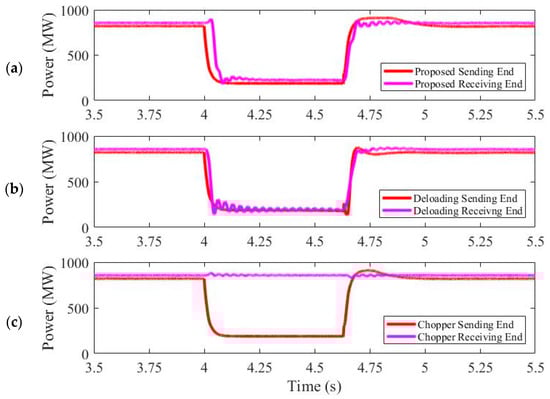
Figure 15.
Simulation results of the on-shore fault scenario with a 2.95Ω fault resistance. (a) On-shore AC voltage for each simulation case. (b) Off-shore AC voltage for each simulation case. (c) Rectifier-side DC voltage for each simulation case.
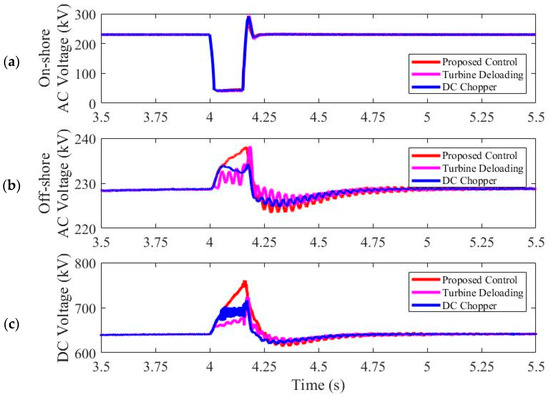
Figure 16.
Simulation results of the on-shore fault scenario with a 2.95Ω fault resistance. (a) Off-shore frequency for each simulation case. (b) DFIG rotor turbine acceleration for each simulation case. (c) Comparison of DFIG the rotor turbine speed by the participation coefficient.
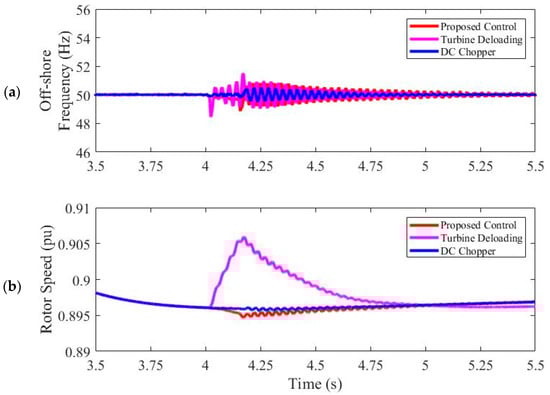
Figure 17.
Simulation results of the on-shore fault scenario with a 2.95Ω fault resistance. (a) Off-shore frequency for each simulation case. (b) DFIG rotor turbine acceleration for each simulation case. (c) Comparison of DFIG rotor turbine speed by the participation coefficient.
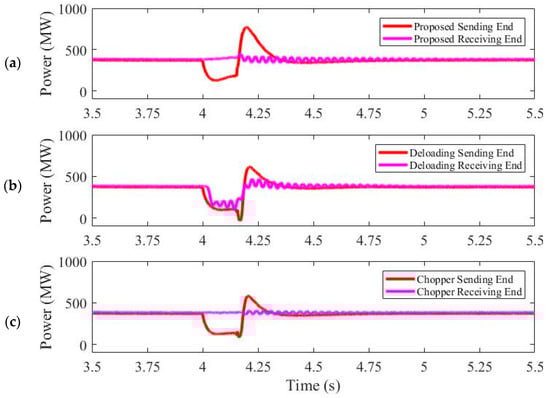
Figure 18.
Simulation results of the on-shore fault scenario with a 2.95Ω fault resistance. (a) Off-shore frequency for each simulation case. (b) DFIG rotor turbine acceleration for each simulation case. (c) Comparison of DFIG rotor turbine speed by the participation coefficient.
4.5.1. Scenario A: 150 ms On-Shore Fault with Small Fault Resistance
Figure 7, Figure 8 and Figure 9 show the simulation results of on-shore fault Scenario A. The off-shore wind turbine generated 880 MW when the fault occurred. The power difference needed to be handled to avoid DC overvoltage. The MMC HVDC decoupled the on-shore and off-shore AC grid, so the AC voltage at the off-shore did not change dramatically. In Figure 7c, DC voltage in the DC chopper case reached about 800 kV, which exceeded 1.2 pu. Therefore, the 500-MW DC chopper seemed to be small to ride through severe fault on-shore.
Figure 8 and Figure 9 show the difference between the simulation Cases B and C in Table 3. The proposed control used droop control between on-shore voltage and off-shore frequency, so time delay between power responses existed. For every case, response time for a 50-ms and a 10-ms time delay between converter communication and 20-ms GSC frequency change pickup time was applied. Because on-shore AC voltage reached about 0 pu, on-shore power showed nearly 0 MW in Scenario A. The off-shore power showed the difference between each control strategy. In Figure 9a, the proposed control strategy showed about 100 MW of power still transferred during the fault at the off-shore side. The result of this power is expressed in Figure 7c. The DC voltage in proposed control case steadily increased during the fault. However, the amount was limited, and it showed that the DC voltage did not exceed 1.2 pu. In Figure 9b, turbine deloading with fast communication is shown. Low voltage detection to turbine deloading only had a 10-ms latency, which was relatively faster than the proposed control. Because the turbine reduced the power generation rapidly, relatively stable DC voltage was observed compare to other control strategies. However, the disadvantage of the strategy was the fast turbine speed. Compared to the proposed control strategy, the turbine deloading strategy showed nearly about 0.05 pu faster turbine speed.
4.5.2. Scenario B: 150 ms On-Shore Fault with Relatively Large Fault Resistance
Scenario B showed relatively similar simulation results as Scenario A in Figure 10, Figure 11 and Figure 12, but there existed on-shore power, so the deloading power and chopping power were reduced. In this case, DC voltage in the DC chopper case showed about a 770-kV DC voltage, which was acceptable for a 500-MW chopper.
4.5.3. Scenario C: 625 ms Fault with Relatively Large Fault Resistance
The LVRT code varies for countries, so the requirement varies in two ways. Some countries require to ride through a longer fault. To the authors’ knowledge, the wind farm plant should not be tripped for 0.2 pu on-shore voltage up to 625 ms. Figure 13, Figure 14 and Figure 15 shows the result for a longer fault. In Figure 13, on-shore and off-shore AC voltage and DC voltage are shown. The DC voltage in Figure 13c shows that each FRT strategy worked well. For each strategy, the DC voltage stayed within the DC voltage limit. Off-shore frequency and rotor speed are shown in Figure 14, and they also tell us that the FRT strategy worked well. However, in Figure 14b, little difference is observed between Cases B and C. This is because the total amount of unbalanced energy during the fault was much larger than the previous scenarios. The total amount of absorbable energy of the DC link was limited and the ratio of increased unbalanced energy and absorbable energy made the difference. Therefore, the proposed control strategy was effective in the shorter, but severe fault case than the longer fault, and it would be very effective when the ratio of unbalanced energy and absorbable energy is small.
4.5.4. Scenario D: 150 ms Fault with Small Fault Resistance and Low Power Generation
As the proposed strategy was effective at a low ratio of unbalanced energy with absorbable energy, one can assume the proposed strategy was more effective in the low wind power case. Figure 16, Figure 17 and Figure 18 show the simulation results in the low power generation case. In Figure 16, no DC overvoltage is observed, and in Figure 17b, there is no wind turbine acceleration. This means no turbine deloading at all was conducted in this case. That is to say, the DC link itself entirely handled the on-shore 150-ms fault. In Figure 18, the input and output power of HVDC is expressed, and in Figure 18a, the output power from the wind turbine is not reduced during the fault. This can explain why the turbine rotor speed did not change in Figure 17b. Moreover, comparing Figure 18a,c, power from the sending end after the fault was different. This was the power stored in the DC link, and it can be used to restore frequency after a fault.
5. Conclusions
In this paper, an advanced FRT strategy was proposed. To ride through an on-shore fault without operation of a DC chopper or crowbar, control of the DC voltage by unbalancing input and output power and the stored kinetic energy of a wind turbine rotor was implemented. For deloading DFIG and transferring FRT signals to a wind farm, on-shore voltage to off-shore frequency droop was used. Finally, to minimize rotor acceleration, calculation of the maximum absorbable power in the DC link voltage was analyzed. With these coordinated control strategies, an on-shore fault can be ridden through with no DC overvoltage. Moreover, by the DC capacitor storage of energy, the rotor acceleration can be minimized. Through four scenarios, the superiority of the proposed control was verified. According to the voltage dip scale, the proposed control strategy can cope with varying on-shore voltage by calculating the deloading turbine power. By the duration of fault, the effectiveness of the proposed control was clearly shown in the short fault duration, but for longer faults, the output of the turbine deloading strategy and proposed control seemed similar. The main difference between turbine deloading and the proposed control was the minimization of turbine acceleration during the fault. In low power generation case, no turbine acceleration was observed. Especially, the proposed control method can have a significant effect in FRT depending on the ratio of power imbalance versus the absorbable power of the HVDC system and supposed to be utilized for stable operation of highly implemented wind farms.
Author Contributions
Conceptualization, Y.Y. and J.L.; validation, G.J. and M.Y.; data curation. J.L. and M.Y.; investigation, J.L. and Y.Y.; methodology, G.J. and M.Y.; writing, original draft, J.L.; writing, review and editing, G.J. and Y.Y.
Funding
This research received no external funding.
Acknowledgments
This work was supported under the framework of the international cooperation program managed by the National Research Foundation of Korea (No. 2017K1A4A3013579) and the Human Resources Program in Energy Technology of the Korean Institute of Energy Technology Evaluation and Planning (KETEP) financial resources granted by the Ministry of Trade, Industry & Energy, Republic of Korea (No. 20174030201540).
Conflicts of Interest
The authors declare no conflict of interest.
References
- GWEC: Global Wind Report. 2017. Available online: http://files.gwec.net/files/GWR2016.pdf (accessed on 26 January 2019).
- Makarov, Y.V.; Etingov, P.V. Analysis Methodology for Balancing Authority Cooperation in High Penetration of Variable Generation, February 2010. Available online: http://www.osti.gov/scitech/servlets/.purl/974955 (accessed on 7 March 2019).
- Kim, S.; Lee, H.; Kim, H.; Jang, D.-H.; Kim, H.-J.; Hur, J.; Cho, Y.-S.; Hur, K. Improvement in policy and proactive interconnection procedure for renewable energy expansion in South Korea. Renew. Sustain. Energy Rev. 2018, 98, 150–162. [Google Scholar] [CrossRef]
- Bergna, G.; Berne, E.; Egrot, P.; Lefranc, P.; Arzande, A.; Vannier, J.-C.; Molinas, M. An energy-based controller for HVDC modular multilevel converter in decoupled double synchronous reference frame for voltage oscillation reduction. IEEE Trans. Ind. Electron. 2013, 60, 2360–2371. [Google Scholar] [CrossRef]
- Saeedifard, M.; Iravani, R. Dynamic performance of a modular multilevel back-to-back HVDC system. IEEE Trans. Power Deliv. 2010, 25, 2903–2912. [Google Scholar] [CrossRef]
- Tsili, M.; Papathanassiou, S. A review of grid code technical requirements for wind farms. IET Renew. Power Gener. 2009, 3, 308–332. [Google Scholar] [CrossRef]
- Mohseni, M.; Islam, S.M. Review of international grid codes for wind power integration: Diversity, technology and a case for global standard. Renew. Sustain. Energy Rev. 2012, 16, 3876–3890. [Google Scholar] [CrossRef]
- Li-ling, S.; Pu, Y.; Yi, W. Simulation research for LVRT of DFIG based on rotor active crowbar protection. In Proceedings of the International Conference on Sustainable Power Generation and Supply (SUPERGEN 2012), Hangzhou, China, 8–9 September 2012. [Google Scholar]
- Fei, G.; An-cheng, X.; Shi, S.; Ping, L.; Yu-tin, Y. Research on the improvement of LVRT ability of an actual DFIG-type wind farm with Crowbar and SVG. In Proceedings of the International Conference on Renewable Power Generation (RPG 2015), Beijing, China, 17–18 October 2015. [Google Scholar]
- Naderi, S.B.; Negnevitsky, M.; Muttaqi, K.M. A modified DC chopper for limiting the fault current and controlling the DC link voltage to enhance ride-through capability of doubly-fed induction generator based wind turbine. In Proceedings of the 2017 IEEE Industry Applications Society Annual Meeting, Cincinnati, OH, USA, 1–5 October 2017; pp. 1–8. [Google Scholar]
- Yang, L.; Xu, Z.; Ostergaard, J.; Dong, Z.Y.; Wong, K.P. Advanced control strategy of DFIG wind turbines for power system fault ride through. IEEE Trans. Power Syst. 2012, 27, 713–722. [Google Scholar] [CrossRef]
- Wang, D.; Gao, X.; Meng, K.; Qiu, J.; Lai, L.L.; Gao, S. Utilisation of kinetic energy from wind turbine for grid connections: A review paper. IET Renew. Power Gener. 2018, 12, 615–624. [Google Scholar] [CrossRef]
- Ramtharan, G.; Arulampalam, A.; Ekanayake, J.B.; Hughes, F.; Jenkins, N. Fault ride through of fully rated converter wind turbines with AC and DC transmission systems. IET Renew. Power Gener. 2009, 3, 426–438. [Google Scholar] [CrossRef]
- Silva, B.; Moreira, C.L.; Leite, H.; Lopes, J.P. Control strategies for AC fault ride through in multiterminal HVDC grids. IEEE Trans. Power Deliv. 2014, 29, 395–405. [Google Scholar] [CrossRef]
- Honrubia-Escribano, A.; Gomez-Lazaro, E.; Fortmann, J.; Sørensen, P.; Martin-Martinez, S. Generic dynamic wind turbine models for power system stability analysis: A comprehensive review. Renew. Sustain. Energy Rev. 2018, 81, 1939–1952. [Google Scholar] [CrossRef]
- Miller, A.; Muljadi, E.; Zinger, D.S. A variable speed wind turbine power control. IEEE Trans. Energy Convers. 1997, 12, 181–186. [Google Scholar] [CrossRef]
- Yaramasu, V.; Wu, B.; Sen, P.C.; Kouro, S.; Narimani, M. High-power wind energy conversion systems: State-of-the-art and emerging technologies. Proc. IEEE 2015, 103, 740–788. [Google Scholar] [CrossRef]
- Yazdani, A.; Iravani, R. Voltage-Sourced Converters in Power Systems: Modeling, Control, and Applications; John Wiley & Sons: Hoboken, NJ, USA, 2010; pp. 217–223. [Google Scholar]
- Batista, R.C.; Nicolini, A.M.; Carnielutti, F.D.M.; Pinheiro, H. Analysis of modular multilevel converters for HVDC connection of off-shore wind power plants. In Proceedings of the 2017 Brazilian Power Electronics Conference (COBEP), Juiz de Fora, Brazil, 19–22 November 2017; pp. 1–7. [Google Scholar]
- Hu, X.; Liang, J.; Rogers, D.J.; Li, Y. Power flow and power reduction control using variable frequency of off-shore AC grids. IEEE Trans. Power Syst. 2013, 28, 3897–3905. [Google Scholar] [CrossRef]
- Shinoda, K.; Benchaib, A.; Dai, J.; Guillaud, X. DC voltage control of MMC-based HVDC grid with Virtual Capacitor Control. In Proceedings of the 2017 19th European Conference on Power Electronics and Applications (EPE’17 ECCE Europe), Warsaw, Poland, 11–14 September 2017; pp. 1–10. [Google Scholar]
- Silva, B.M.A. Multi-Terminal HVDC Grids: Control Strategies for Ancillary Services Provision in Interconnected Transmission Systems with Off-Shore Wind Farms. Ph.D. Thesis, Universidade de Porto, Porto, Portugal, 2014. [Google Scholar]
- Yoon-su, N. Wind Turbine System Control; GS Intervision: Seoul, Korea, 2013; pp. 352–365. [Google Scholar]
- Blasco-Gimenez, R.; Ano-Villalba, S.; Rodríguez-D’Derlée, J.; Morant, F.; Bernal-Perez, S. Distributed voltage and frequency control of off-shore wind farms connected with a diode-based HVdc link. IEEE Trans. Power Electron. 2010, 25, 3095–3105. [Google Scholar] [CrossRef]
- Zhou, K.; Fu, X.; Cheng, M.; Zhu, X.; Wang, W.; Wang, T. Topologies and control of VSC-HVDC systems for grid connection of large-scale off-shore wind farms. In Proceedings of the 2008 International Conference on Electrical Machines and Systems, Wuhan, China, 17–20 October 2008; pp. 2357–2361. [Google Scholar]
- Iván, A.A.; Ruben, P.G.; Blasco-Gimenez, R.; Javier, R.A. Control strategy of a HVDC-Diode Rectifier connected type-4 off-shore wind farm. In Proceedings of the 2015 IEEE 2nd International Future Energy Electronics Conference (IFEEC), Taipei, Taiwan, 1–4 November 2015; pp. 1–6. [Google Scholar]
- Gui, Y.; Kim, C.; Chung, C.C. Temporary primary frequency control support by deloaded wind power plant using input-output linearization. In Proceedings of the 2016 16th International Conference on Control, Automation and Systems (ICCAS), Gyeongju, Korea, 16–19 October 2016; pp. 1467–1469. [Google Scholar]
- De Almeida, R.G.; Castronuovo, E.D.; Lopes, J.P. Optimum generation control in wind parks when carrying out system operator requests. IEEE Trans. Power Syst. 2006, 21, 718–725. [Google Scholar] [CrossRef]
- Holdsworth, L.; Ekanayake, J.B.; Jenkins, N. Power system frequency response from fixed speed and doubly fed induction generator-based wind turbines. Wind Energy Int. J. Prog. Appl. Wind Power Convers. Technol. 2004, 7, 21–35. [Google Scholar] [CrossRef]
- Sakamuri, J.N.; Altin, M.; Hansen, A.D.; Cutululis, N.A.; Rather, Z.H. Coordinated control scheme for ancillary services from off-shore wind power plants to AC and DC grids. In Proceedings of the 2016 IEEE Power and Energy Society General Meeting (PESGM), Boston, MA, USA, 17–21 July 2016; pp. 1–5. [Google Scholar]
- Fernández, L.M.; Jurado, F.; Saenz, J.R. Aggregated dynamic model for wind farms with doubly fed induction generator wind turbines. Renew. Energy 2008, 33, 129–140. [Google Scholar] [CrossRef]
- Bak, Y.; Lee, J.-S.; Lee, K.-B. Low-voltage ride-through control strategy for a grid-connected energy storage system. Appl. Sci. 2018, 8, 57. [Google Scholar] [CrossRef]
© 2019 by the authors. Licensee MDPI, Basel, Switzerland. This article is an open access article distributed under the terms and conditions of the Creative Commons Attribution (CC BY) license (http://creativecommons.org/licenses/by/4.0/).