Tracking the Movements of Juvenile Chinook Salmon using an Autonomous Underwater Vehicle under Payload Control


Abstract
Featured Application
Abstract
1. Introduction
2. Materials and Methods
2.1. Study Area
2.2. Fish Tagging
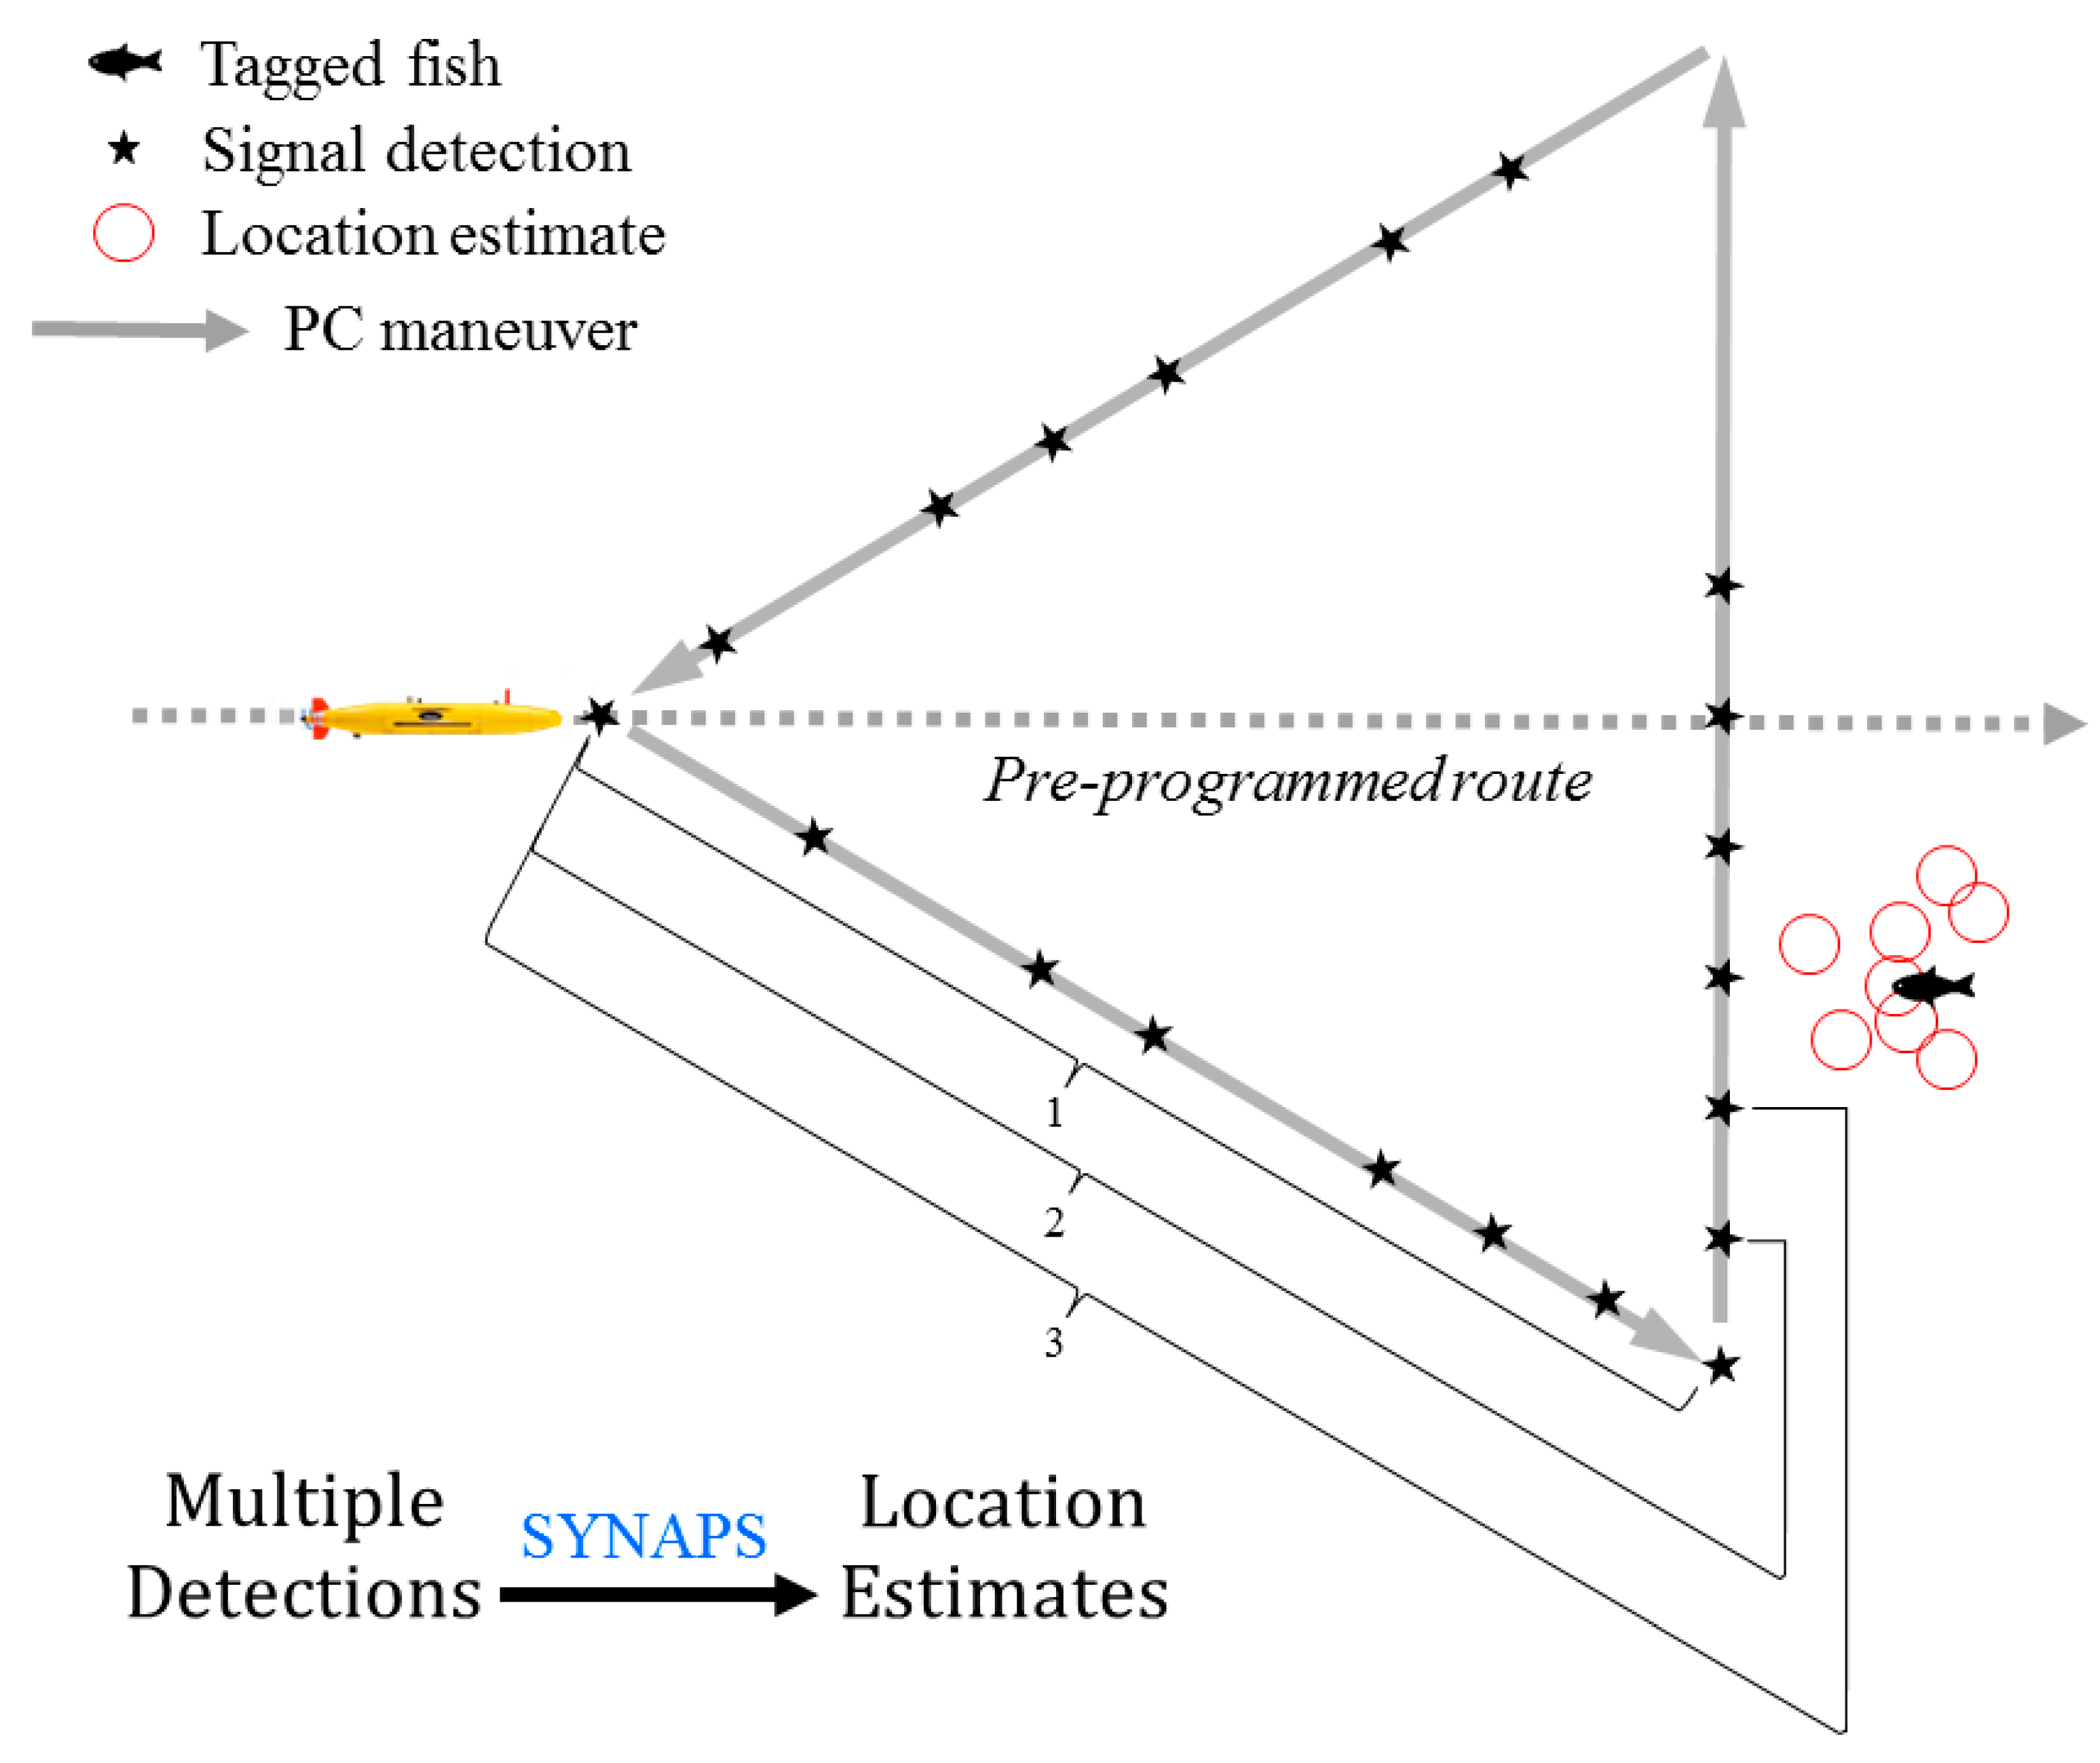
2.3. Fish Tracking
3. Results
3.1. Fish Tagging
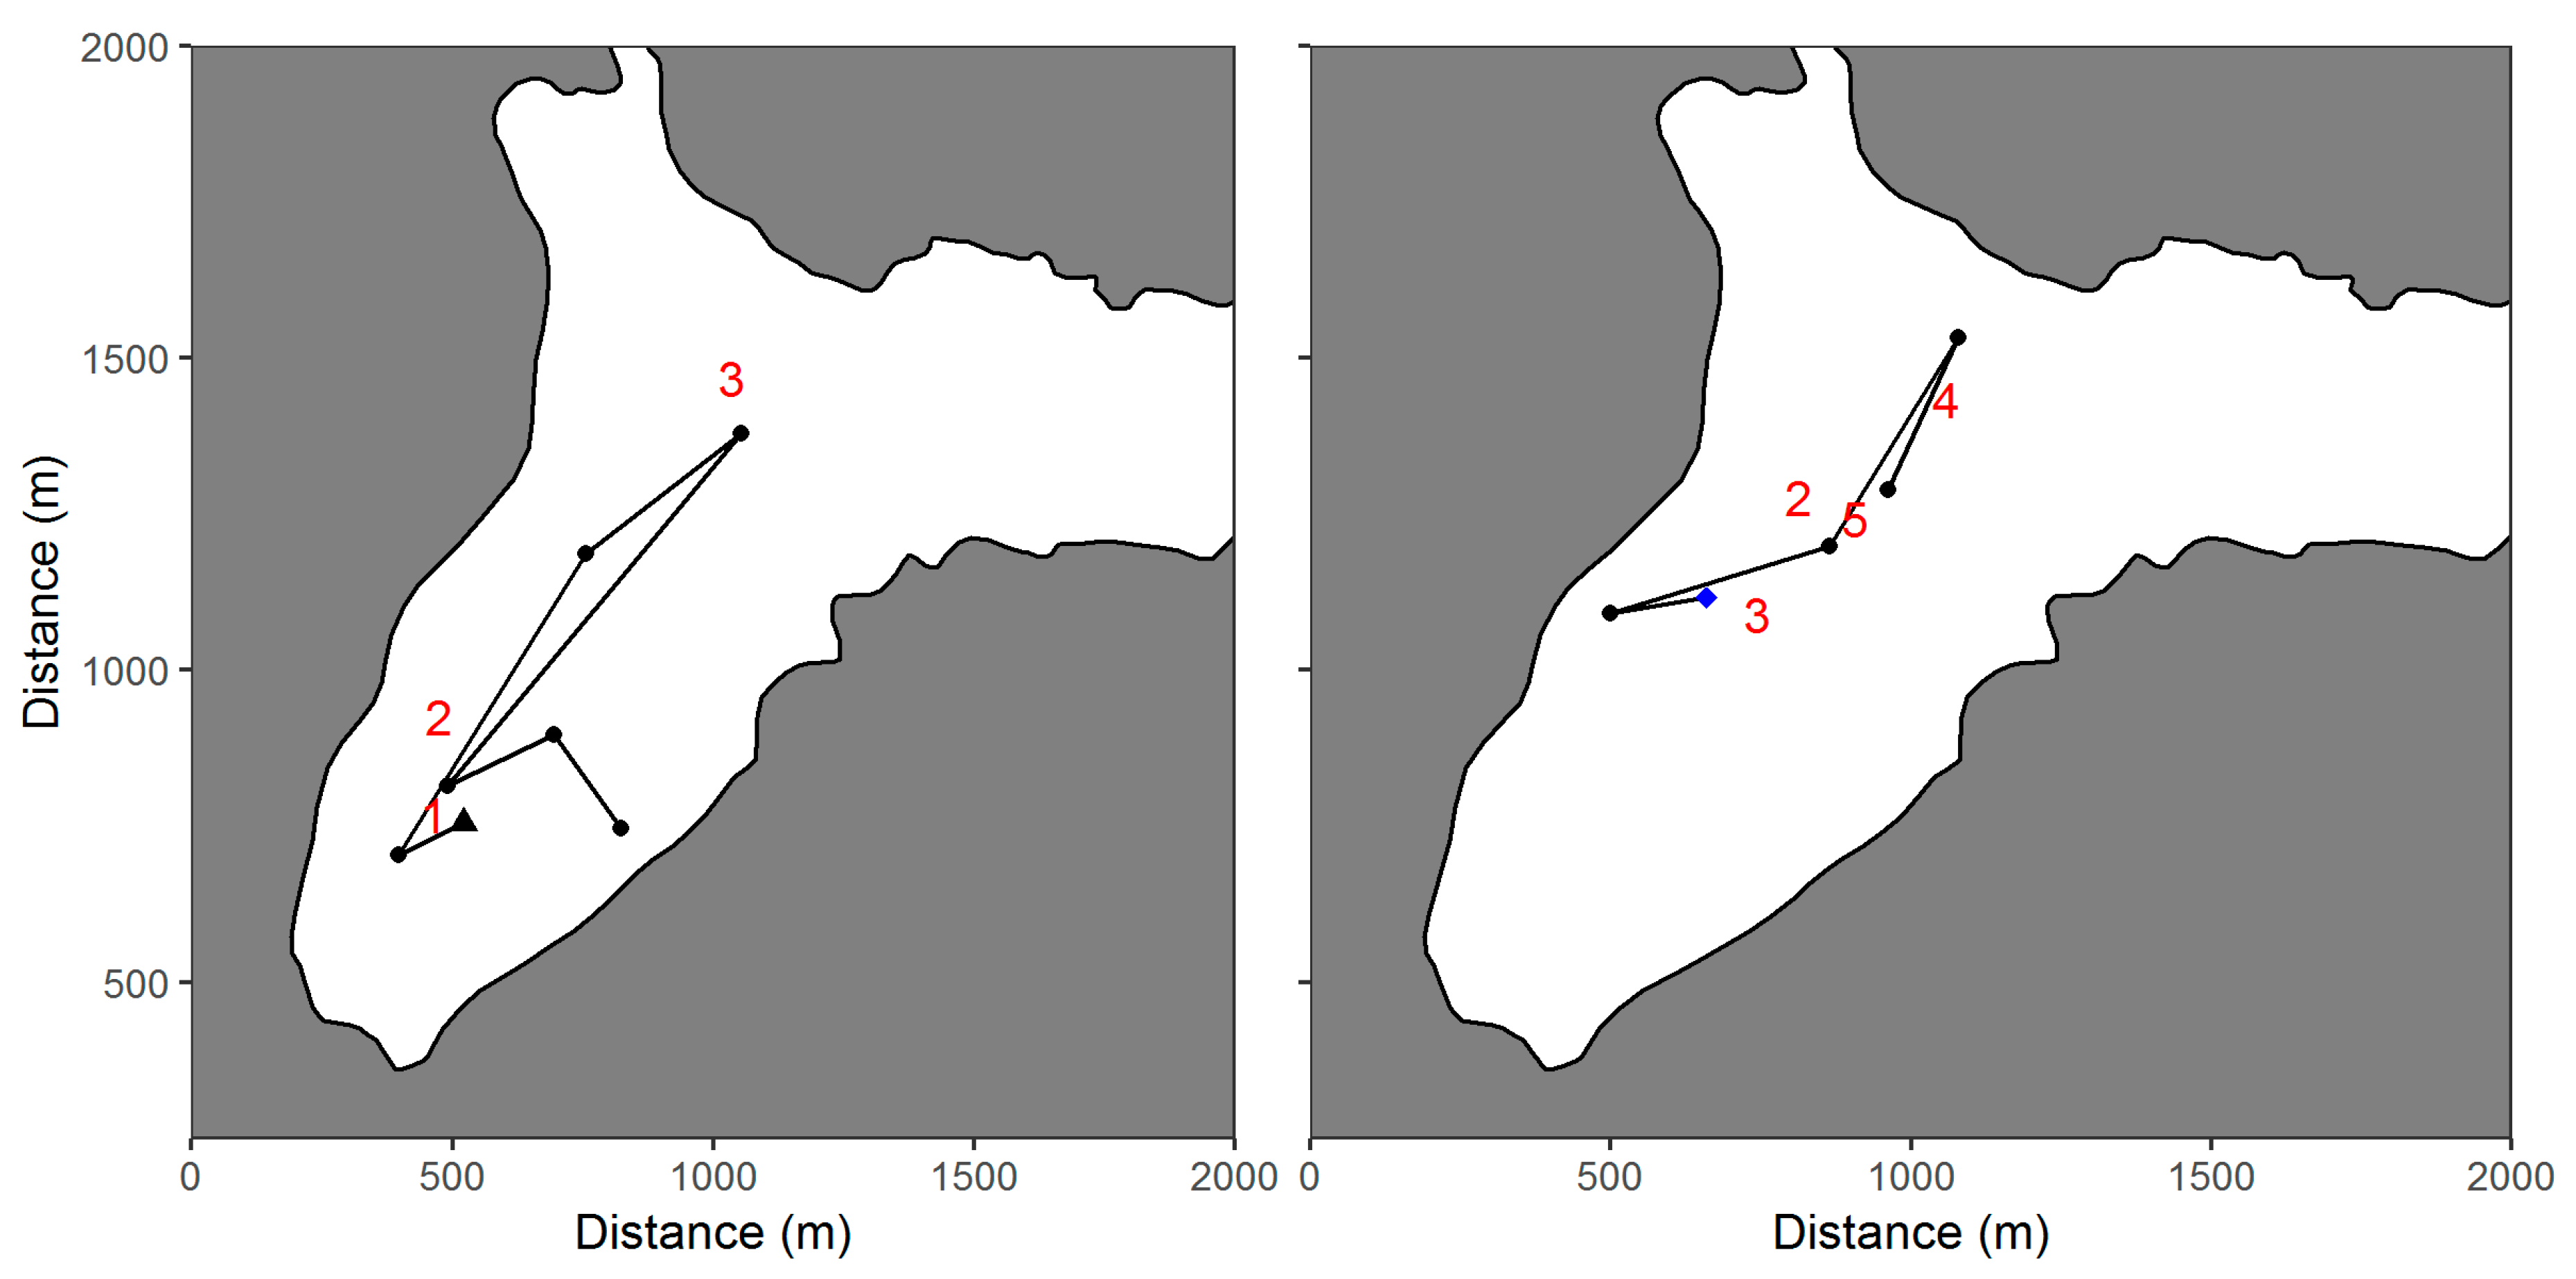
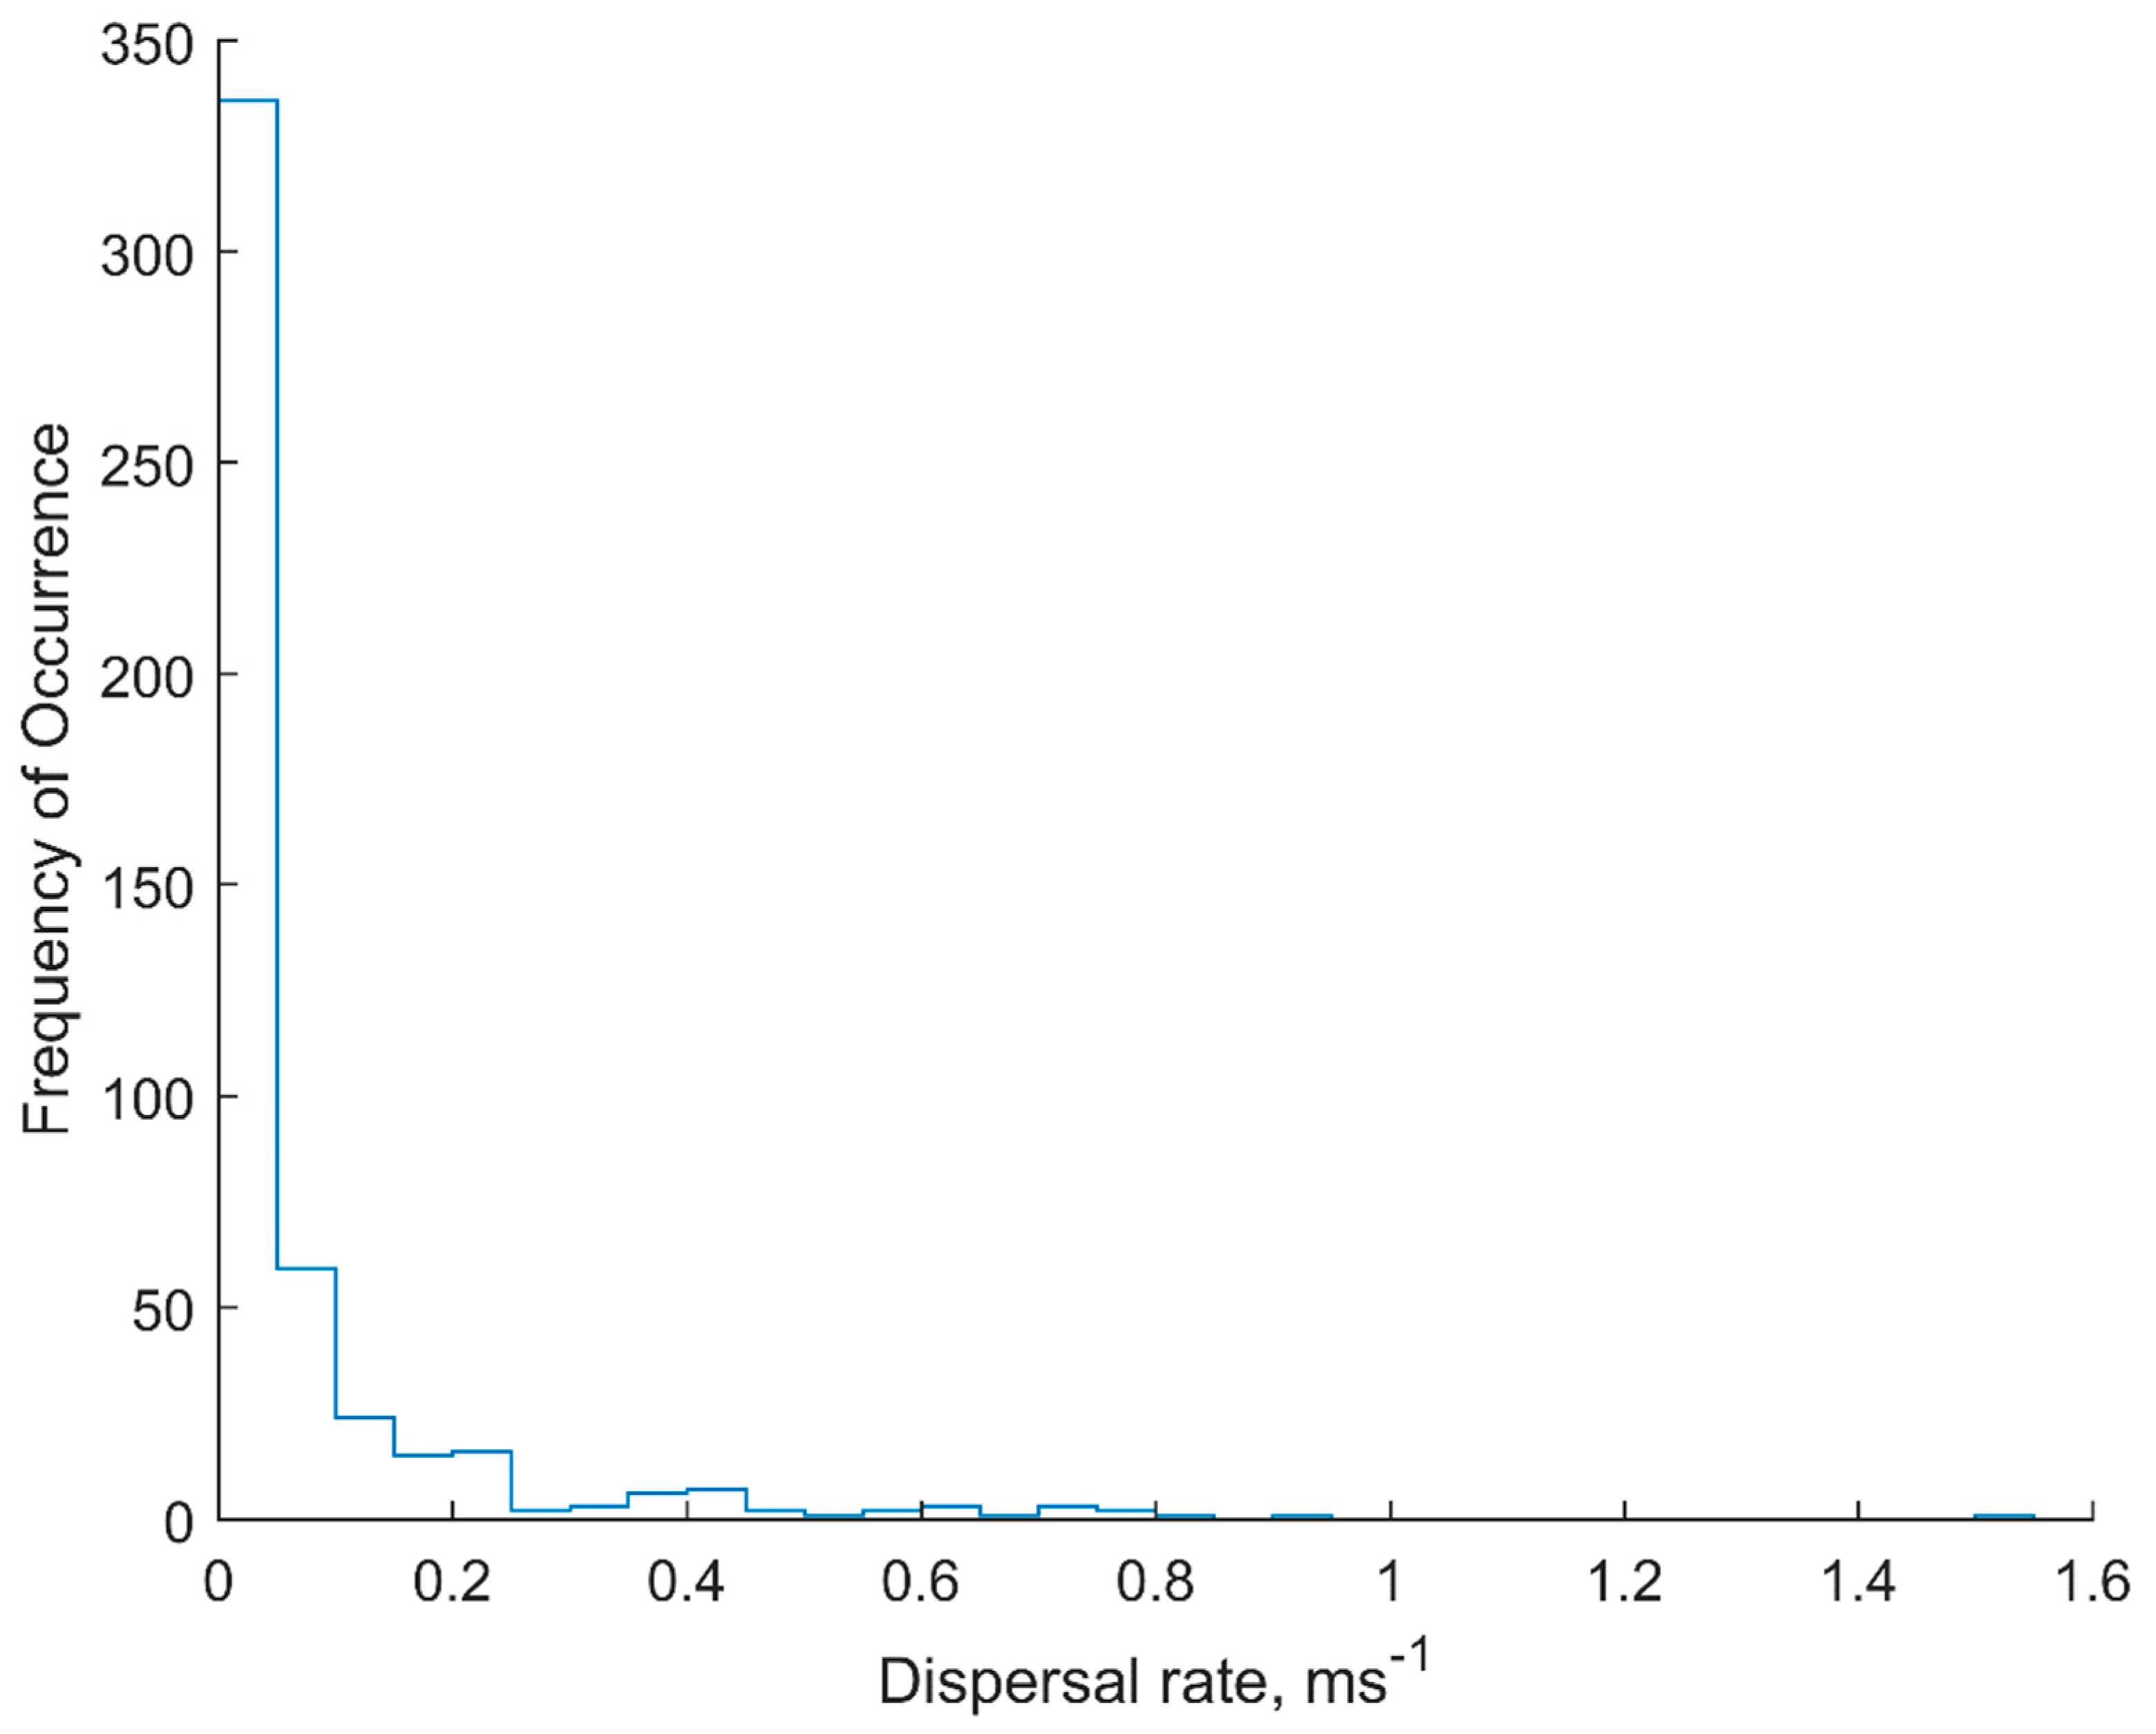
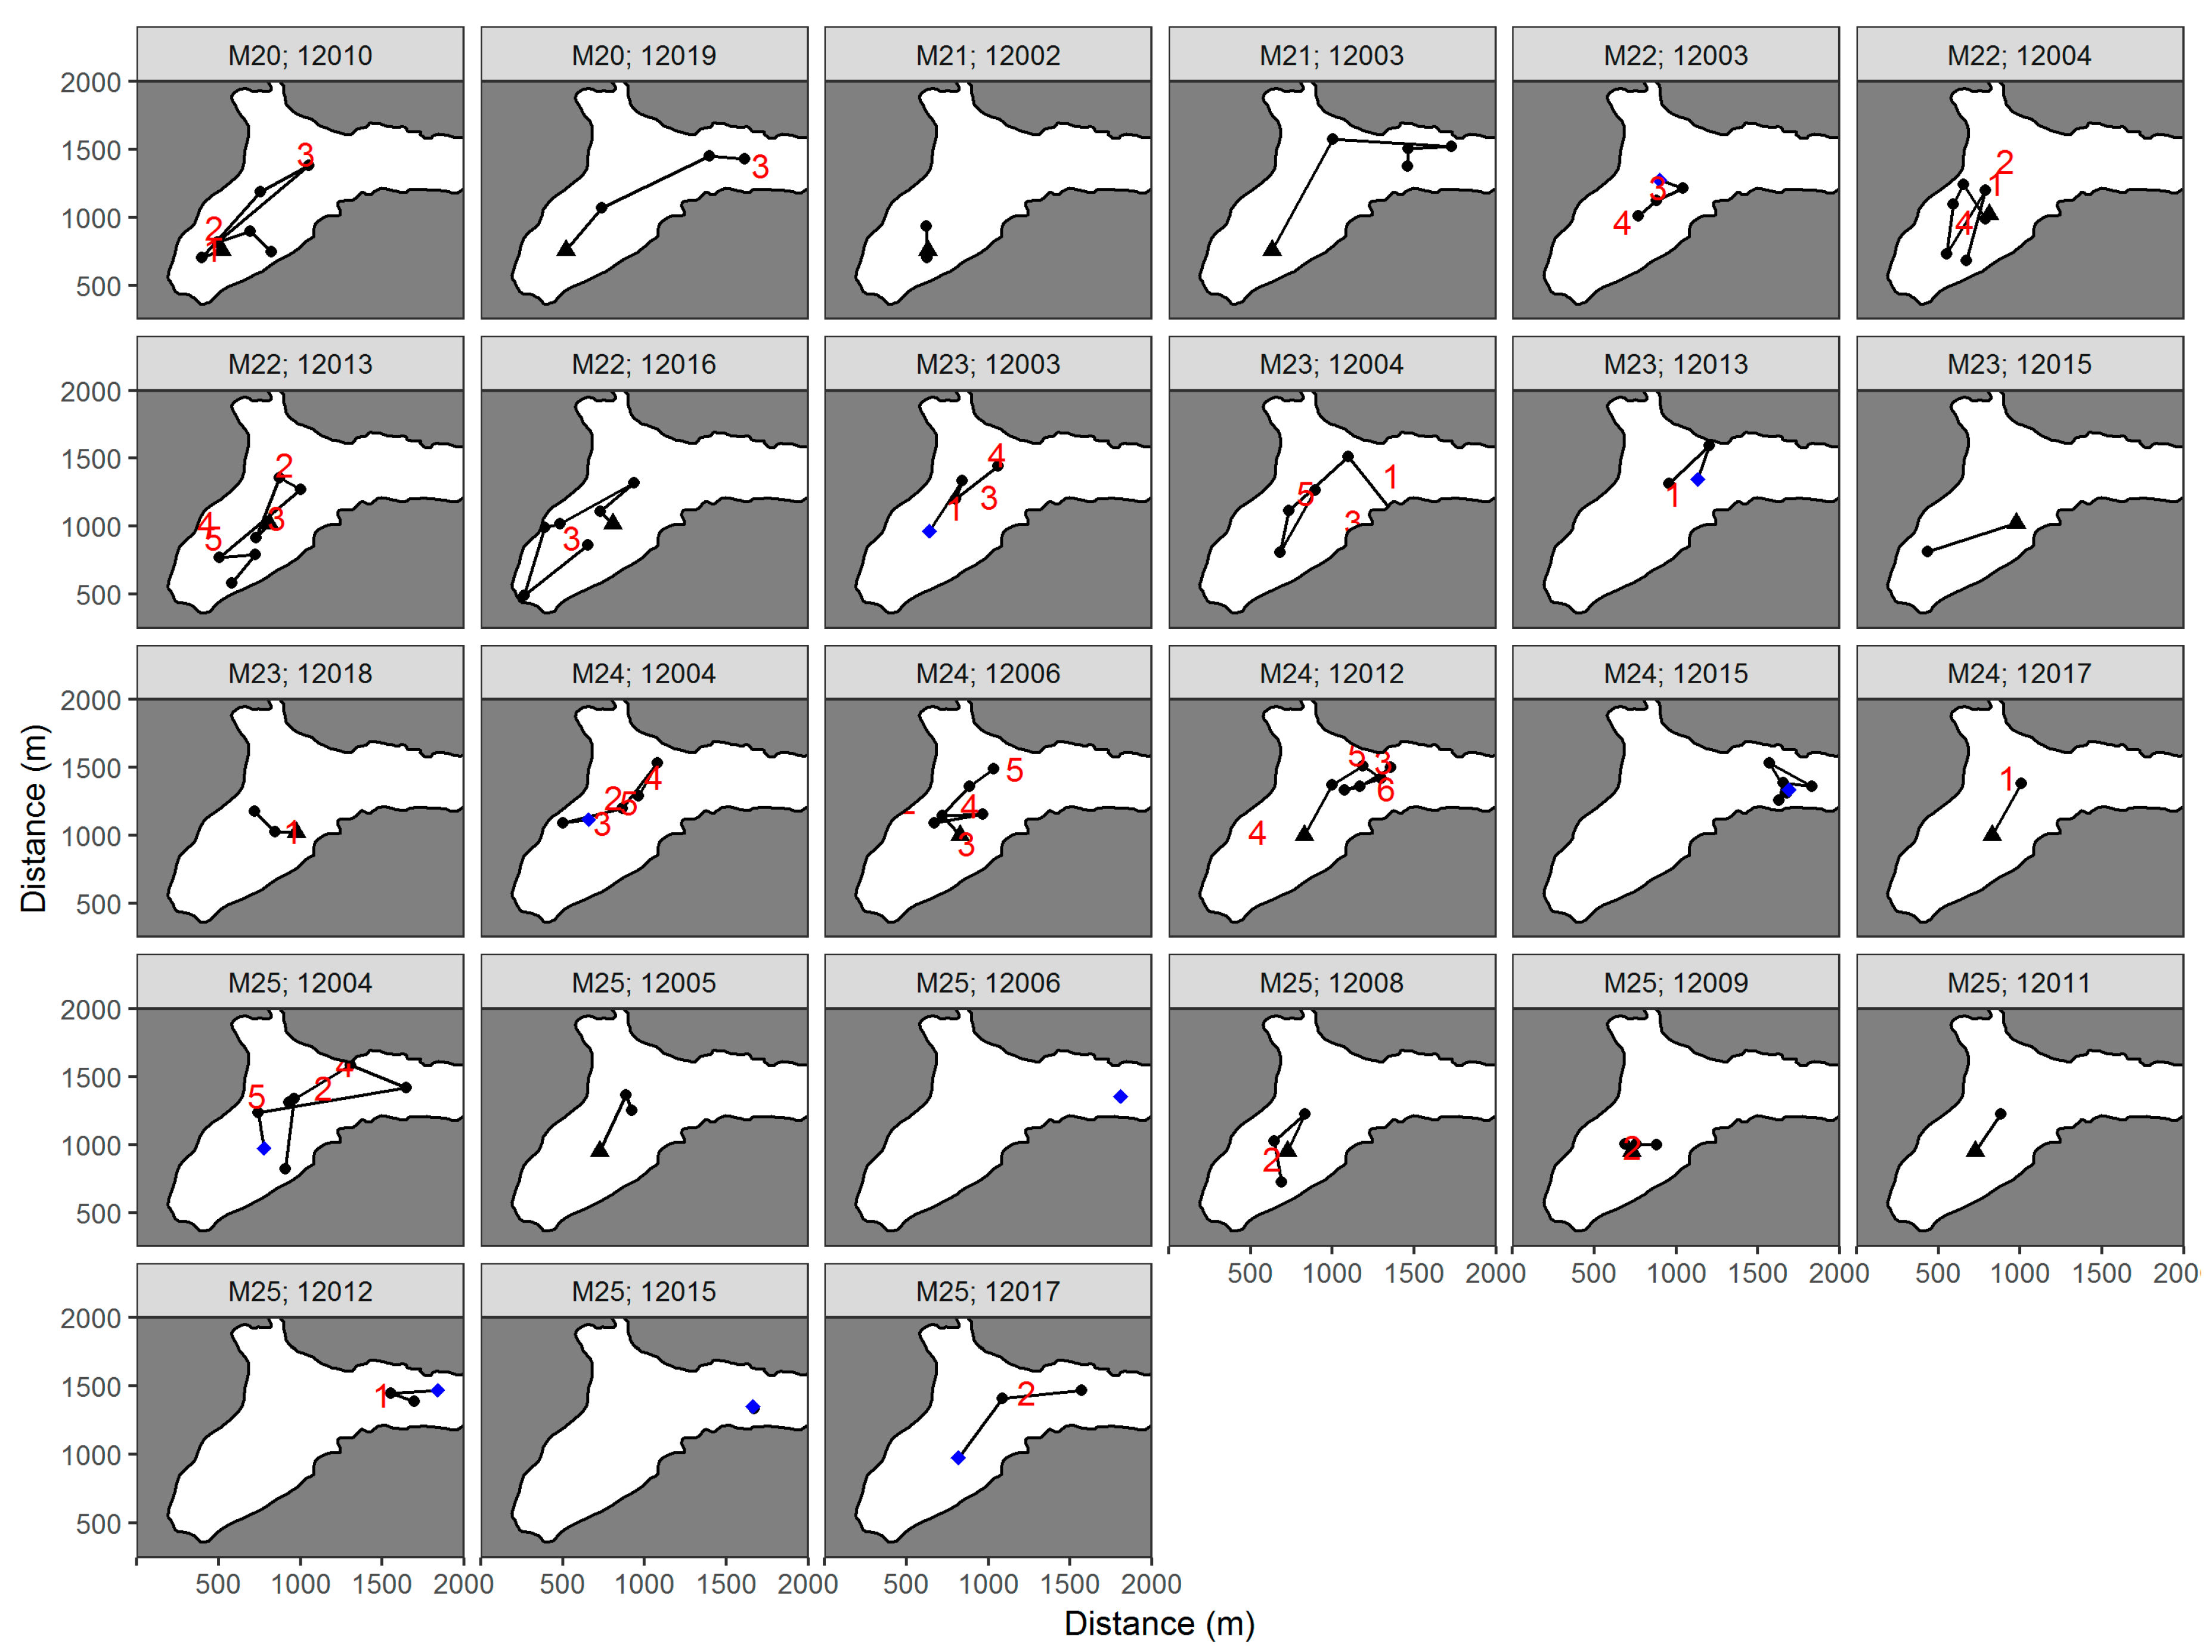
3.2. Survey Missions
4. Discussion
5. Conclusions
Author Contributions
Funding
Acknowledgments
Conflicts of Interest
Appendix A

Appendix B

Appendix C

Appendix D

| Previous | Time of Location | Resid | Location | ||||||
|---|---|---|---|---|---|---|---|---|---|
| Area | Mission | Fish ID | Release | AUV | Vessel | Offset | AUV | Vessel | Sequence 1 |
| BPW | M20 | 12010 | -- | 13:43 | 13:48 | 5:00 | 5.8 | 6.3 | 1 |
| 14:35 | 14:37 | 2:00 | 6.0 | 26.1 | 2 | ||||
| 15:01 | 15:05 | 4:00 | 6.8 | 5.6 | 3 | ||||
| 15:59 | 4.5 | ||||||||
| 16:45 | 5.1 | ||||||||
| 17:41 | 5.1 | ||||||||
| BPW | M20 | 12019 | -- | 14:33 | 4.6 | ||||
| 15:07 | 5.1 | ||||||||
| 15:15 | 15:25 | 10:00 | 6.1 | 8.0 | 3 | ||||
| BPW | M21 | 12002 | -- | 14:02 | 5.4 | ||||
| 14:16 | 5.0 | ||||||||
| BPW | M21 | 12003 | -- | 13:37 | 4.9 | ||||
| 14:42 | 14:44 | 2:00 | 5.2 | 4.5 | 2 | ||||
| 14:52 | 4.8 | ||||||||
| 14:58 | 4.5 | ||||||||
| BPW | M22 | 12003 | M21 | 10:30 | |||||
| 11:31 | |||||||||
| 12:03 | 12:07 | 4:00 | 6.1 | 7.3 | 3 | ||||
| 12:40 | 12:40 | 0:00 | 5.3 | 8.8 | 4 | ||||
| BPW | M22 | 12004 | -- | 9:52 | 9:48 | 4:00 | 5.8 | 7.2 | 1 |
| 9:58 | 10:01 | 3:00 | 5.9 | 5.2 | 2 | ||||
| 10:41 | 5.1 | ||||||||
| 10:50 | 10:51 | 1:00 | 5.0 | 5.5 | 4 | ||||
| 11:30 | 6.7 | ||||||||
| 11:46 | 5.9 | ||||||||
| BPW | M22 | 12013 | -- | 9:51 | 6.7 | ||||
| 10:00 | 10:08 | 8:00 | 6.1 | 11.6 | 2 | ||||
| 10:33 | 10:38 | 5:00 | 6.3 | 6.7 | 3 | ||||
| 10:49 | 10:54 | 5:00 | 4.3 | 6.8 | 4 | ||||
| 11:42 | 11:46 | 4:00 | 4.9 | 8.0 | 5 | ||||
| 11:53 | 5.4 | ||||||||
| BPW | M22 | 12016 | -- | 9:52 | 4.7 | ||||
| 10:33 | 4.2 | ||||||||
| 10:53 | 10:53 | 0:00 | 5.1 | 5.6 | 3 | ||||
| 11:41 | 5.6 | ||||||||
| 11:52 | 5.4 | ||||||||
| 12:42 | 4.1 | ||||||||
| BPW | M23 | 12003 | M21 | 15:22 | 15:39 | 17:00 | 7.0 | 4.5 | 1 |
| 16:29 | 4.3 | ||||||||
| 16:48 | 16:52 | 4:00 | 5.1 | 8.0 | 3 | ||||
| 18:04 | 18:06 | 2:00 | 4.9 | 4.9 | 4 | ||||
| BPW | M23 | 12004 | M22 | 15:52 | 15:58 | 6:00 | 6.5 | 12.1 | 1 |
| 16:23 | 4.3 | ||||||||
| 16:44 | 16:51 | 7:00 | 5.0 | 5.1 | 3 | ||||
| 17:33 | 5.9 | ||||||||
| 18:12 | 18:12 | 0:00 | 5.7 | 7.0 | 5 | ||||
| BPW | M23 | 12013 | M22 | 15:52 | 15:53 | 1:00 | 5.3 | 6.6 | 1 |
| 16:20 | 4.9 | ||||||||
| 16:30 | 6.2 | ||||||||
| BPW | M23 | 12015 | -- | 16:48 | 6.6 | ||||
| BPW | M23 | 12018 | -- | 15:36 | 15:36 | 0:00 | 5.9 | 8.1 | 1 |
| 15:45 | 5.9 | ||||||||
| BPW | M24 | 12004 | M22 | 9:40 | 5.1 | ||||
| 9:45 | 9:47 | 2:00 | 5.2 | 16.4 | 2 | ||||
| 10:35 | 10:37 | 2:00 | 5.4 | 9.9 | 3 | ||||
| 11:35 | 11:37 | 2:00 | 5.7 | 4.2 | 4 | ||||
| 12:03 | 12:06 | 3:00 | 4.6 | 8.8 | 5 | ||||
| BPW | M24 | 12006 | -- | 9:45 | 4.6 | ||||
| 10:30 | 10:37 | 7:00 | 5.8 | 10.3 | 2 | ||||
| 10:51 | 10:50 | 1:00 | 5.0 | 6.9 | 3 | ||||
| 11:42 | 11:44 | 2:00 | 4.9 | 11.3 | 4 | ||||
| 12:10 | 12:13 | 3:00 | 5.9 | 6.2 | 5 | ||||
| BPW | M24 | 12012 | -- | 9:54 | 4.9 | ||||
| 10:00 | 10:05 | 5:00 | 5.5 | 12.3 | 2 | ||||
| 10:20 | 10:26 | 6:00 | 5.4 | 4.6 | 3 | ||||
| 10:55 | 10:55 | 0:00 | 5.6 | 6.2 | 4 | ||||
| 11:03 | 11:07 | 4:00 | 5.6 | 7.3 | 5 | ||||
| 11:29 | 11:30 | 1:00 | 5.0 | 18.7 | 6 | ||||
| BPW | M24 | 12015 | M23 | 10:09 | 4.6 | ||||
| 10:16 | 6.9 | ||||||||
| 11:14 | 4.9 | ||||||||
| 11:20 | 5.6 | ||||||||
| 12:19 | 4.6 | ||||||||
| 12:25 | 5.7 | ||||||||
| BPW | M24 | 12017 | -- | 9:54 | 9:54 | 0:00 | 4.4 | 6.1 | 1 |
| BPW | M25 | 12004 | M22 | 15:38 | 5.5 | ||||
| 15:43 | 15:55 | 12:00 | 4.3 | 14.5 | 2 | ||||
| 16:14 | 5.5 | ||||||||
| 16:21 | 16:21 | 0:00 | 5.7 | 6.1 | 4 | ||||
| 16:53 | 16:53 | 0:00 | 6.5 | 5.3 | 5 | ||||
| 17:21 | 6.1 | ||||||||
| 17:26 | 5.3 | ||||||||
| BPW | M25 | 12005 | -- | 15:46 | 5.0 | ||||
| 17:22 | 5.2 | ||||||||
| BPW | M25 | 12006 | M24 | 16:09 | 5.7 | ||||
| BPW | M25 | 12008 | -- | 15:47 | 5.2 | ||||
| 16:36 | 16:37 | 1:00 | 6.3 | 6.3 | 2 | ||||
| 17:25 | 6.9 | ||||||||
| BPW | M25 | 12009 | -- | 15:40 | 6.1 | ||||
| 16:35 | 16:35 | 0:00 | 5.5 | 5.9 | 2 | ||||
| 16:45 | 4.4 | ||||||||
| BPW | M25 | 12011 | -- | 15:45 | 6.4 | ||||
| BPW | M25 | 12012 | M24 | 16:10 | 16:18 | 8:00 | 4.8 | 7.7 | 1 |
| 17:06 | 5.7 | ||||||||
| 17:12 | 5.7 | ||||||||
| BPW | M25 | 12015 | M23 | 16:14 | 4.1 | ||||
| 17:13 | 5.0 | ||||||||
| BPW | M25 | 12017 | M24 | 15:40 | 6.4 | ||||
| 15:52 | 15:57 | 5:00 | 6.4 | 8.6 | 2 | ||||
| 16:14 | 4.4 | ||||||||
| PW | M26 | 12000 | -- | 10:07 | 5.0 | ||||
| 10:18 | 10:24 | 6:00 | 6.2 | 5.5 | 2 | ||||
| 10:42 | 10:48 | 6:00 | 6.7 | 6.2 | 3 | ||||
| PW | M26 | 12001 | -- | 10:00 | 5.1 | ||||
| 10:35 | 5.7 | ||||||||
| 11:11 | 6.6 | ||||||||
| PW | M26 | 12011 | M25 | 11:48 | 4.5 | ||||
References
- Arnold, G.; Dewar, H. Electronic Tags in Marine Fisheries Research: A 30-Year Perspective. In Electronic Tagging and Tracking in Marine Fisheries, Proceedings of the Symposium on Tagging and Tracking Marine Fish with Electronic Devices, Honolulu, HI, USA, 7–11 February 2000; Sibert, J.R., Nielsen, J.L., Eds.; Springer: Dordrecht, The Netherlands, 2001; pp. 7–64. [Google Scholar] [CrossRef]
- Childs, A.-R.; Cowley, P.; Næsje, T.; Booth, A.; Potts, W.; Thorstad, E.; Økland, F. Do environmental factors influence the movement of estuarine fish? A case study using acoustic telemetry. Estuar. Coast. Shelf Sci. 2008, 78, 227–236. [Google Scholar] [CrossRef]
- Marshall, A.; Mills, J.S.; Rhodes, K.L.; McIlwain, J. Passive acoustic telemetry reveals highly variable home range and movement patterns among unicornfish within a marine reserve. Coral Reefs 2011, 30, 631–642. [Google Scholar] [CrossRef]
- Pincock, D.G.; Johnston, S.V. Acoustic telemetry overview. In Telemetry Techniques: A User Guide for Fisheries Research; Adams, N.S., Beeman, J.W., Eiler, J.H., Eds.; American Fisheries Society: Besthesda, MD, USA, 2012; pp. 305–337. [Google Scholar]
- Grothues, T. A review of acoustic telemetry technology and a perspective on diversification in coastal tracking arrays. In Tagging and Tracking of Marine Animals with Electronic Devices; Nielson, J.L., Arrizabalaga, H., Fragoso, N., Hobday, A., Lutcavage, M., Sibert, J., Eds.; Springer: Dordrecht, The Netherlands, 2009; Volume 9, pp. 77–90. ISBN 978-1-4020-9639-6. [Google Scholar]
- Welch, D.W.; Boehlert, G.W.; Ward, B.R. POST—The Pacific Ocean salmon tracking project. Oceanol. Acta 2003, 25, 243–253. [Google Scholar] [CrossRef]
- Heupel, M.; Semmens, J.; Hobday, A. Automated acoustic tracking of aquatic animals: Scales, design and deployment of listening station arrays. Mar. Freshw. Res. 2006, 57, 1–13. [Google Scholar] [CrossRef]
- Bishop, M.A.; Eiler, J.H. Migration patterns of post-spawning Pacific herring in a subarctic sound. Deep-Sea Res. II Top. Stud. Oceanogr. 2018, 147, 108–115. [Google Scholar] [CrossRef]
- Holland, K.N.; Brill, R.W.; Ferguson, J.S.; Chang, R.K.; Yost, R. A small vessel technique for tracking pelagic fish. Mar. Fish. Rev. 1985, 47, 26–32. [Google Scholar]
- Ng, C.L.; Able, K.W.; Grothues, T.M. Habitat use, site fidelity, and movement of adult striped bass in a southern New Jersey estuary based on mobile acoustic telemetry. Trans. Am. Fish. Soc. 2007, 136, 1344–1355. [Google Scholar] [CrossRef]
- Sackett, D.K.; Able, K.W.; Grothues, T.M. Habitat dynamics of summer flounder Paralichthys dentatus within a shallow USA estuary, based on multiple approaches using acoustic telemetry. Mar. Ecol. Prog. Ser. 2008, 364, 199–212. [Google Scholar] [CrossRef]
- Nielsen, J.K.; Niezgoda, G.H.; Taggart, S.J.; Cooke, S.J.; Anson, P.; Hassler, C.T.; Hanson, K.C. Mobile positioning of tagged aquatic animals using acoustic telemetry with a synthetic hydrophone array (SYNAPS, Synthetic Aperture Positioning System). In Advances in Fish Tagging and Marking Technology; McKenzie, J., Parsons, B., Seitz, A.C., Kopf, R.K., Mesa, M., Phelps, Q., Eds.; American Fisheries Society Symposium 76: Bethseda, MD, USA, 2012; pp. 223–250. [Google Scholar]
- Grothues, T.M.; Dobarro, J.; Eiler, J. Collecting, interpreting, and merging fish telemetry data from an AUV: Remote sensing from an already remote platform. In Proceedings of the 2010 IEEE/OES Autonomous Underwater Vehicles, Monterey, CA, USA, 1–3 September 2010; pp. 1–9. [Google Scholar]
- Clark, C.M.; Forney, C.; Manii, E.; Shinzaki, D.; Gage, C.; Farris, M.; Lowe, C.G.; Moline, M. Tracking and following a tagged leopard shark with an autonomous underwater vehicle. J. Field Robot. 2013, 30, 309–322. [Google Scholar] [CrossRef]
- Eiler, J.H.; Grothues, T.M.; Dobarro, J.A.; Masuda, M.M. Comparing autonomous underwater vehicle (AUV) and vessel-based tracking performance for locating acoustically tagged fish. Mar. Fish. Rev. 2014, 75, 27–42. [Google Scholar] [CrossRef]
- Grothues, T.M.; Dobarro, J.; Ladd, J.; Higgs, A.; Niezgoda, G.; Miller, D. Use of a multi-sensored AUV to telemeter tagged Atlantic sturgeon and map their spawning habitat in the Hudson River, USA. In Proceedings of the 2008 IEEE/OES Autonomous Underwater Vehicles, Woods Hole, MA, USA, 13–14 October 2008; pp. 1–7. [Google Scholar]
- Grothues, T.M.; Davis, W.C. Sound pressure level weighting of the center of activity method to approximate sequential fish positions from acoustic telemetry. Can. J. Fish. Aquat. Sci. 2013, 70, 1359–1371. [Google Scholar] [CrossRef]
- Newhall, A.E.; Lin, Y.; Grothues, T.M.; Lynch, J.F.; Gawarkiewicz, G.G. A method of observing acoustic scattering and absorbtion by fish schools using autonomous underwater vehicles. IEEE J. Ocean. Eng. 2016, 42, 29–36. [Google Scholar] [CrossRef]
- Singh, Y.; Sharma, S.; Sutton, R.; Hutton, D.; Khan, A. A constrained A * approach toward optimal path planning for an unmanned surface vehicle in a maritime environment containing dynamic obstacles and ocean currents. Ocean Eng. 2018, 169, 187–201. [Google Scholar] [CrossRef]
- Singh, Y.; Sharma, S.; Sutton, R.; Hutton, D.; Sutton, R. Optimal path planning of unmanned surface vehicles. Indian J. Geo. Mar. Sci. 2018, 47, 1325–1334. [Google Scholar]
- Skomal, G.B.; Hoyos-Padilla, E.M.; Kukulya, A.; Stokey, R. Subsurface observations of white shark Carcharodon carcharias predatory behaviour using an autonomous underwater vehicle. J. Fish Biol. 2015, 87, 1293–1312. [Google Scholar] [CrossRef]
- Dodson, T.; Grothues, T.M.; Eiler, J.H.; Dobarro, J.A.; Shome, R. Acoustic-telemetry payload control of an autonomous underwater vehicle for mapping the distribution of tagged fish. Limnol. Oceanogr. Methods 2018, 16, 760–772. [Google Scholar] [CrossRef]
- Eiler, J.H.; Grothues, T.M. Developing Telemetry-Based Payload Control for Determining the Distribution and Movements of Marine Fish Using Autonomous Underwater Vehicles; NPRB Project 1529 Final Report; North Pacific Research Board: Anchorage, AK, USA, 2018. [Google Scholar]
- Heard, W.R.; Shevlyakov, E.; Zikunova, O.V.; McNicol, R.E. Chinook salmon-trends in abundance and biological characteristics. North Pac. Anadromous Fish Comm. 2007, 4, 77–91. [Google Scholar]
- Evenson, D.F.; Hayes, S.J.; Sandone, G.; Bergstrom, D.J. Yukon River Chinook salmon: Stock status, harvest, and management. In Pacific Salmon: Ecology and Management of Western Alaska’s Populations; Krueger, C.C., Zimmerman, C.E., Eds.; American Fisheries Society Symposium 70: Bethesda, MD, USA, 2009; pp. 675–701. [Google Scholar]
- Heinl, S.C.; Jones, E.L.; Piston, A.W.; Richards, P.; Shaul, L.D.; Elliot, B.W.; Miller, S.E.; Brenner, R.E.; Nichols, J.V. Review of Salmon Escapement Goals in Southeast Alaska, 2014; Alaska Department of Fish and Game Fishery Manuscript: Anchorage, AK, USA, 2014. [Google Scholar]
- Richerson, K.; Holland, D.S. Quantifying and predicting responses to a US West Coast salmon fishery closure. ICES J. Mar. Sci. 2017, 74, 2364–2378. [Google Scholar] [CrossRef]
- Bigler, B.S.; Welch, D.W.; Helle, J.H. A review of size trends among North Pacific salmon (Oncorhynchus spp.). Can. J. Fish. Aquat. Sci. 1996, 53, 455–456. [Google Scholar] [CrossRef]
- Lewis, B.; Grant, W.S.; Brenner, R.E.; Hamazaki, T. Changes in size and age of Chinook salmon Oncorhynchus tshawytscha returning to Alaska. PLoS ONE 2015, 10, e0130184. [Google Scholar] [CrossRef]
- Jeffrey, K.M.; Côté, I.M.; Irvine, J.R.; Reynolds, J.D. Changes in body size of Canadian Pacific salmon over six decades. Can. J. Fish. Aquat. Sci. 2017, 74, 191–201. [Google Scholar] [CrossRef]
- Ohlberger, J.; Ward, E.J.; Schindler, D.E.; Lewis, B. Demographic changes in Chinook salmon across the Northeast Pacific Ocean. Fish. 2018, 19, 533–546. [Google Scholar] [CrossRef]
- Beamish, R.J.; Mahnken, C. A critical size and period hypothesis to explain natural regulation of salmon abundance and the linkage to climate and climate change. Prog. Oceanogr. 2001, 49, 423–437. [Google Scholar] [CrossRef]
- Duffy, E.J.; Beauchamp, D.A. Rapid growth in the early marine period improves the marine survival of Chinook salmon (Oncorhynchus tshawytscha) in Puget Sound, Washington. Can. J. Fish. Aquat. Sci. 2011, 68, 232–240. [Google Scholar] [CrossRef]
- Doney, S.C.; Ruckelshaus, M.; Emmett Duffy, J.; Barry, J.P.; Chan, F.; English, C.A.; Galindo, H.M.; Grebmeier, J.M.; Hollowed, A.B.; Knowlton, N.; et al. Climate change impacts on marine ecosystems. Annu. Rev. Mar. Sci. 2011, 4, 11–37. [Google Scholar] [CrossRef]
- Aschan, M.; Fossheim, M.; Greenacre, M.; Primicerio, R. Change in fish community structure in the Barents Sea. PLoS ONE 2013, 8, e62748. [Google Scholar] [CrossRef]
- Martin, R.M.; Heard, W.R. Floating vertical raceways to culture salmon (Oncorhynchus spp.). Aquaculture 1987, 61, 295–302. [Google Scholar] [CrossRef]
- Liedtke, T.L.; Beeman, J.W.; Gee, L.P. A Standard Operating Procedure for the Surgical Implantation of Transmitters in Juvenile Salmonids; Open-File Report 2012–1267; U.S. Geological Survey: Reston, VA, USA, 2012; p. 50.
- Niezgoda, G.; Benfield, M.; Sisak, M.; Anson, P. Tracking acoustic transmitters by code division multiple access (CDMA)-based telemetry. Hydrobiologia 2002, 483, 275–286. [Google Scholar] [CrossRef]
- Heard, W.R. Life history of pink salmon. In Pacific Salmon Life Histories; Groot, C., Margolis, L., Eds.; University of British Columbia Press: Vancouver, BC, Canada, 1991; pp. 121–230. [Google Scholar]
- Ryer, C.H.; Olla, G.L. Agonistic behavior in a schooling fish: Form, function and ontogeny. Environ. Biol. Fish. 1991, 31, 355–363. [Google Scholar] [CrossRef]
- Riley, W.D.; Ibbotson, A.T.; Maxwell, D.L.; Davison, P.I.; Beaumont, W.R.; Ives, M.J. Development of schooling behaviour during the downstream migration of Atlantic salmon Salmo salar smolts in a chalk stream. J. Fish. Biol. 2014, 85, 1042–1059. [Google Scholar] [CrossRef]
- Liedtke, T.L.; Rub, A.M.W. Techniques for telemetry transmitter attachment and evaluation of transmitter effects on fish performance. In Telemetry Techniques: A User Guide for Fisheries Research; Adams, N.S., Beeman, J.W., Eiler, J.H., Eds.; American Fisheries Society: Bethesda, MD, USA, 2012; pp. 45–87. [Google Scholar]
- Moline, M.A.; Blackwell, S.M.; von Alt, C.; Allen, B.; Austin, T.; Case, J.; Forrester, N.; Goldsborough, R.; Purcell, M.; Stokey, R.; et al. Remote environmental monitoring units: An autonomous vehicle for characterizing coastal environments. J. Atmos. Ocean. Technol. 2005, 22, 1797–1808. [Google Scholar] [CrossRef]
- Blewitt, G. Basics of the GPS Technique: Observation Equations; Geodetic Applications of GPS; Swedish Land Survey: Bastad, Sweden, 1997; p. 46. [Google Scholar]
- Meckley, T.D.; Holbrook, C.M.; Wagner, C.M.; Binder, T.R. An approach for filtering hyperbolically positioned underwater acoustic telemetry data with position precision estimates. Anim. Biotelemetry 2014, 2. [Google Scholar] [CrossRef]
- Lin, Y.; Hsiung, J.; Piersall, R.; White, C.; Lowe, C.G.; Clark, C.M. A multi-autonomous underwater vehicle system for autonomous tracking of marine life. J. Field Robot. 2016, 34, 623–829. [Google Scholar] [CrossRef]
- Lennox, R.J.; Aarestrup, K.; Cooke, S.J.; Cowley, P.D.; Deng, Z.D.; Fisk, A.T.; Harcourt, R.G.; Heupel, M.; Hinch, S.G.; Holland, K.N.; et al. Envisioning the future of aquatic animal tracking: Technology, science, and application. BioScience 2017, 67, 884–896. [Google Scholar] [CrossRef]
- Zolich, A.; Johansen, T.A.; Alfredsen, J.A. A formation of unmanned vehicles for tracking of an acoustic fish tag. In Proceedings of the 2017-Anchorage, Anchorage, AK, USA, 18–21 September 2017; pp. 1–6. [Google Scholar]
- Russell, S.; Norvig, P. Artificial Intelligence: A Modern Approach, 3rd ed.; Prentice Hall: Upper Saddle River, NJ, USA, 2010; ISBN 978-0-13-604259-4. [Google Scholar]
- Conner, L.M.; Plowman, B.W. Using Euclidean distances to assess nonrandom habitat use. In Radio-Tracking and Animal Populations; Millspaugh, J.J., Marzluff, J.M., Eds.; Academic Press: San Diego, CA, USA, 2001; pp. 275–290. [Google Scholar]
- Papastamatiou, Y.P.; Cartamil, D.P.; Lowe, C.G.; Meyer, C.G.; Wetherbee, B.M.; Holland, K.N. Scales of orientation, directed walks and movement path structure in sharks. J. Anim. Ecol. 2011, 80, 864–874. [Google Scholar] [CrossRef]
- Mashintonio, A.F.; Pimm, S.L.; Harris, G.M.; van Aarde, R.J.; Russell, G.J. Data-driven discovery of the spatial scales of habitat choice by elephants. PeerJ 2014, 2, e504. [Google Scholar] [CrossRef]
- Schreck, C.B. Accumulation and long-term effects of stress in fish. In The Biology of Animal Stress; Moberg, G.P., Mench, J.A., Eds.; CAB International: Wallingford, UK, 2000; pp. 147–158. [Google Scholar]
- Bridger, C.J.; Booth, R.K. The effects of biotelemetry transmitter presence and attachment procedures on fish physiology and behavior. Rev. Fish. Sci. 2003, 11, 13–34. [Google Scholar] [CrossRef]
- Chamberlin, J.W.; Kagley, A.N.; Fresh, K.L.; Quinn, T.P. Movements of yearling Chinook salmon during the first summer in marine waters of Hood Canal, Washington. Trans. Am. Fish. Soc. 2011, 140, 429–439. [Google Scholar] [CrossRef]
- Welch, D.W.; Melnychuk, M.C.; Payne, J.C.; Rechisky, E.L.; Porter, A.D.; Jackson, G.D.; Ward, B.R.; Vincent, S.P.; Wood, C.C.; Semmens, J.; et al. In situ measurement of coastal ocean movements and survival of juvenile Pacific salmon. Proc. Natl. Acad. Sci. USA 2011, 108, 8708–8713. [Google Scholar] [CrossRef]
- Brett, J.R. Energy expenditure of sockeye salmon, Oncorhynchus nerka, during sustained performance. J. Fish. Res. Board Can. 1973, 30, 1799–1809. [Google Scholar] [CrossRef]
- Colavecchia, M.; Katopodis, C.; Goosney, R.; Scruton, D.A.; McKinley, R.S. Measurement of burst swimming performance in wild Atlantic salmon (Salmo salar L.) using digital telemetry. Regul. Rivers Res. Manag. 1998, 14, 41–51. [Google Scholar] [CrossRef]
- Healey, M.C. Life history of Chinook salmon (Oncorhynchus tshawytscha). In Pacific Salmon Life Histories; Groot, C., Margolis, L., Eds.; University of British Columbia Press: Vancouver, BC, Canada, 1991; pp. 311–393. [Google Scholar]


| Fish Detected | ||||||
|---|---|---|---|---|---|---|
| Mission | Date | Location | Legs | Fish Present 1 | AUV | Boat |
| M20 | 19 May | BPW | 8 | 2 (2, 0) | 2 | 2 |
| M21 | 21 May | BPW | 4 | 3 (3, 0) | 2 | 3 |
| M22 | 24 May | BPW | 6 | 4 (3, 1) | 4 | 4 |
| M23 | 24 May | BPW | 6 | 5 (2, 3) | 4 | 5 |
| M24 | 25 May | BPW | 5 | 5 (3, 2) | 5 | 4 |
| M25 | 25 May | BPW | 3 | 9 (4, 5) | 8 | 8 |
| M26 | 26 May | PW | 8 | 3 (2, 1) | 3 | 3 |
| Total | 31 (19, 12) | 28 | 29 | |||
| 5/19 | 5/21 | 5/24 | 5/25 | 5/26 | |||||
|---|---|---|---|---|---|---|---|---|---|
| Area | Mission | Fish ID | M20 | M21 | M22 | M23 | M24 | M25 | M26 |
| BPW | M20 | 12010 | A B | ||||||
| BPW | M20 | 12019 | A B | ||||||
| BPW | M21 | 12002 | A B | ||||||
| BPW | M21 | 12003 | A B | a b | a b | ||||
| BPW | M21 | 12014 | B | ||||||
| BPW | M22 | 12004 | A B | a b | a b | a b | |||
| BPW | M22 | 12013 | A B | a b | |||||
| BPW | M22 | 12016 | A B | ||||||
| BPW | M23 | 12015 | B | a b | a b | ||||
| BPW | M23 | 12018 | A | ||||||
| BPW | M24 | 12006 | A B | b | |||||
| BPW | M24 | 12012 | A B | a b | |||||
| BPW | M24 | 12017 | A | a | |||||
| BPW | M25 | 12005 | A B | ||||||
| BPW | M25 | 12008 | A B | ||||||
| BPW | M25 | 12009 | A B | ||||||
| BPW | M25 | 12011 | A B | a b | |||||
| PW | M26 | 12000 | A | ||||||
| PW | M26 | 12001 | A B | ||||||
© 2019 by the authors. Licensee MDPI, Basel, Switzerland. This article is an open access article distributed under the terms and conditions of the Creative Commons Attribution (CC BY) license (http://creativecommons.org/licenses/by/4.0/).
Share and Cite
Eiler, J.H.; Grothues, T.M.; Dobarro, J.A.; Shome, R. Tracking the Movements of Juvenile Chinook Salmon using an Autonomous Underwater Vehicle under Payload Control. Appl. Sci. 2019, 9, 2516. https://doi.org/10.3390/app9122516
Eiler JH, Grothues TM, Dobarro JA, Shome R. Tracking the Movements of Juvenile Chinook Salmon using an Autonomous Underwater Vehicle under Payload Control. Applied Sciences. 2019; 9(12):2516. https://doi.org/10.3390/app9122516
Chicago/Turabian StyleEiler, John H., Thomas M. Grothues, Joseph A. Dobarro, and Rahul Shome. 2019. "Tracking the Movements of Juvenile Chinook Salmon using an Autonomous Underwater Vehicle under Payload Control" Applied Sciences 9, no. 12: 2516. https://doi.org/10.3390/app9122516
APA StyleEiler, J. H., Grothues, T. M., Dobarro, J. A., & Shome, R. (2019). Tracking the Movements of Juvenile Chinook Salmon using an Autonomous Underwater Vehicle under Payload Control. Applied Sciences, 9(12), 2516. https://doi.org/10.3390/app9122516