1. Introduction
The sabkha spreads extensively in the Arabian Gulf Coast region. The Arabian Gulf Coast region is a very flat ground, up to about 100 km inland from the coastline. The “sabkha” is originally an Arabic term for salt flat underlain by sand, silt, and clay and often encrusted with salt. The depth of the sabkha layer in the study area is about 7 to 10 m, and a relatively hard sandy soil layer lies below the loose silty sand layer. The mean high-groundwater level in the sabkha area is only a few centimeters to one or two meters below the ground surface, and this barren area is periodically flooded. Sabkha soils have loose, permeable, sandy to gritty textures, and the encrusted surface is usually composed of hygroscopic salts. The sabkha region is generally hard enough to support a medium-weight vehicle, but it becomes so soft when flooded that a person would sink nearly to knee depth.
Sabkha is known as a problematic soil because of its loose density, soft consistency, high salinity and water content, and occurrence of fine sands and clays. It is generally highly compressible and requires ground improvement for highway and railway construction. The purpose of this study was to evaluate the applicability of dynamic compaction to improve the bearing capacity for freight railway roadbed in the coastal sabkha area. Based on the field and lab tests results, the applicability of dynamic compaction was evaluated, and numerical analysis was carried out in order to understand the ground improvement effect, range of influence, and ground behavior after applying dynamic compaction.
2. Geological Conditions and Geotechnical Engineering Issues of Sabkha Deposit
Several in-situ tests, including borings, test pits, electrical resistivity tomography, crosshole seismic tests, and cone penetration tests (CPT), were carried out in the study area. The sabkha sediments are predominantly sandy soil classified mainly as silty sand (SM), poorly graded sand with silt (SP-SM), or poorly graded sand (SP). The sabkha deposit in the study area is composed of a medium dense sand and silt layer with a depth of 1–2 mm overlying loose to very loose sabkha deposit extending down to a depth of 7.5–10.5 m. Thin layers of fine-grained soil are also found intermittently at around GL-7 m.
Figure 1 shows a typical grain size distribution curve of the sabkha deposits. Generally, sabkha soil is poorly graded fine sand with 5%–15% of fines, and thin silty sand layer with more than 40% of fines is occasionally found at a depth of 6–7 m. Sabkha does not possess any plasticity, and the soil is classified as nonplastic.
Laboratory compaction and California Bearing Ratio (CBR) tests were conducted on selected soil samples.
Table 1 indicates compaction and CBR characteristics, and
Figure 2 shows a typical compaction curve.
The groundwater table was measured at least 24 hours after borehole drilling to measure the stabilized groundwater level. The groundwater table was observed at about 0.5–1.5 m below ground surface in boreholes and test pits, and perched groundwater table, which seems to have been collected on top of the impervious clay layer, was observed in some boreholes. It should also be noted that the groundwater level may experience seasonal and tidal fluctuations.
High groundwater level, high compressibility, and presence of dissoluble materials in sabkha soil are likely to cause various geotechnical and construction problems during the construction and operation of railways in the sabkha deposit. The precipitation of salts below the groundwater table is ascribed to the increase in the salt concentration above its saturation limit. The possible construction problems that can occur during railway construction are summarized as follows:
excessive total and differential settlements due to varying compactness of sabkha deposit;
high collapse potential because of dissolution of sodium chloride, leaching of calcium ions, and soil grain rearrangement;
possible long-term settlement;
trafficability problem due to saturation and loss of strength in sabkha sites; and
corrosion of steel and deterioration of concrete because of highly concentrated chloride and sulfate salts present in sabkha sediments.
The top layers of sabkha may exhibit firm and stiff characteristics in its dry state. However, when dampened with water, the strength is highly reduced as the cementing salts are susceptible to leaching and dissolution or softening, thereby leading to rapid settlement in wet conditions. Therefore, ground improvement or ground reinforcement is required in order to remove the problem of unacceptable future long-term settlement. EsmaeilpourShirvani et al. [
1] carried out a series of large-scale direct shear tests on the shear strength characteristics of reinforced sand–clay soil mixed with natural fibers, and it was found that the shear strength parameters of the reinforced sand–clay mixture were significantly improved. Rashidi et al. [
2] proposed a series of statistical relationships between unconfined compressive strength, indirect tensile strength, and resilient modulus for the analysis and design of pavement structures based on a large number of mechanical and durability tests using cementitious stabilized granular soil. Sabkha ground might be improved by soil stabilization or ground reinforcement, but dynamic compaction is applied at the job site because dynamic compaction is an economical method for improvement of sabkha deposit and the most appropriate method to crush low-strength crystals, such as crystalline salts comprising gypsum, anhydrite, and halite.
3. Evaluation of Suitability for Dynamic Compaction in Sabkha Deposit
The dynamic compaction method has been proven to be applicable to granular soil deposits. However, the dynamic compaction method should be carefully applied in saturated clay soil deposit because dynamic compaction may cause reduction of bearing capacity if the excess pore pressure is not appropriately dissipated during compaction.
Lukas [
3] proposed the evaluation criteria for applicability of dynamic compaction based on the grain size distribution, plasticity index, and permeability, as shown in
Table 2 and
Figure 3. The typical grain size distribution curves of sabkha soil are inserted into the evaluation criteria in
Figure 3.
The permeability of sabkha deposit was estimated to be about 1.5–2.3 × 10
−3 cm/s from lab permeability tests according to the geotechnical investigation report, and the sabkha deposit in the study area is classified as a pervious soil deposit (zone 1), as shown in
Figure 2. However, because the groundwater in this area has high salinity, brine should be used instead of distilled water in permeability tests.
Al-Amoudi [
5] conducted falling head laboratory permeability tests on sabkha soil obtained in the east coast of Saudi Arabia, as shown in
Figure 4. The permeability coefficient was 1.8 × 10
−3 cm/s, which is similar to the values obtained in the geological investigation for this study. Al-Amoudi [
5] found an increase in permeability as tests were repeated because test repetition is solely attributed to salt dissolution and causes more channels to form.
On the other hand, the falling head permeability tests with brine showed a permeability of 1.3 × 10⁻⁴ cm/s, which was reduced to about 1/14 of the permeability obtained from tests using distilled water. Therefore, it is reasonable to classify the sabkha deposit conservatively as semipervious deposit (zone 2) because the grain size distribution of sabkha deposit is close to the boundary of zone 1 and zone 2, and the permeability is in the range for zone 2 (10−3–10−6 cm/s). Dynamic compaction method can be applied in semipervious deposit, but care must be taken to ensure that sufficient dissipation of excess pore pressure can be achieved during compaction. Because the dissipation of excessive pore water pressure can take from several minutes to several tens of minutes during dynamic compaction in sabkha deposit, it could be necessary to set a certain period of pause time between tamping in order to improve the effect of the dynamic compaction method.
4. Estimation of Improvement Depth of Dynamic Compaction
The improvement depth of dynamic compaction is estimated from the relationship with the compaction energy. Menard [
6] explained the mechanism of subsurface improvement of saturated clay layers by the presence of microbubbles in soil, gradual liquefaction under repeated impacts, and fissure creation and following permeability change. Menard [
6] proposed an equation to estimate the improvement depth of dynamic compaction in proportion to the square root of dynamic compaction energy (WH).
Mayne et al. [
7] collected in-situ dynamic compaction test data to find the relationship between dynamic compaction energy (WH) and improvement depth (DI) and proposed Equation (1) using the coefficient of improvement depth, α.
Table 3 summarizes the coefficient of improvement depth for various soil types. From
Table 3, the sabkha deposit in this study area can be classified as fine sand or silty sand, and the coefficient of improvement depth can be evaluated as 0.60–0.65.
where
DI = improvement depth;
W = weight of tamper (tons);
H = drop height (m); and α = coefficient of improvement depth.
Gu and Lee [
10] studied the mechanics of dynamic compaction using two-dimensional Finite Element (FE) analyses compared with the centrifuge model results. Gu and Lee [
10] concluded that the depth of improvement depends on the momentum per blow and energy per blow. It was found that determining the parameters of the constitutive model using one-dimensional compression data provides reasonably good prediction of both experimental and field data.
Lee and Gu [
4] proposed a method for estimating the ground improvement depth of dynamic compaction on sand using two-dimensional dynamic finite element analyses. The proposed method considered momentum, energy, taper area as well as the initial state of the ground, which is not considered in Equation (1).
Mostafa [
8] carried out a parametric study by means of changing Cam-Clay parameters. Two-dimensional and three-dimensional numerical analyses were performed, and the correlation between soil properties and tamping energy and improvement depth of dynamic compaction was presented. However, the study did not explain clearly the problem of dissipation of excess porewater pressure when applying dynamic compaction to clay deposit.
The improvement depths are estimated for various tamper drop heights in
Table 4. It is suggested that a 20-ton tamper be dropped from 15 m above the ground surface in order to improve the 10-m-deep loose silty sand layer (N = 5–15).
Mayne et al. [
7] conducted field tests to measure the increase in ground subsidence as the dynamic compaction energy per unit area of compaction increases, as shown in
Figure 5. Solocombe (1993) proposed the relationship between improvement depth of dynamic compaction and ground subsidence, as shown in
Table 5. When a 20-ton tamper with the radius of 2.0 m was dropped 12 times at a height of 15 m on sand deposit (compaction energy = 286 ton⋅m/m
2), the ground subsidence was estimated to be about 0.5–1.0 m, as shown in
Figure 5. The ground subsidence was estimated to be in the range of 0.3–1.0 m with respect to the improvement depth of 10 m based on the natural sand of zone 1, as shown in
Table 5.
Figure 6, described by Gambin [
9], shows the wave propagation due to dynamic compaction. Mayne et al. [
7] estimated the improvement depth and the degree of improvement from the results of Standard Penetration Test (SPT), CPT, and PressureMeter Test (PMT). The depth of maximum improvement is generally about 1/3 to 1/2 of the influence depth of dynamic compaction. When dynamic compaction is applied, the ground is improved greatly down to a depth of 3–5 m, and the degree of improvement gradually decreases with depth. Almost no ground improvement is expected from the depth of about GL-10 m or below.
5. Parameter Analysis through Numerical Analysis
5.1. Numerical Modeling
In this study, parametric analysis was performed using FLAC
3D for various tamper sizes, height of tamper drop, and number of drops in order to analyze the effect of compaction parameters on ground subsidence, range of ground improvement, and degree of ground improvement. The maximum impact load for dynamic analysis was estimated using Equation (2), derived from the momentum conservation law and the ground deformation according to the dynamic load.
where
Fmax = peak dynamic force;
H = height of tamper drop;
Gd = dynamic shear modulus;
r0 = radius of tamper; and
ν = Poisson’s ratio.
The geological strata for the numerical model were simplified to two layers, and the average values from lab and in-situ tests for each geotechnical property were used, as given in
Table 6. Dense to very dense sand layer (SP-SM) was encountered at around GL-15–GL-25 m in all 31 boreholes. Only two boreholes were drilled down to 30 m below ground surface, and brown, hard clay layer was found at around GL-25.3–GL-28.7 m. Dynamic elastic modulus and dynamic shear modulus were estimated using t Equations (3) and (4), which were proposed by Imai [
11].
where
Vs = shear wave velocity (m/s);
Gd = dynamic shear modulus;
Ed = dynamic elastic modulus;
ρ = density of soil; and
a = 81,
b = 0.33 (for alluvial soil) or
a = 91,
b = 0.32 (for dilluvial soil).
Figure 7 shows the numerical model and boundary conditions for the parameter study. The model size was set to 50 m × 50 m × 50 m, and both quiet boundary and free-field boundary conditions were applied in order to minimize the wave reflections at model boundaries when dynamic loading was applied. The Mohr–Coulomb model was used for soil, and the large strain mode was applied to appropriately simulate the large ground deformation caused by dynamic compaction. In this study, the effect of pore pressure change with time after application of dynamic compaction was not considered.
Figure 8, described by Paul et al. (1994), shows the curve of deceleration response measured during dynamic compaction tests. In this study, the load of F
max was set to be applied on the ground surface for only 0.05 seconds and then removed to simulate the impact loading.
5.2. Numerical Analysis Results
Figure 9 is the numerical analysis results of the volumetric strain increment with depth for various tamper sizes when a 20-ton tamper was dropped 12 times at a height of 15 m. The numerical analysis results showed that both large compression and large expansion of ground tended to occur in the range of about GL-6 m depth. It is thought that this phenomenon is caused by rebound when the loading on the ground surface is removed after applying for 0.05 second to simulate the impact loading in numerical analysis by referring to the deceleration response curve (
Figure 8). Therefore, it could be reasonable to consider the region where compression and expansion are mixed as the expected region where large deformation following particle rearrangement occurred due to the high stress above the yielding stress induced by dynamic compaction. As shown in
Figure 9a, only compressive deformation occurred below the region of large deformation, and the change of volumetric strain with depth tended to decrease linearly without showing an inflection point, which indicates linear decrease in the degree of improvement.
In this study, the depth of the region where the volumetric strain increment was less than −0.1% was considered as the improvement depth. The improvement depth was estimated to be 10.0–11.5 m from the numerical analysis when the ground was compacted 12 times by a 20-ton tamper, and the estimated improvement depth was similar to that estimated using the empirical equation (
Table 4). Also, the numerical analysis results showed that the maximum improvement depth, where large deformation takes place, was located at about 1/3 to 1/2 of the improvement depth.
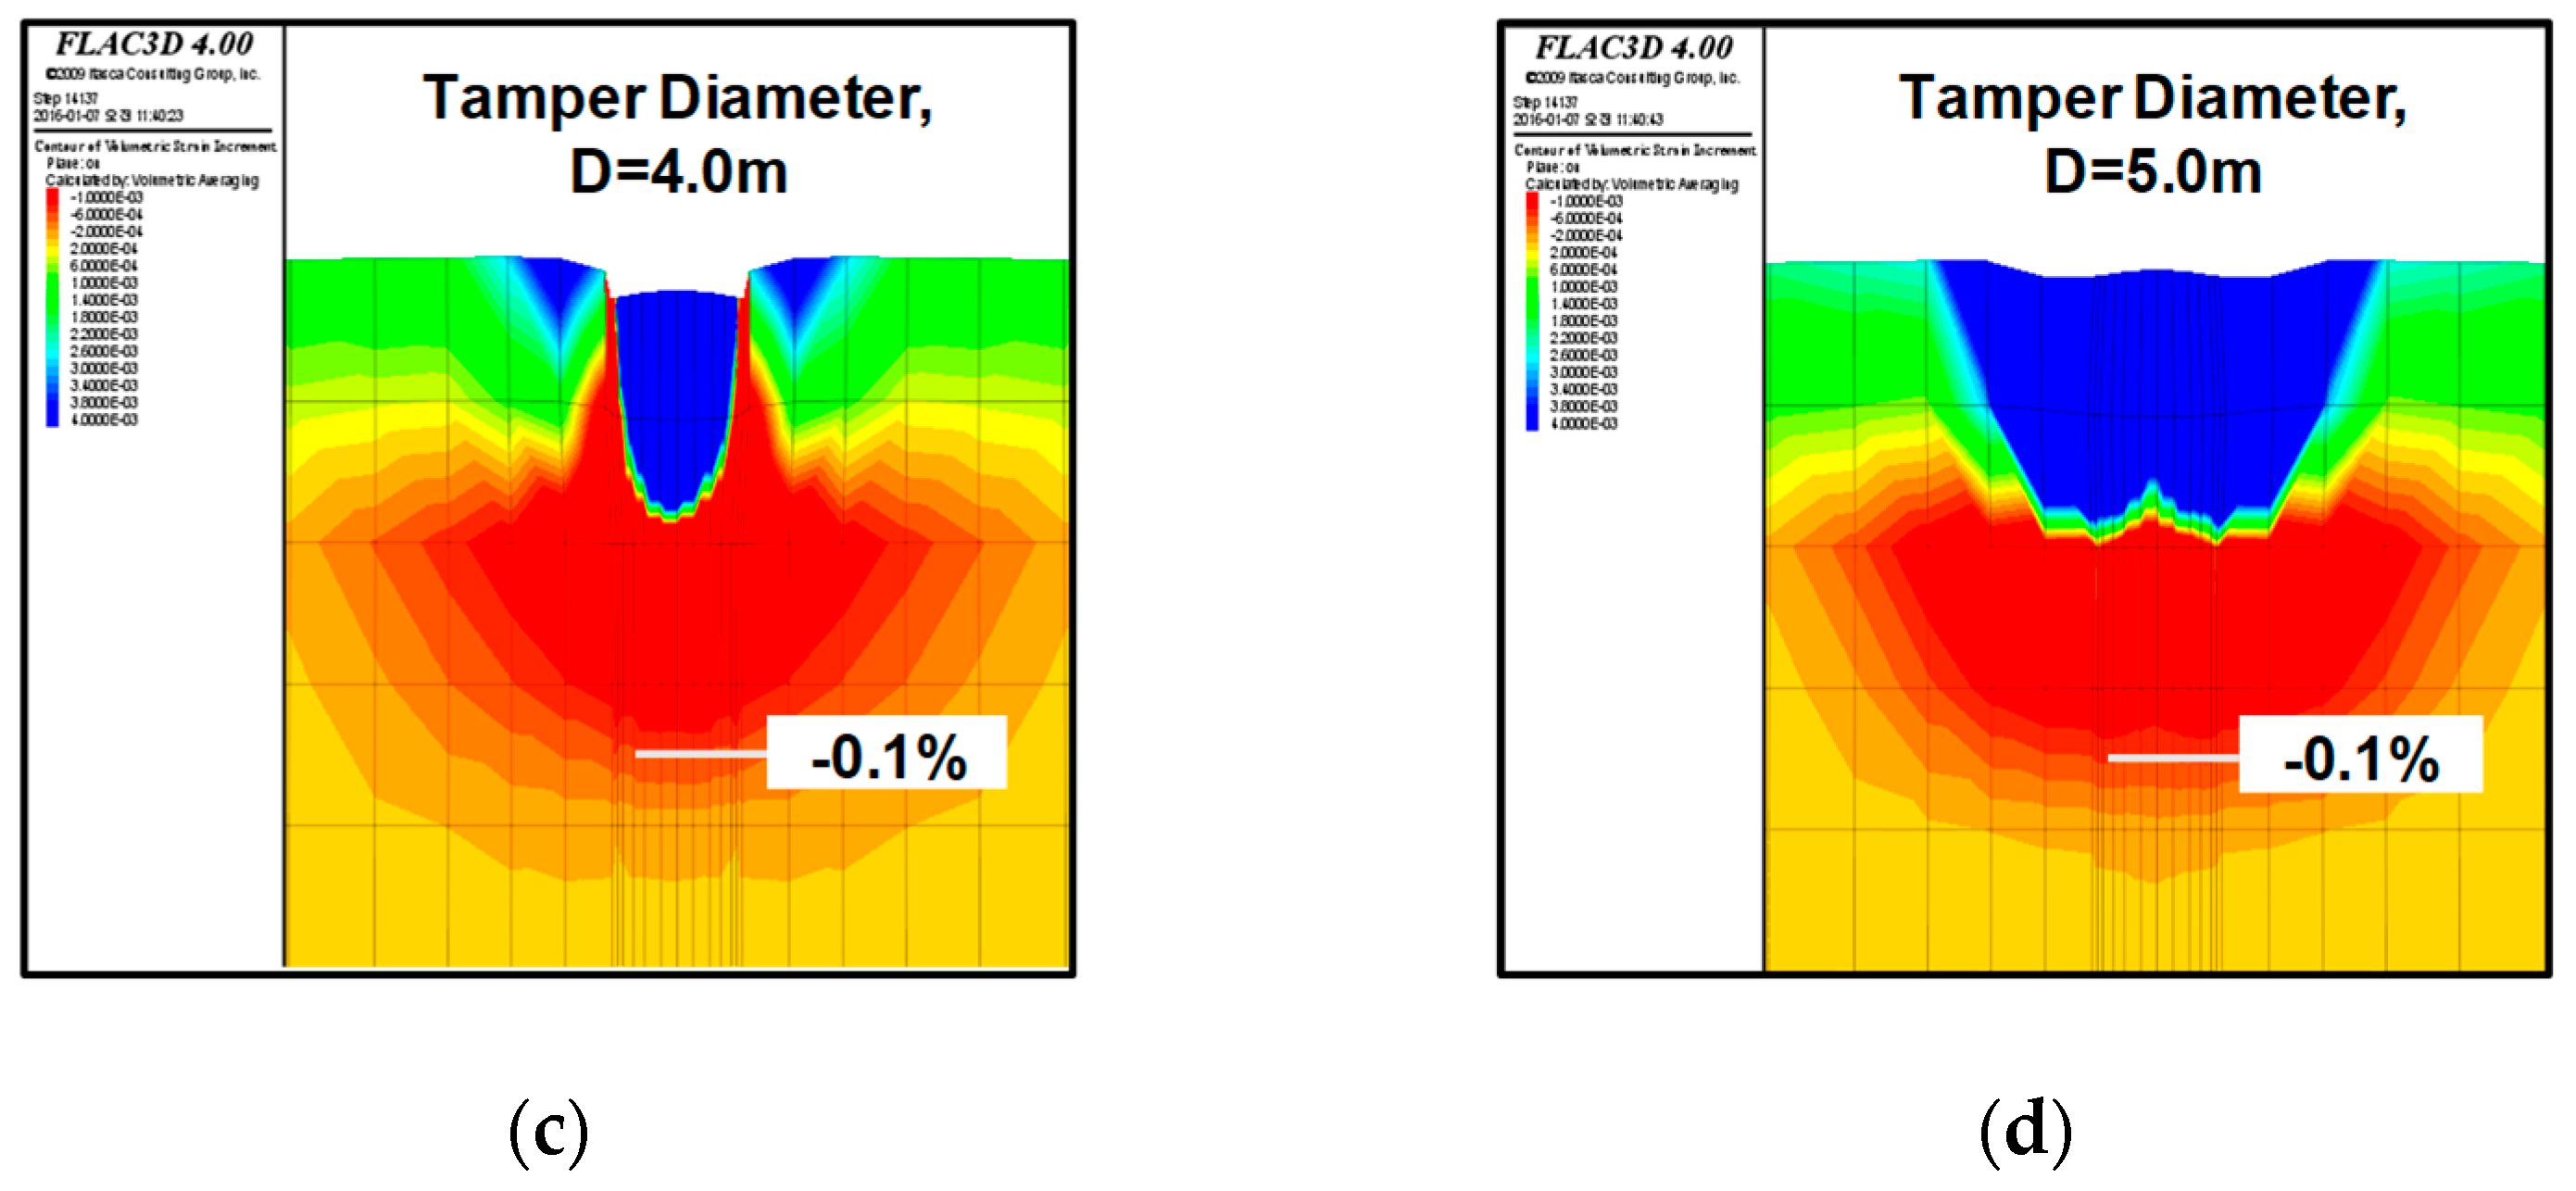
Figure 10 shows the horizontal and vertical displacement distribution when a 20-ton tamper with diameter of 4 m was dropped 12 times. Numerical analysis results showed that the effects of dynamic compaction, such as settlement and rebound, were large within the 2D (D = diameter of tamper) range from the center of the tamper and showed almost no effect of dynamic compaction at distances greater than 4D. The volumetric strain increment distribution shown in
Figure 11 also shows a similar tendency.
Figure 11 shows the change of volumetric strain increments with increase in the number of drops. As the number of impact increased, the ground subsidence and the improvement depth tended to increase. It was found that the increase in the improvement depth was reduced after compacting more than 12–14 times, and that there was almost no increase in the improvement depth with increase in the number of drops of a tamper with a diameter of 5 m.
Figure 12 shows the relationship between improvement depth and compaction energy with the increase in the number of drops. It is shown that the improvement depth increased with the number of drops, and the improvement depth,
DI, was linearly proportional to the scaled compaction energy,
.
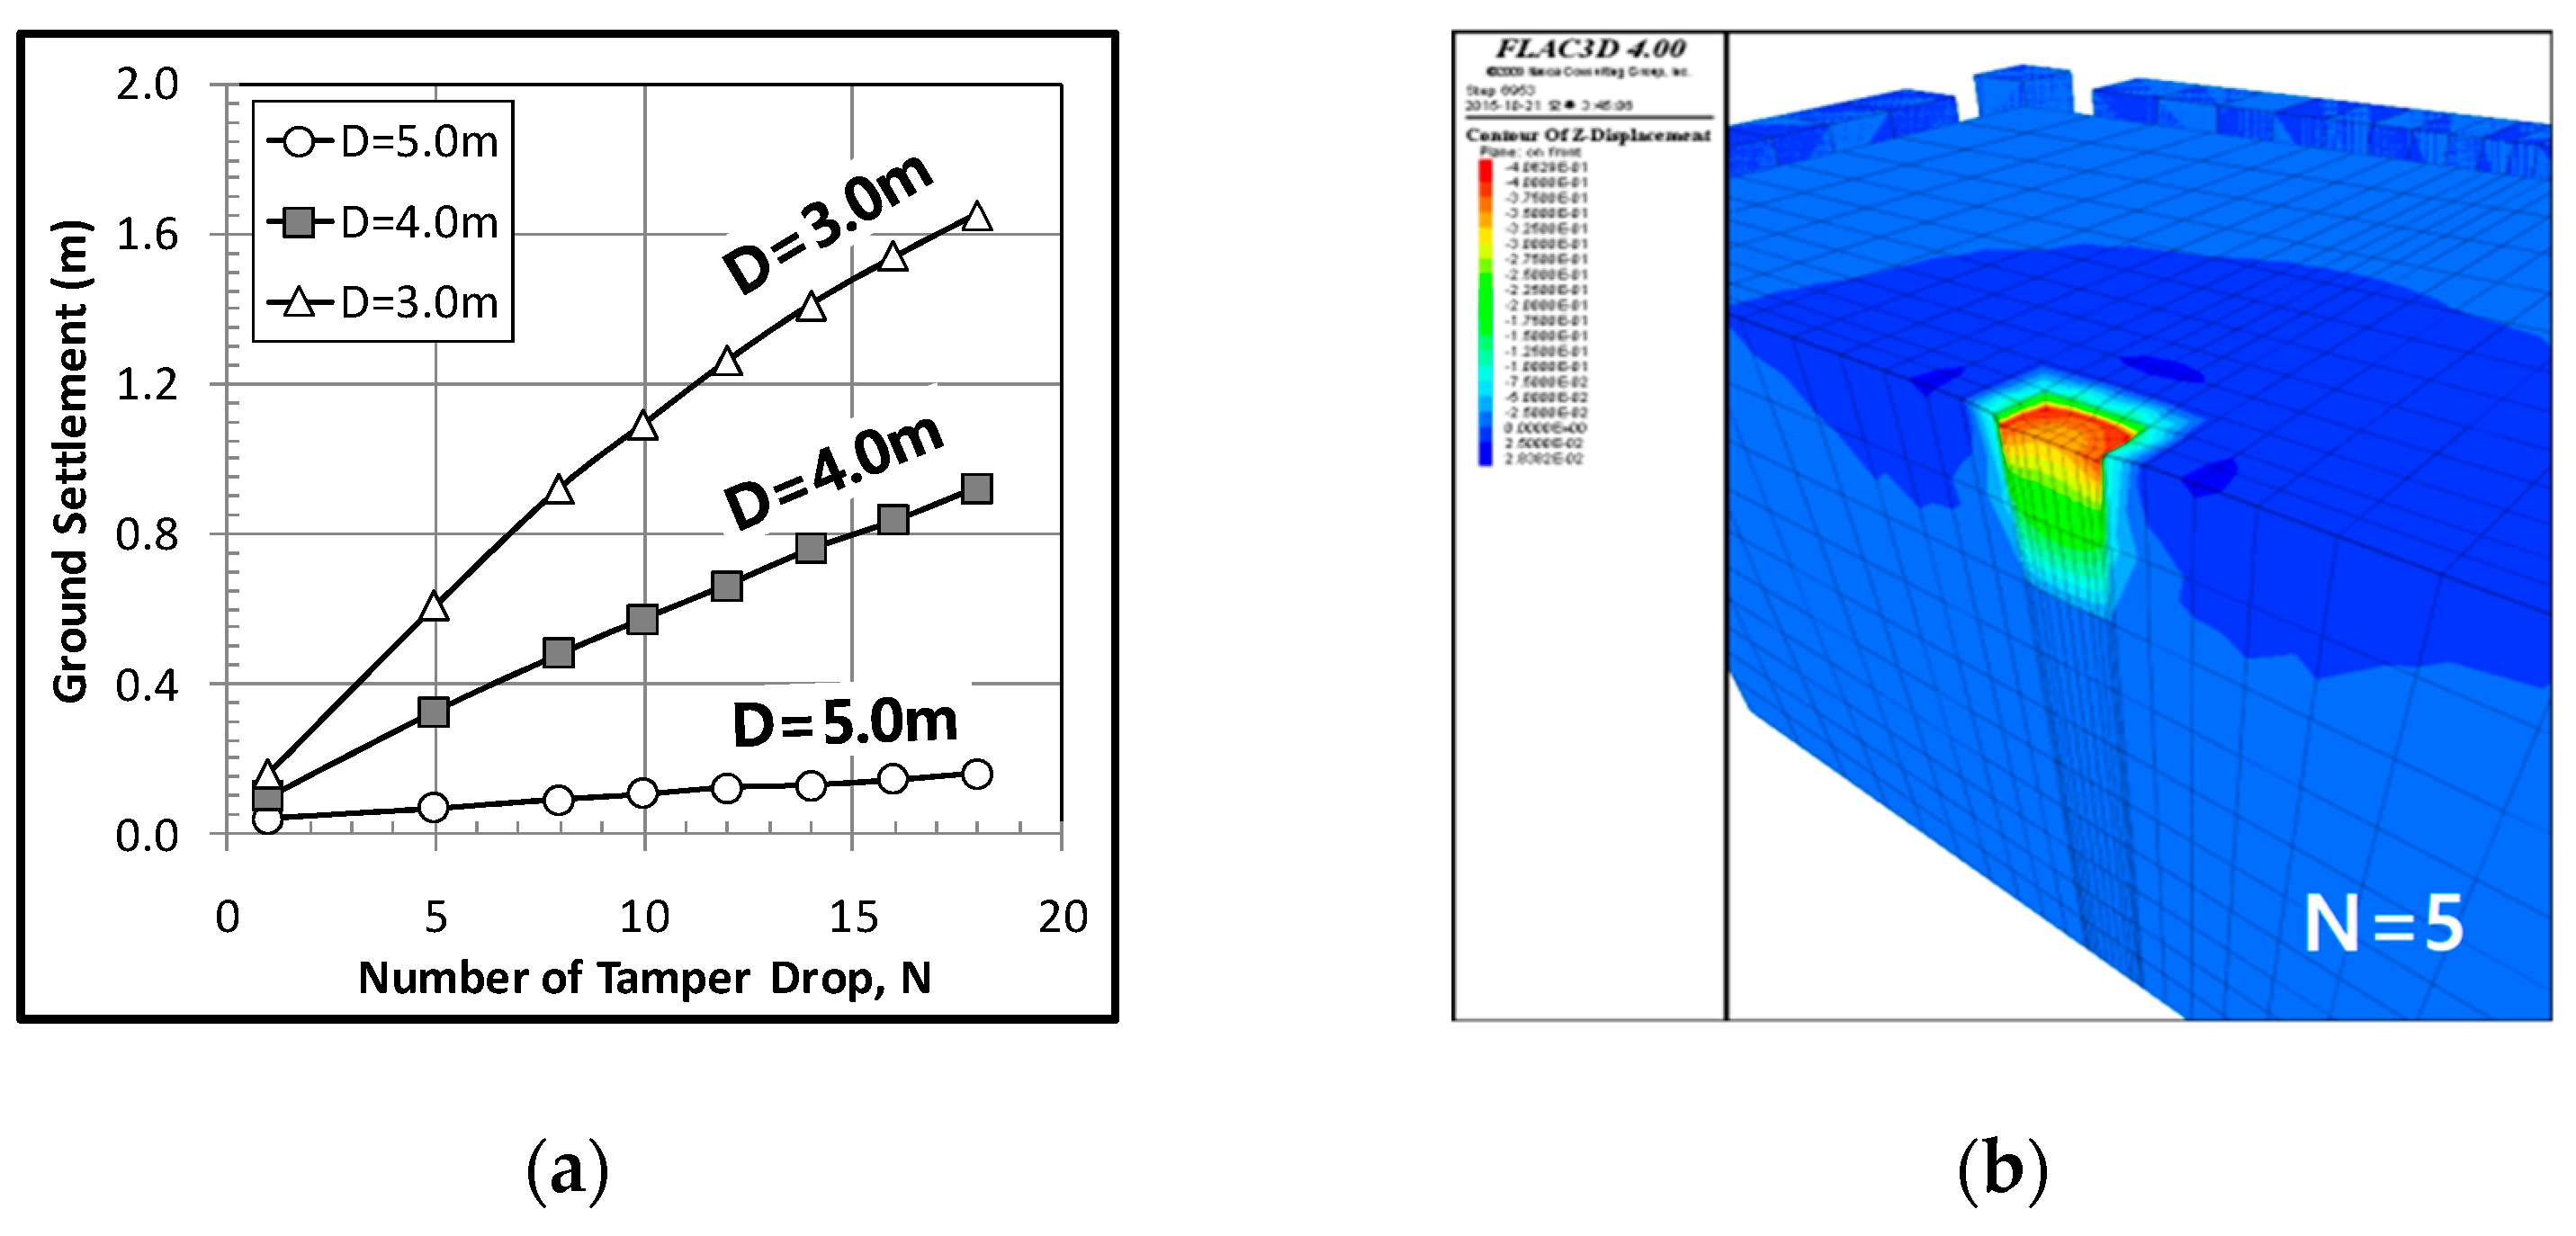
On the other hand, the ground subsidence increased continuously as the number of compaction increased, as shown in
Figure 13. It is thought that the additional compaction after shear failure of ground caused the continuous increase in ground subsidence along with heaving around the crater. However, dissipation of excess porewater pressure and rearrangement of particles will occur during dynamic compaction after shear failure in actual sabkha ground, and the ground subsidence will not increase much after a certain number of drops as the improvement depth and the strength of ground gradually increase.
6. Trial Dynamic Compaction
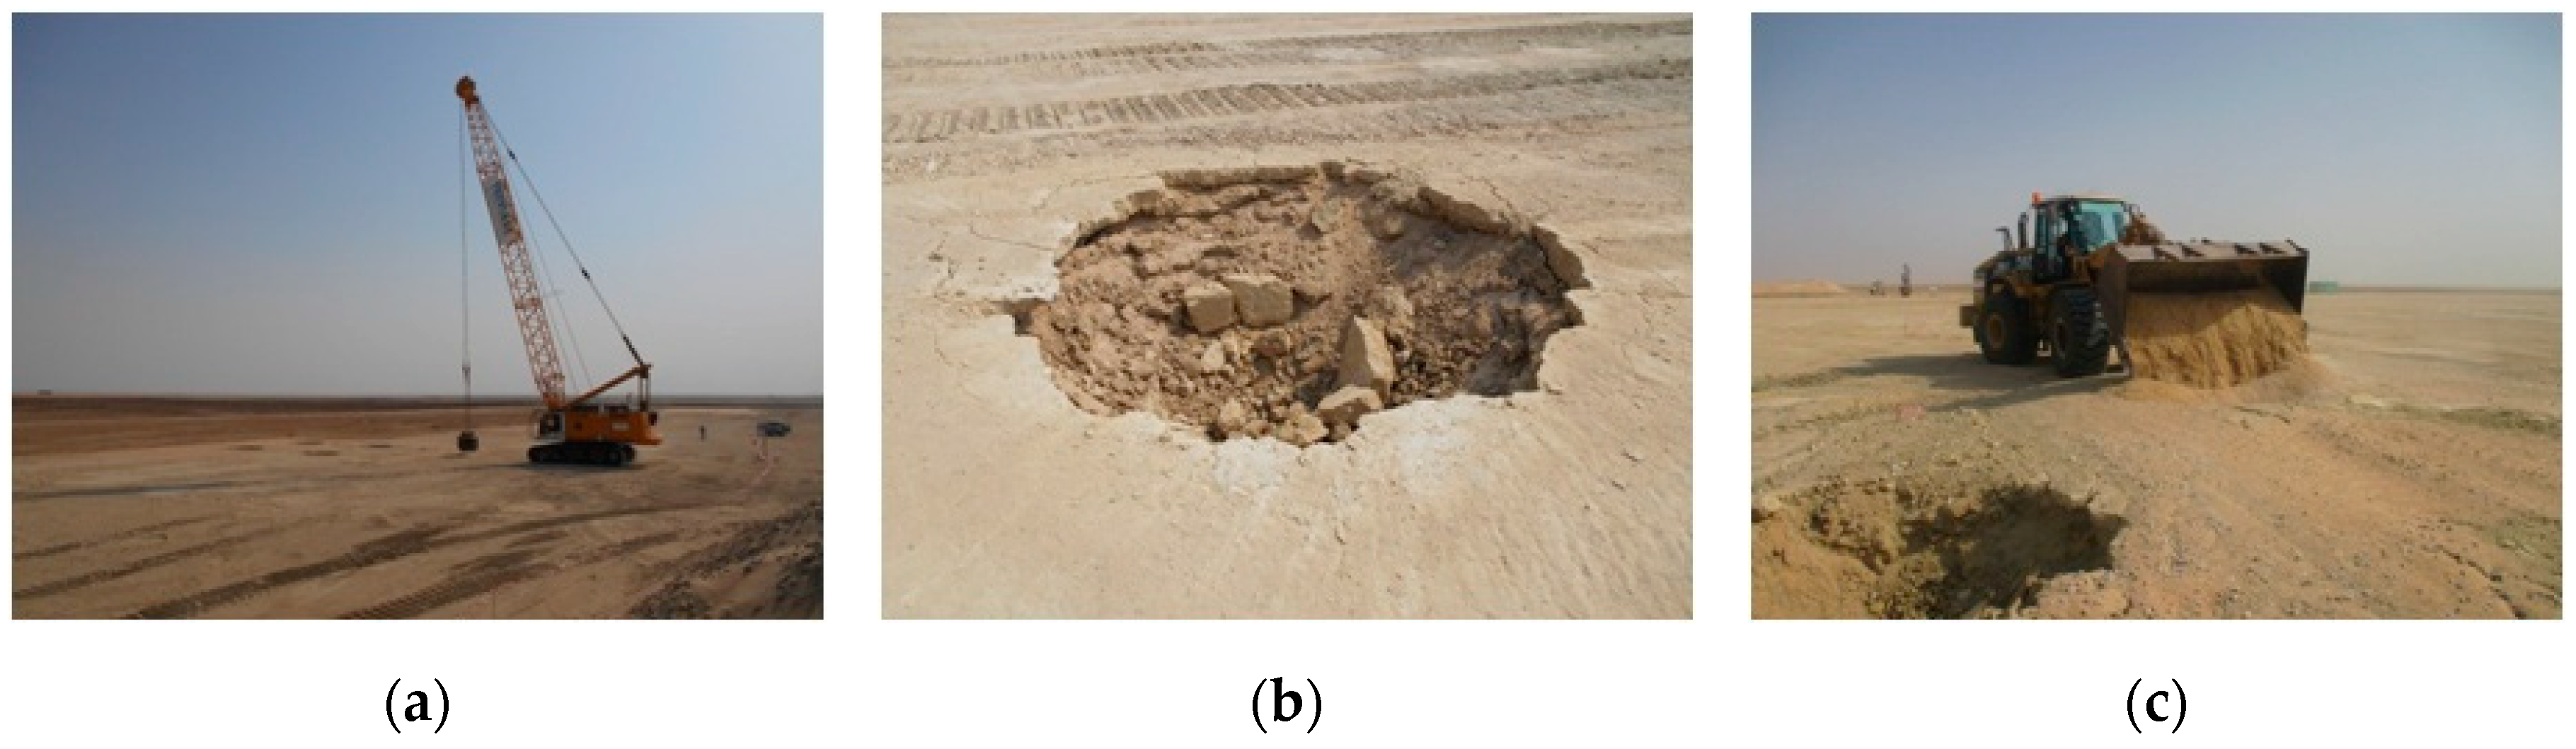
The trial dynamic compaction was conducted to evaluate the applicability in sabkha deposit. A 20-ton tamper with a diameter of 4 m was dropped from 15 m above the ground surface, as shown in
Figure 14a. The crater (
Figure 14b) formed by compaction was filled with carbonate sandstone (”gatch”) in order to prevent eccentric load occurring due to next compaction (
Figure 14c).
As shown in
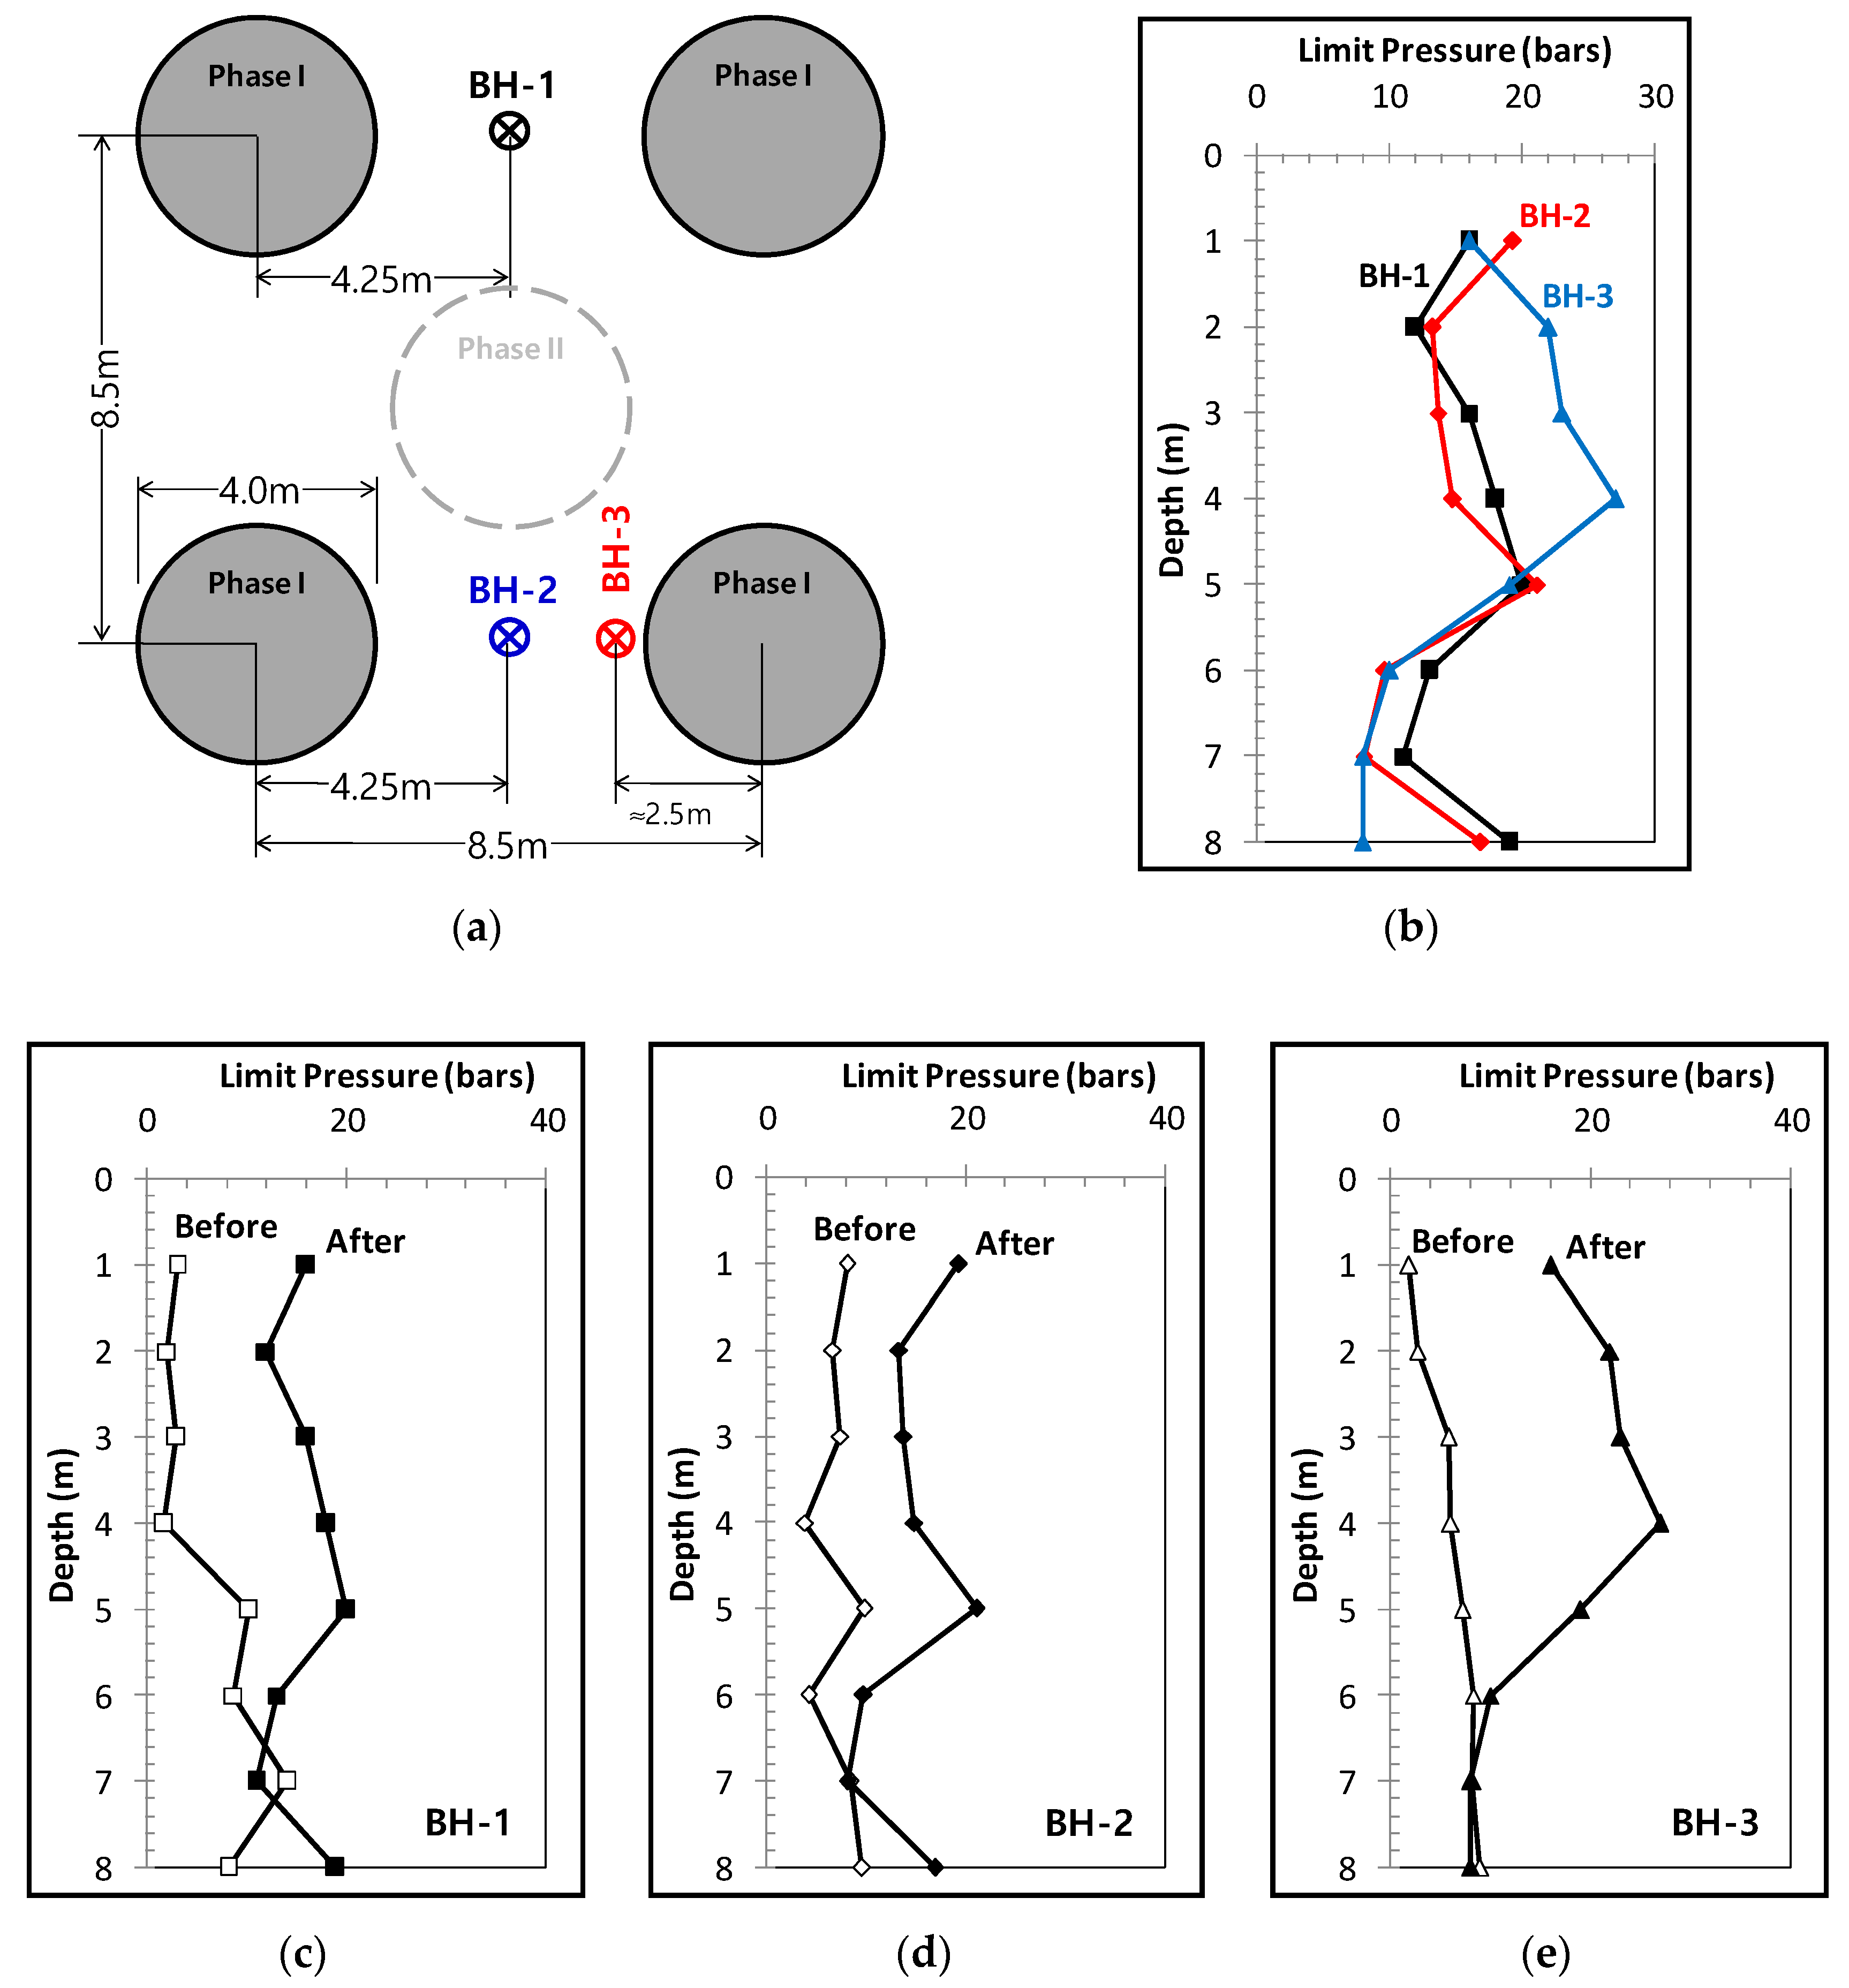
Figure 15a, the Phase-I trial dynamic compactions were carried out in three different zones, and pressuremeter tests were performed before and after the trial dynamic compactions. It should be noted that
Figure 15a shows only the relative locations of the boreholes for pressuremeter tests, and only one borehole was located in each dynamic compaction test zone. BH-1 and BH-2 were located at the midpoints between the two tamper drops, which were considered to have the least effects due to the compaction. BH-3 was located at about 2.5 m from the center of the tamper drop. The initial strengths estimated from the pressuremeter tests in three different zones were different because of different relative density values, but the grain size distribution and groundwater level were similar in all zones.
The increase in strength due to dynamic compaction was larger at BH-3 than BH-1 or BH-2. It was found that, although the initial strengths were different between BH-1 and BH-2, the final strengths of the sabkha deposit after application of dynamic compaction were similar, as shown in
Figure 16, because the geological and hydraulic conditions were similar. The total number of compactions was 10–15 times, and almost no increase in the ground subsidence occurred after compaction of 10–12 times or more. As shown in
Figure 16, the strength increments at all three locations were large until GL-4–5 m and then linearly decreased. It can be thought that the improvement depth was about 7 m and the maximum improvement depth was 4 m, which is about one half of the improvement depth.
The strength increments below GL-7 m were also found at BH-1 and BH-2, and the improvement depth was possibly deeper than GL-7 m. However, the pressuremeter tests were carried out only until GL-8 m, which was the target depth of improvement, and the strength of ground below GL-8 m was not measured. In the geotechnical investigation report, the thin soil layer with more than 40% of fines was observed intermittently at around GL-7 m. The possibility cannot be excluded that the absence of an increase in strength at GL-7 m was due to the presence of the thin silty soil layer, and the depth of improvement could be deeper than GL-7 m.
7. Conclusions and Discussion
The purpose of this study was to investigate the applicability of dynamic compaction in sabkha soil in the Arabian Gulf Coast region by performing test dynamic compactions and numerical analysis. The results and conclusions obtained from this study can be summarized as follows.
Problems due to excessive differential settlements may take place due to the inhomogeneity of the sabkha soil profile, the loose state of certain layers within the soil profile, and the highly variable compressibility of the various components of the soil. This may lead to severe differential settlements and to serious cracks and tilting in the structures on the sabkha soil, and ground improvement method, such as dynamic compaction, is required to be applied.
Considering the characteristics of sabkha deposit, it is considered appropriate to apply the coefficient of improvement depth of 0.60–0.65. The improvement depth was estimated as 8.5–13.0 m when a 20-ton tamper was dropped 12 times at a height of 10–15 m on the sabkha deposit. From the numerical analysis, the region where the volumetric strain increment was less than −0.1% was considered as the improvement depth.
Numerical results showed that both large compression and large expansion of ground tend to occur in the zone from the ground surface to GL-6 m, and it can be considered that liquefaction followed by particle rearrangement and large deformation take place in this zone.
The influence of dynamic compaction, such as subsidence and rebound, is large in the range of about 2D (D = diameter of tamper), and the effect of dynamic compaction is negligible at a distance greater than 4D.
The ground subsidence and the improvement depth tend to increase as the number of compaction increases, but it seems that the increase in ground subsidence and improvement depth is reduced after compacting more than 12–14 times.


