Article

Verification of the Structural Performance of Textile Reinforced Reactive Powder Concrete Sandwich Facade Elements

by
Mathias Flansbjer
,
Natalie Williams Portal
* and
Daniel Vennetti
Mechanics Research, RISE Research Institutes of Sweden, 50115 Borås, Sweden
*
Author to whom correspondence should be addressed.
Appl. Sci. 2019, 9(12), 2456; https://doi.org/10.3390/app9122456
Submission received: 26 April 2019 / Revised: 28 May 2019 / Accepted: 11 June 2019 / Published: 15 June 2019

Abstract

:
As a part of the SESBE (Smart Elements for Sustainable Building Envelopes) project, non-load bearing sandwich elements were developed with Textile Reinforced Reactive Powder Concrete (TRRPC) for outer and inner facings, Foam Concrete (FC) for the insulating core and Glass Fiber Reinforced Polymer (GFRP) continuous connectors. The structural performance of the developed elements was verified at various levels by means of a thorough experimental program coupled with numerical analysis. Experiments were conducted on individual materials (i.e., tensile and compressive tests), composites (i.e., uniaxial tensile, flexural and pull-out tests), as well as components (i.e., local anchorage failure, shear, flexural and wind loading tests). The experimentally yielded material properties were used as input for the developed models to verify the findings of various component tests and to allow for further material development. In this paper, the component tests related to local anchorage failure and wind loading are presented and coupled to a structural model of the sandwich element. The validated structural model provided a greater understanding of the physical mechanisms governing the element’s structural behavior and its structural performance under various dead and wind load cases. Lastly, the performance of the sandwich elements, in terms of composite action, was shown to be greatly correlated to the properties of the GFRP connectors, such as stiffness and strength.

1. Introduction

At the end of the 1950s, precast concrete elements emerged as a popular cladding solution for housing. Between the 1960s–70s, a renowned Swedish public housing project, entitled Million Program, made use of prefabricated modular concrete to construct residential buildings [1]. During this era, a number of realized European housing projects led to the extensive development of construction techniques related to precast concrete. During the 1960s–80s, the precast concrete industry, pertaining to the application of building envelopes, primarily made use of conventional steel reinforced concrete (RC). RC elements, however, pose certain disadvantages, such as the need for a thick concrete cover to protect the reinforcement. For instance, based on EN 206-1 [2], a recommended minimum concrete cover thickness can amount to 30–35 mm, considering XC3/XC4 exposure classes. Accordingly, the thickness of a facing can be around 80 mm, leading to not only a thick, but also a heavy, member. This issue was tackled in a project funded by the European Commission, SESBE (Smart Elements for Sustainable Building Envelopes). In SESBE, so-called smart facings were developed with several features: thin, lightweight, and adaptable via the inclusion of nanomaterials. A precast cladding solution taking the form of a sandwich element was developed using a combination of high-performance materials, such as Textile Reinforced Reactive Powder Concrete (TRRPC) for the facings, Foam Concrete (FC) for the insulating core, and glass fiber reinforced polymer (GFRP) continuous connectors.
The thickness and weight reduction of precast concrete has been successfully achieved by the development and application of new material alternatives. Conventional steel reinforcement has, for example, been replaced by textile reinforcement, while high-performance concrete, such as Ultra-High Performance Concrete (UHPC) or Reactive Powder Concrete (RPC), has replaced normal concrete. Lately, innovative façade elements have been produced using UHPC or Textile Reinforced Concrete (TRC), exemplified by ventilated façade cladding [3] and sandwich elements [4,5,6]. Progressively more UHPC (or RPC) has been applied in façade applications, as this composite material has revealed extraordinary features, such as durability and high strength [7,8,9]. By embedding textile reinforcement in this type of matrix, so-called Textile Reinforced Reactive Powder Concrete (TRRPC), a versatile precast product [10] which enhances the post-cracking behavior of high-strength concrete [5,11,12] can be assembled.
The design and verification of novel façade elements are typically realized by means of experiments combined with numerical modelling. Small-scale tests at the material or component levels can be initially conducted to gain knowledge related to flexural and composite behaviors of the developed elements. Full-scale testing can thereafter be performed to evaluate the structural performance according to e.g., service and ultimate loads. An example of this approach was presented in [13], wherein the structural performance of precast concrete sandwich facings developed with a system of FRP connectors was analyzed via small-scale and full-scale testing coupled with numerical analysis. Another study focused on the experimental testing of components, so-called small-scale, paired with the numerical analysis of the mechanical behavior of full-scale sandwich facings while using inverse analysis and relevant codes for parameter estimation [14,15,16]. The flexural behavior of TRC sandwich facings was investigated both experimentally and numerically in various works [17,18]. Moreover, multiscale mechanical modelling of TRC sandwich facings (i.e., micro, meso and macro) compared to macroscopic modelling in connection with experimental verification has also been shown to effectively predict the structural behavior of such elements [19].
This paper presents the validation of the structural performance of the developed TRRPC sandwich façade elements. Validation was established by means of a thorough experimental program coupled with finite element analysis (FEA). Within the SESBE project, experiments were conducted on individual materials (i.e., tensile and compressive tests) [11,20], composites (i.e., uniaxial tensile, flexural and pull-out tests) [21] and components (i.e., local anchorage failure, shear, flexural and wind loading tests) [22,23,24]. The experimentally yielded material properties were used as input for numerical models to better understand the findings of various component tests and allow for further material development. In this paper, a structural model of the element under wind loading was validated via experimental results. Lastly, this model was expanded to a full-size sandwich element with and without openings to further facilitate the prediction and analysis of its structural performance in relation to a given design scenario and SLS and ULS requirements.

2. Sandwich Façade Element Concept

2.1. Sandwich Element Details

The sandwich elements were designed as prefabricated concrete cladding with a surface area ranging from 7–10 × 2.7–3.0 m and weight of 2–5 ton, as per Figure 1. Conceptually, these elements cover the standard height of one storey and are attached to the main load-bearing structure via an anchorage system. Due to their immense size, these elements actively carry and transfer, e.g., self-weight and wind loads to the structure. Moreover, these elements consist of two facings made of 25 mm thick TRRPC, which are separated by a FC insulating layer of 150 mm. Connectors made of GFRP are embedded in the facings to ensure a certain level of composite action. Standard steel anchorage systems are installed to fasten the façade element to adjacent elements or structural members. The individual components which make up the novel sandwich elements are further discussed in Section 3.
Based on preliminary structural investigations in the conceptual phase, a thorough testing and modelling program was defined, as per Figure 2, to enable the verification of the structural performance of the elements at different phases, namely material development, component modelling and testing. The numerical analysis and experiments were conducted parallelly with the material development and characterization. Additionally, the evaluation was performed using an iterative process because of the underlying interaction between the materials and components. As emphasized in Figure 2, this paper focuses on presenting the methods and results pertaining to the local failure (anchorage) and wind load experimental tests, along with the verification of the overall behavior and detailed model of the sandwich element. The material development has been presented elsewhere for RPC [11,20], FC [25], GFRP [22] and TRRPC [21]. The component testing and modelling related to connector local failure and shear tests can be found in [24], and that concerning the four-point bending tests in [22].

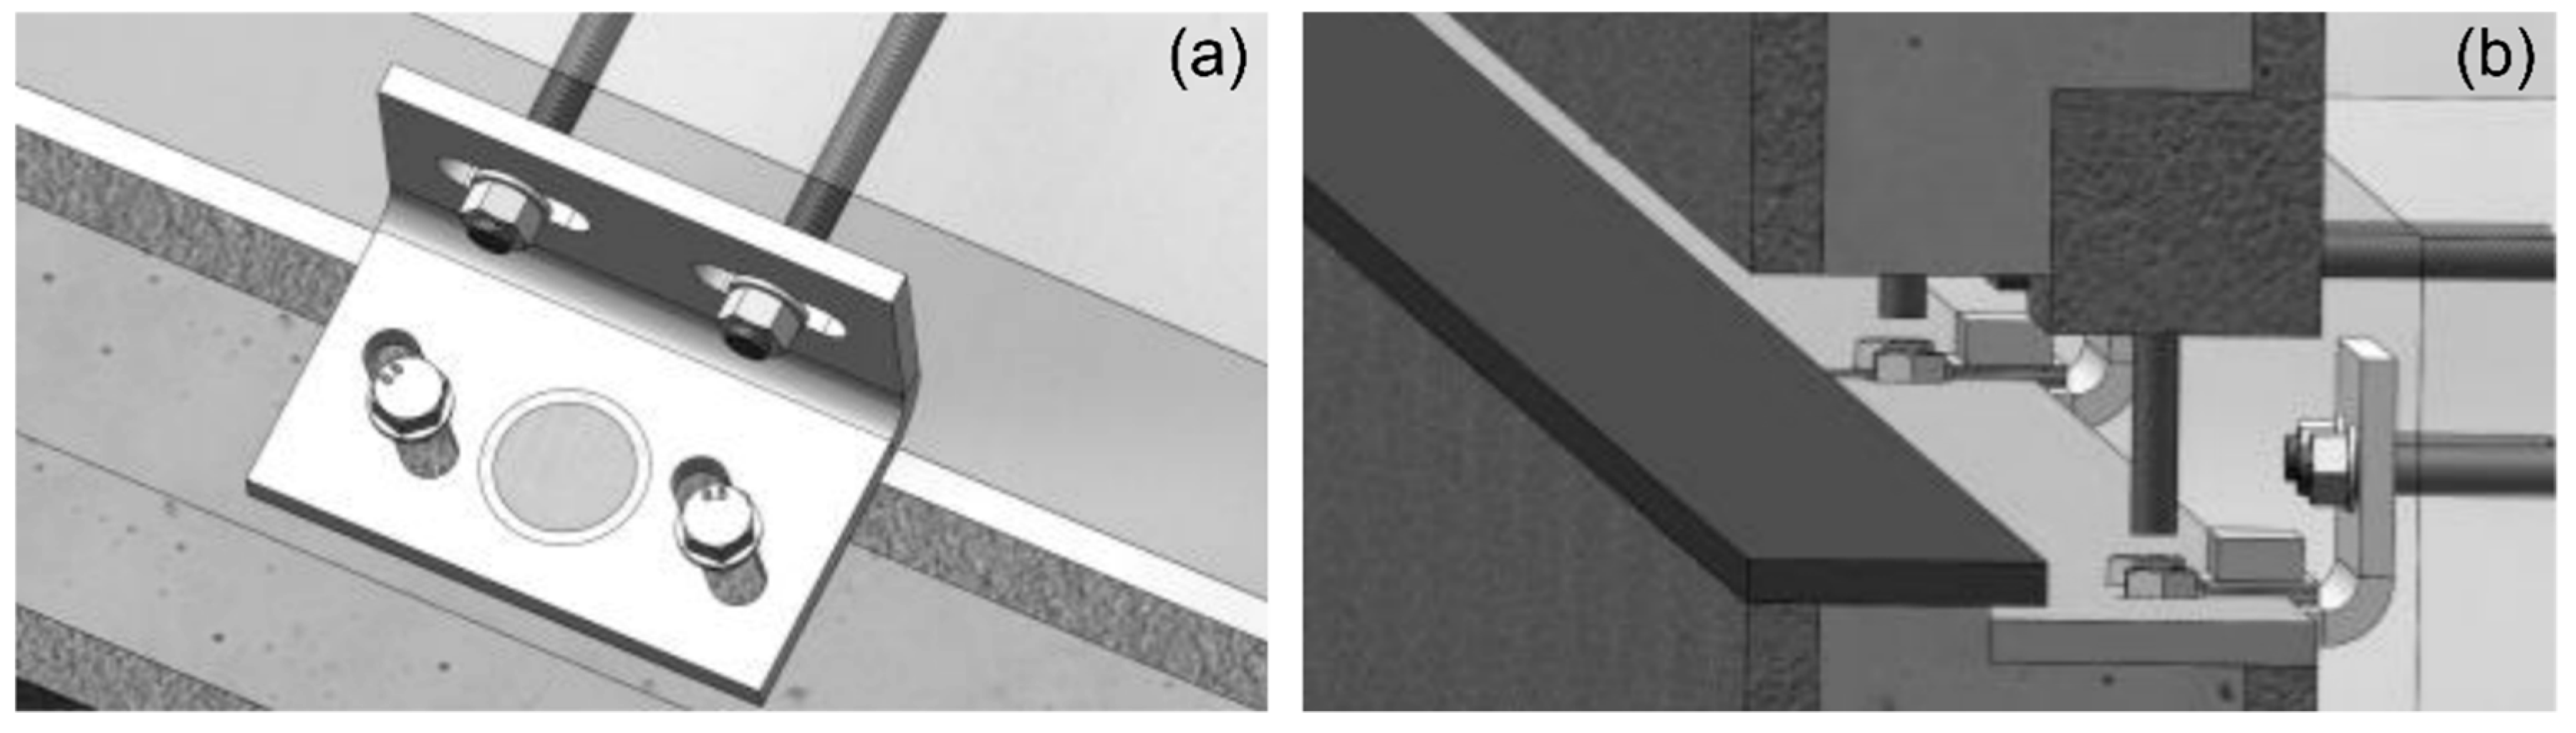
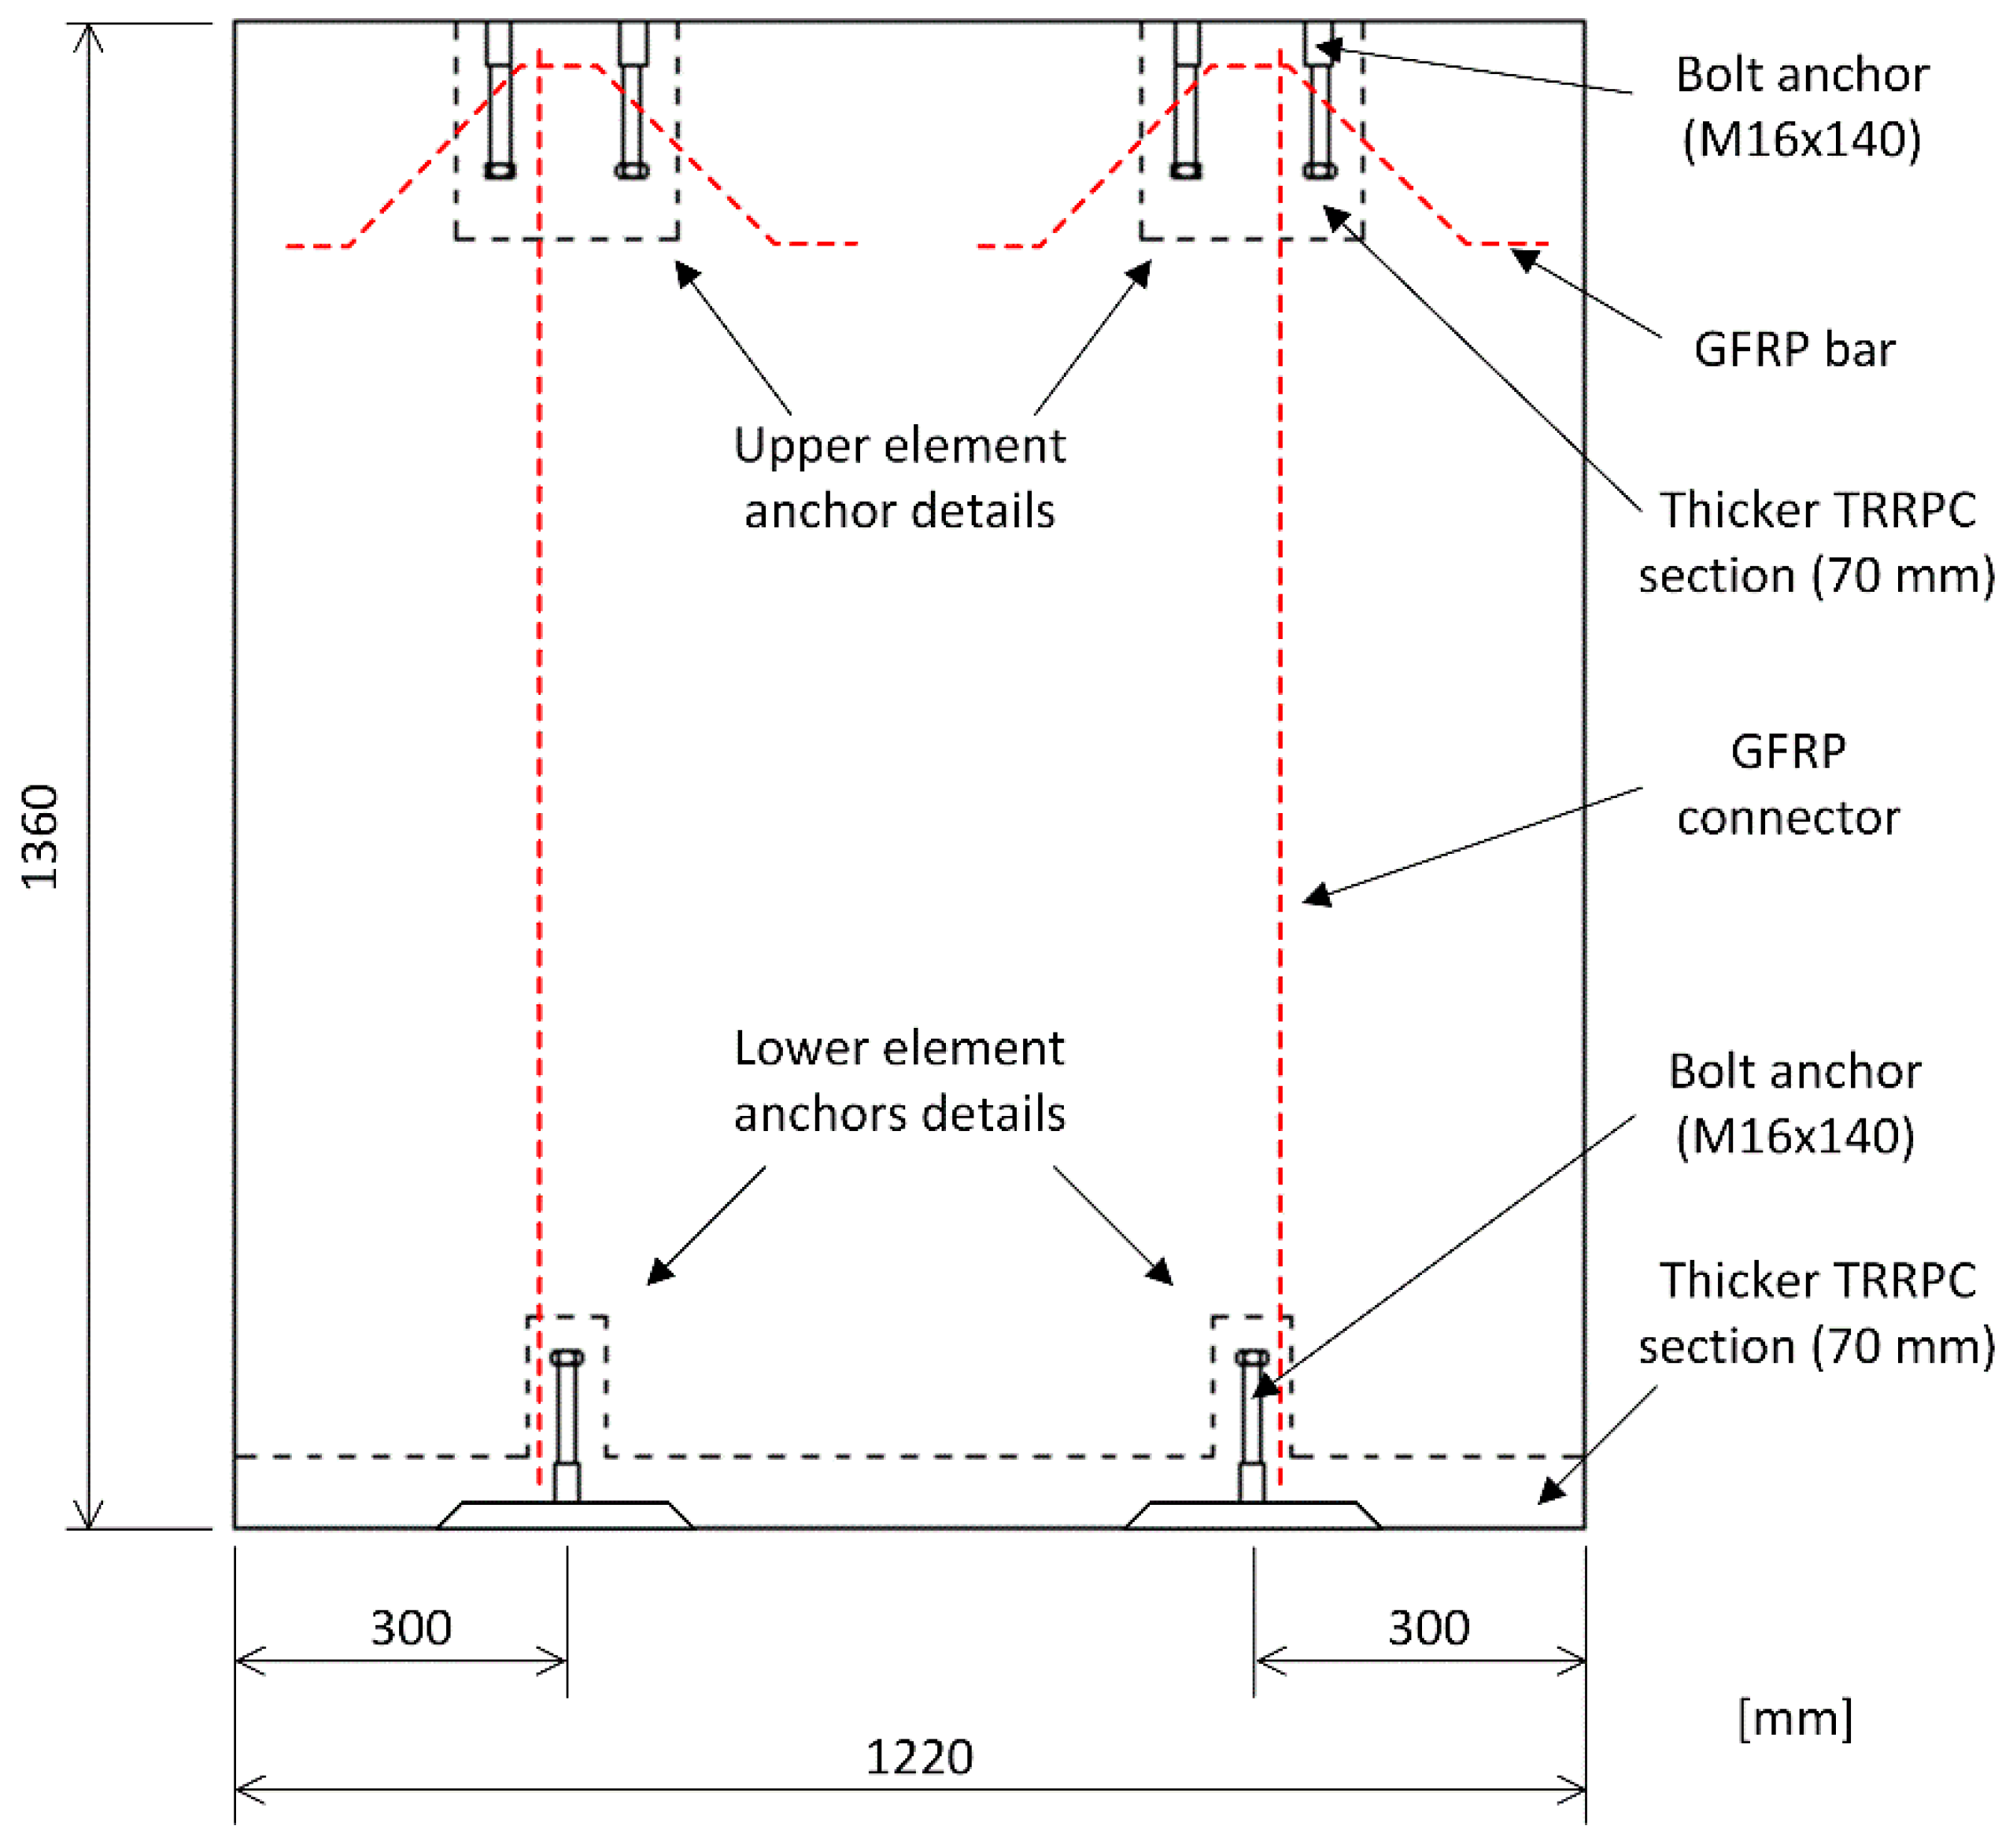
2.2. Anchorage System

Based on the given design, the sandwich elements are subjected to two types of loads, namely vertical permanent loads, i.e., self-weight (G) of element and horizontal variable loads caused by wind (Wext and Wint). The subjected loading and reaction forces are schematically illustrated in Figure 1. The self-weight of the element is assumed to be taken as a vertical reaction force (VE) at the bottom anchors, and then transferred through the angle plate into the load bearing structure. The force will be taken as contact stress at the lower edge of the element and will be considerably lower than the compressive strength of the RPC. Alternatively, the vertical force can be transferred directly to the element below as a self-supporting façade system. In addition, the anchors need to withstand horizontal reaction forces (HEu and HEl) due to self-weight and both wind pressure and wind suction. At the upper anchorage point, the horizontal reaction force is transferred to the angle plate by two embedded bolt anchors (Figure 3a) and at the lower anchor details by one threaded stud inserted into the embedded bolt anchor (Figure 3b). Hence, the element anchors will mainly be subjected to shear load introduced at the bolt anchors. The shear load capacity of the anchors is more complicated to determine by calculations, and therefore, needs to be verified by tests. For the sake of obtaining design criteria, the shear capacity of the anchors was experimentally quantified in this project, as further explained in Section 4.1.1.

3. Materials

3.1. Textile Reinforced Reactive Powder Concrete (TRRPC)

TRRPC is composed of an RPC reinforced by a carbon-based textile grid coated by epoxy. Considering a precast concrete façade application, the RPC recipe includes large quantities of supplementary cementitious materials (SCMs). RPC is synonymous to UHPC such that it consists of six to eight different components and aggregate size of 2 mm or less. Table 1 presents the average strength values for RPC, while other details can be found in [11].
The textile grid applied in the TRRPC consists of carbon fibers with an epoxy coating. Superior bond properties between the concrete and textile are typically observed when epoxy is applied. Individual rovings were tested in tension as per [26], which indicated that the tensile strength in the warp and weft directions was 3433 MPa and 3878 MPa, respectively. The Young’s modulus in the warp and weft directions was 233 GPa and 248 GPa, respectively. These average values are similar to those obtained by the producer.
The tensile behavior of thin TRRPC facings was quantified by means of uniaxial tensile tests performed according to RILEM TC 232-TDT [27], with the addition of Digital Image Correlation (DIC) measurements (refer to [21] for further details). The test specimens had dimensions of 700 × 100 × 25 mm and were reinforced by two layers of carbon grid. During testing, a relatively stiff and linear behavior was noted prior to first cracking. First cracking thereafter occurred presumably when the tensile strength of the concrete was reached (3 MPa). This was followed by load jumps with minimal load increase, being indicative of multiple cracking along the specimen. Cracking typically initiated in proximity to the lateral rovings, which were observed to be a location prone to stress concentration.

3.2. Foam Concrete (FC)

FC, also known as cellular lightweight concrete (CLC), is applied as a thermally insulating layer in the developed sandwich element. It is made of a lightweight cementitious material with the following constituents: cement, sand, water and foam (water, air and surfactant). FC is typically made of a minimum of 20% by volume of mechanically entrained air in the fresh cement paste or mortar [28]. Based on project findings, FC has a minimal environmental impact compared to other insulation materials, such that it has ca. 70% lower embodied energy than expanded polystyrene (EPS) foam. Additionally, under fire exposure, neither smoke or toxic gases are released. FC was optimized in this project in terms of heat conductivity, density and compressive strength. Specifically, a thermal conductivity between 0.04–0.06 W/(m·K) and a wet density between 200–300 kg/m3 were achieved. By adding Quartzene® (Svenska Aerogel AB, Gävle, Sweden) [25] to FC, the thermal conductivity can be reduced to 0.03–0.035 W/(m·K). The stiffness and compressive strength pertaining to FC, with a density of 200–400 kg/m3, ranged between 5–37 MPa and 95–472 kPa, respectively. The addition of polypropylene fibers (length of 12 mm), with a dosage of 0.25%-vol., improved both the material’s handleability and post-cracking behavior. These mentioned supplementary constituents were excluded in the FC incorporated in the sandwich elements.

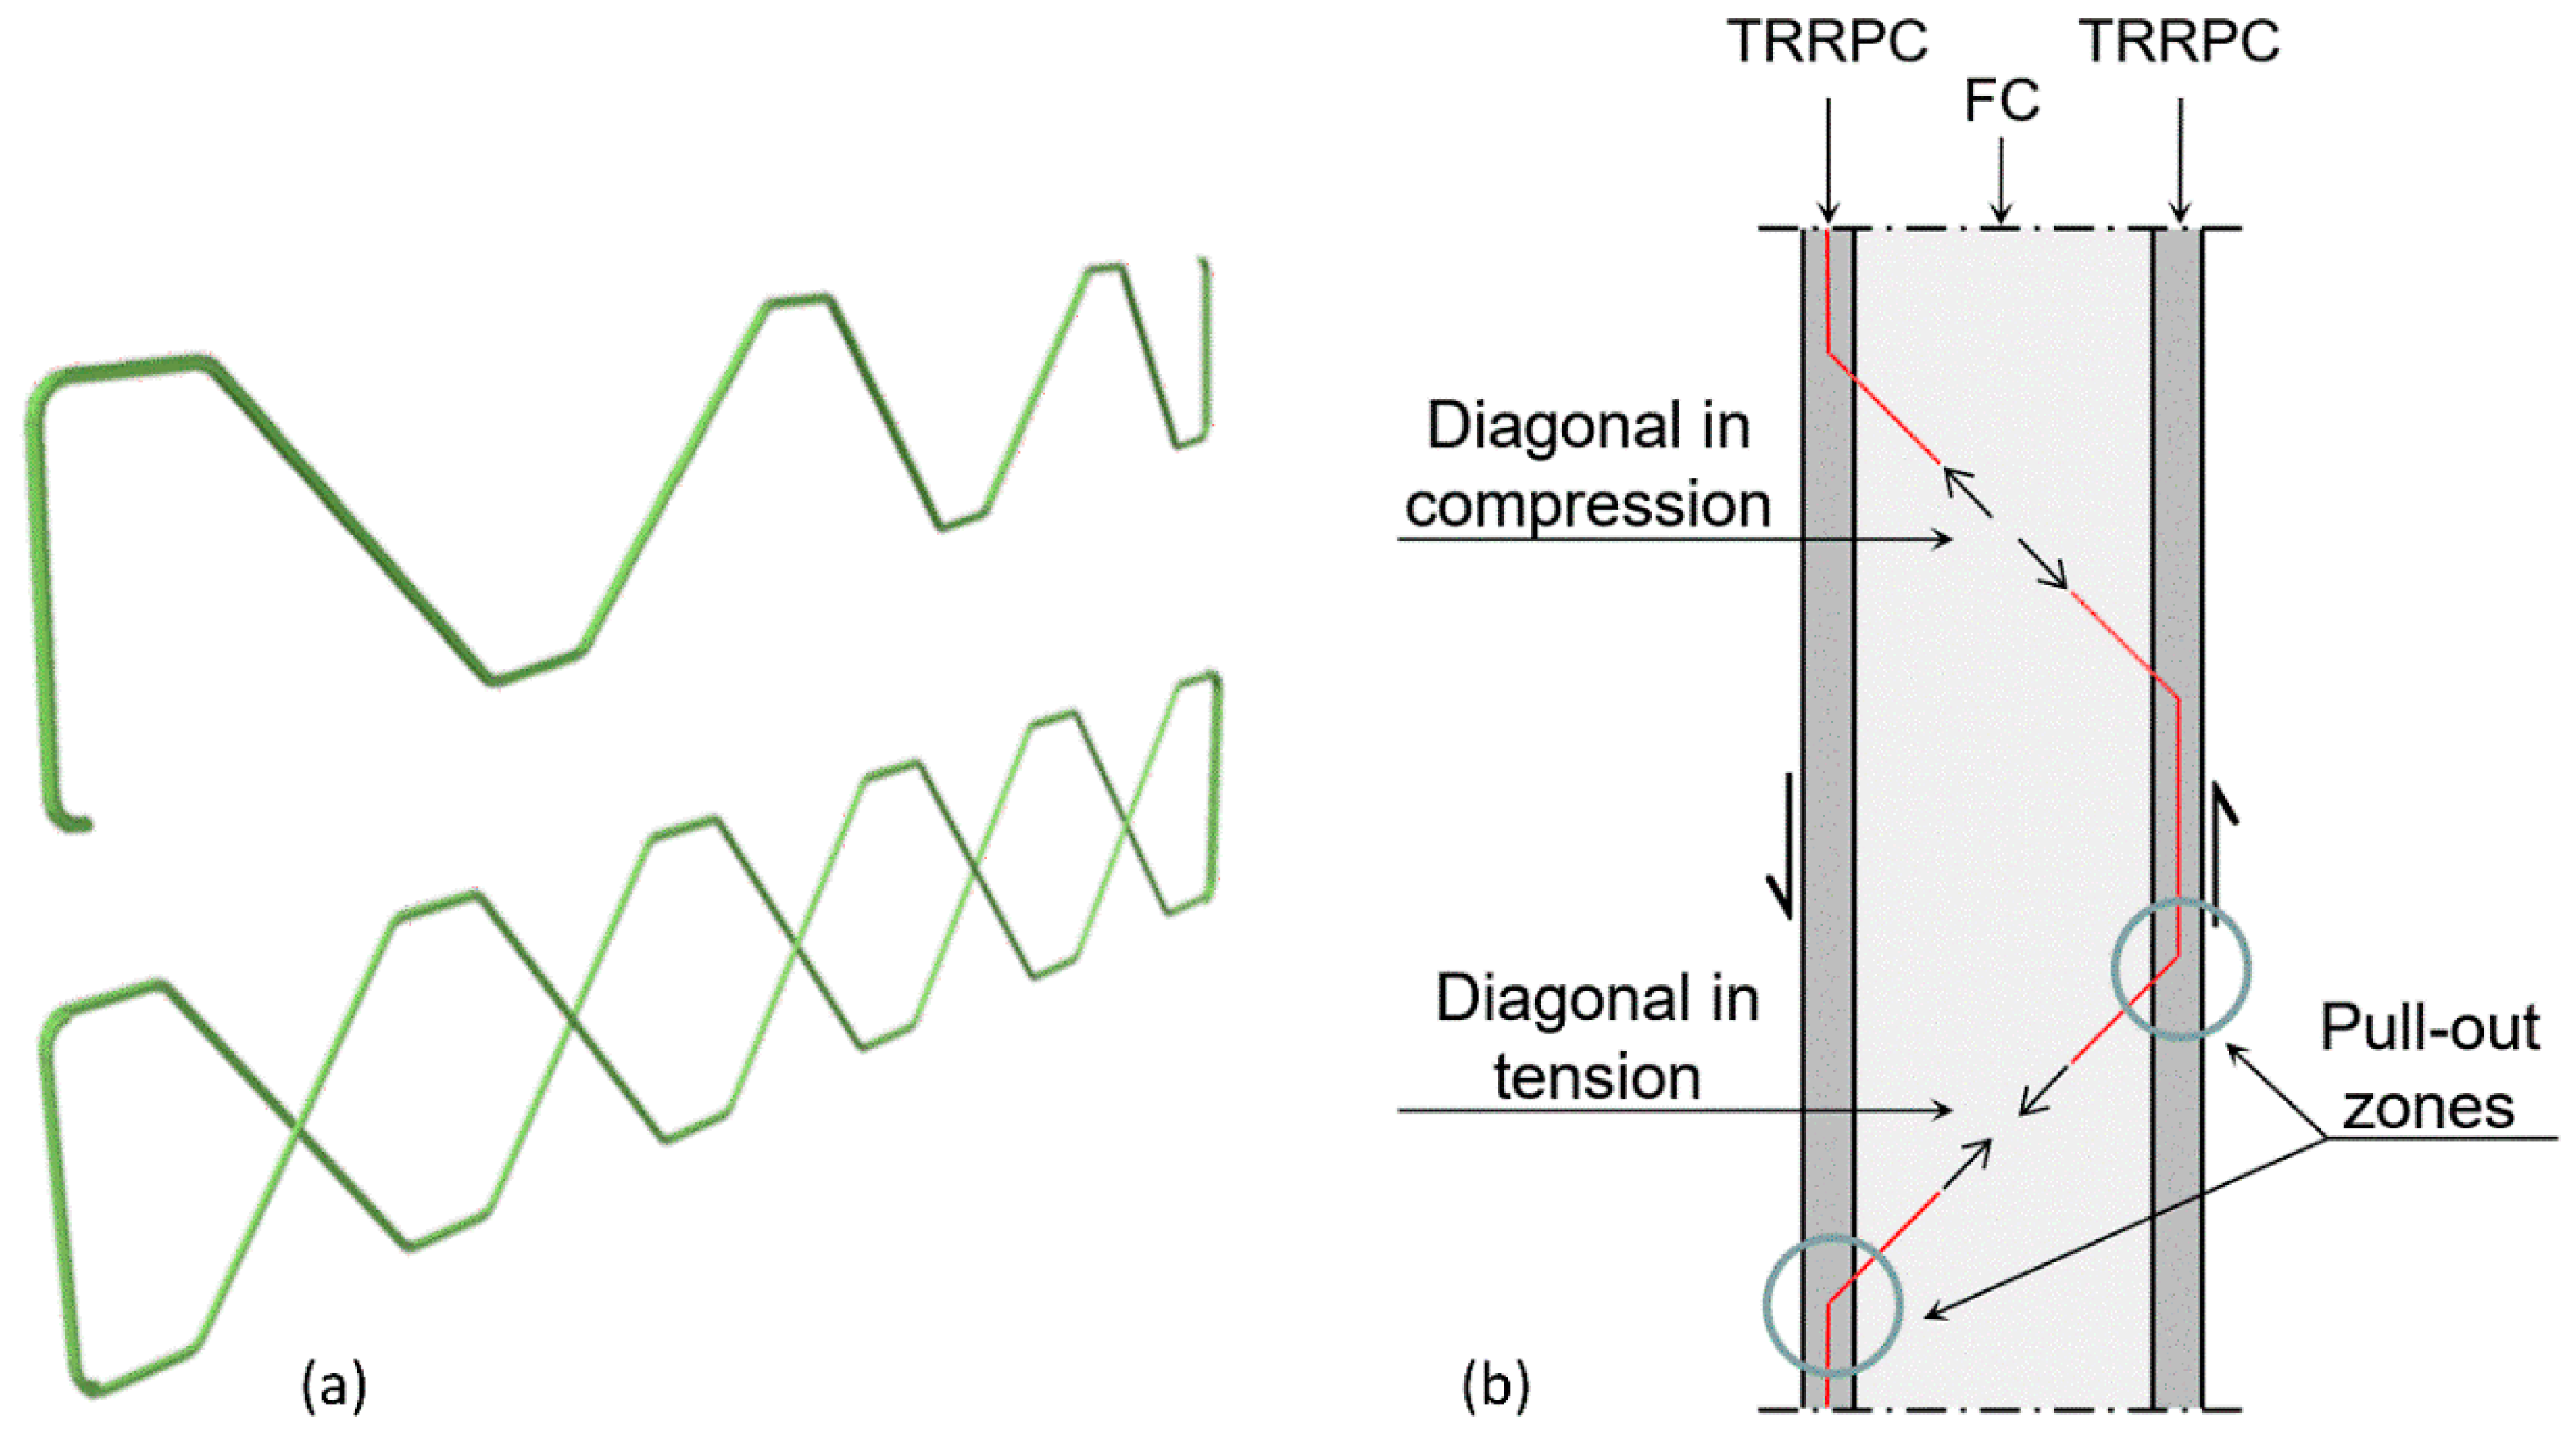
3.3. Glass Fibre Reinforced Polymer (GFRP) Connectors
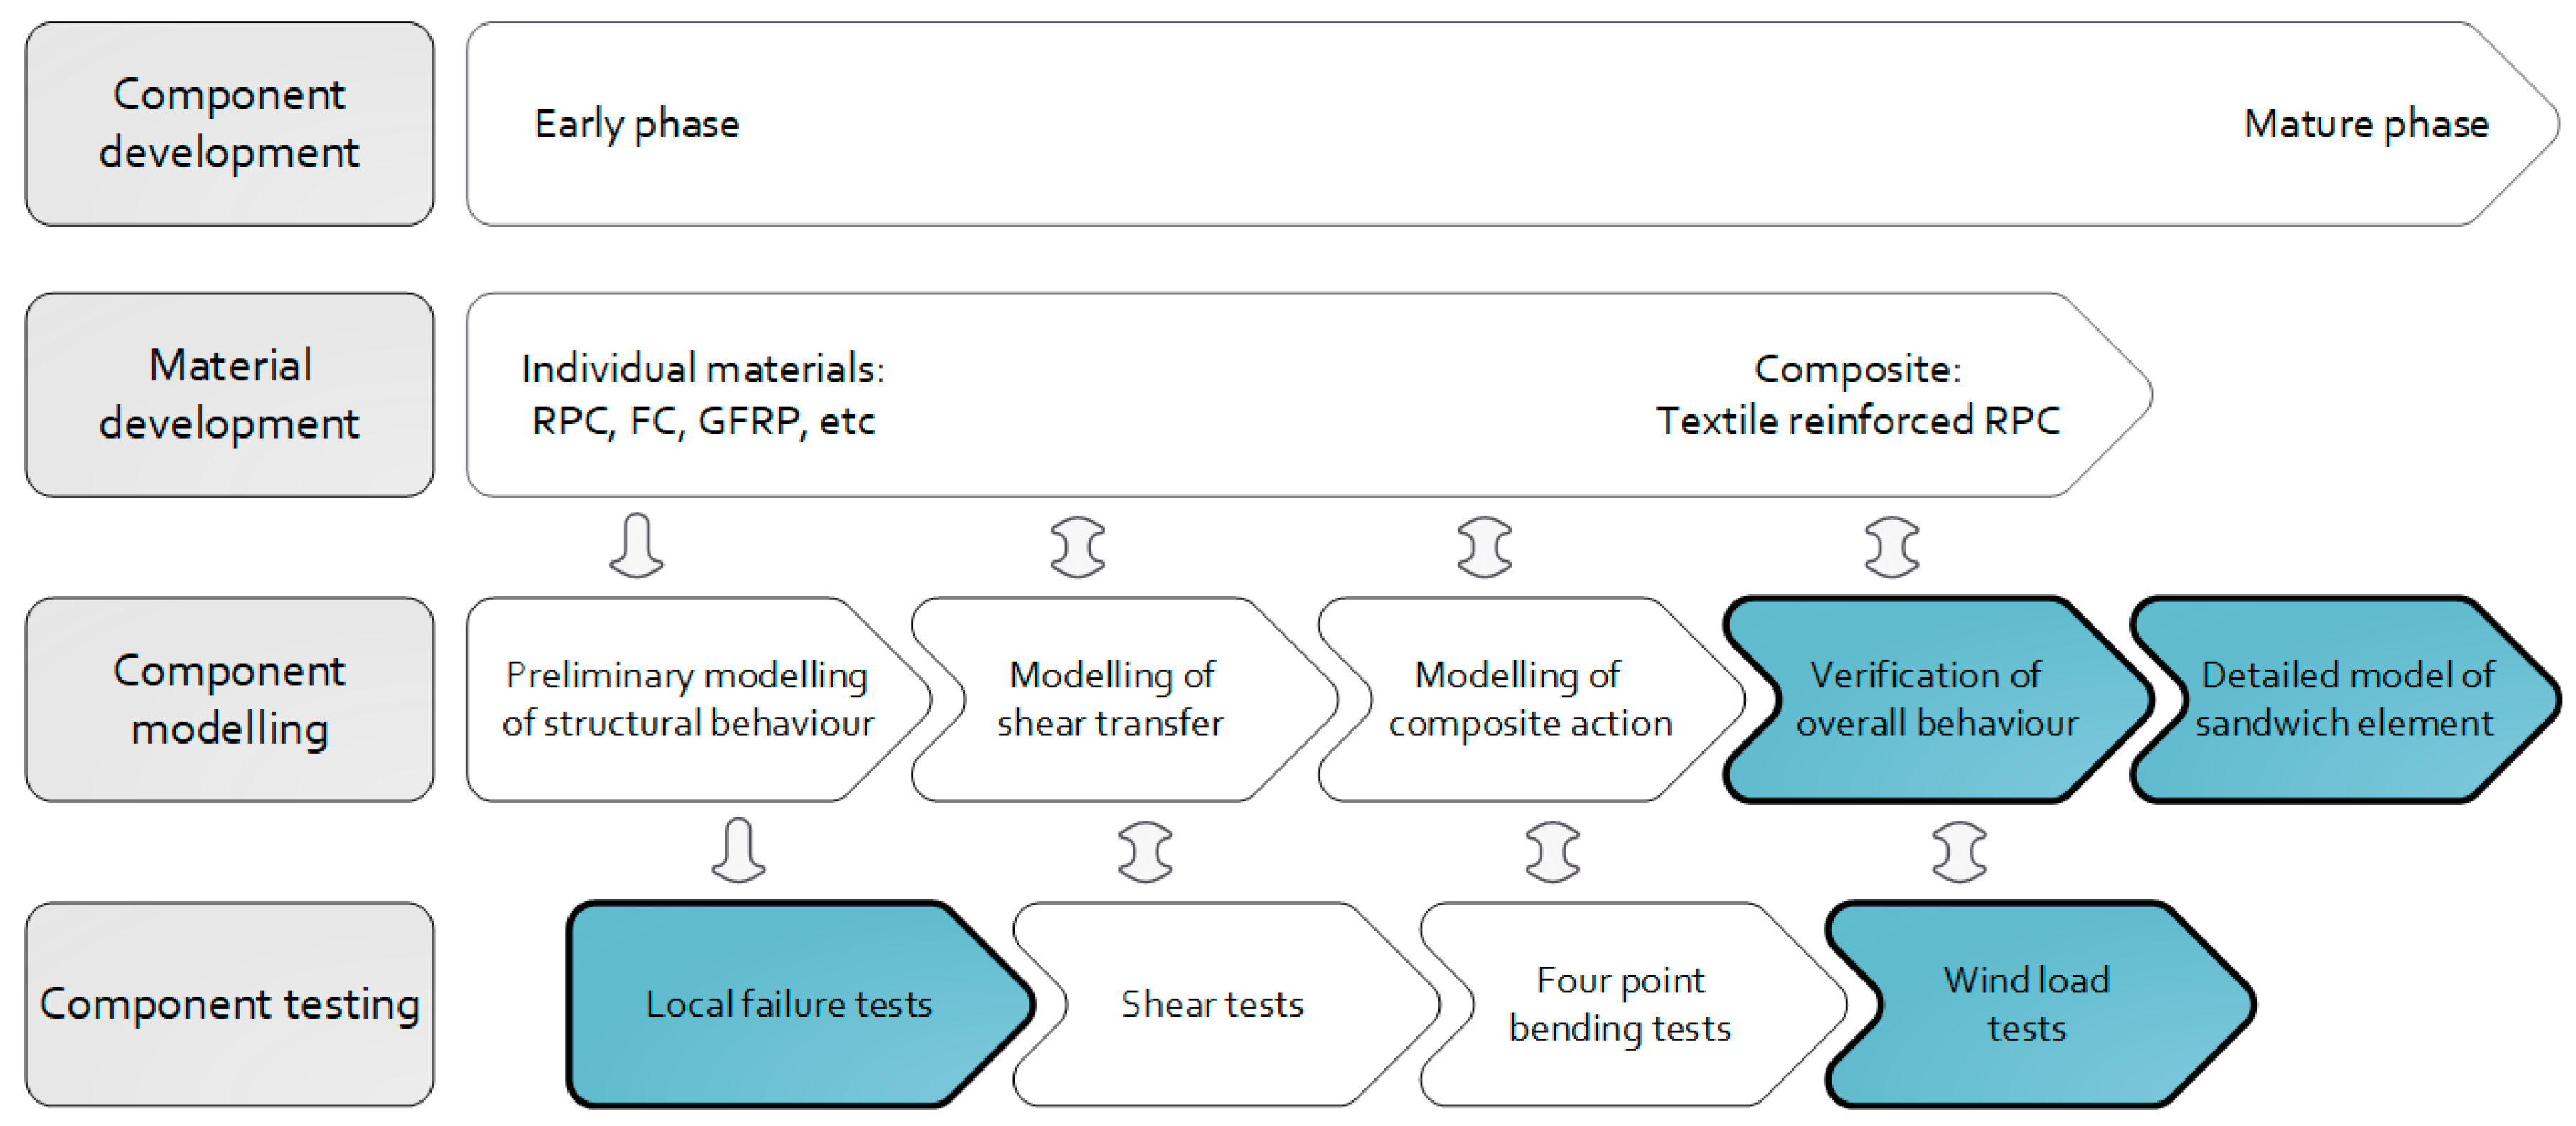
The composite action between the TRRPC facings of the element was enhanced by incorporating GFRP truss-like connectors. The connectors were fabricated using pultruded bars made of E-glass fibers impregnated with an epoxy resin. The bars, having a nominal diameter of ca. 6.1 mm, were reinforced by a bundle of E-glass fibers to form helical ribs on the bar’s surface. In a half-cured state, the bars were bent into a zig-zag shape, followed by final curing. Two configurations were studied in this project, denoted as single (S) and double (D); see Figure 4a. A double connector is composed of two single connectors mirrored with respect to the longitudinal direction and fastened at intersecting points using plastic tie straps. The connector performance in an element was previously investigated via modelling and testing on a component level [22,24]. As a result, the diagonal bars were observed to be primarily loaded by axial tensile and compressive forces, as illustrated in Figure 4b.
The incorporation of connectors in thin facings is generally challenging, as it may prove difficult to enable load transfer without causing local pull-out failure at the connector. Accordingly, it was of key importance to further understand the properties on both material and component levels. Tensile, compression and pull-out tests were therefore performed; for details, refer to [22]. Table 2 provides the experimental results for the given GFRP connectors.
The critical buckling load in compression was experimentally quantified for different buckling lengths, based on the length of connector diagonals (inclination of 45°) in elements with different facing distances, i.e., dependent of the FC insulation thickness. In this study, the TRRPC facing distance was set to 150 mm which corresponds to a buckling length of approximately 212 mm.
The pull-out capacity of the connectors was determined from small-scale tests. Pull-out tests were conducted on connector segments cast in TRRPC panels (50 × 400 × 400 mm) with an embedment length of 10 mm. To simulate the actual loading of the connector in a facing (see Figure 4b), loading was applied axially along the connector at a 45° angle from the surface of the facing. The test parameters presented here were established based on a parametric study conducted in this project to initially evaluate the effect of embedment depths and connector types, see [24].

4. Methods

4.1. Experimental Methods

The material development and component testing phases consisted of an array of experimental investigations, as previously depicted in Figure 2. Most of the methods have been published elsewhere as specified in Section 2, apart from the tests performed on anchors embedded in a TRRPC facing and wind load testing on sandwich elements. Accordingly, the methods pertaining to these given component tests are described in detail.

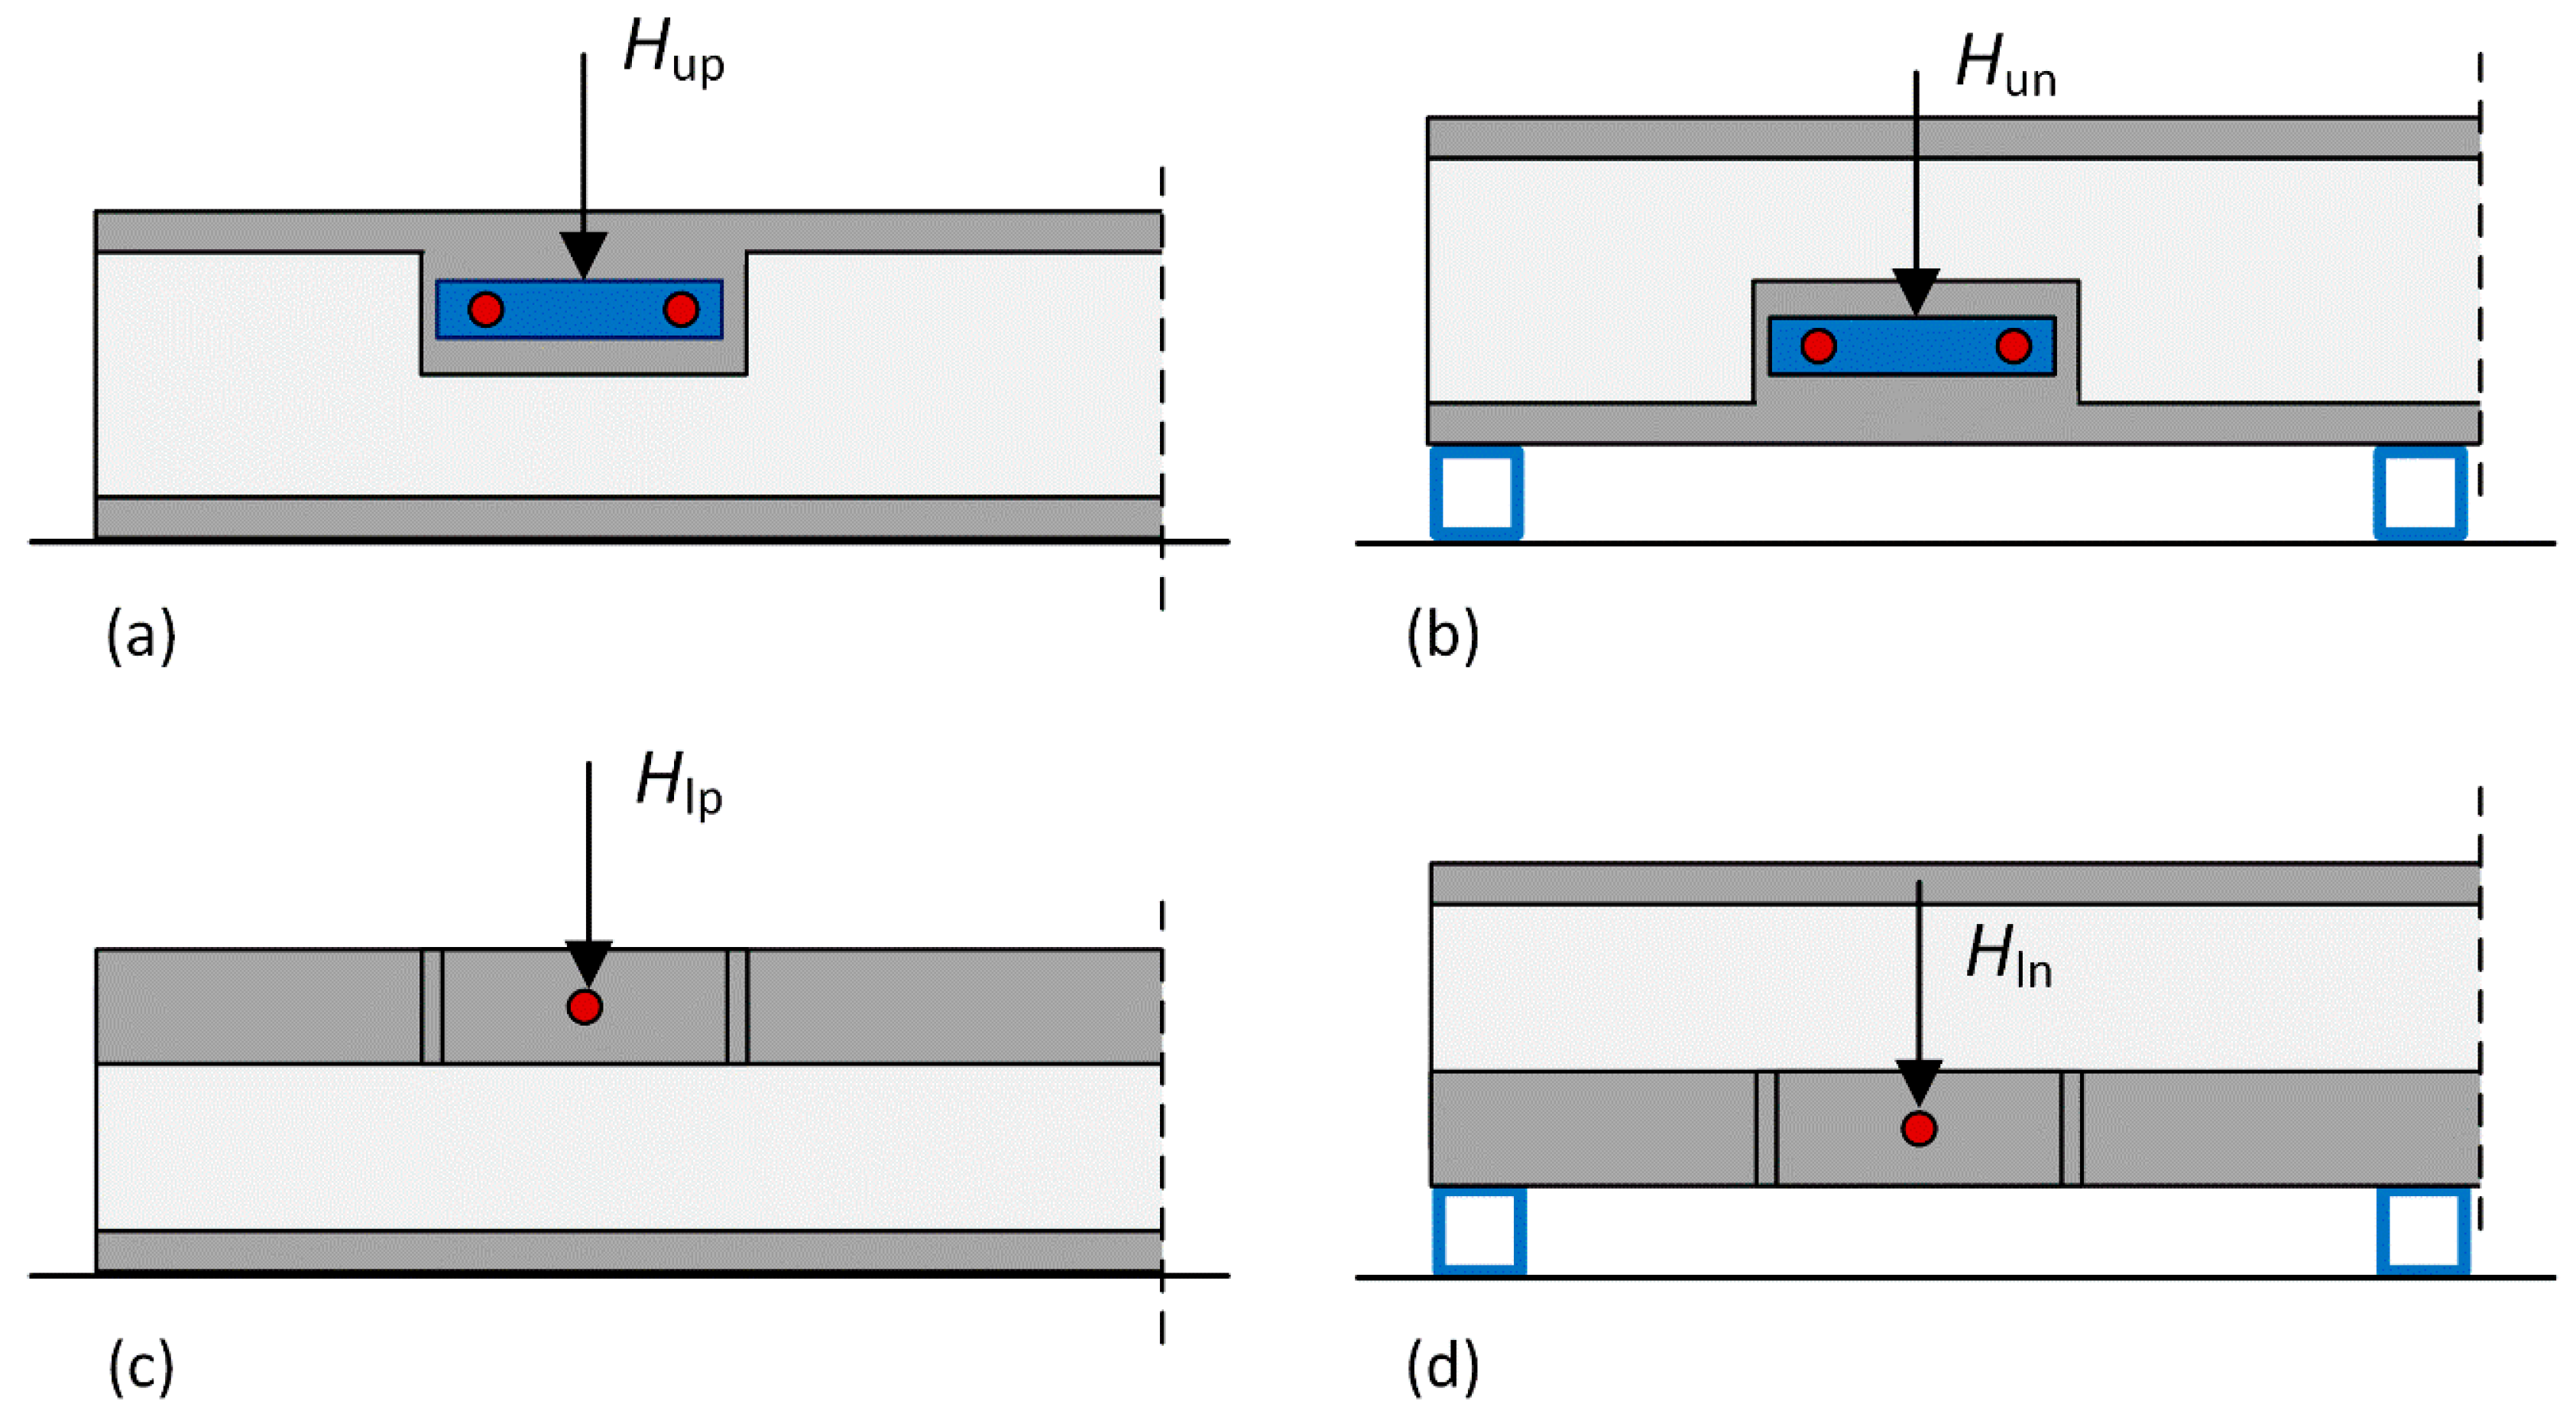
4.1.1. Anchorage Testing

The element anchor system, previously discussed in Section 2.2, was experimentally investigated in this study. The main challenge associated with this system is such that the screw anchors should be embedded in a thin TRRPC facing (25 mm) all while being able to effectively transmit the horizontal forces from the sandwich element to the load bearing structure. The specimens (1360 × 1220 mm) were designed as small-scale façade elements, according to that shown in Figure 5. The elements consisted of two 25 mm TRRPC facings set apart by a 150 mm layer of FC. Both facings contained two carbon textile grid layers, placed symmetrically in the center of the facings. The two TRRPC facings were connected by two lines of GFRP connectors in each specimen. Each test specimen was provided with two upper element anchor details and two lower element anchor details. The inner facing was strengthened locally by increasing the facing thickness to 70 mm at the position of the two upper element anchoring details, each consisting of two bolt anchors (M16 × 140). The upper thickened sections were reinforced with one extra GFRP bar profile. The elements were also strengthened by a thicker section (70 mm) along the lower edge of the inner TRRPC facing, in which the two lower bolt anchors (M16 × 140) were incorporated. Six specimens were manufactured, and each element anchor detail was used for a given test configuration.
The shear load capacity tests of the anchor details were conducted using a servo-hydraulic testing machine. The shear load capacity related to the upper and lower element anchors was determined by four different test cases to account for positive and negative wind load: (a) positive shear load at upper anchors (Hup), (b) negative shear load at upper anchors (Hun), (c) positive shear load at lower anchors (Hlp) and (d) negative shear load at lower anchors (Hln). Schematic illustrations of the set-ups for the four different test cases can be seen in Figure 6. In the upper element anchor tests (cases a and b), the shear load (Hup and Hun) was applied to a steel profile connected to the two bolt anchors. For the lower element anchors (cases c and d), the shear load (Hlp and Hln) was applied directly to a threaded rod inserted in the bolt anchor. In test cases a and c, the specimens were placed directly on the laboratory floor, as for cases b and d, the specimens were placed on two supporting steel profiles. The load was applied using a displacement rate of 2.0 mm/min and was logged by a 100 kN rated load cell (accuracy greater than 1%).

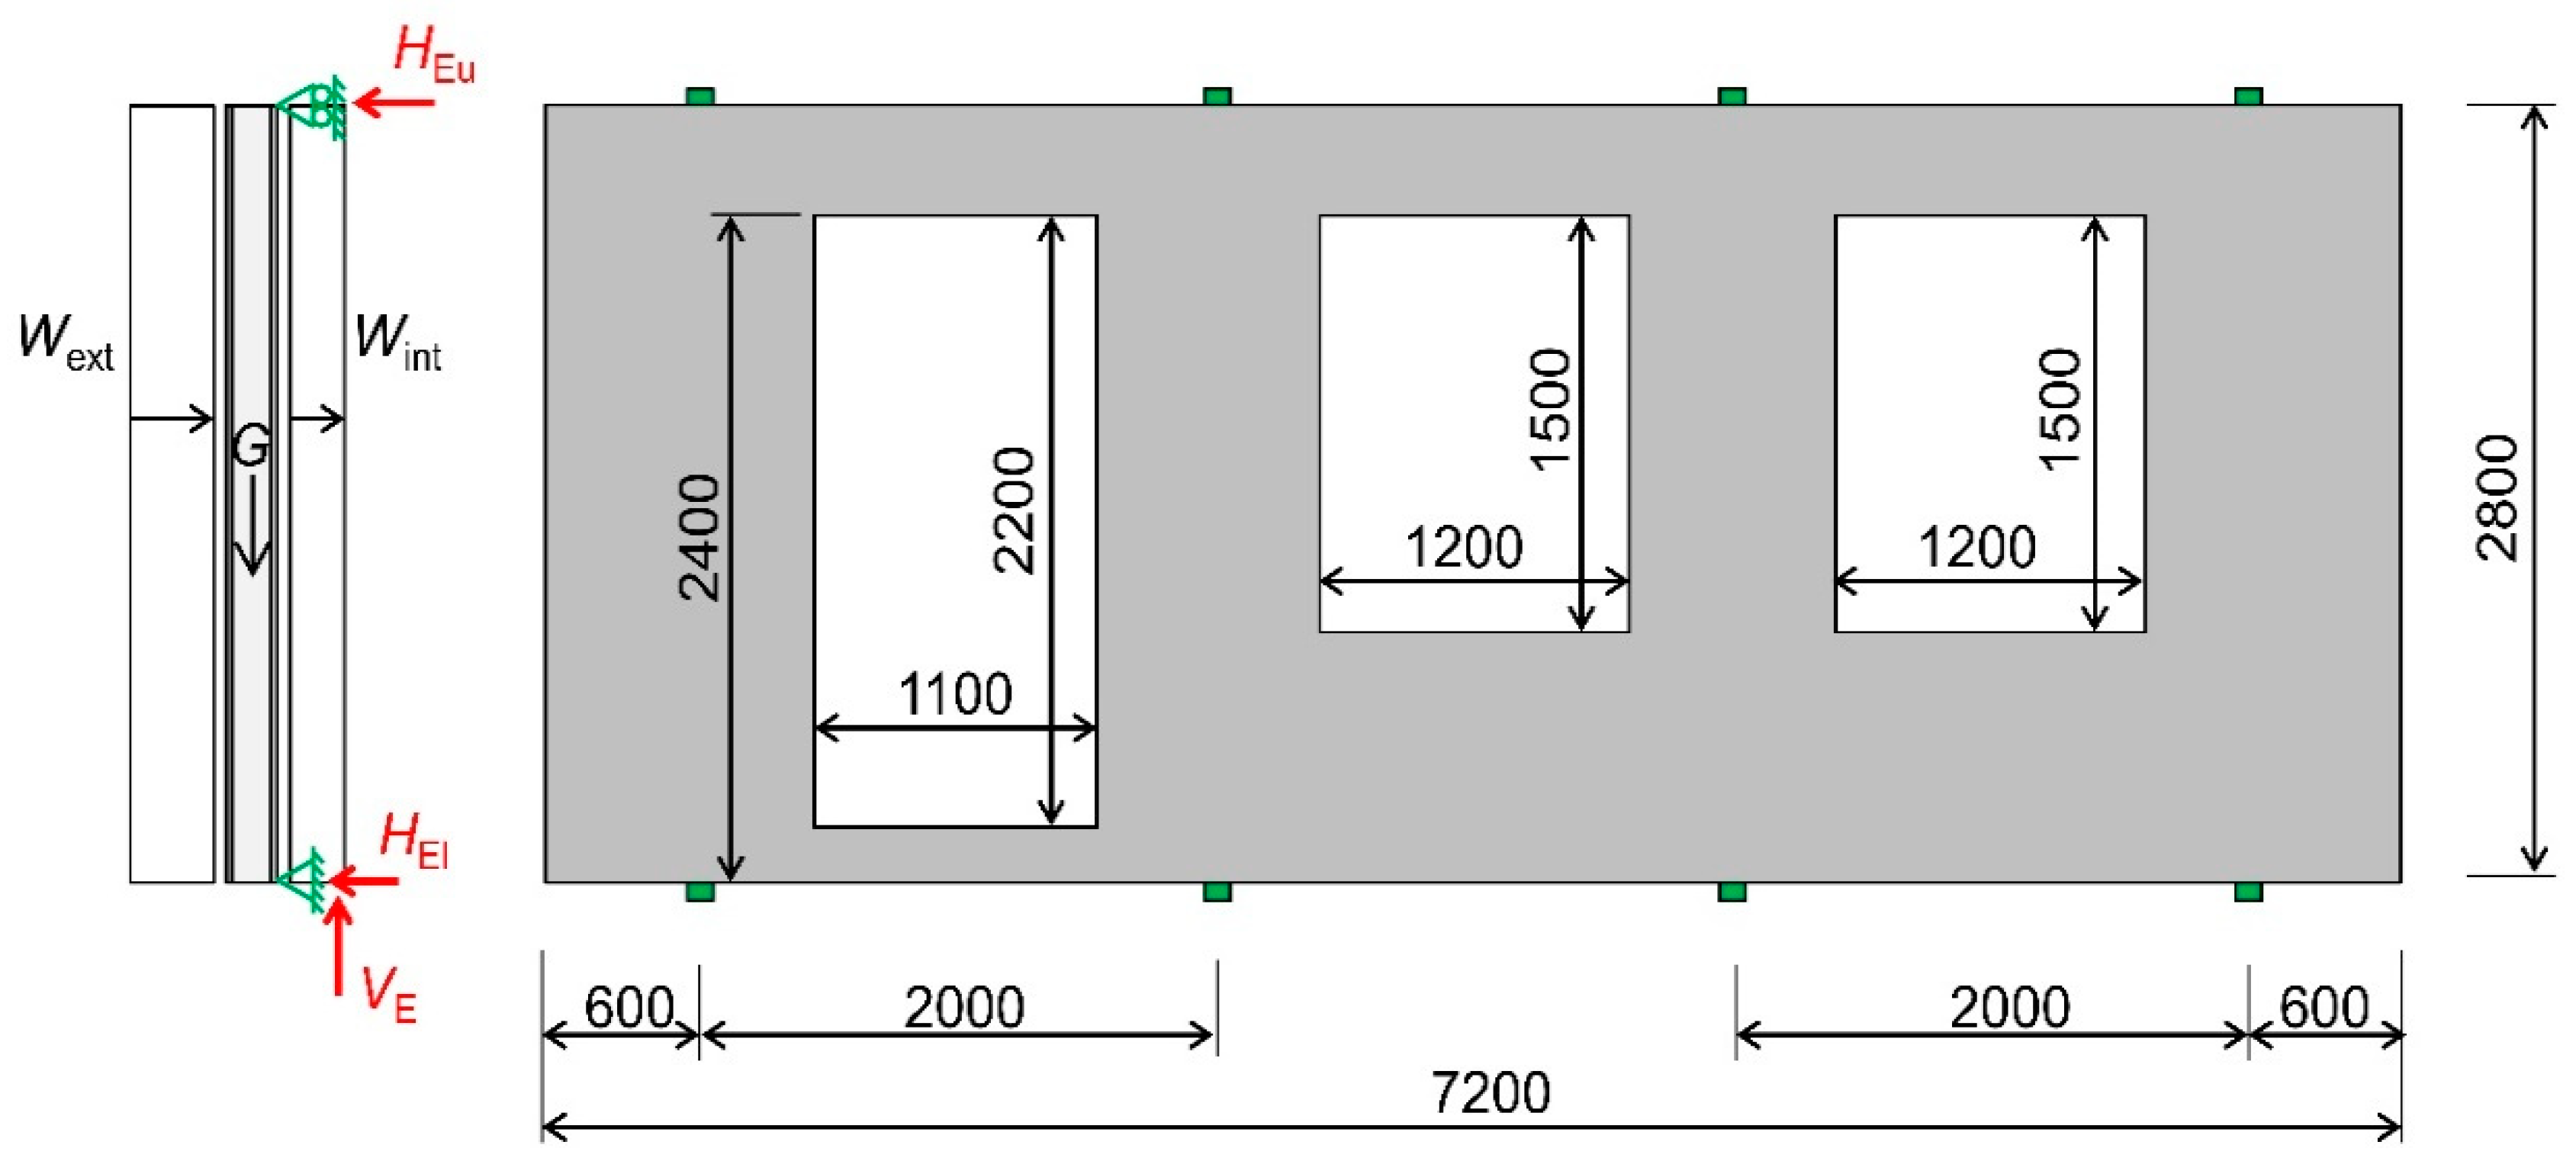
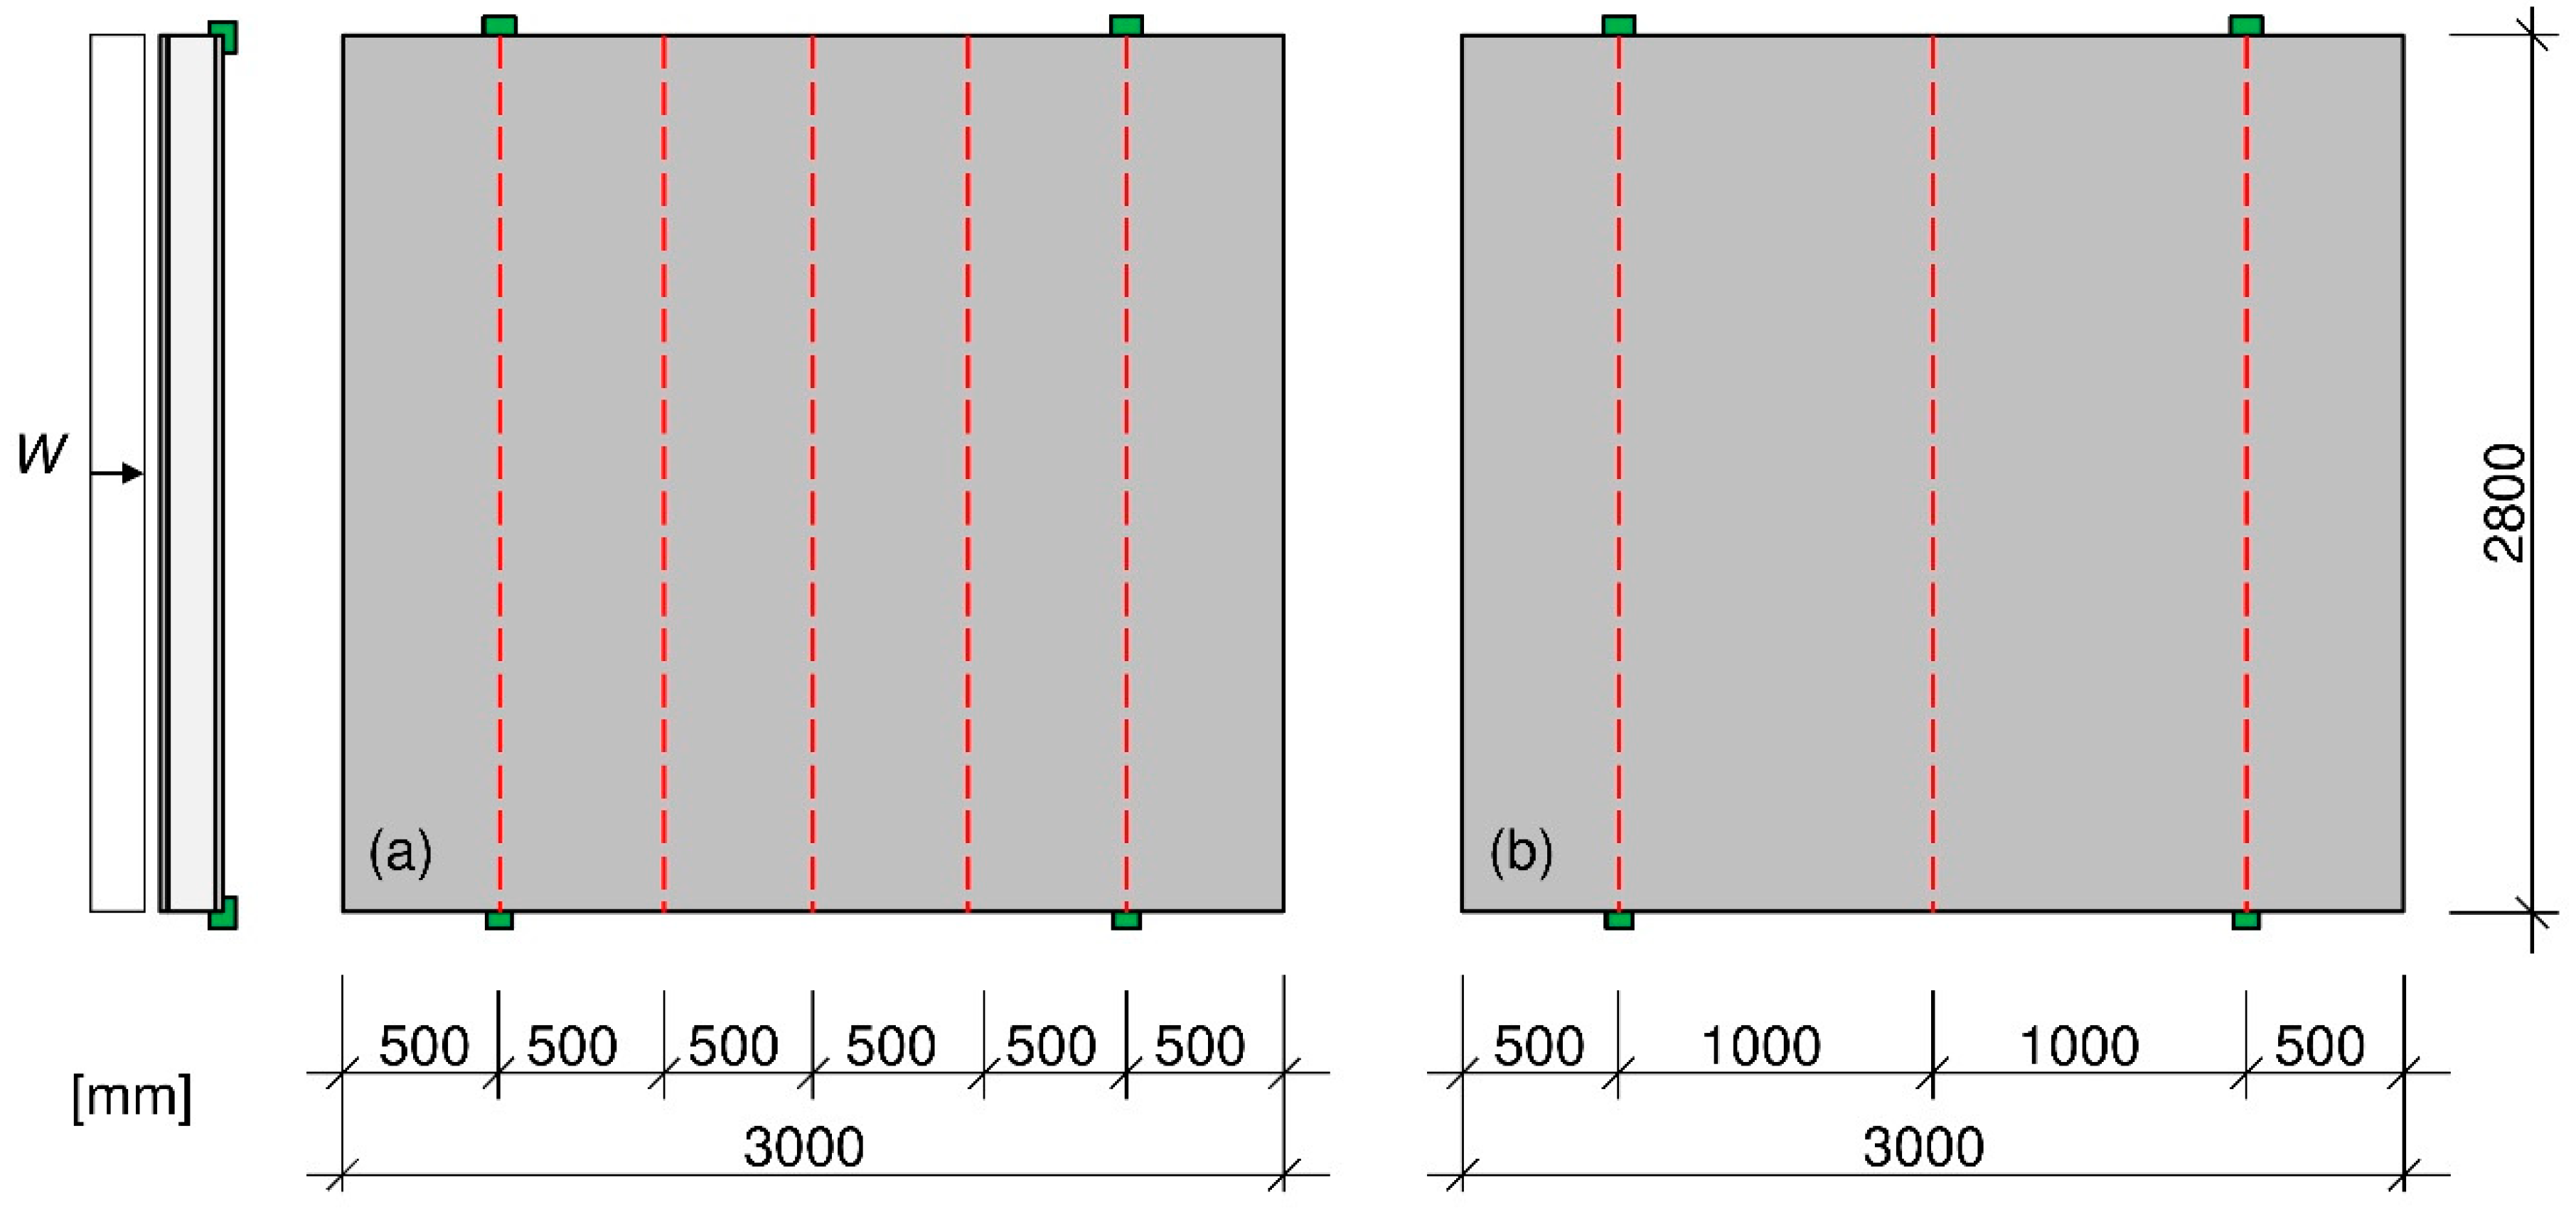
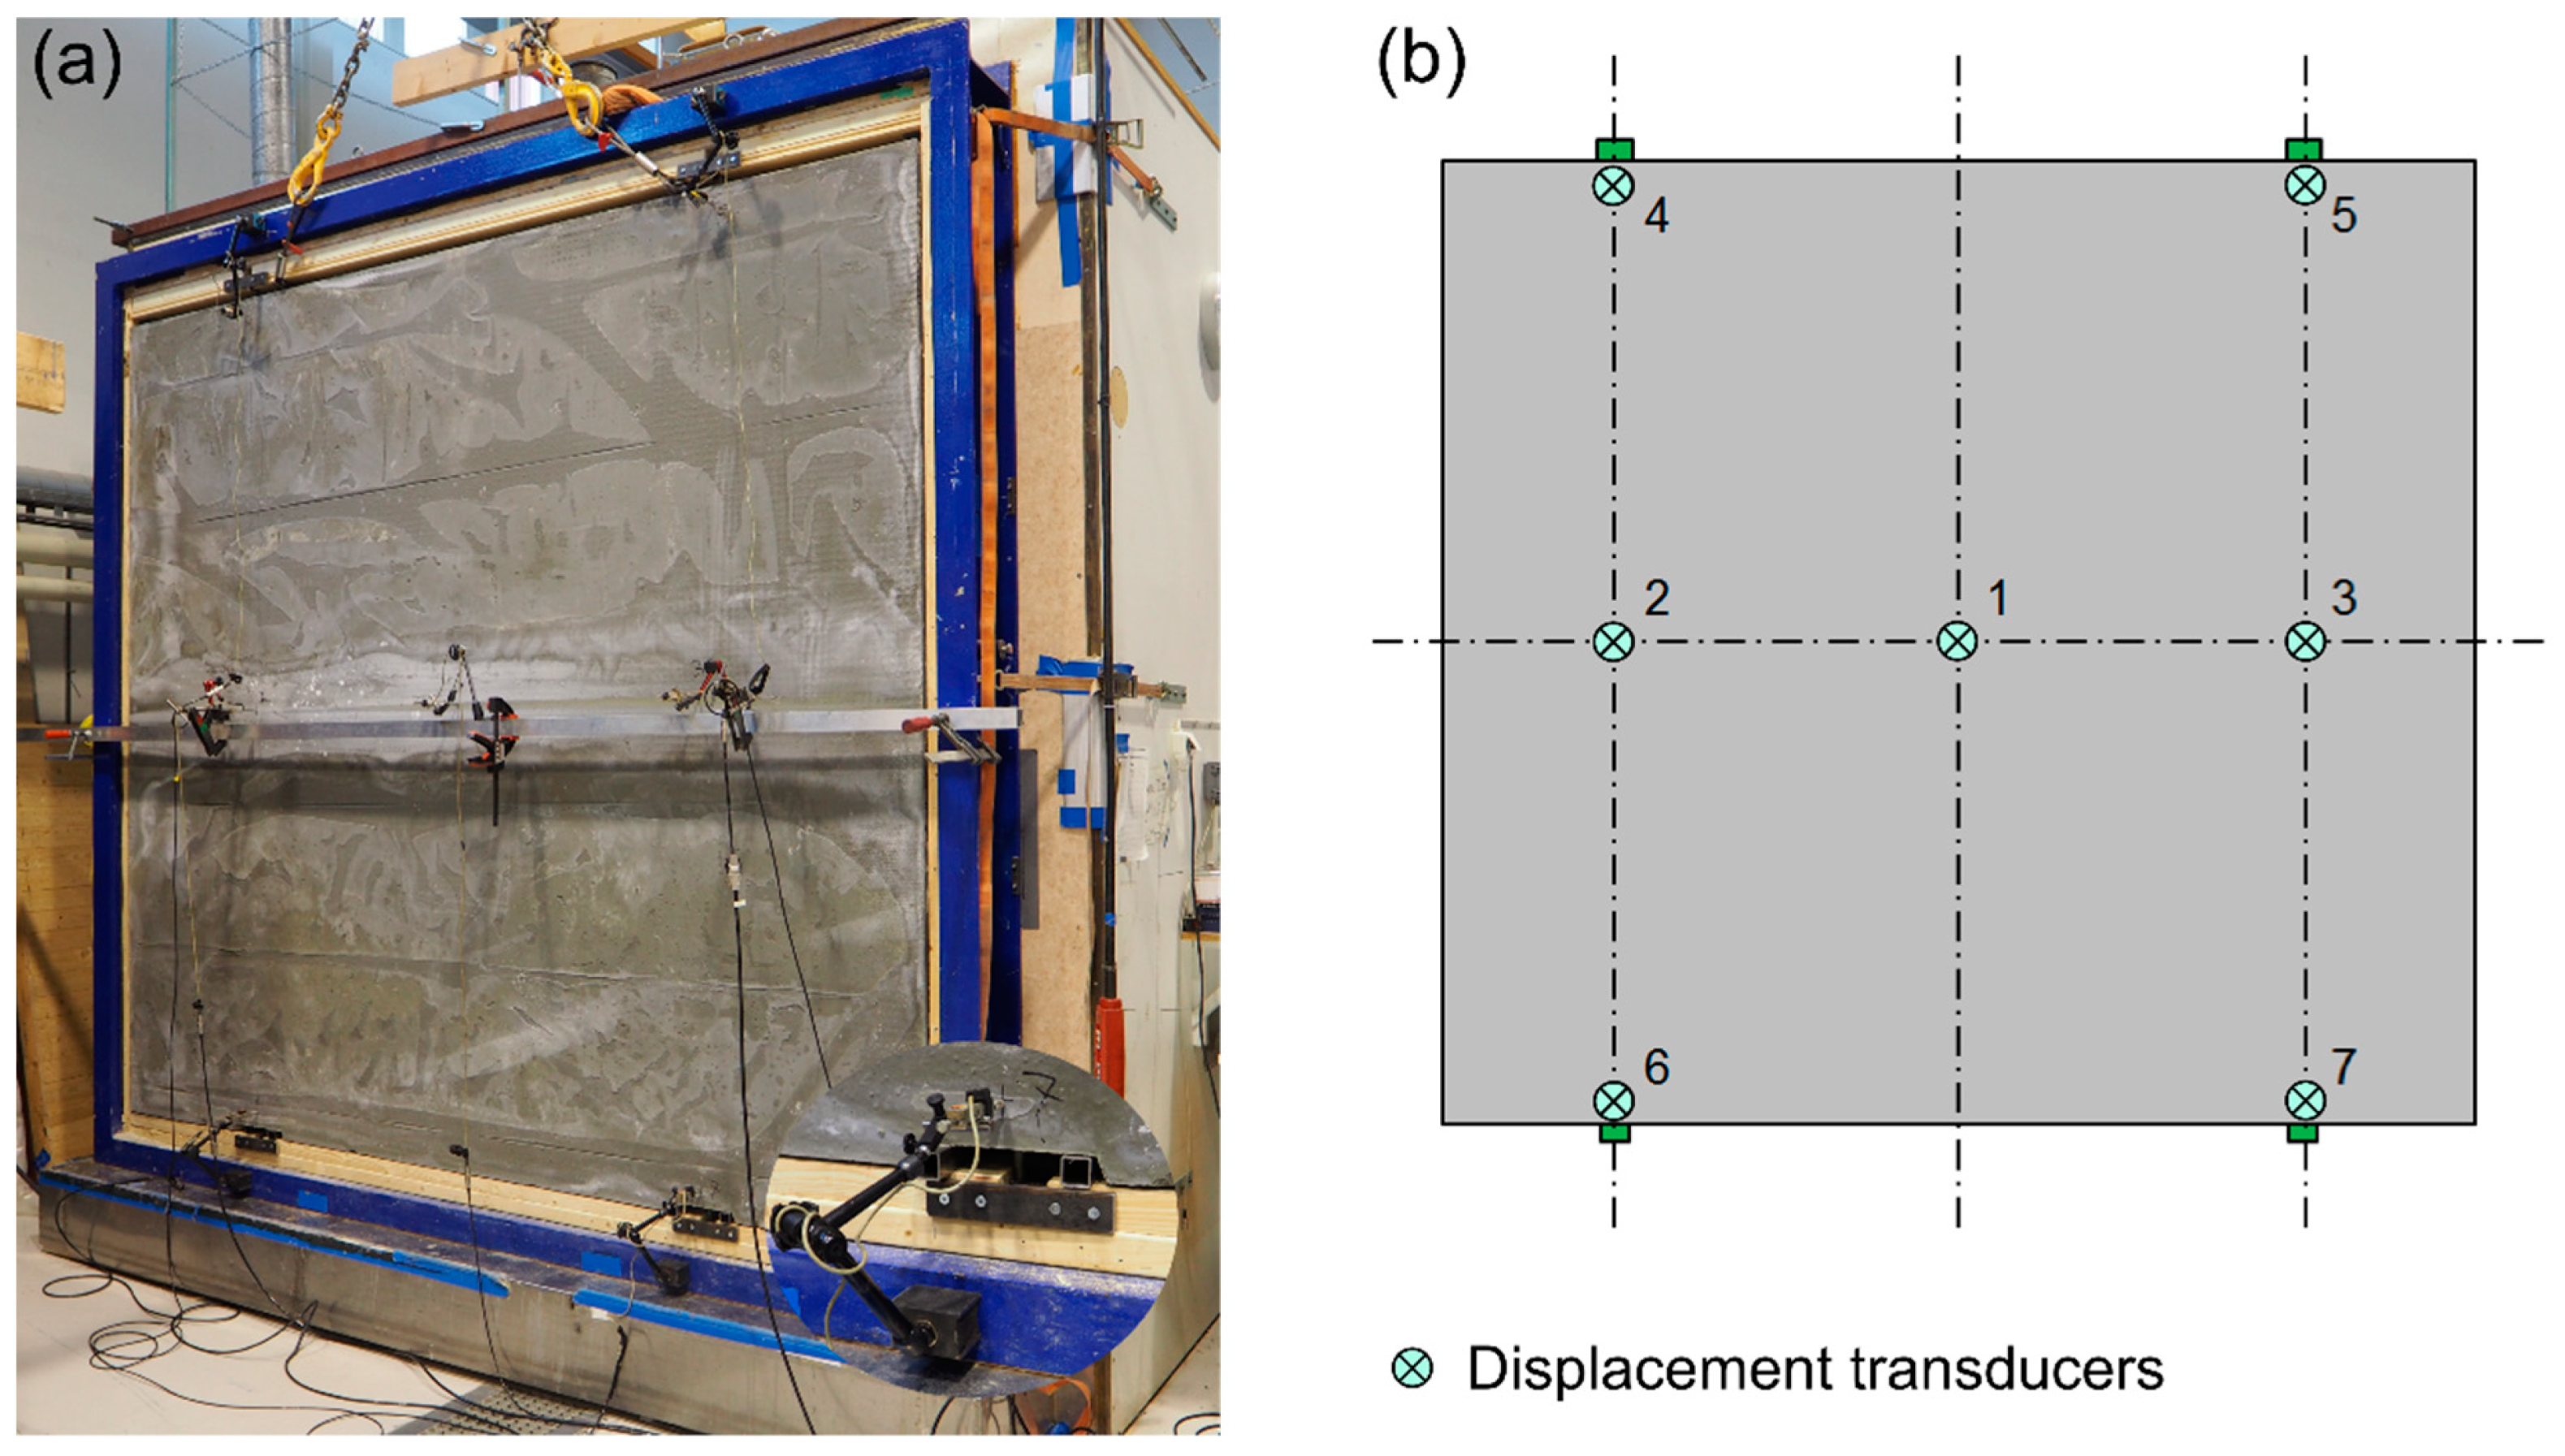
4.1.2. Wind Load Testing

Wind load tests were conducted to verify the overall structural performance and validate the numerical model of the full sandwich element, all while considering the embedded connectors and anchorage details. The wind load was applied incrementally in pressure and suction on full-scale sandwich elements using a pressure chamber. The test specimens were produced to have surface dimensions of 3.0 × 2.8 m2. The facings were made up of TRRPC with a nominal thickness of 25 mm and the core consisted of a 150 mm FC insulation layer. Both facings contained two layers of carbon textile grid.
Two element configurations underwent wind pressure tests, denoted as Single (S) and Double (D). In Figure 7, the first element comprised five rows of single connectors with a c/c distance of 0.5 m (dashed lines), while the second element had three rows of double connectors with a c/c distance of 1.0 m (dashed lines). The anchor details were designed similarly to that described for the anchor specimens above. However, in these specimens, the upper thickened sections were reinforced with one extra strip of carbon grid instead of a GFRP bar to simplify the production process of the elements.
Testing was performed in a pressure chamber (capacity of ± 3 kPa) configured as a four-sided room with an opening on one side. The sandwich element was mounted in a steel frame, affixed at the prescribed four anchorage points, then placed in the chamber opening, as depicted in Figure 8a. This established connection allowed for the element to move freely during loading. To prevent air leakage and pressure drop during testing, the gap surrounding the frame was sealed with elastic sealing tape.
The simulated wind load was applied to the TRRPC facing at the inside of the climate chamber as incremental sequences (0.5, −0.5, 1.0, −1.0, 1.5, −1.5, 2.0, −2.0 kPa) consisting of positive wind suction followed by negative wind pressure and so forth. Load increments were manually set to the given load level and then held constant for approximately 60 s before applying the following load level. The load was applied incrementally on each element as the capacities were initially unknown and it was of interest to apply both suction and pressure on the elements.
The out of plane deformation of the inner TRRPC facing (facing out of the chamber) was measured in relation to the steel frame of the chamber at seven points using displacement transducers with a measuring range of ± 25 mm. The locations of the seven measurement points are indicated in Figure 8b. Transducer positions 1, 2 and 3 measured displacements at mid-span, while positions 4, 5, 6 and 7 measured displacements near the top and bottom anchoring positions. During testing, the chamber pressure and displacements were measured at a sampling rate of 20 Hz.

4.2. Numerical Modelling

A conservative numerical modelling approach was chosen in this work to capture the element’s overall structural behavior. The individual components, i.e., facings, insulation and connectors, were modelled as individual parts made up of structural elements, all while incorporating the interaction between the different parts. This type of detailed global structural model is limited in the sense that it is unable to capture local stress conditions fully accurately, e.g., locally at connectors and anchorage details. As such, mainly bending failures are reflected in the analysis, whereas pull-out failure and buckling of connectors or anchorage failures are not captured. These failure modes are thus verified by local resistance models and/or verified by experimental values. Moreover, as a first step, the chosen modelling concept was validated using the wind load test results, followed by a detailed analysis of a full-scale element. The presented models incorporate the same modelling parameters, but differing geometry, loading and boundary conditions.

4.2.1. General Parameters

To gain a deeper understanding of the performance of the developed façade elements, finite element (FE) calculations were conducted in Abaqus/CAE 6.14-1 (Dassault Systèmes, Vélizy-Villacoublay, France) [30]. The model consists of discrete parts describing TRRPC facings, FC insulation and GFRP connectors. The thicker section along the lower edge of the inner TRRPC facing and the local strengthening at the position of the two upper anchors were excluded in the model.
Based on the structural behavior observed in associated studies combining experimental and numerical results on a component level, as reported elsewhere [22,24], the shear transfer through the FC layer is assumed to be negligible. However, the FC takes on an important function of ensuring the transfer of normal compressive stress between facings, which stabilizes and maintains the spacing between the two facings. Accordingly, specific interaction conditions between the various layers were prescribed to replicate this observed behavior; see Figure 9. Tie constraints were defined at the interface between the inner facing and FC, which assumes full interaction between these layers. In contrast, a frictionless contact condition was defined at the interface of the outer facing and FC.
The FC core was modelled using linear continuum shell elements with 8-nodes. FC was modelled based on linear elastic material laws. A density of 300 kg/m3 was defined along with an experimentally yielded value for the modulus of elasticity (10 MPa) and assumed Poisson’s ratio (0.1).
The TRRPC facings were modelled using the same type of shell elements as that applied for FC. The mechanical behavior of RPC was incorporated by means of the Concrete damaged plasticity model available in Abaqus with default field variables (dilation angle, eccentricity, etc.), refer to [30]. This continuum damage model for concrete is based on plasticity and adopts two failure mechanisms: tensile cracking and compressive crushing of concrete. A linear elastic model was applied to describe the compressive behavior, since the compressive stresses in the facings were presumed to be minimal. As for uniaxial tension, the stress-strain response is linear elastic until reaching failure. A tensile strength of 3 MPa was defined, which corresponds to the experimentally measured tensile strength of a textile reinforced RPC facing, see Section 3.1. Moreover, in tension, a linear softening behavior was defined for the phase after reaching the failure stress, assuming a fracture energy of 70 Nm/m2. Experimental data, presented in Table 1, was applied such that the modulus of elasticity in tension and compression corresponded to 50 GPa, and Poisson’s ratio to 0.22.
The carbon textile reinforcement grid was incorporated into the model as embedded reinforcement layers in the shell elements corresponding to the facings It is such that perfect bond between the reinforcement and the concrete is assumed. This interaction choice limits the crack formation from occurring within cracked regions according to the element size, as such individual localized cracking cannot be captured. The shell elements were however sized in accordance to observed crack distances of 40–50 mm, refer to [22]. The behavior of the reinforcement up to failure was modelled using linear elastic material models. Experimental values (refer to Section 3.1) were used for the nominal tensile strength (3433 MPa) and the modulus of elasticity (233 GPa). As a simplification, identical properties were assumed in the longitudinal and transversal directions of the textile grid. The cross-sectional area of each carbon grid layer was defined to be 85 mm2/m.
Linear beam elements were used to model the GFRP connectors [30]. The connectors (nominal diameter of 6.1 mm), were attached to the center of the facings using tie constraints. On the conservative side, no interaction was defined at the connector-FC interface such that the connectors were free to deform, and a so-called initial connector imperfection was defined as 0.5 mm. Moreover, the GFRP bars were modelled according to linear elastic material behavior. The experimentally yielded material properties, i.e., modulus of elasticity (40.3 GPa) and nominal tensile strength (1012 MPa), applied in the model are listed in Table 2. Since Poisson’s ratio was not tested, it was assumed to be 0.3 for the purpose of the analysis.
The Newton-Raphson iteration method was applied to find equilibrium within each load increment. Additionally, the feature named geometric nonlinear behavior was included in the analysis, i.e., second order theory related to large deformations. Accordingly, geometrical changes of, for instance the GFRP connectors, are included as a stiffening effect during the analysis (updating of stiffness matrix). Given this formulation, the GFRP bars can undergo large deformations in the model but the actual failure mode of the GFRP connectors is checked as a post-processing step with the experimentally yielded critical buckling load and pull-out capacity.

4.2.2. Wind Load Test Model

FE calculations were performed to simulate the wind load tests of the two sandwich elements, as aforementioned in Section 4.1.2. A schematic of the 3D models developed for the two test configurations are illustrated in Figure 10. The specimen was firstly subjected to the self-weight corresponding to the various components, followed by the wind load, applied as a distributed pressure on the outer surface of the facings. Subsequent steps alternated between positive wind suction and negative wind pressure according to the scheme used in the tests.
The lower anchor points were restrained in y- and z-directions, while the upper anchor points were only restrained in the z-direction; see Figure 10. However, the anchoring points were assumed free to move in the horizontal direction parallel to the element (x-direction).

4.2.3. Full-Size Sandwich Element Model

A concept building consisting of residential apartments was defined to calculate the loading schemes. The building is assumed to be situated on the west coast of Sweden. The building is prescribed dimensions of 20 × 72 × 12.4 m (height × length × width). This scenario is limited to a typical element design, as illustrated in Figure 1, which consists of the materials and layer thicknesses, previously presented in Section 3. However, in this model, the TRRPC facings were limited to one layer of carbon grid reinforcement placed in the center of the facing, as this was found to be a sufficient amount of reinforcement for the applied design wind loads. Moreover, the study of the full-size sandwich element was limited to consider only the double connector configuration developed in this project.
The boundary conditions were the same as for the wind load test model described in Section 4.2.2, i.e., vertical (V) and horizontal (Hl) forces are transferred to the load bearing structure via the lower anchor points, while the horizontal (Hu) force is transferred by the upper anchor points.
The structural performance of the façade element was verified according to the limit state principle of EN 1990 [31]. Typically, two types of loads are included in normal design situations: vertical permanent loads from the facing’s self-weight (G) and variable horizontal loads from wind (W); see Figure 1. The wind produces wind actions on the external (Wext) and internal (Wint) surfaces according to EN 1991-1-4 [32]. Three load cases (LC) are thus investigated for the ultimate limit state (ULS) and the serviceability limit state (SLS). In LC1, the facing’s external surface is under pressure, while the internal surface is under suction. In LC2, the external facing of the sandwich element is loaded in suction, while the internal layer is loaded in pressure. As for LC3, the external and internal facings are exposed to wind suction. The considered load combinations are stated in Equation (1) for SLS and in Equation (2) for ULS:
1.0G + 1.0 (Wext + Wint)
1.35G + 1.5 (Wext + Wint)
These load cases correspond to different wind directions to which the building could be exposed. The wind loads, given in Table 3, are calculated based on a concept building situated in Gothenburg (basic wind velocity vb = 25 m/s) in terrain category IV, which is defined as an area in which at least 15% of the terrain surface is covered by buildings with an average height greater than 15 m. Furthermore, the presented numbers correspond to the most exposed parts of the building (worst case). The external and internal wind load acting on the doors and windows are assumed to act on the edges of the openings at the outer facing.
In the developed model, the sandwich element was first loaded by the self-weight and the wind load actions up to the SLS. Thereafter, the additional self-weight and wind load actions corresponding to the ULS were applied. Finally, the wind load actions were increased further until failure of the element, if not reached at the ULS.
Verification at the ULS corresponds to the failure of the elements and related to human safety. For the sandwich element, this mainly concerns checking for connector failure, connector pull-out failure, textile grid failure and anchor failure. Concerning anchor failure, it should be verified that the horizontal reaction force, i.e., shear load at the anchor, at the different anchor positions and load combinations, are smaller or equal to the corresponding design shear load capacity according to Equation (3). The performance of the anchors was experimentally investigated according to that given in Section 4.1.1 and the design shear load capacities of the upper (HRup,d, HRun,d) and lower (HRlp,d, HRln,d) anchors summarized in Table 4 in Section 5.1.
If   H Eu , d   >   0   then   H Eu , d     H Rup , d   otherwise   | H Eu , d |     H Run , d and If   H El , d   >   0   then   H El , d     H Rlp , d   otherwise   | H El , d |     H Rln , d
Verification at the SLS, representing a lower load level, usually relates to appearance, functioning and comfort of occupants, e.g., deflections and cracking. According to EN 1992-1-1 [33], the extent of cracking shall be limited in order to ensure the adequate functionality or durability of the structure, as well as to safeguard an aesthetically pleasing surface. The requirements of maximum crack width are normally only valid for steel reinforced concrete structures. When carbon textile reinforcement is used, corrosion is not a concerning issue because the grids are designed to be highly durable. By comparing between different codes given in fib bulletin 40 [34], the crack width limits are less restricted for FRP reinforced concrete. However, the knowledge is rather scarce, and it is stated that in absence of information the limitations for steel reinforced concrete could be adopted also for FRP reinforced concrete. For the lowest exposure classes given in [33], the crack width has no influence on durability and the given crack width limit of 0.4 mm is just set to guarantee acceptable appearance. However, crack widths can also be controlled to satisfy specific aesthetic requirements. As stated in ACI 533R-11 [35], the aesthetic effect of a crack in a facing is correlated to the surface’s texture. For smooth surfaces, e.g., cast-in-place concrete, and coarse textured surfaces, e.g., exposed aggregate concrete, crack widths limited by structural demands are considered aesthetic. Concerning high quality smooth surfaces, it is recommended that cracking be limited to 0.13 mm for interior facings.
According to [33], the function or appearance of a member or structure should not be negatively impacted by deformation. In general, the limit of the design deflection is specified to either L/250 or L/500, where L is the effective span of the element. In [35], deflection limits are given specifically for non-load bearing precast wall elements, saying, deflection of any point on the facing measured from its original position should not exceed L/480. For the element in this study, the more restrictive limit according to [33] corresponds to a maximum deflection of 2800/500 = 5.6 mm.

5. Experimental Results of Element Tests

5.1. Anchor Shear Load Capacities

The anchor performance is studied based on the maximum shear load capacity yielded at failure. For the four different load cases mentioned in Section 4.1.1, the average shear load capacity is provided in Table 4, along with characteristic and design values. The design values of the shear load capacity HR,d were evaluated according to Equation (4) as per EN 1990 [31]:
H R , d = H R , k γ M = H R , m γ M ( 1 k n V x )
where HR,k and HR,m are the characteristic and average values of the shear load capacity, respectively, and γM is the partial factor for material properties. The partial factor for the RPC is assumed to be equal to that of concrete. Tensile failure in RPC was the governing failure mode observed during the anchor shear load tests, as shown in Figure 11. According to SIS-CEN 1992-4-1 [36], the partial factor for concrete related to tensile failure modes under shear loading of headed anchors can be set to γM = 1.5. Moreover, given that tensile failure is governing, the coefficient of variation Vx can be assumed to be known in the selection of the characteristic fractile factor kn, based on the knowledge of the coefficient of variation related to RPC’s tensile strength. The specified design values are only valid for this specific anchor design, and should be treated as indicative only.

5.2. Wind Load Test Results

The element performance is analyzed according to the resulting mid-span deflection of the element in correlation with the applied wind load on the outer facing (i.e., facing interior of chamber). Wind suction and pressure at the facings are represented by positive and negative values, respectively. In Figure 12, the global behavior of the two tested elements, namely single (S) and double (D) connector configurations, is shown as the wind load versus mid-span deflection (at locations 1–3 in Figure 8). The deflections, d1–d3, were adjusted by deducting the average displacement at the position of the anchors, i.e., global displacements of the element with respect to the test rig. It should be noted that during the last wind load cycle, it was only possible to reach a pressure of approximately −1.9 kPa due to small air leakage from the test chamber. It can be observed that both tested elements performed similarly under cyclic loading. Only minor differences in element deflections at the position of the three displacement transducers were noted, which confirms that the elements mainly bend about the x-axis, as per Figure 10. Both elements exhibit a somewhat larger mid-span deflection during wind suction compared to wind pressure, with a maximum deflection of approximately 4 mm at maximum wind suction (2 kPa) which is less than L/500.
Given that the total wind load is distributed evenly between the four anchors, it can be assumed that there is a linear relation between the horizontal reaction force at each of the anchors and the applied wind load. Accordingly, this amounts to a maximum shear load at the anchors during testing of approximately 4 kN at maximum wind suction and wind pressure. This shear load is well below the average measured capacities of the anchors reported in Section 5.1. Furthermore, after testing, some of the smaller pre-existing shrinkage cracks in the facings had propagated slightly, but only a few new minor cracks were detected. No cracks or damages were noted in the regions around the anchorages.

6. Numerical Results

FE calculations of the two wind load test configurations were performed to validate the model of the sandwich element configurations, refer to Section 4.2.2. The validated models were then used to analyze full-size sandwich elements with and without openings, refer to Section 4.2.3. It is worth noting, that the model pertaining to the wind loading is intended to capture the overall structural behavior of the element. As mentioned in Section 2, it is of key importance to validate that the developed model of the sandwich element can effectively describe the most important phenomena and failure modes governing the overall behavior of the elements.

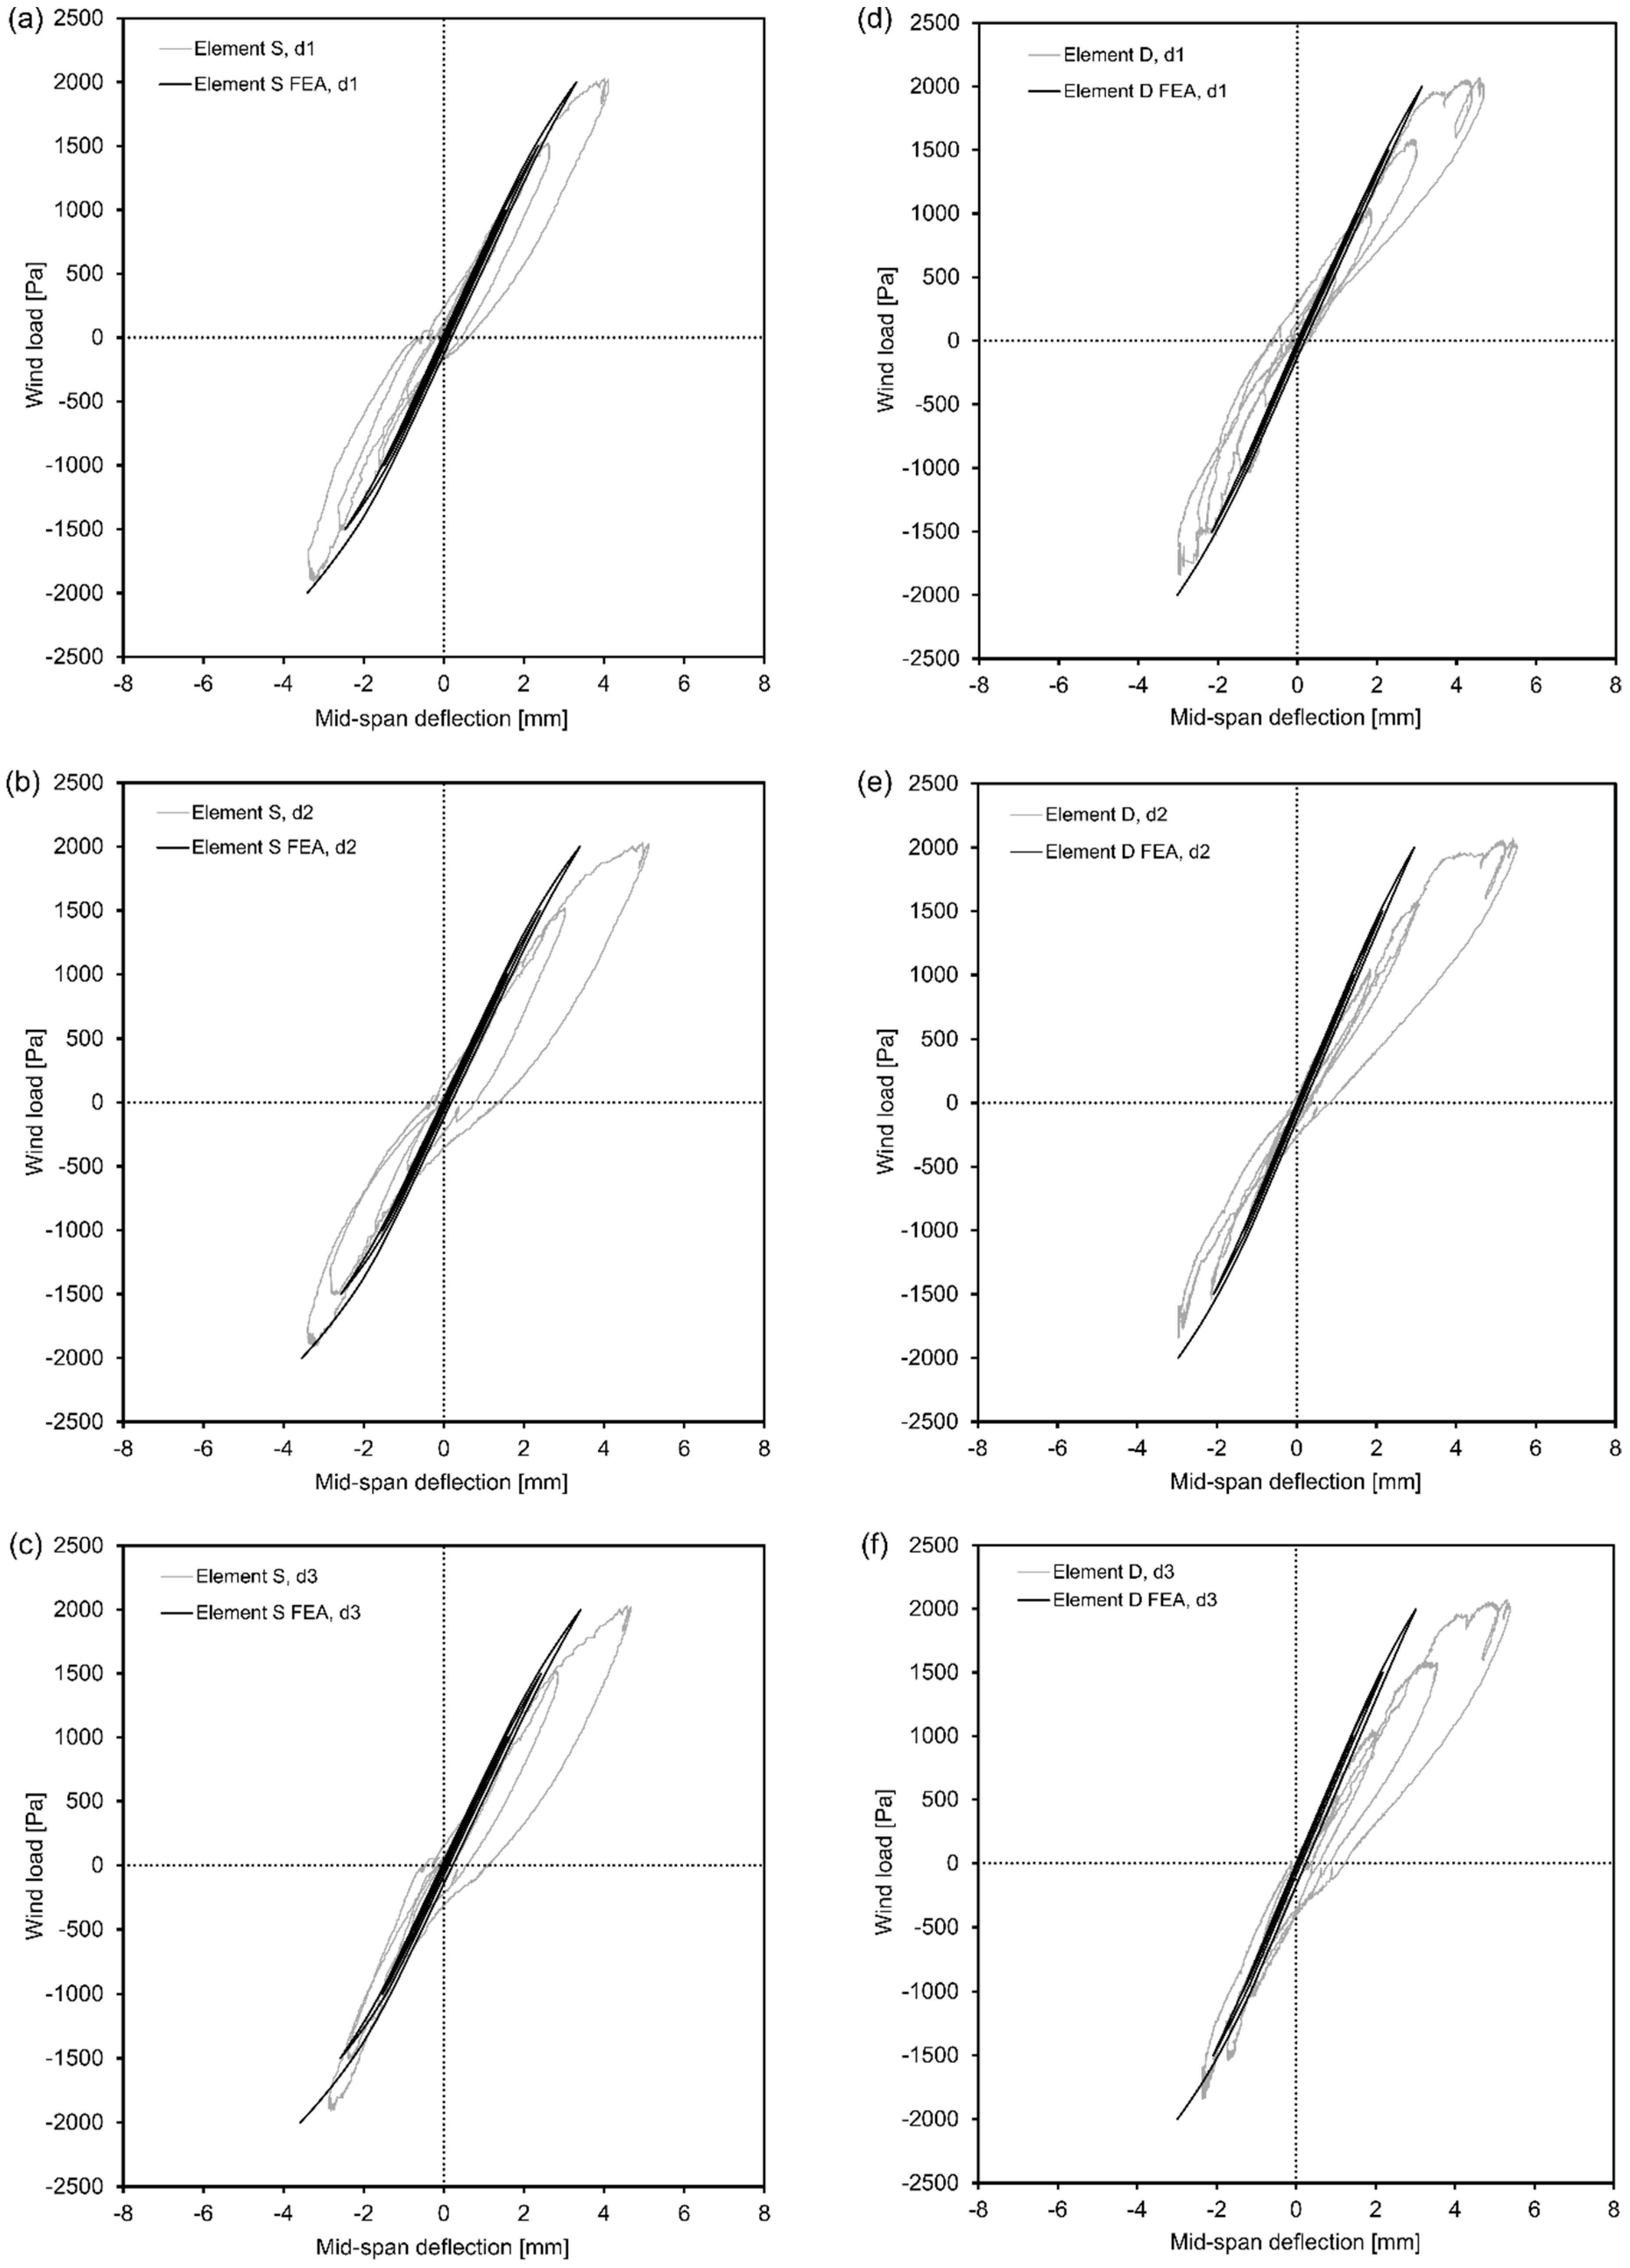
6.1. Validation of Wind Load Test Model

Comparisons of the global behavior of the two sandwich elements, represented as wind load versus mid-span deflection at locations d1–d3, are shown in Figure 13 for both single and double connector configurations. It should be noted that the deflection related to FEA was measured in the middle of the inner facing. Compared to the experimental results, the stiffness during the loading sequences is captured rather well. The hysteresis effects in the unloading sequences are not fully captured in the model. The incremental damage in the facings due to cracking was included. However, in the experiments, a major part of the hysteresis effects can most likely be attributed to unforeseen movements in the anchoring positions, which was excluded in the developed FE model. Another factor which could influence the numerical results, is the fact that linear elastic material models were assigned for all materials, except for the RPC facings. As such, these materials recover perfectly after unloading in the model, which is not the case in the experiments. It is also important to note that pre-cracks existed in the facings which could have also likely influenced the presented experimental behavior. Despite these discrepancies, the outcome of the analysis is deemed suitable since the aim of the model was primarily to simulate the behavior under static wind loading (load increments).
Figure 14 depicts contour plots at a wind pressure of 2.0 kPa of the out-of-plane displacement for both single and double connector cases. From these figures, it can be seen that the elements mainly bend about the x-axis, as per Figure 10, which confirms the experimentally observed behavior.
At a wind pressure of 2.0 kPa, corresponding to the maximum wind pressure of the climate chamber, the compressive forces in the most stressed diagonal connectors were checked for both single and double connector cases. For both cases, it was observed that the maximum compressive force was −1.8 kN at this wind pressure. This compressive force very close to the experimentally yielded critical buckling load (1.7 kN), see Table 2. At a wind suction of 2.0 kPa, the maximum tensile force in the most stressed diagonal was 3.0 kN and 2.8 kN for single and double connector configurations, respectively. These loads are well below the average value of the connector pull-out resistance of 6.5 kN, reported in Table 2.
Contour plots of the maximum principle plastic strain, shown in Figure 15, indicate cracked regions of the facings around the attachment of the connectors. The cracks were found to be larger at the connector attachments at the location of the upper and lower anchors. For the element with single connectors, as per Figure 15a, cracks also propagate from the attachment of the connectors towards the vertical edges of the facing. It should be noted that all cracks can be defined as small if the strain values are translated into crack widths. Moreover, the tensile stresses in the carbon grid were found to be minimal at 2.0 kPa (for both pressure and suction), which is below the prescribed nominal tensile strength of the reinforcement. For this reason, subsequent analyses only incorporated one layer of carbon grid in each RPC facing.

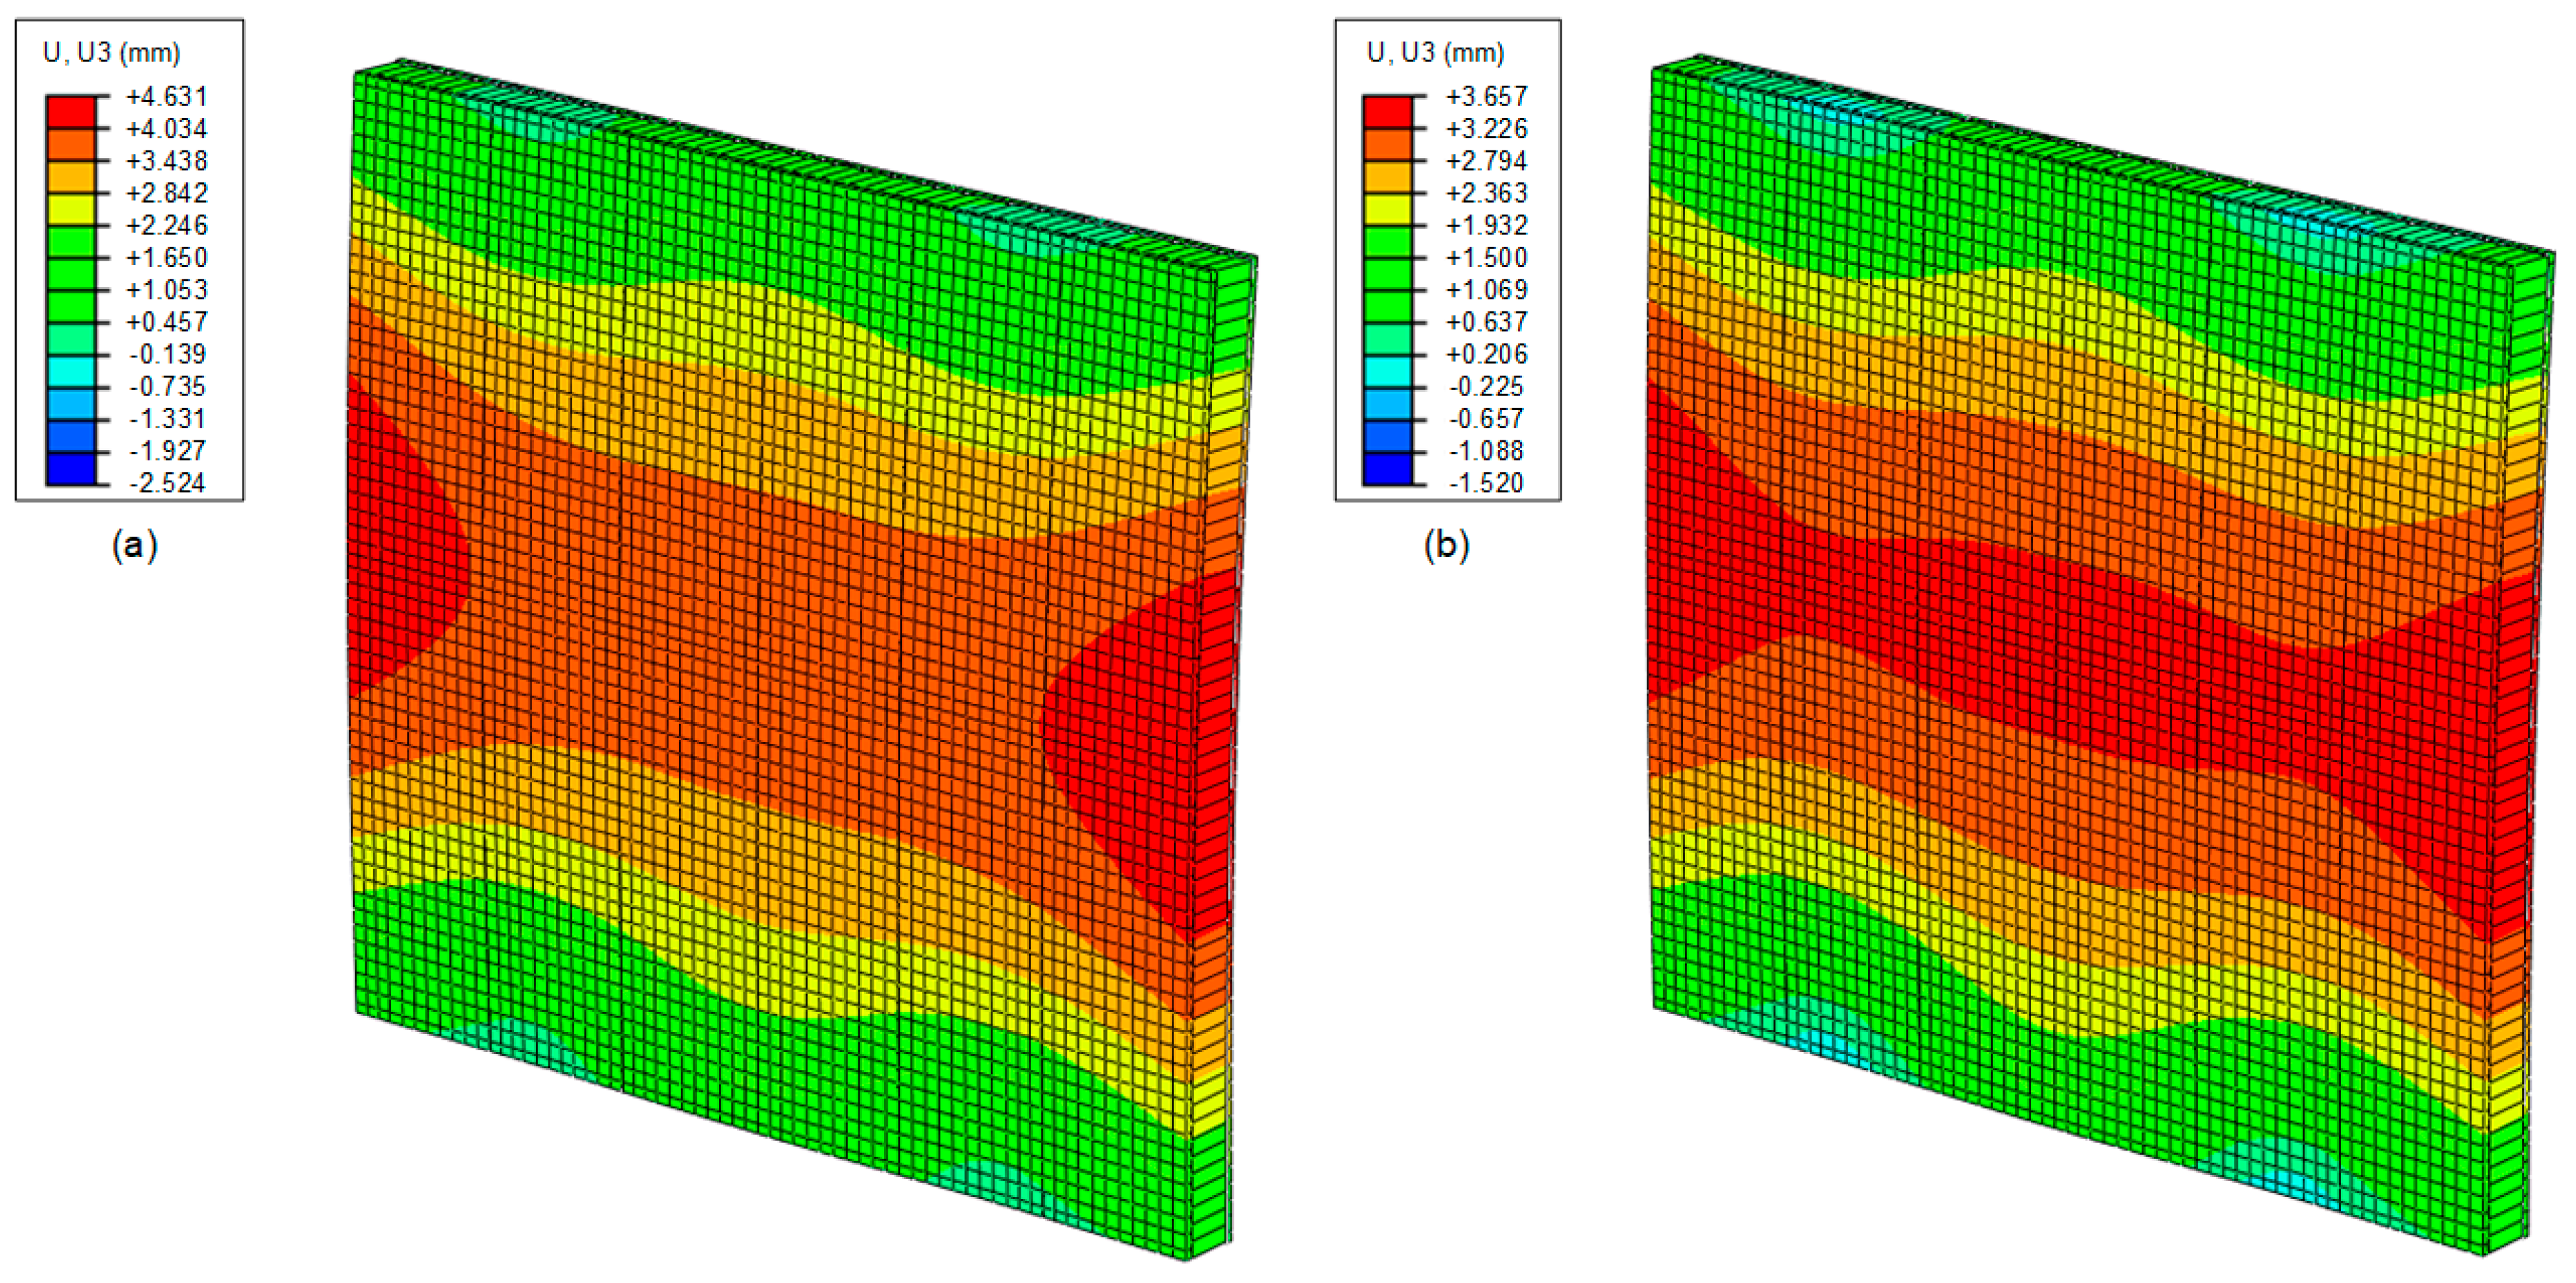
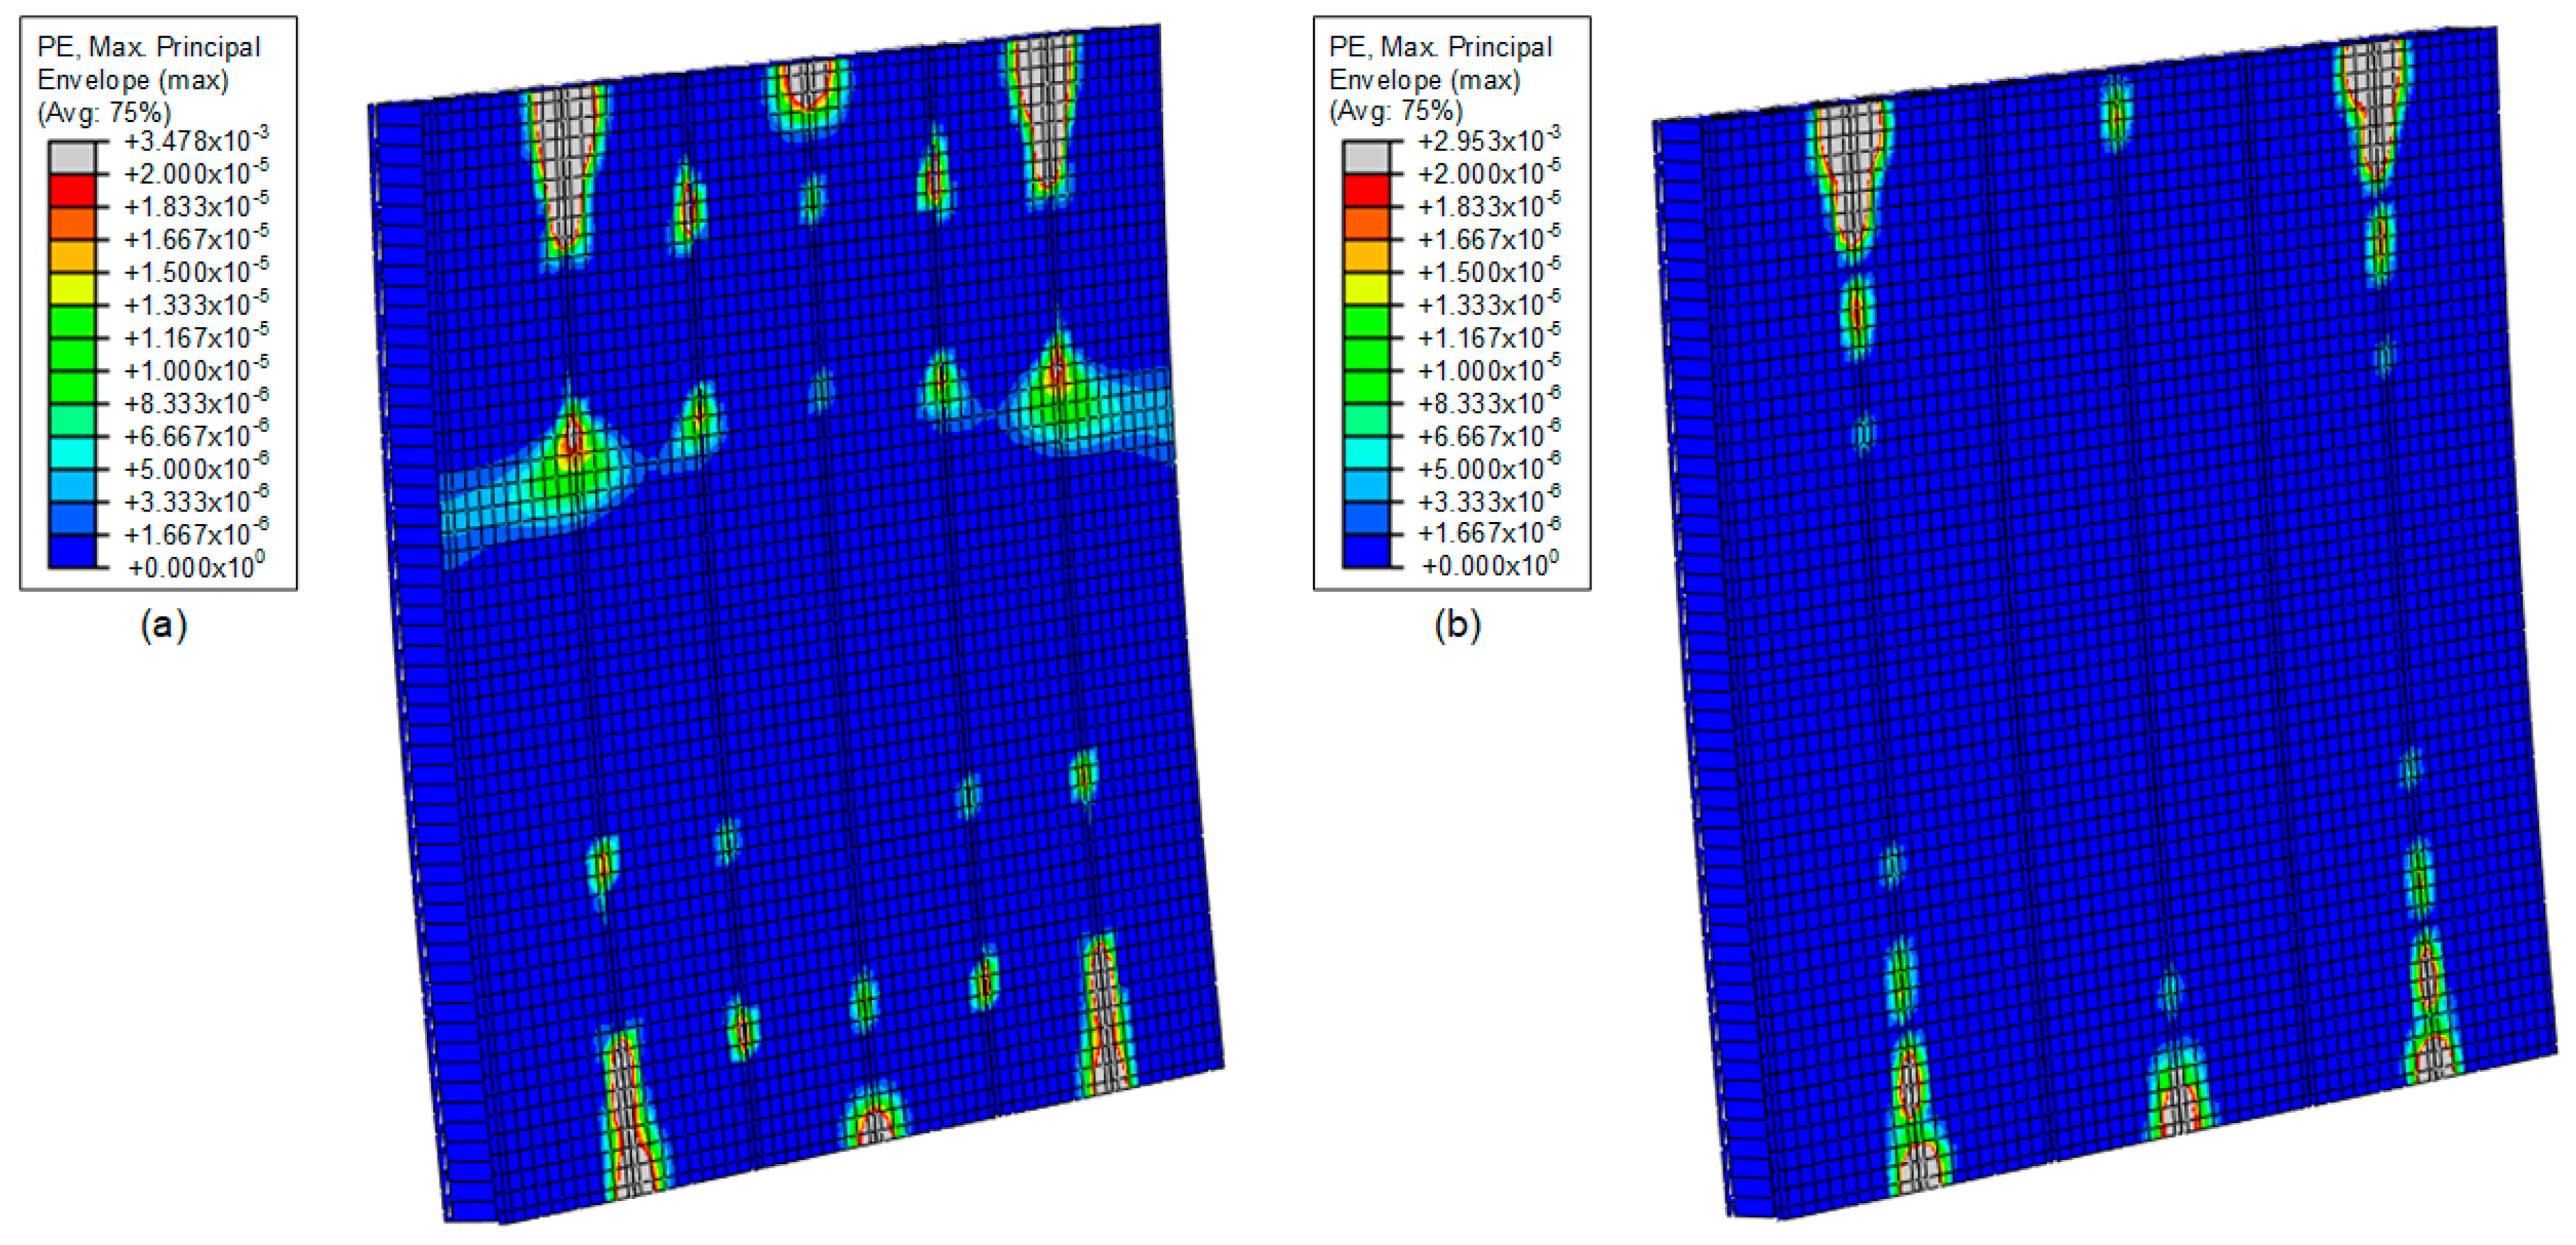
6.2. Performance of Full-Size Sandwich Element

Analyses were performed on full sandwich elements having three different spacings between the connectors. The outer connector lines were placed 100 mm from the vertical edges and one connector line was placed at the position of each anchor line in all cases. Otherwise, the connector spacing for the three spacing options was set to 0.5, 1.0 and 2.0 m. All options were analyzed for the three load cases previously defined in Table 3.
The FEA results are summarized for the three different connector spacing options in Table 5. At the SLS, the maximum displacement, umax, of the inner facing and the indication of cracking in the facings at WSLS are given. At the ULS, the maximum horizontal reaction force at the upper anchors, HEl,d, and lower anchors, HEu,d, together with the maximum pull-out force, FEpo,d, in the connectors are given at the design wind load WULS. Furthermore, the maximum wind load, Wmax, is given, defined as the wind load when the first limiting design criteria was reached. The ratio Wmax/WULS indicates how much wind load above ULS that the sandwich element can withstand before reaching failure, i.e., design criteria. The capacity of the anchors was the limiting factor in all cases, except in LC2 and LC3 for the configuration with the largest connector spacing (2.0 m), wherein the pull-out capacity of the connector was limiting.
LC2 was found to be the worst load case for all three spacing options at the SLS with respect to maximum displacement, and at the ULS with respect to maximum possible design wind load. Put simply, the maximum wind load resistance implies that the concept building may also be situated in terrain category III or have a total height of approximately 30 m in terrain category IV.
As can be noted, the deformations are rather small at the SLS, but the sandwich elements behave slightly different depending on the connector spacing. In the element with the smallest connector spacing (0.5 m), both facings work together and have nearly the same deformed shape; see Figure 16a,b. However, in the element with the largest spacing (2.0 m) between the connectors, the facings work more independently, thereby making the deformations more related to local bending of the individual facings; see Figure 16c,d. Consequently, the behavior of the element with 1.0 m connector spacing is somewhere in between these two options. The outer facing separates from the FC at some positions because of wind suction. This effect is greatest for the facing with the largest connector spacing. However, from the analyses it can be concluded that the maximum separation between the outer facing and the FC is less than 0.6 mm at the SLS. At the SLS, only smaller cracked regions appear around the connector attachments at the locations of anchors similar to that observed in the analyses of the wind load tests. Accordingly, these regions increase in size at the ULS. For the element with a connector spacing of 2.0 m, vertical cracks in the two outer spans appear above the ULS load in the outer facing due to local bending.

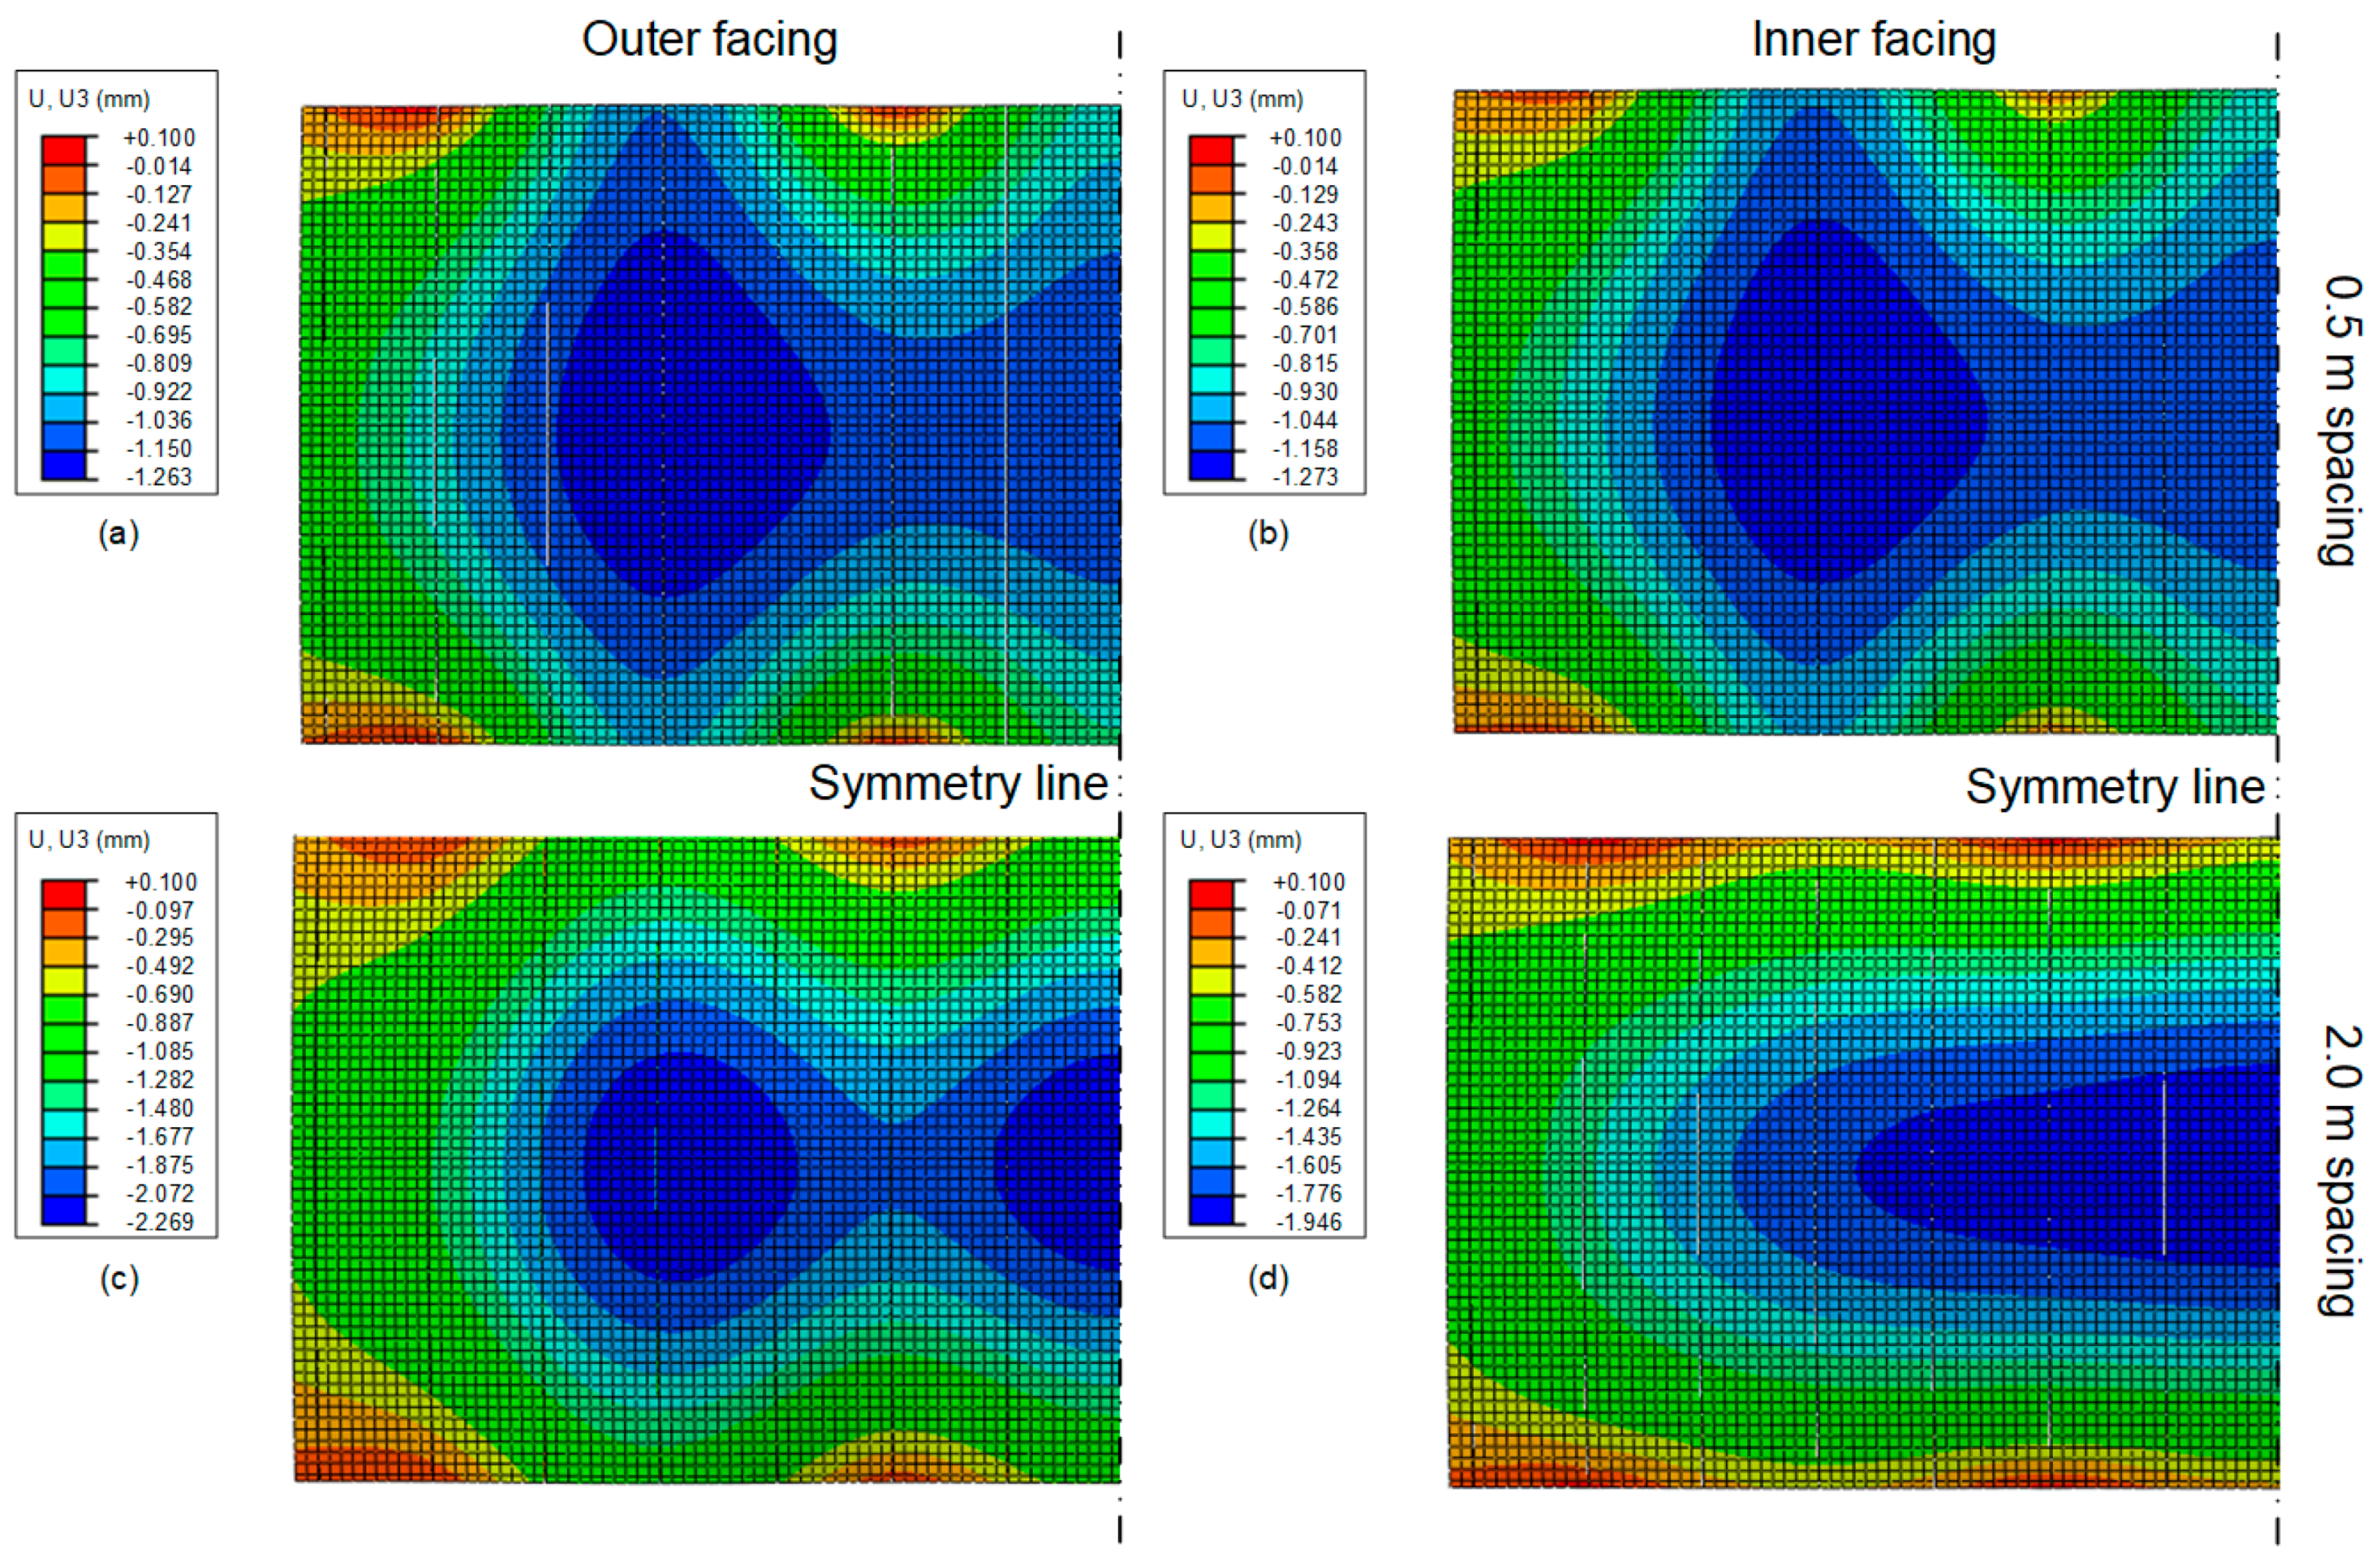
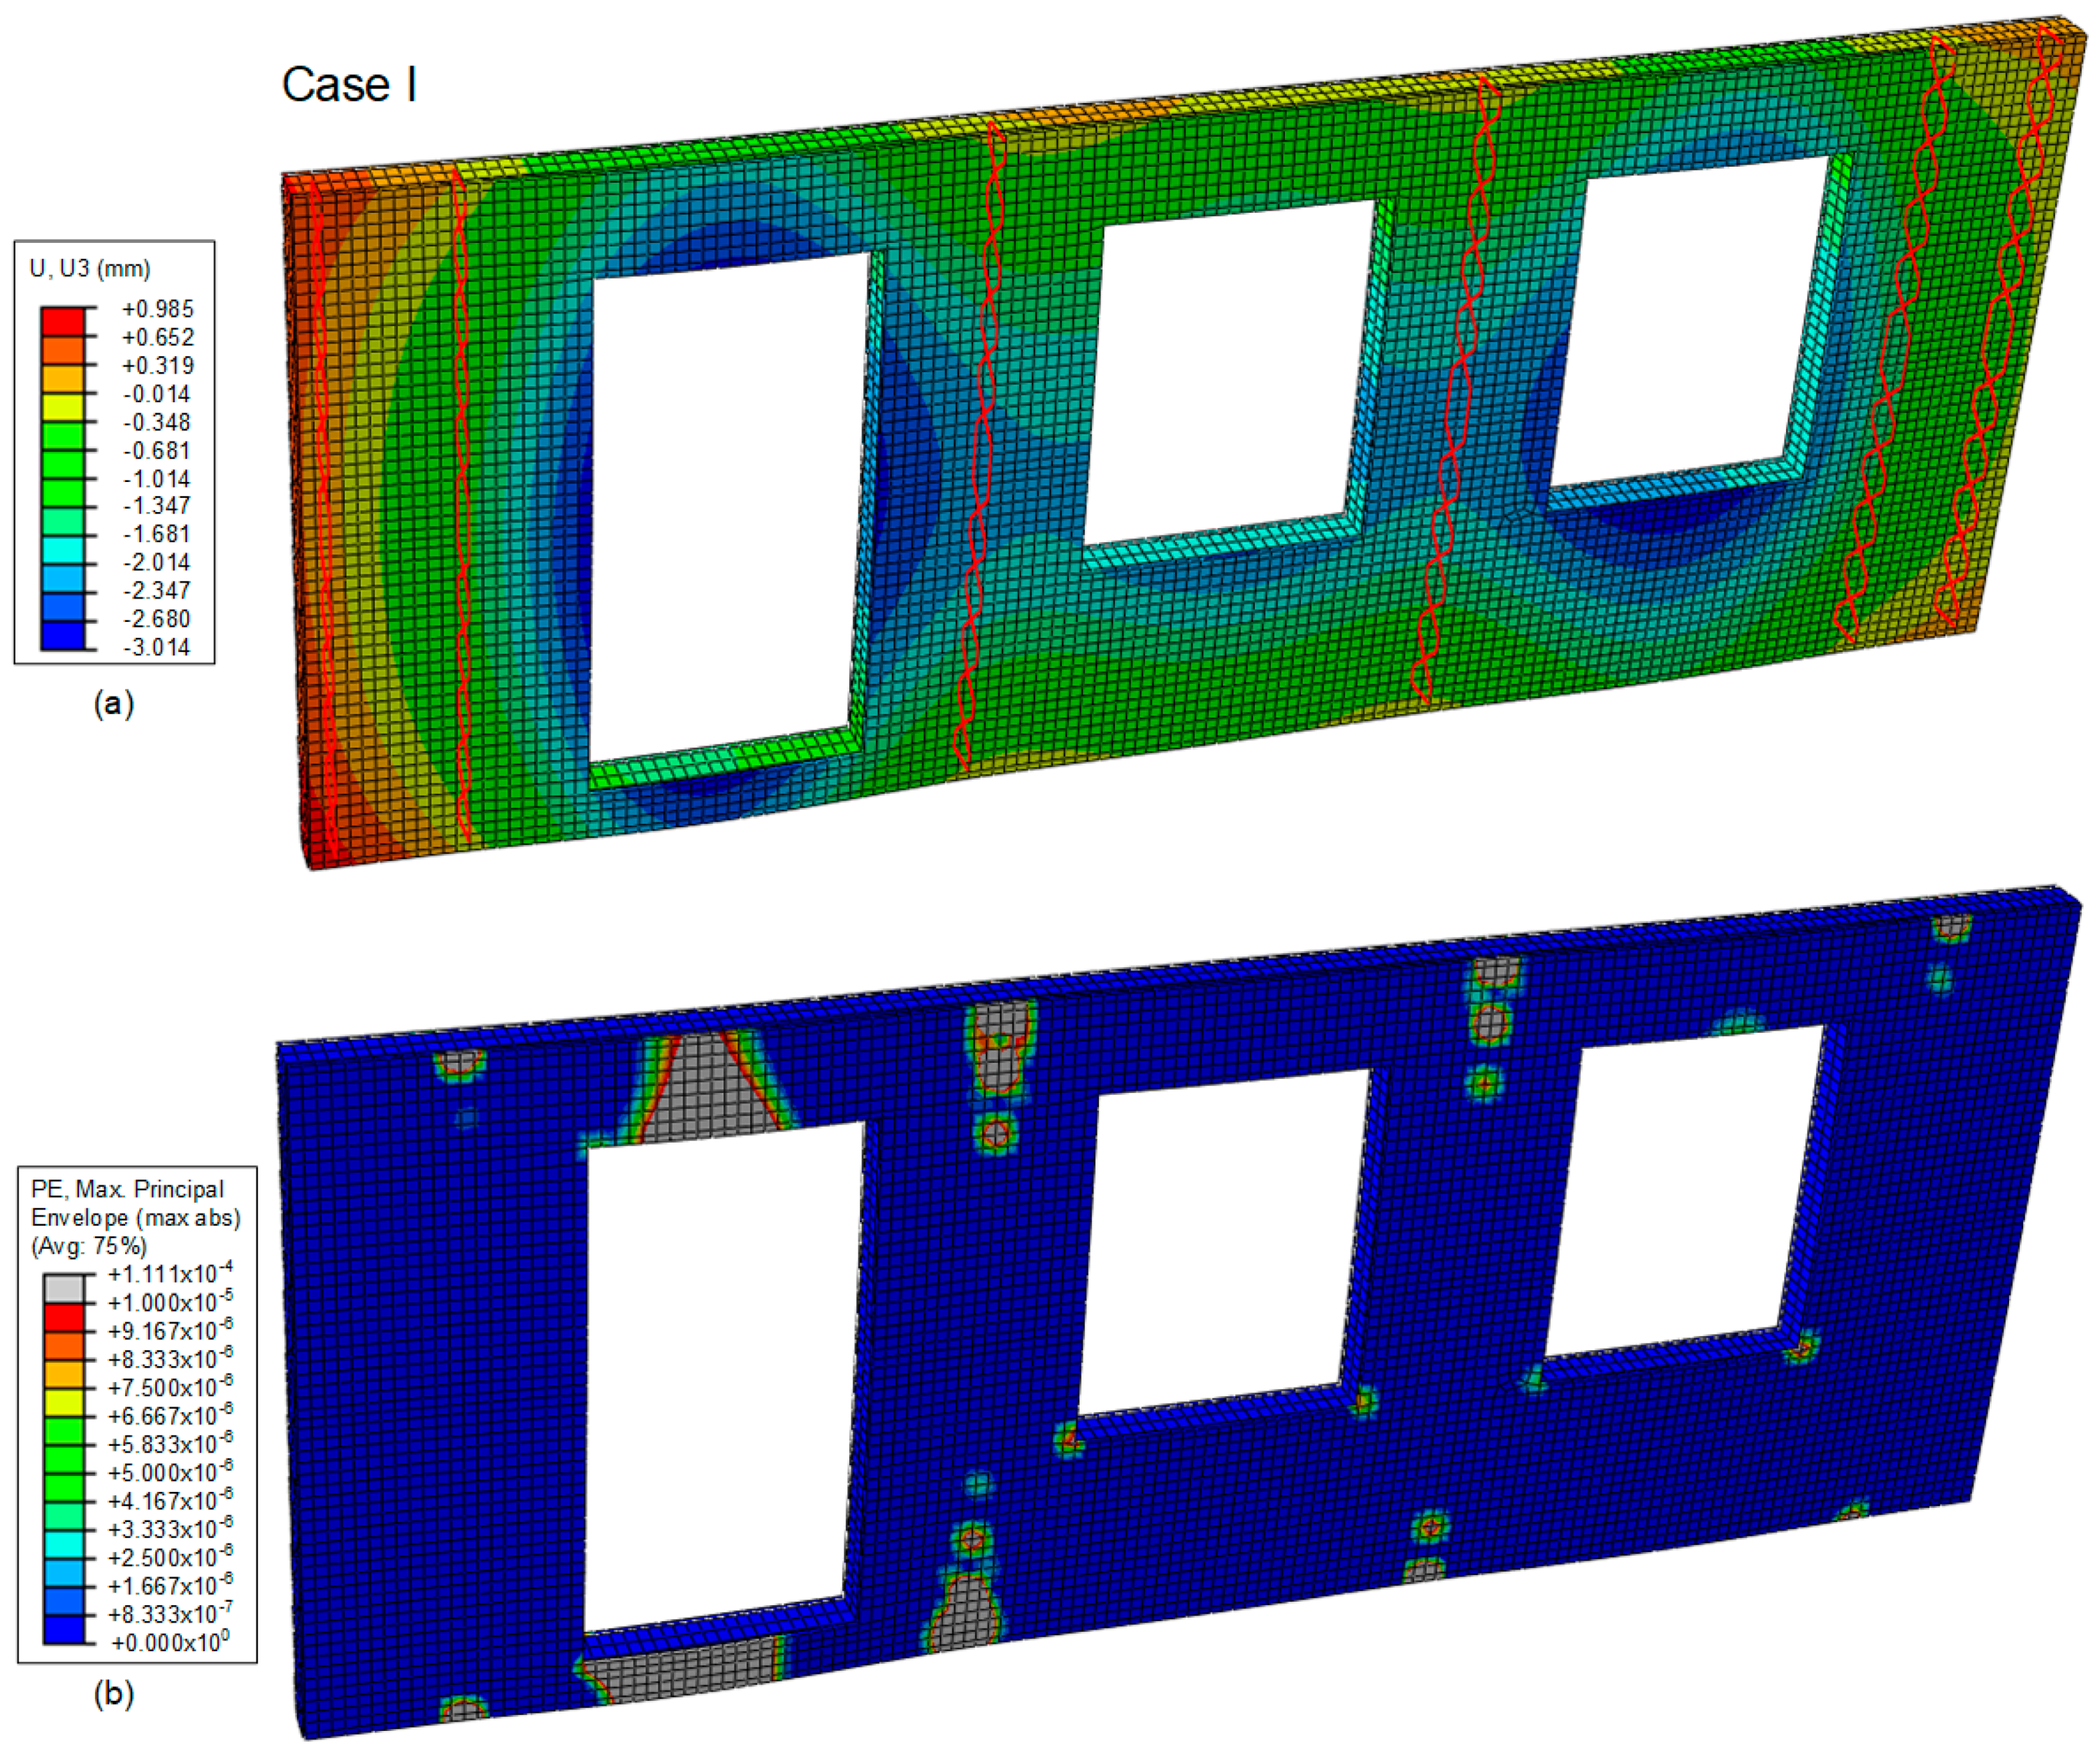
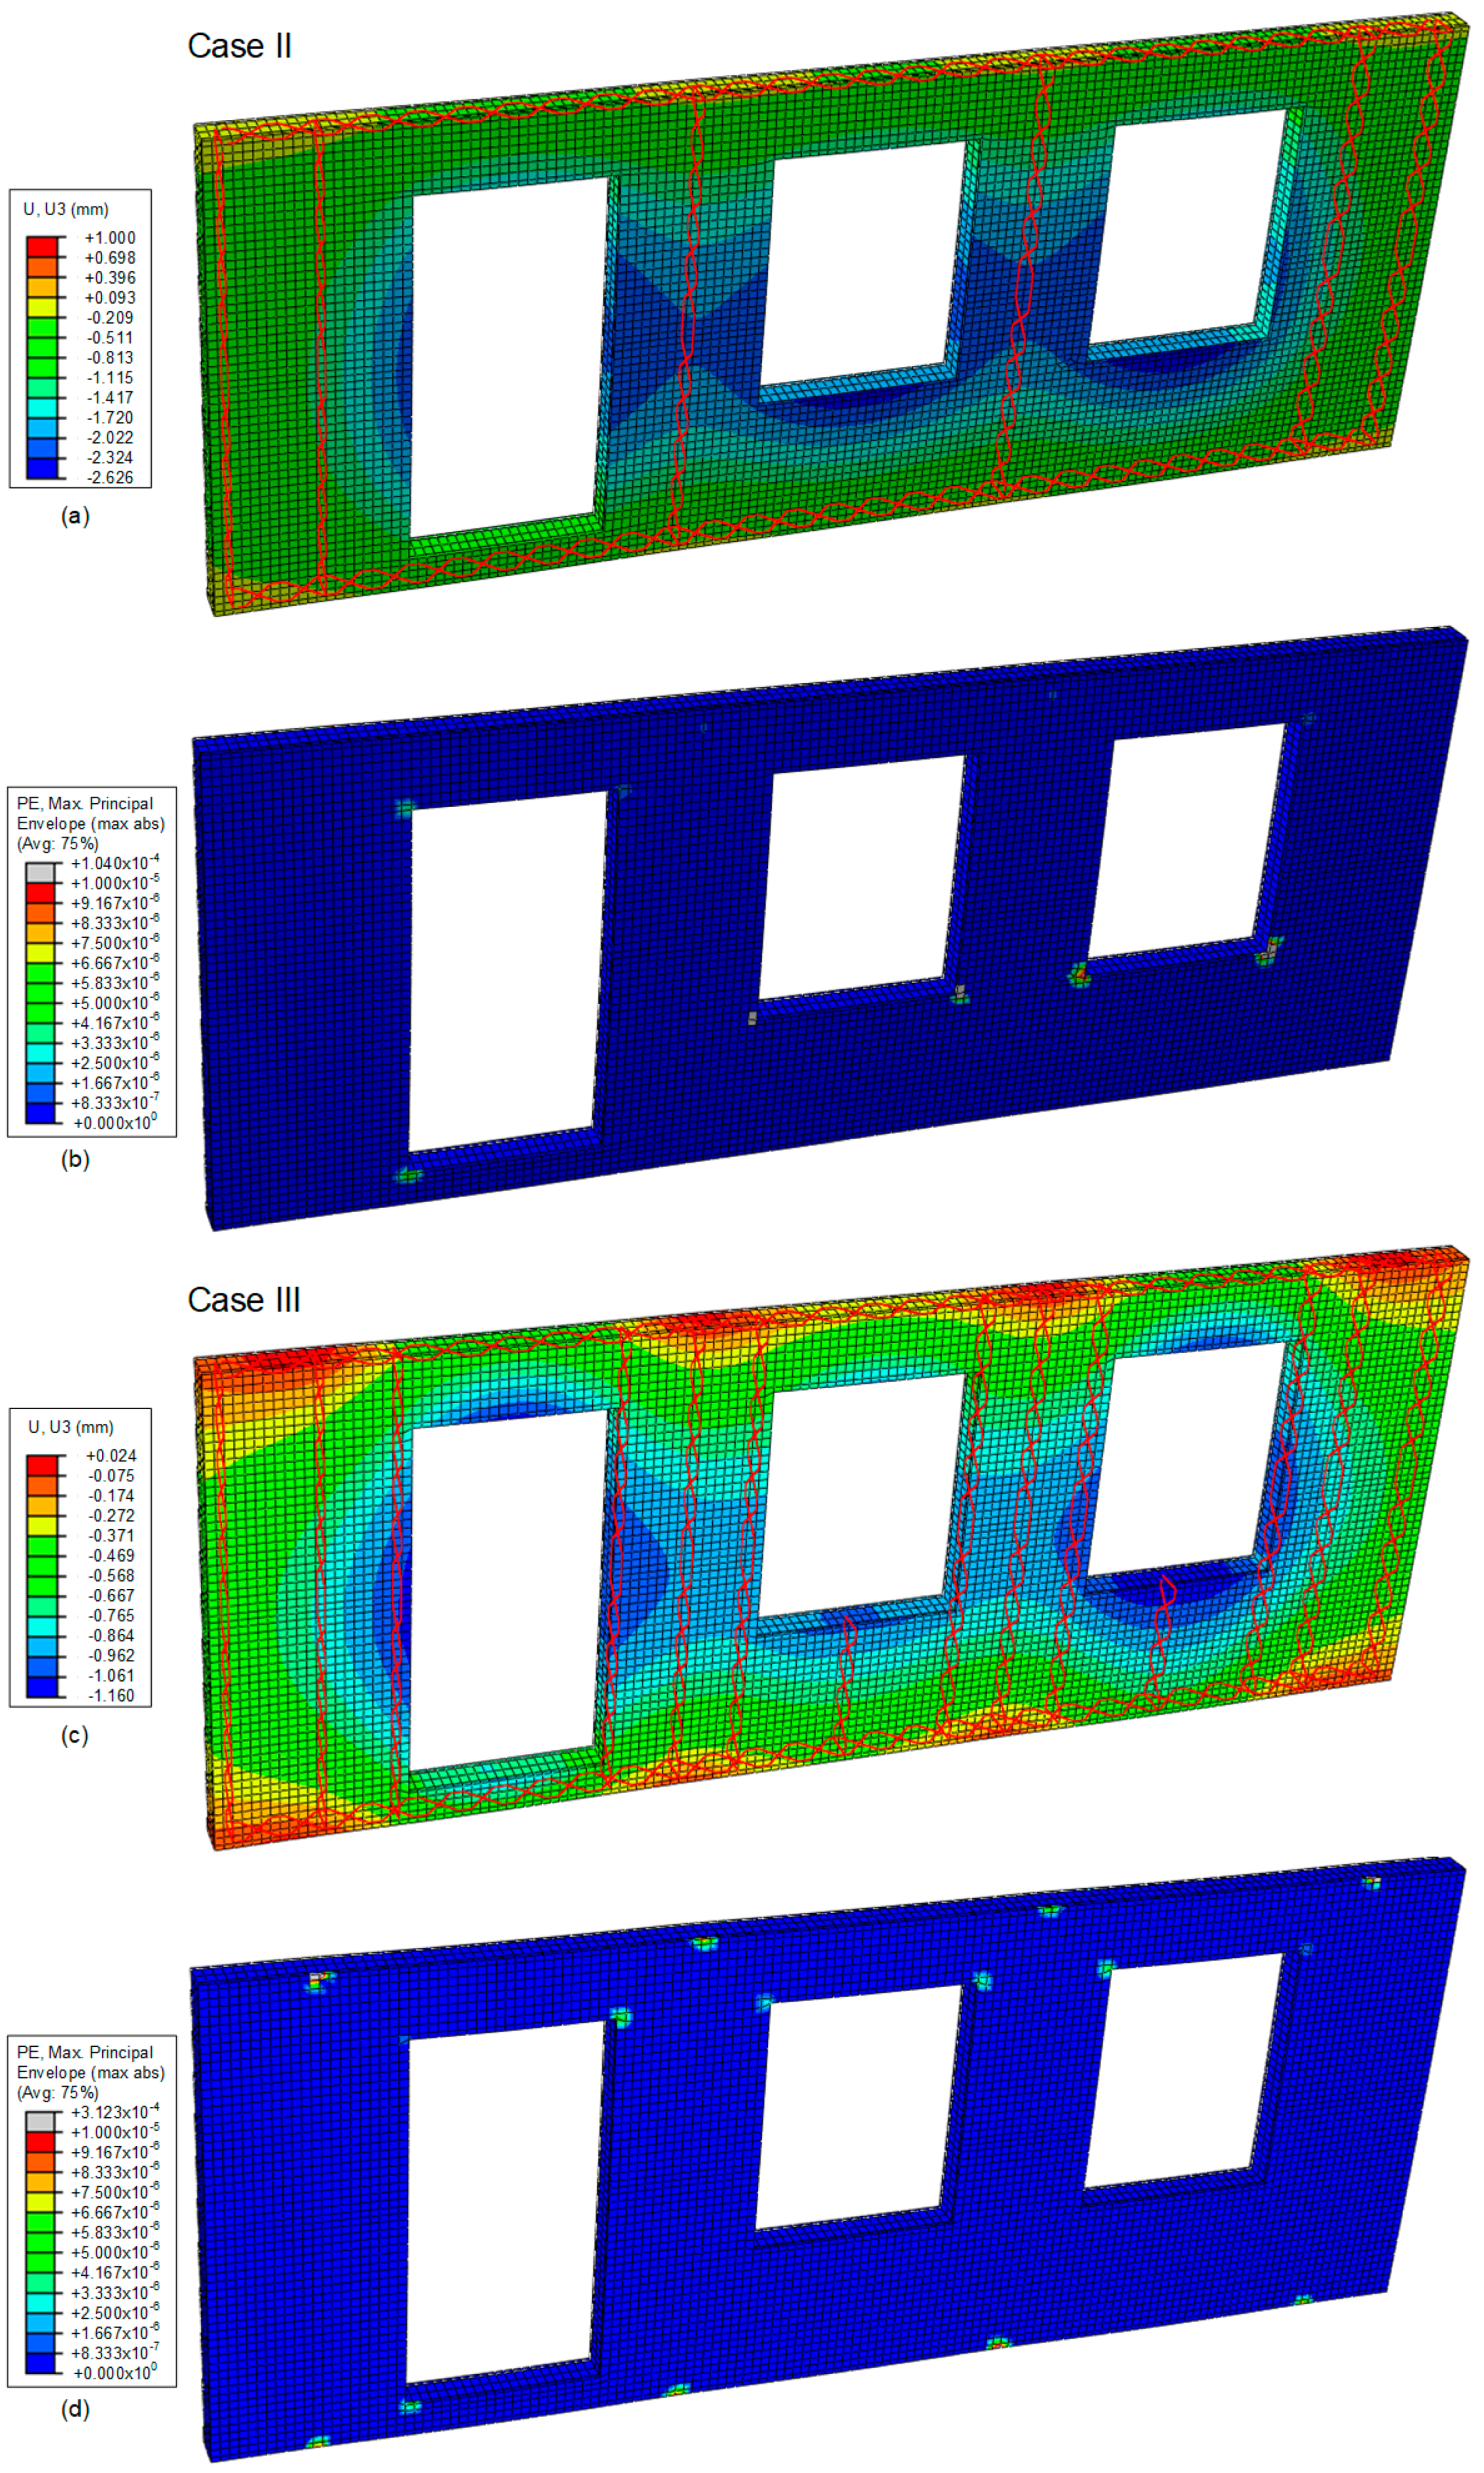
6.3. Performance of Full-Size Sandwich Element with Openings

The concept described for the full-size element, as per Figure 1, was applied in this analysis. More specifically, the FE-model presented in Section 6.2 was modified to contain window and door openings. To analyze the appropriate placement of the connectors in this given element configuration, three cases were considered, namely Case I-III. The first case (Case I), i.e., reference case, consists of the connectors being placed at the outer vertical edges and at the positions of the anchors as was the case in full-sandwich element with a 2.0 m connector spacing. Furthermore, the analysis consisted of solely applying LC2, defined in Table 3, as this was found to be the most critical load case at both the SLS and the ULS. In LC2, the external facing of the sandwich element is under suction and the internal facing is under pressure.
The deformed shape together with the out of plane displacement and cracks, represented as maximum principle plastic strain, are shown for the SLS in Figure 17. As can be seen, the displacements of the element are rather small, with a maximum value of approximately 3 mm. However, the displacements due to local bending are rather pronounced at the openings, especially above and below the door opening. This also leads to severe cracking of the facing in these regions. Cracks were also observed around the connector attachments at the location of the upper and lower anchors and smaller cracks at the corners of the openings.
In the second case (Case II), additional connectors were placed between the outer and inner facings, horizontally along the upper and lower edges of the element. This stiffens the entire element and consequently reduces the displacements of the element, especially at the door opening; see Figure 18a. Furthermore, the amount of cracking was also drastically reduced, as depicted in Figure 18b. Nevertheless, the local bending of the outer facing was quite noticeable around the openings. To overcome this phenomenon, additional vertical connectors were placed on each side of the openings, together with one additional short connector below each window opening in the third case (Case III). These extra connectors reduced both the element’s global bending about the x-axis, as per Figure 10, and the local affects around the openings, such that there were reduced displacements and cracking; see Figure 18c. The maximum displacement at the SLS was reduced to slightly above 1 mm and first cracking in the outer facing took place at load levels above the SLS. Accordingly, the cracking at the ULS is shown for Case III in Figure 18d.
A summary of the FEA results pertaining to the sandwich element with openings with different connector placement cases (Cases I-II) is provided in Table 6. For Cases I and II, the pull-out capacity of the connectors resulted in the limiting factor for the maximum wind load resistance, while the capacity of the anchors was governing for Case III.

7. Discussion

Within the scope of the SESBE project, the structural performance of a developed TRRPC sandwich façade element was verified. Based on preliminary structural investigations in the conceptual phase, a thorough experimental and modelling program was established. Experiments were conducted on individual materials, composites and components. The experimentally yielded material properties were used as input for the FE models, and the model was validated by its ability to reproduce the findings in component tests. The modelling and testing have been performed in an iterative process, in parallel with the development and characterization of the materials.
This paper presents an overview of the sandwich element concept, together with a description of the different incorporated materials and components, e.g., TRRPC facings, FC insulation core, GFRP connectors and anchoring details. Moreover, the structural model of the element was validated via experimental data from wind load testing. Therefore, the overall behavior of the sandwich element could be modelled in a realistic way while being subjected to wind loads. The resulting deformations and cracking were also found to be within acceptable limits. Hence, within the project, it has been proven through experimental data validation at different investigational levels, i.e., composite and component, that the chosen modelling concept can describe the most important phenomena and failure modes governing the overall behavior of the TRRPC sandwich element. Local failure modes that are not directly captured by the structural model, such as connector pull out and anchorage failure, are accounted for by design criteria determined by tests. The validated model was expanded to a conceptual full-size sandwich element with and without openings to enable further prediction and analysis of its structural performance according to a design scenario, as well as the SLS and ULS requirements.
The sandwich element’s composite action is mainly dependent on the mechanical properties of the GFRP connectors, i.e., strength and stiffness. The investigated connector solutions, single and double, were deemed to have sufficient load resistance for the studied load cases. Concerning the elements with a double connector configuration, the deflections were observed to be smaller as a result of superior composite action. The double connectors also present the advantage of being able to carry both wind suction and pressure. As demonstrated in the wind load tests and numerical modeling, composite action can be further improved by simply minimizing the spacing between the connectors. However, it was found in both practice and modelling that window or door openings in an element limit the ability to use tight connector spacing. As an alternative, a combination of single and double connectors can be applied in one element in accordance to the given design load.
For the sandwich element developed in this project, the FC core was shown to have an insignificant role concerning shear transfer between the TRRPC facings. Normal compressive stresses can however be transferred via the core, which in turn ensures a set distance between facings. The FC core also stabilizes the connector diagonals in compression to some extent, but since the level of restraint is uncertain, the connectors were assumed to be free to deform in the FE model. However, there is obvious potential in the further development of the mechanical performance of the FC core to increase its contribution to the composite action.
Overall, since the cracking in the facings has been shown to be minimal for the relevant load levels, it is acceptable to use only one layer of carbon grid reinforcement from a mechanical point of view. By doing so, the amount of reinforcement grid would be reduced, and the related physical labor simplified. Alternatively, additional reinforcement could be placed in specific regions where larger cracking is expected, e.g., around openings.

Author Contributions

Conceptualization and methodology, M.F. and N.W.P.; formal analysis and validation, D.V. and M.F.; Writing—Review and Editing, N.W.P., M.F. and D.V.

Funding

The SESBE (Smart Elements for Sustainable Building Envelopes) project was funded within the Framework Programme 7 under the Grant Agreement No. 608950. The authors would like to thank the European Commission for funding the project and making this work possible.

Acknowledgments

The GFRP connectors applied in this project were produced by Mostostal Warszawa S.A. and funding acquisition by Mueller U.

Conflicts of Interest

The authors of this paper declare no conflict of interest.

References

  1. Stenberg, E. Structural Systems of the Million Program Era; KTH School of Architecture: Stockholm, Sweden, 2013. [Google Scholar]
  2. EN 206-1. Concrete-Specification, Performance, Production and Conformity; European Standard: Brussels, Belgium, 2013. [Google Scholar]
  3. Engberts, E. Large-size facade Elements of textile reinforced concrete. In ICTRC’2006-1st International RILEM Conference on Textile Reinforced Concrete; Hegger, J., Brameshuber, W., Will, N., Eds.; RILEM Publications SARL: Paris, France, 2006. [Google Scholar]
  4. Hegger, J.; Horstmann, M.; Scholzen, A. Sandwich Panels with Thin-Walled Textile-Reinforced Concrete Facings. Spec. Publ. 2008, 251, 109–124. [Google Scholar]
  5. Colombo, I.G.; Colombo, M.; di Prisco, M. Bending behaviour of Textile Reinforced Concrete sandwich beams. Constr. Build. Mater. 2015, 95, 675–685. [Google Scholar] [CrossRef]
  6. Shams, A.; Stark, A.; Hoogen, F.; Hegger, J.; Schneider, H. Innovative sandwich structures made of high performance concrete and foamed polyurethane. Compos. Struct. 2015, 121, 271–279. [Google Scholar] [CrossRef]
  7. Miccoli, L.; Fontana, P.; Silva, N.; Klinge, A.; Cederqvist, C.; Kreft, O.; Sjöström, C. Composite UHPC-AAC/CLC facade elements with modified interior plaster for new buildings and refurbishment. J. Facade Des. Eng. 2015, 3, 91–102. [Google Scholar]
  8. Ghoneim, G.; El-Hacha, R.; Carson, G.; Zakariasen, D. Precast Ultra High Perfromance Fibre Reinforced Concrete Replaces Stone And Granite On Building Façade. In Proceedings of the 3rd International Fib Congress incorporating the PCI Annual Convention and Bridge Conference, Washington, DC, USA, 29 May–2 June 2010; pp. 1–15. [Google Scholar]
  9. Rebentrost, M.; Wight, G.; Fehling, E. Experience and applications of ultra-high performance concrete in Asia. In Proceedings of the 2nd International Symposium on Ultra High Performance Concrete, Kassel, Germany, 5–7 March 2008; pp. 19–30. [Google Scholar]
  10. Papanicolaou, C. Applications of textile-reinforced concrete in the precast industry. In Textile Fibre Composites in Civil Engineering; Thanasis, T., Ed.; Elsevier: Amsterdam, The Netherlands, 2016; pp. 227–244. [Google Scholar]
  11. Mueller, U.; Williams Portal, N.; Chozas, V.; Flansbjer, M.; Larazza, I.; da Silva, N.; Malaga, K. Reactive powder concrete for facade elements—A sustainable approach. J. Facade Des. Eng. 2016, 4, 53–66. [Google Scholar] [CrossRef]
  12. Hegger, J.; Kulas, C.; Horstmann, M. Spatial textile reinforcement structures for ventilated and sandwich façade elements. Adv. Struct. Eng. 2012, 15, 665–675. [Google Scholar] [CrossRef]
  13. Salmon, D.C.; Einea, A.; Tadros, M.K.; Culp, T.D. Full scale testing of precast concrete sandwich panels. ACI Struct. J. 1997, 94, 239–247. [Google Scholar]
  14. Lameiras, R.; Barros, J.; Valente, I.B.; Azenha, M. Development of sandwich panels combining fibre reinforced concrete layers and fibre reinforced polymer connectors. Part I: Conception and pull-out tests. Compos. Struct. 2013, 105, 446–459. [Google Scholar] [CrossRef] [Green Version]
  15. Lameiras, R.; Barros, J.; Azenha, M.; Valente, I.B. Development of sandwich panels combining fibre reinforced concrete layers and fibre reinforced polymer connectors. Part II: Evaluation of mechanical behaviour. Compos. Struct. 2013, 105, 460–470. [Google Scholar] [CrossRef] [Green Version]
  16. Assaad, J.; Chakar, E.; Zéhil, G.-P. Testing and modeling the behavior of sandwich lightweight panels against wind and seismic loads. Eng. Struct. 2018, 175, 457–466. [Google Scholar] [CrossRef]
  17. Cuypers, H.; Wastiels, J. Analysis and verification of the performance of sandwich panels with textile reinforced concrete faces. J. Sandw. Struct. Mater. 2011, 13, 589–603. [Google Scholar] [CrossRef]
  18. De Munck, M.; Vervloet, J.; Kadi, M.E.; Verbruggen, S.; Wastiels, J.; Remy, O.; Tysmans, T. Modelling and experimental verification of flexural behaviour of textile reinforced cementitious composite sandwich renovation panels. In Proceedings of the 12th Fib International PhD Symposium in Civil Engineering, Prague, Czech Republic, 29–31 August 2018; pp. 179–186. [Google Scholar]
  19. Djamai, Z.I.; Bahrar, M.; Salvatore, F.; Si Larbi, A.; El Mankibi, M. Textile reinforced concrete multiscale mechanical modelling: Application to TRC sandwich panels. Finite Elem. Anal. Des. 2017, 135, 22–35. [Google Scholar] [CrossRef]
  20. Mueller, U.; Williams Portal, N.; Flansbjer, M.; Malaga, K. Textile Reinforced Reactive Powder Concrete and its Application for Facades. In Proceedings of the Eleventh High Performance Concrete (11th HPC) and the Second Concrete Innovation Conference (2nd CIC), Tromsø, Norway, 6–8 March 2017. [Google Scholar]
  21. Williams Portal, N.; Flansbjer, M.; Mueller, U. Experimental Study on Anchorage in Textile Reinforced Reactive Powder Concrete. Nord. Concr. Res. 2017, 2, 33. [Google Scholar]
  22. Flansbjer, M.; Williams Portal, N.; Vennetti, D.; Mueller, U. Composite Behaviour of Textile Reinforced Reactive Powder Concrete Sandwich Façade Elements. Int. J. Concr. Struct. Mater. 2018, 12, 71. [Google Scholar] [CrossRef]
  23. Flansbjer, M.; Honfi, D.; Mueller, U.; Wlasak, L.; Williams Portal, N.; Edgar, J.-O.; Larraza, I. Structural behaviour of RPC sandwich facade elements with GFRP connectors. In Proceedings of the 7th International Congress on Architectural Envelopes, San Sebastian-Donostia, Spain, 27–29 May 2015. [Google Scholar]
  24. Flansbjer, M.; Honfi, D.; Vennetti, D.; Mueller, U.; Williams Portal, N.; Wlasak, L. Structural performance of GFRP connectors in composite sandwich façade elements. J. Facade Des. Eng. 2016, 4, 35–52. [Google Scholar] [CrossRef]
  25. Silva, N.; Mueller, U.; Malaga, K.; Hallingberg, P.; Cederqvist, C. Foam concrete-aerogel composite for thermal insulation in lightweight sandwich facade elements. In Proceedings of the 27th Biennial National Conference of the Concrete Institute of Australia in Conjunction with the 69th RILEM Week, Melbourne, Australia, 30 August–2 September 2018. [Google Scholar]
  26. Williams Portal, N.; Flansbjer, M.; Johanesson, P.; Malaga, K.; Lundgren, K. Tensile behaviour of textile reinforcement under accelerated ageing conditions. J. Build. Eng. 2015, 5, 57–66. [Google Scholar] [CrossRef]
  27. RILEM TC 232-TDT. Recommendation of RILEM TC 232-TDT: Test Methods and Design of Textile Reinforced Concrete-Uniaxial Tensile Test: Test Method to Determine the Load Bearing Behavior of Tensile Specimens Made of Textile Reinforced Concrete; RILEM TC 232-TDT: Paris, France, 2016; pp. 4923–4927. [Google Scholar]
  28. Van Deijk, S. Foam concrete. Concrete 1991, 25, 49–54. [Google Scholar]
  29. ISO 10406-1. Fibre-Reinforced Polymer (FRP) Reinforcement of Concrete-Test Methods. Part 1: FRP Bars and Grids; International Organization for Standardization: Geneva, Switzerland, 2008. [Google Scholar]
  30. Dassault Systèmes Abaqus/CAE User’s Guide. ABAQUS Version 6.14; Groupe Dassault: Paris, France, 2014. [Google Scholar]
  31. EN 1990. Eurocode-Basis of Structural Design European Standard; EN 1990: Brussels, Belgium, 2005. [Google Scholar]
  32. EN 1991-1-4. Eurocode 1: Actions on Structures-Part 1-4: General Actions-Wind Actions European Standard; EN 1991-1-4: Brussels, Belgium, 2005. [Google Scholar]
  33. EN 1992-1-1. Eurocode 2: Design of Concrete Structures-Part 1-1: General Rules and Rules for Buildings. European Standard; EN 1992-1-1: Brussels, Belgium, 2014. [Google Scholar]
  34. Fib. Fib Bulletin No. 40-FRP Reinforcement in RC Structures. 2007. Available online: https://www.fib-international.org/publications/fib-bulletins/frp-reinforcement-in-rc-structures-115-detail.html (accessed on 3 December 2018).
  35. ACI Commitee 533. 533R-11 Guide for Precast Concrete Wall Panels. 2012. Available online: https://www.concrete.org/publications/internationalconcreteabstractsportal/m/details/id/51683674 (accessed on 3 December 2018).
  36. SIS-CEN/TS-1992-4-1. Design of Fastenings for Use in Concrete-Part 4-1: General European Standard; SIS-CEN/TS-1992-4-1: Brussels, Belgium, 2010. [Google Scholar]
Figure 1. Illustration of sandwich element concept with structural loads (wind and self-weight, in black) and reaction forces (horizontal and vertical, in red).
Applsci 09 02456 g001
Figure 2. Workflow diagram referring to the component testing and modelling (highlighted boxes are principally covered in this paper). RPC: reactive powder concrete; FC: foam concrete; GFRP: glass fibre reinforced polymer.
Applsci 09 02456 g002
Figure 3. Details of upper (a) and lower (b) element anchors.
Applsci 09 02456 g003
Figure 4. Photo of single (upper) and double connectors (lower) (a) and schematic of load transfer between the two TRRPC facings and single connector in a sandwich element (b).
Applsci 09 02456 g004
Figure 5. Illustration of the anchor tests specimens.
Applsci 09 02456 g005
Figure 6. Schematic of the shear load capacity test set-ups; (a) positive shear load at upper anchors (Hup), (b) negative shear load at upper anchors (Hun), (c) positive shear load at lower anchors (Hlp) and (d) negative shear load at lower anchors (Hln). Red filled circle indicates loaded bolt anchors.
Applsci 09 02456 g006
Figure 7. Illustration of wind load test on full sandwich elements: (a) single connector configuration (S) and (b) double connector configuration (D).
Applsci 09 02456 g007
Figure 8. Photo of sandwich element mounted in the pressure test chamber (a) and location of displacement transducers on inner TRRPC facing (b).
Applsci 09 02456 g008
Figure 9. Schematic of the prescribed interaction conditions for the FE-model.
Applsci 09 02456 g009
Figure 10. Schematic of FE model developed for the wind load testing with (a) single connector (S) configuration (a) and double connector (D) configuration (b).
Applsci 09 02456 g010
Figure 11. Observed failure modes after shear load testing for cases (ad).
Applsci 09 02456 g011
Figure 12. Wind load versus mid-span deflection (d1–d3) for single (S) connectors (a) and for double (D) connectors (b). The deflection values are adjusted with respect to displacements at the anchors.
Applsci 09 02456 g012
Figure 13. Comparison between experimental and finite element analysis (FEA) global behavior for the two sandwich element configurations with single (S) connectors (ac) and double (D) connectors (df). Data pertaining to deflection locations d1–d3 are indicated in the figures.
Applsci 09 02456 g013
Figure 14. Contour plot of the out-of-plane displacement at a wind pressure of 2.0 kPa for element with single (S) connectors (a) and element with double (D) connectors (b).
Applsci 09 02456 g014
Figure 15. Contour plot of cracked regions, represented as maximum principle plastic strain, of the facing at a wind pressure of 2.0 kPa for element with single (S) connectors (a) and element with double (D) connectors (b).
Applsci 09 02456 g015
Figure 16. Out-of-plane deformation plots for LC2 at SLS for outer facing (a) and inner facing (b) for element with 0.5 m connector spacing, and outer facing (c) and inner facing (d) for element with 2.0 m connector spacing. Only half of the element is shown due to symmetry.
Applsci 09 02456 g016
Figure 17. Case I: Contour plots of out-of-plane displacement (connectors in red) (a) and cracked regions at the SLS (b).
Applsci 09 02456 g017
Figure 18. Case II: contour plots of out-of-plane displacement (a) and cracked regions at the SLS (b); and Case III: contour plots of out-of-plane displacement at the SLS (c) and cracked regions at the ULS (d).
Applsci 09 02456 g018
Table 1. Average strength properties (28 days) for RPC (standard deviation in parenthesis), source: [11].
PropertyAverage ValuesTest Description
Compressive strength [MPa]147.2 (2.3)Compression tests
E-modulus [GPa]49.7 (1.7)
Ultimate strain [‰]3.9 (0.2)
Poisson’s ratio [–]0.22 (0.02)
Tensile strength [MPa]5.1 (0.5)Uniaxial tensile tests
Table 2. Average properties for GFRP connectors (standard deviation in parenthesis), source: [22].
PropertyAverage ValuesTest Description
Ultimate tensile capacity [MPa]1012 (35)Tensile test ISO 10406-1 [29]
Ultimate strain [%]2.5 (0.1)
Young’s modulus [GPa]40.3 (0.8)
Critical buckling load [kN]1.7 (0.1) (1)Compression tests
Pull-out capacity [kN]6.5 (0.5)Connector pull-out test
(1) Critical buckling load for a buckling length of 212 mm, corresponding to TRRPC facing distance of 150 mm.
Table 3. Three wind load cases applied to sandwich element.
Load CaseSLSULS
Wext [Pa]Wint [Pa]WSLS [Pa]Wext [Pa]Wint [Pa]WULS [Pa]
LC15141927067712881059
LC2−771−128−899−1157−192−1349
LC3−771192−579−1157288−869
Table 4. Summary of anchor shear load capacity for the four load cases.
Test CaseABCD
Anchor positionupperupperlowerlower
Shear load directionpositivenegativepositivenegative
Number of tests4466
Average valueHRup,m [kN]12.4HRun,m [kN]12.1HRlp,m [kN]8.7HRln,m [kN]9.9
Standard deviationσ [kN]1.0σ [kN]2.5σ [kN]1.0σ [kN]1.5
Coefficient of variationVx [–]0.08Vx [–]0.21Vx [–]0.12Vx [–]0.15
Characteristic fractile factorkn [–]1.83kn [–]1.83kn [–]1.77kn [–]1.77
Characteristic valueHRup,k [kN]10.5HRun,k [kN]7.5HRlp,k [kN]6.9HRln,k [kN]7.3
Design valueHRup,d [kN]7.0HRun,d [kN]5.0HRlp,d [kN]4.6HRln,d [kN]4.8
Table 5. Summary of results for the different connector distance configurations.
Connector Spacing [m]Load CaseSLSULSFailure
Umax [mm]CracksHEl,d [kN]HEu,d [kN]FEpo,d [kN]Wmax [Pa]Wmax/WULS [–]Failure Mode
0.5LC10.8Minor−3.5−2.61.014201.3Lower anchor
LC2−1.1Minor3.54.31.8−15901.2Upper anchor
LC3−0.8Minor2.12.91.4−15901.8Upper anchor
1.0LC11.1Minor−3.5−2.71.514601.4Lower anchor
LC2−1.6Minor3.54.32.7−16101.2Upper anchor
LC3−1.0Minor2.12.91.9−16201.9Upper anchor
2.0LC11.5Minor−3.4−2.71.914701.4Lower anchor
LC2−2.0Minor3.54.23.3−15501.1Conn. pull-out
LC3−1.2Minor2.12.82.4−14501.7Conn. pull-out
Table 6. Summary of results for the different connector configurations subjected to LC2.
CaseLoad CaseSLSULSFailure
umax [mm]CracksHEI,d [kN]HEu,d [kN]FEDO,d [kN]Wmax [Pa]Wmax/WULS [−]Failure Mode
ILC2−3.0Major3.84.33.7−13501.0Con. Pull-out
IILC2−2.6Minor3.74.13.3−15301.1Con. Pull-out
IIILC2−1.2Minor3.64.11.6−16801.2Upper anchor

