Abstract
At the molecular scale, the definition of solid/fluid boundary is ambiguous since its defining precision is comparable to the size of the electron orbitals. It is important to figure out the sub-atomic-level solid/fluid boundary as the definition of the solid/fluid interface is related to estimating various properties such as slip length, Kapitza resistance, confined volume, thermodynamic properties, and material properties. In this work, molecular dynamics (MD) simulations were conducted to show the effects of the solid/fluid boundary on estimating thermodynamic properties. Our results reveal that the different definitions of solid/fluid boundary can cause a considerable impact on quantitative analysis and even qualitative analysis of a nanoscale system. The solid/fluid boundary for Lennard-Jones atoms is determined within sub-atomic precision via heat transfer MD simulations and microscopic heat flux relation. The result shows that solid/fluid boundary is slightly shifted to the fluid regime as the temperature increase. We suggested a mathematical expression of solid/fluid boundary of LJ atom that is theoretically estimated by ignoring the thermal vibration. The results presented in this work are expected to improve the accuracy of analyzing nanoscale phenomena as well as the continuum-based models for nanoscale heat and mass transport.
1. Introduction
The recent advances of nanotechnology have motivated the need for understanding molecular-level physics of nano-devices such as energy storage [1], water purification [2,3], electric power generators [4,5], biochips [6], and integrated fuel cells. For those nano-devices, the scale of modeling is comparable to the size of electron orbitals, and therefore, the solid/fluid boundary is ambiguous (see Figure 1). Currently, the solid/fluid boundaries have been defined within one atomic diameter discrepancy. Depending on where the boundary defined, the size of the channel or nanoparticle [7], slip length [8], Kapitza length [9], dynamic properties [10], and even material properties can be differently estimated. Furthermore, defining solid/fluid boundary is related to the location of the boundary condition (i.e., hydrodynamic slip and interfacial thermal resistance) of continuum modeling [10,11,12,13]. These errors may have a minor influence on large systems (~larger than 100 nm) but have a significant effect on the sub-10 nm system. As semiconductor production processes recently reduced to the single digit nanometer sizes [14] and novel nanochannel fabrication techniques have been developed [15,16], a proper definition of the solid/fluid boundary becomes increasingly important. However, there has been little attention on the atomic-level definition of solid/fluid boundary.
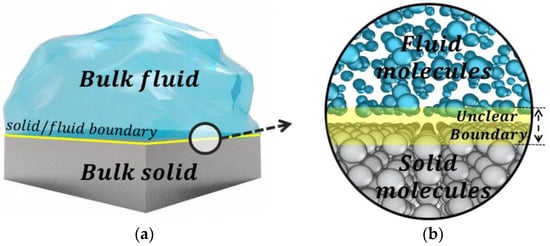
Figure 1.
A pictorial representation of solid/fluid boundary at (a) the macroscopic scale; (b) the molecular scale.
For small systems, interfacial phenomena play a crucial role due to the large surface-to-volume ratio. However, it is difficult to access the molecular-level details of the interfacial phenomena via experiments. Because of the difficulty, molecular dynamics (MD) simulations have become an important tool to investigate the interfacial phenomena. The MD simulation provides all atomic trajectories, which can be converted into measurable macroscopic properties. Also, the thermodynamic and transport properties of both solids and liquids are well reproduced by MD simulations [17,18,19,20,21,22]. As MD simulation allows us to investigate molecular-level details of the interfacial phenomena, it is necessary to define the solid/fluid boundary with atomic-level accuracy. The atomic-level solid/fluid boundary involves the thermal motion, the discrete nature, the interatomic force penetration. Hence, defining a boundary with atomic precision is complicated a problem.
The followings are the definitions of solid/fluid boundary have been used during the past decades: (i) innermost solid layer (center to center) [23,24,25,26,27], (ii) midpoint between the innermost solid layer and the first adsorbed layer [9], (iii) first zero fluid density (accessible area) [28,29], and (iv) the first peak of the adsorption layer [12,30,31]. The problems arising from the absence of atomic-level boundary definition have been reported in several documents. Nagayama et al. [8] point out that the determination of velocity slip is sensitive to the defined boundary. Similarly, Han et al. [9] show the interfacial thermal resistance considerably depends on the solid/fluid boundary definition. Kim et al. [10] report that the evaluations of the local properties adjacent to the solid/fluid interface are affected by the boundary definition. Ramos-Alvarado et al. [19] documented that a proper definition of the liquid/gas interface is necessary for accurate measurement of the contact angle. Despite these reported problems, there is no classical MD study on elucidating the atomic-level definition of solid/fluid boundary.
The rest of the paper is organized as follows: we first present the details of the MD simulation. we then show the effects of the defined boundary on thermodynamic properties and material. The atomic-level boundaries for Ag-Ar, Ag-He, and Cu-Ar are estimated by heat transfer MD simulation and microscopic heat transport equation. We further study the temperature effects on the boundary definition. At the end of the article, a summary of the findings is presented.
2. Simulation Detail
To achieve the objectives of the present work, MD simulations were performed. For thermodynamic properties, equilibrium MD simulation is conducted for various diameters under the canonical ensemble (NVT). Non-equilibrium MD simulation is conducted to investigate a proper location of solid/fluid boundary. The metallic materials (Ag, Cu) are considered as a channel. For the fluid molecules, inert species (Ar, He) were considered. By testing the two solid models and two fluid models, the effect of the potential parameters was investigated. We assumed that there is no chemical reaction as we utilized classical MD simulation. The interatomic potentials are modeled by 12-6 Lennard-Jones (LJ) potential. The potential parameter used in this work is summarized in Table 1. Lorentz-Berthelot combining rules are utilized for the LJ parameters between different atoms. All MD simulations were conducted using LAMMPS (Large-scale Atomic/Molecular Massively Parallel Simulator) [32] with GPU (Graphics Processing Unit) package [33], while OVITO (Open Visualization Tool) [34] was used for the visualization.

Table 1.
Pair potential parameter (12-6 Lennard-Jones).
Figure 2 shows the detailed simulation setup for the MD simulation with heat transfer used in this study. This heat transfer MD setup has extensively studied for interfacial thermal resistance [37,38,39]. In this work, three different channel widths were considered. The periodic boundary condition is applied to the x and y directions, and the fixed boundary condition is utilized to the z-direction. The number of fluid molecules is determined so that it can reproduce a proper bulk density at the center of the fluid block (bulk region). An ideal flat solid surface is considered. The outmost second to fourth layers were locally thermostated. The thermostat generates and removes the same amount of heat by manipulating the velocity magnitude conserving the net momentum. Hence, no heat accumulation is allowed during the simulation and a constant temperature gradient can be achieved. Therefore, z-directional heat flux is maintained during the steady state. To reaches the desired temperature, the system is first integrated under the canonical ensemble (NVT) for 0.5 ns ~ 1.0 ns without the local thermostats. Then, micro-canonical ensemble (NVE) is used and the two local thermostats are activated. The heat flux data is collected during long time spans (200 ns ~ 400 ns) to ensure reliable statistics. For the equilibrium MD simulation, the simulated system is the same as the heat transfer MD, but it is only integrated under NVT ensemble at 100 K without the local thermostats during 10 ns.
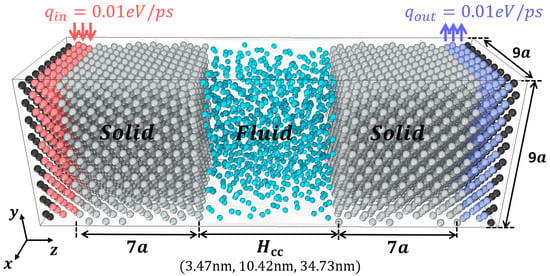
Figure 2.
A systematic detail of heat transfer molecular dynamics (MD) simulation. The fluid molecules are confined between two solid blocks. The black atoms at the outmost solid layer are fixed. The second to forth outmost solid layer marked with red and blue color represent thermostated atoms. is center-to-center distance. The solid blocks have a width of seven lattice constants except for the thermostated layers and nine lattice constants along x and y directions.
3. Results and Discussion
3.1. Equilibrium MD Simulations
3.1.1. Defining Terminologies in a Confined System
Figure 3 shows a typical density and pressure distribution near the metallic surface [23]. The fluid molecules form a dynamic structure near the surface called density layering. This non-homogeneous distribution of fluid atoms results in a high local pressure variation near the surface [40]. Several terminologies are defined in order to closely investigate the solid/fluid interface. The center-to-center height () is defined as the distance between the innermost solid layers. The innermost solid layer is defined as the most probable location of innermost solid atoms. The parameter is the distance between the innermost solid layer and the defined solid/fluid boundary as shown in Figure 3. As the definition of solid/fluid boundary is assumed as a plane in this work, a new definition of solid/fluid boundary can be easily applied to the continuum analysis [12]. Then, the effective channel height is a function of ; .
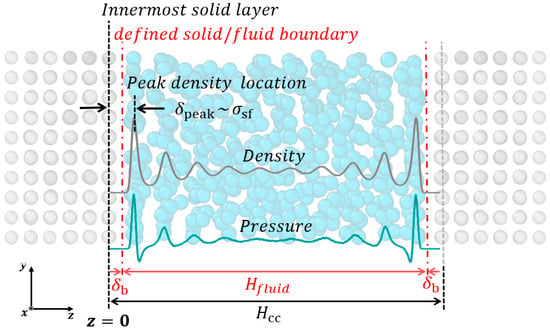
Figure 3.
The density and pressure profiles of nano-confinement. A variable is the distance between the innermost solid layer and the defined solid/fluid boundary. The channel height based on the defined boundary is .
3.1.2. Effects of the Defined Boundary on the Average Density and Pressure
The thermodynamic properties of the confined system are calculated with various boundary definitions to demonstrate the impact of the boundary definitions on the property estimation. The average fluid density, , and pressure, , are used to interpret the nanochannel transport phenomena [30,41,42,43]. These properties are coupled with the volume of fluid and the volume can be differently estimated depending on solid/fluid boundary. Assuming the microscopic solid/fluid boundary as a plane that is away from the innermost solid layers, the volume of confined fluid can be expressed as follows:
where is the cross-section area of confined fluid (xy plane), is the center to center height and is the boundary location.
Then, the average fluid density between the two boundaries is described as follows:
where is the number of fluid between the defined boundary.
Similarly, the microscopic definition of the pressure of the confined fluid with boundary definition can be expressed as follows:
where is an interatomic force vector between i and j atoms and is a relative positional vector from i to j atom.
As can be seen in Figure 4, the average fluid densities and pressure show non-linear variations with respect to the defined boundary. The non-linearity of the average properties are resulted by the dynamical structuring of fluid molecules near the solid surface, which induce the local variation of density and pressure profile. The different crystal orientations show a similar variation of and . It is noted that the largest discrepancy of the average fluid density is 16% for the smallest channel studied (i.e., 3.47 nm). Considering the fact that the dense fluid generally has tiny compressibility, this discrepancy can substantially affect the interpretation and understanding of the physical behavior of the confined fluid. Also, the average properties for smaller channels are more sensitive to the definition of solid/fluid boundary indicating that defining solid/fluid boundary becomes more important for a small system. This is because the smaller channel has a larger surface-to-volume ratio and it enhances the effect of the structural inhomogeneity of fluid near the surface. Thus, this size effect can be roughly estimated by non-dimensional number: , which indicates the ratio of boundary uncertainty over the channel size.
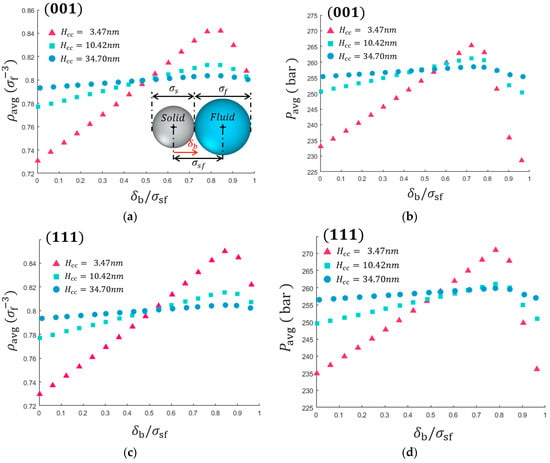
Figure 4.
Effects of the defined solid/fluid boundary on the average thermodynamic properties of confined fluid. The average density with respect to the defined solid/fluid boundary of Ag-Ar contact plane of (a) (001) and (c) (111). The average pressure as a function of solid/fluid defined boundary for (b) (001) (d) (111) contact planes.
3.1.3. Local Thermal Equilibrium Near the Solid/Fluid Boundary
The local thermodynamic equilibrium near the solid/fluid boundary is tested using MD simulation. The slab bins are divided into 0.05 Å intervals, which is small enough to capture the full resolution of the structural inhomogeneity. The local thermodynamic equilibrium must be satisfied to use the mathematical relations of thermodynamic properties driven from statistical mechanics [44]. This can be tested by comparing local velocity distributions to the Maxwell-Boltzmann distribution and quantified by the correlation coefficient. The atomic velocity of the slab bean is collected for 200 ns, which is a relatively long time considering the typical data acquisition time of 2 ns. As shown in Figure 5a, the nucleus of solid and fluid atoms can occupy and as a result of the thermal motions and interactions between solid and fluid molecules. The correlation coefficient, R, represents how well the velocity distribution of MD simulation matches with Maxwell-Boltzmann distribution indicating a perfect match for R = 1 and no correlation for R = 0. Near the edge of the thermal oscillations, the statistical significance is rapidly broken (see Figure 5b). Statistical Depletion Region (SDR) is defined on the basis of 99% correlations as depicted in Figure 5a. The range of SDR can vary with the thermodynamics states and molecular characteristics as it is closely related to the density distribution. It is speculated that the solid/fluid boundary is located at the SDR where no nucleus occupies. SDR is occupied by electrons and an explicit investigation of electrons in SDR must be carried out by quantum mechanical methods. It is noted that the effect of electrons is implicitly considered by LJ potential in this study.
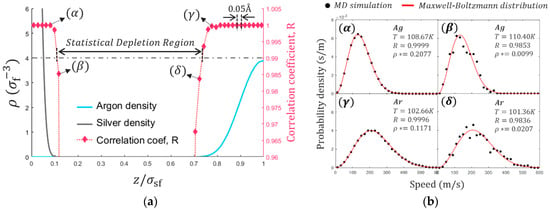
Figure 5.
(a) The local statistical significance near the solid/fluid boundary with normalized density profiles. (b) The normalized distribution of velocity magnitudes and Maxwell-Boltzmann distribution at the corresponding temperature. The location z = 0 is the most probable location of the innermost solid layer.
3.2. Non-Equilibrium MD Simulations
3.2.1. Determination of Solid/Fluid Boundary with Microscopic Heat Flux Relations
To examine the solid/fluid boundary with atomic accuracy, heat transferred MD simulation is conducted. The mathematical description of microscopic heat flux expression is expressed as follows [45]:
where is the velocity of atom . , is the total energy. is the position vector of atom and . is the force vector between atom and . Equation (4) includes a volume term, which is determined by the solid/fluid boundary. Inserting Equation (1) to Equation (4), we can derive Equation (5).
From the setup of MD simulation, the average heat flux in a steady state is given as , which is the rate of thermal energy generating and removing by the local thermostats. Thus, the only unknown variable in Equation (5) is the solid/fluid boundary location, , and thus, the solid/fluid boundary can be estimated.
Figure 6 shows the calculated heat flux with respect to for Ag-Ar, Ag-He, and Cu-Ar system at 300 K. The calculated heat flux increases as the boundary definition shift to the liquid region. The relative difference between the calculated and the given heat flux is between −8% to +12% within shifting. This observation confirms the importance of the definition of the solid/fluid boundary for the quantitative analysis of heat transport. 0.01 eV/ps heat flux is archived at approximately = 0.445 for Ag-Ar interface regardless of the channel heights. This result agrees with the location that recovers the local viscosity near the wall (i.e., = 0.44) report by Kim et al. [10]. In the case of Ag-Ar interface at T = 100 K, this location of solid/fluid boundary can considerably reduce the discrepancies of average density from 7.94% to 1.89% and average pressure from 8.81% to 1.75%. It is noted that the difference of LJ diameter of Ar and He is approximately 29%, but the estimated boundaries show only 9% difference (See Figure 6a,b) when it is normalized by . Similarly, the LJ diameter of Cu and Ag show 13% difference but the estimated boundary shows about 2% difference (See Figure 6a,c). This result implies that the LJ diameter of solid-fluid pair is one of the key factors for solid/fluid boundary. This variation of heat flux affects the estimation of thermal conductivity using Fourier’s law (so-called direct method [18,39]). Then, not only quantitative analysis but also qualitative analysis can be disturbed by boundary definition. The two boundary definitions and lead to two contradicting conclusions on size effects of the thermal conductivity: as the channel size increase, the thermal conductivity increases () or decreases () (See Figure S1).
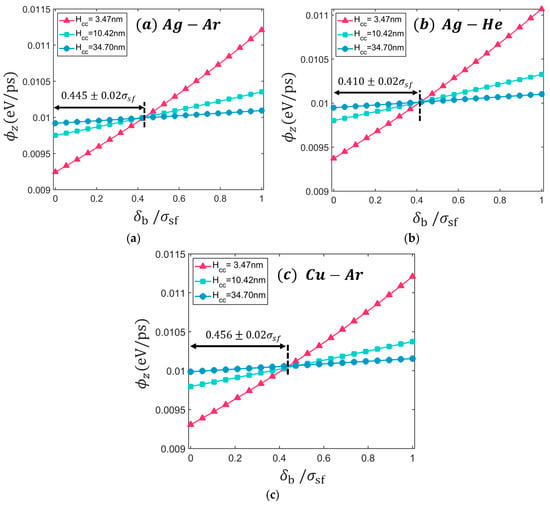
Figure 6.
The estimated heat flux with respect to the location of the defined solid/fluid boundary () for (a) Ag-Ar interface, (b) Ag-He interface, and (c) Cu-Ar interface with three different channel heights. The temperature maintained at T = 100 K for all systems.
3.2.2. Effects of Thermal Motion on Solid/Fluid Boundary
To gain a better understanding of solid/fluid boundary estimated by the previous section, the temperature effects of solid/fluid boundary is studied. The solid/fluid interface involves thermal motions, the structure of solid, potential energy between solid and fluid atoms. In this study, the quantum mechanical temperature effect on the potential energy surface does be not considered, which may have an impact on solid/fluid boundary. An identical LJ potential is used in all temperature range tested.
The solid/fluid boundary location is calculated with LJ potential, the lattice constant of FCC (Face Centered Cubic) crystal by ignoring thermal motion. It is known that monoatomic fluid molecules adjacent to the FCC (001) surface forms another layer of the FCC-like structure to minimize the energy [46]. If the thermal energy is very small, the fluid atoms may form a perfect FCC structure near the surface as shown in Figure 7a. The solid/fluid boundary is represented as the red line that has a three-dimensional corrugation pattern (See Figure S2). For simplicity, the solid/fluid boundary is assumed as a plane in this work. Then, the averaged location of solid/fluid boundary can be described as follows:
where is lattice constant and is the location of a minimum 12-6 LJ potential between solid atom and fluid atom (i.e., ).
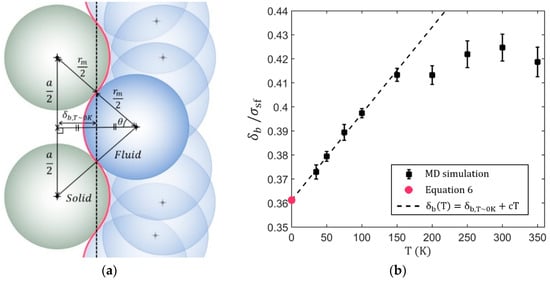
Figure 7.
(a) A geometrical representation of solid/fluid boundary (red curve) near the absolute zero-temperature. Where is the location of the minimum LJ potential between solid and fluid (i.e., ) and is the lattice constant. (b) Determined Solid/fluid boundary with respect to the temperature for the Ag/He interface. The constant value of the linear fitting chosen as for best fitting of first 4 data.
As the temperature increases the solid/fluid boundary shifts toward the fluid regime. A similar shifting is observed during the study of the temperature dependence of ionic structure [47]. It is noted that the minimum temperature tested via MD simulation is 35 K because below this temperature, He atoms are solidified at the Ag interface and thus the method used in this paper is no longer works well. At below 100 K, the solid/fluid boundary shows a linear behavior with respect to the temperature and the linear extrapolation of those data show a good agreement with Equation (6) at T~0 K. At a temperature larger than 100 K, the behavior is non-linear, and it seems saturated after a certain temperature. Additional research is needed to elucidate the cause of this saturation.
4. Conclusions
In this work, the microscopic definition of solid/fluid boundary is investigated using classical MD simulation with metallic solid and monoatomic fluid. It is demonstrated that the average density and pressure of the nanochannel vary depending on where the solid/fluid boundary is defined. The variation in property estimation is more severe in smaller channels. This size effect can be approximately evaluated by the dimensionless number . The local thermodynamic equilibrium is tested near the solid/fluid boundary. It is found that the local equilibrium collapses near the edge of thermal oscillations of the nucleus, creating a statistically depleted region. This region is not occupied by both solid and fluid nucleus. This implies that the solid/fluid boundary is located within the depletion region. Solid/fluid boundary is determined with a sub-atomic precision through the microscopic heat flux equation and non-equilibrium MD simulation. The results show that the microscopic heat flux equation is met in a nearly identical solid/fluid boundary regardless of the channel size. The determined location of solid/fluid boundary for the different materials shows small deviations when it is normalized by . Therefore, it is implied that the LJ diameter of solid/fluid, , plays a key role in the microscopic solid/fluid boundary. The temperature effect on the solid/fluid boundary is further studied for Ar/He interface. It is shown that the solid/fluid boundary of LJ atom can be theoretically estimated by ignoring the thermal vibration. This theoretical estimation shows a good agreement with the extrapolation of the solid/fluid boundary estimated by MD simulation. The results in this study are expected to contribute to understanding nanoscale fluid transport by improving the accuracy and consistency of property calculation. Moreover, it is expected that the definition of solid/fluid boundary improves the continuum-based models for nanoscale heat and mass transport. Future works are required for molecules with complex geometry such as a water molecule. Also, the solid/fluid boundary at the charged surface must be further studied; the solid/fluid boundary could be very different to the non-charged surface as the charged surface creates the Electrical Double Layer (EDL). It is necessary to study how much this new definition of boundary improves the continuum-based model. Also, a quantum mechanical approach may need to elucidate the role of electrons in the solid/fluid boundary.
Supplementary Materials
The following are available online at https://www.mdpi.com/2076-3417/9/12/2439/s1, Figure S1: The thermal conductivity calculated by the Fourier’s law of conductance with a various solid/fluid boundary for (a) Ag(001)/Ar interface and (b) Ag(111)/Ar interface. The errors are estimated as the summation of the standard error of the heat flux equation and the uncertainty of temperature gradient of the linear least square fitting. The black dash line represents the thermal conductivity calculated by Green-Kubo Method with a homogeneous LJ argon system, which contains 12,195 argon atoms with the approximately same thermodynamic state with the bulk region of nanoconfinement, Figure S2: Density distributions of the Ag(001)/Ar nanoconfinement: (a) two-dimensional contour, (b) one-dimensional profile for convex () and concave () corrugation. (c) semi-three-dimensional density profile of the adsorbed fluid near the Ag surface.
Author Contributions
B.K. designed and supervised the research. Y.N. performed the simulations and analyzed data. All authors wrote the manuscript.
Funding
This work was supported by the National Research Foundation of Korea (NRF) grant funded by the Korea government (MSIT) (NRF-2019R1A2C1004661).
Conflicts of Interest
The authors declare no conflict of interest.
References
- Anasori, B.; Lukatskaya, M.R.; Gogotsi, Y. 2D metal carbides and nitrides (MXenes) for energy storage. Nat. Rev. Mater. 2017, 2, 16098. [Google Scholar] [CrossRef]
- Liu, K.; Feng, J.; Kis, A.; Radenovic, A. Atomically thin molybdenum disulfide nanopores with high sensitivity for DNA translocation. ACS Nano 2014, 8, 2504. [Google Scholar] [CrossRef] [PubMed]
- Heiranian, M.; Farimani, A.B.; Aluru, N.R. Water desalination with a single-layer MoS2 nanopore. Nat. Commun. 2015, 6, 8616. [Google Scholar] [CrossRef] [PubMed]
- Rojas, J.P.; Singh, D.; Inayat, S.B.; Sevilla, G.T.; Fahad, H.M.; Hussain, M.M. Micro and Nano-Engineering Enabled New Generation of Thermoelectric Generator Devices and Applications. ECS J. Solid State Sci. Technol. 2017, 6, 3036–3044. [Google Scholar] [CrossRef]
- Feng, J.; Graf, M.; Liu, K.; Ovchinnikov, D.; Dumcenco, D.; Heiranian, M.; Nandigana, V.; Aluru, N.R.; Kis, A.; Radenovic, A. Single-layer MoS2 nanopores as nanopower generators. Nature 2016, 536, 197. [Google Scholar] [CrossRef] [PubMed]
- Park, M.; Kang, B.-H.; Jeong, K.-H. Based Biochip Assays and Recent Developments: A Review. BioChip J. 2018, 12, 1–10. [Google Scholar] [CrossRef]
- Mozaffari, S.; Li, W.; Thompson, C.; Ivanov, S.; Seifert, S.; Lee, B.; Kovarik, L.; Karim, A.M. Colloidal nanoparticle size control: experimental and kinetic modeling investigation of the ligand–metal binding role in controlling the nucleation and growth kinetics. Nanoscale 2017, 9, 13772–13785. [Google Scholar] [CrossRef]
- Nagayama, G.; Cheng, P. Effects of interface wettability on microscale flow by molecular dynamics simulation. Int. J. Heat Mass Transf. 2004, 47, 501–513. [Google Scholar] [CrossRef]
- Han, H.; Mérabia, S.; Müller-Plathe, F. Thermal Transport at Solid–Liquid Interfaces: High Pressure Facilitates Heat Flow through Nonlocal Liquid Structuring. J. Phys. Chem. Lett. 2017, 8, 1946–1951. [Google Scholar] [CrossRef]
- Kim, B.; Beskok, A.; Cagin, T. Viscous heating in nanoscale shear driven liquid flows. Microfluid. Nanofluidics 2010, 9, 31–40. [Google Scholar] [CrossRef]
- Priezjev, N.V.; Darhuber, A.A.; Troian, S.M. Slip behavior in liquid films on surfaces of patterned wettability: Comparison between continuum and molecular dynamics simulations. Phys. Rev. E 2005, 71, 041608. [Google Scholar] [CrossRef] [PubMed]
- Ghorbanian, J.; Celebi, A.T.; Beskok, A. A phenomenological continuum model for force-driven nano-channel liquid flows. J. Chem. Phys. 2016, 145, 184109. [Google Scholar] [CrossRef] [PubMed]
- Vo, T.Q.; Kim, B. Transport Phenomena of Water in Molecular Fluidic Channels. Sci. Rep. 2016, 6, 33881. [Google Scholar] [CrossRef] [PubMed]
- Wu, S.Y.; Lin, C.Y.; Chiang, M.C.; Liaw, J.J.; Cheng, J.Y.; Yang, S.H.; Tsai, C.H.; Chen, P.N.; Miyashita, T.; Chang, C.H.; et al. A 7 nm CMOS platform technology featuring 4th generation FinFET transistors with a 0.027 um2 high density 6-T SRAM cell for mobile SoC applications. In Proceedings of the 2016 IEEE International Electron Devices Meeting (IEDM), San Francisco, CA, USA, 3–7 December 2016; pp. 2–6. [Google Scholar]
- Kim, M.; Ha, D.; Kim, T. Cracking-assisted photolithography for mixed-scale patterning and nanofluidic applications. Nat. Commun. 2015, 6, 6247. [Google Scholar] [CrossRef] [PubMed]
- Jung, W.; Kim, J.; Kim, S.; Park, H.G.; Jung, Y.; Han, C.-S. A Novel Fabrication of 3.6 nm High Graphene Nanochannels for Ultrafast Ion Transport. Adv. Mater. 2017, 29, 1605854. [Google Scholar] [CrossRef] [PubMed]
- Hu, L.; Desai, T.; Keblinski, P. Determination of interfacial thermal resistance at the nanoscale. Phys. Rev. B 2011, 83, 195423. [Google Scholar] [CrossRef]
- Schelling, P.K.; Phillpot, S.R.; Keblinski, P. Comparison of atomic-level simulation methods for computing thermal conductivity. Phys. Rev. B 2002, 65, 144306. [Google Scholar] [CrossRef]
- Ramos-Alvarado, B.; Kumar, S.; Peterson, G.P. On the wettability transparency of graphene-coated silicon surfaces. J. Chem. Phys. 2016, 144, 014701. [Google Scholar] [CrossRef]
- Che, J.; Çağın, T.; Deng, W.; Goddard, W.A., III. Thermal conductivity of diamond and related materials from molecular dynamics simulations. J. Chem. Phys. 2000, 113, 6888–6900. [Google Scholar] [CrossRef]
- Ramos-Alvarado, B.; Kumar, S.; Peterson, G.P. Hydrodynamic slip length as a surface property. Phys. Rev. E 2016, 93, 023101. [Google Scholar] [CrossRef]
- Hyżorek, K.; Tretiakov, K.V. Thermal conductivity of liquid argon in nanochannels from molecular dynamics simulations. J. Chem. Phys. 2016, 144, 194507. [Google Scholar] [CrossRef] [PubMed]
- Vo, T.Q.; Kim, B. Interface thermal resistance between liquid water and various metallic surfaces. Int. J. Precis. Eng. Manuf. 2015, 16, 1341–1346. [Google Scholar] [CrossRef]
- Barisik, M.; Beskok, A. Temperature dependence of thermal resistance at the water/silicon interface. Int. J. Therm. Sci. 2014, 77, 47–54. [Google Scholar] [CrossRef]
- Pham, A.T.; Barisik, M.; Kim, B. Molecular dynamics simulations of Kapitza length for argon-silicon and water-silicon interfaces. Int. J. Precis. Eng. Manuf. 2014, 15, 323–329. [Google Scholar] [CrossRef]
- Ramos-Alvarado, B.; Kumar, S.; Peterson, G.P. Solid–Liquid Thermal Transport and Its Relationship with Wettability and the Interfacial Liquid Structure. J. Phys. Chem. Lett. 2016, 7, 3497–3501. [Google Scholar] [CrossRef] [PubMed]
- Tronci, G.; Raffone, F.; Cicero, G. Theoretical Study of Nanoporous Graphene Membranes for Natural Gas Purification. Appl. Sci. 2018, 8, 1547. [Google Scholar] [CrossRef]
- Shin, H.; Yang, S.; Chang, S.; Yu, S.; Cho, M. Multiscale homogenization modeling for thermal transport properties of polymer nanocomposites with Kapitza thermal resistance. Polymer 2013, 54, 1543–1554. [Google Scholar] [CrossRef]
- Suk, M.E.; Aluru, N.R. Ion transport in sub-5-nm graphene nanopores. J. Chem. Phys. 2014, 140, 084707. [Google Scholar] [CrossRef]
- Bhadauria, R.; Aluru, N.R. A quasi-continuum hydrodynamic model for slit shaped nanochannel flow. J. Chem. Phys. 2013, 139, 074109. [Google Scholar] [CrossRef]
- Koplik, J.; Banavar, J.R.; Willemsen, J.F. Molecular dynamics of fluid flow at solid surfaces. Phys. Fluids Fluid Dyn. 1989, 1, 781–794. [Google Scholar] [CrossRef]
- Plimpton, S. Fast Parallel Algorithms for Short-Range Molecular Dynamics. J. Comput. Phys. 1995, 117, 1–19. [Google Scholar] [CrossRef]
- Brown, W.M.; Wang, P.; Plimpton, S.J.; Tharrington, A.N. Implementing molecular dynamics on hybrid high performance computers – short range forces. Comput. Phys. Commun. 2011, 182, 898–911. [Google Scholar] [CrossRef]
- Stukowski, A. Visualization and analysis of atomistic simulation data with OVITO–the Open Visualization Tool. Model. Simul. Mater. Sci. Eng. 2010, 18, 015012. [Google Scholar] [CrossRef]
- Hirschfelder, J.O.; Curtiss, C.F.; Bird, R.B.; Mayer, M.G. Molecular Theory of Gases and Liquids; Wiley: New York, NY, USA, 1954. [Google Scholar]
- Heinz, H.; Vaia, R.A.; Farmer, B.L.; Naik, R.R. Accurate Simulation of Surfaces and Interfaces of Face-Centered Cubic Metals Using 12−6 and 9−6 Lennard-Jones Potentials. J. Phys. Chem. C 2008, 112, 17281–17290. [Google Scholar] [CrossRef]
- Vo, T.Q.; Kim, B. Physical origins of temperature continuity at an interface between a crystal and its melt. J. Chem. Phys. 2018, 148, 034703. [Google Scholar] [CrossRef] [PubMed]
- Torii, D.; Ohara, T.; Ishida, K. Molecular-Scale Mechanism of Thermal Resistance at the Solid-Liquid Interfaces: Influence of Interaction Parameters Between Solid and Liquid Molecules. J. Heat Transf. 2010, 132, 012402. [Google Scholar] [CrossRef]
- Kim, B.H.; Beskok, A.; Cagin, T. Molecular dynamics simulations of thermal resistance at the liquid-solid interface. J. Chem. Phys. 2008, 129, 174701. [Google Scholar] [CrossRef]
- Barisik, M.; Beskok, A. Equilibrium molecular dynamics studies on nanoscale-confined fluids. Microfluid. Nanofluidics 2011, 11, 269–282. [Google Scholar] [CrossRef]
- Bhadauria, R.; Sanghi, T.; Aluru, N.R. Interfacial friction based quasi-continuum hydrodynamical model for nanofluidic transport of water. J. Chem. Phys. 2015, 143, 174702. [Google Scholar] [CrossRef]
- Motevaselian, M.H.; Mashayak, S.Y.; Aluru, N.R. An EQT-based cDFT approach for a confined Lennard-Jones fluid mixture. J. Chem. Phys. 2015, 143, 124106. [Google Scholar] [CrossRef]
- Mashayak, S.Y.; Motevaselian, M.H.; Aluru, N.R. An EQT-cDFT approach to determine thermodynamic properties of confined fluids. J. Chem. Phys. 2015, 142, 244116. [Google Scholar] [CrossRef] [PubMed]
- Hasan, M.R.; Vo, T.Q.; Kim, B. Manipulating thermal resistance at the solid–fluid interface through monolayer deposition. RSC Adv. 2019, 9, 4948–4956. [Google Scholar] [CrossRef]
- Hardy, R.J. Energy-Flux Operator for a Lattice. Phys. Rev. 1963, 132, 168–177. [Google Scholar] [CrossRef]
- Xue, L.; Keblinski, P.; Phillpot, S.R.; Choi, S.U.-S.; Eastman, J.A. Effect of liquid layering at the liquid–solid interface on thermal transport. Int. J. Heat Mass Transf. 2004, 47, 4277–4284. [Google Scholar] [CrossRef]
- Wu, J.; Wang, J.; Ni, H.; Lu, G.; Yu, J. Investigation of Microscopic Structure and Ion Dynamics in Liquid Li(Na, K)EutecticCl Systems by Molecular Dynamics Simulation. Appl. Sci. 2018, 8, 1874. [Google Scholar] [CrossRef]
© 2019 by the authors. Licensee MDPI, Basel, Switzerland. This article is an open access article distributed under the terms and conditions of the Creative Commons Attribution (CC BY) license (http://creativecommons.org/licenses/by/4.0/).