Article

Service Innovation Model of the Automobile Service Industry

1
Department of Industrial Engineering and Management, National Kaohsiung University of Science and Technology, Kaohsiung 80778, Taiwan
2
Department of Automotive Engineering Education, Universitas Negeri Makassar, Kampus UNM Parangtambung, Jl. Daeng Tata Raya, Makassar, South Sulawesi 90224, Indonesia
*
Author to whom correspondence should be addressed.
Appl. Sci. 2019, 9(12), 2403; https://doi.org/10.3390/app9122403
Submission received: 25 April 2019 / Revised: 29 May 2019 / Accepted: 6 June 2019 / Published: 13 June 2019
(This article belongs to the Special Issue Industrial Engineering and Management: Current Issues and Trends)

Abstract

:

Featured Application

From the findings of this research, we develop a service innovation model for the automobile service industry. Managers or researchers can measure the implementation of service innovation in firms. Furthermore, they can evaluate, improve the innovation and, finally, impact a firm’s performance.

Abstract

Service innovations in the service industry will improve its ability to compete in maintenance as well as increase the number of customers. Measuring service innovations according to the characteristics of the automobile industry is important. Thus, the aim of this paper is to develop a model to measure service innovation in the automobile service industry. A structural equation model is created based on theory and previous models. Data about the industry’s perception of service innovation are collected from questionnaires in Kaohsiung, Taiwan. Samples were collected from 61 authorized automobile service centers. The results indicate that customer demand, competition, and a knowledge-based network as enabler factors are positively correlated with service innovation. Furthermore, a new service concept, new client interface, new service delivery system, and new technology options are positively related to service innovation. Finally, service innovation has a significant positive effect on a firm’s performance. This study developed an effective service innovation model of the automobile service industry.

1. Introduction

Service innovation is mainly focused on the expansion of new service concepts and contributions, including how to generate new ideas to meet customer demand and service contributions [1]. Generally, service innovation is implemented in the service industry, as this industry plays an important role in the growth of the economics of most countries, thus contributing more than 50% of the gross domestic product (GDP) [2,3]. In 2017, based on statistical data from [4] the service sector had contributed 68.82% to the GDP of Taiwan, economic value added with industrial production around 35.37%, while 1.7% was from the agricultural sector.
In addition, the service industry contributes to providing support for the manufacturing industry, in which the automotive industry plays an important role in the growth of the global economy [5]. This industry generates more than $2.5 trillion in revenue per year and corresponds, in general, to roughly 10% of the gross domestic product (GDP) of a developed country [6]. Based on global automobile sales data from year to year, there is a significant increase in GDP. According to data from the international organization of motor vehicle manufactures (OICA) regarding car sales from 2012–2017, in 2012, 82.11 million units were sold, increasing to 96.80 million units sold in 2017. Therefore, automobile sales grew by 17.89% during 2012–2017 [7]. Furthermore, based on data from OICA about car sales in Taiwan. Figure 1 shows automobile sales from 2012 to 2017 and a total of sales equal to 1,594,913 units (Source: http://www.oica.net/category/sales-statistics/). The graph presents 270,078 units from 2012; furthermore, it shows a decline in 2013 of 258,753 units and, in 2014, an increase of 282,130 units. However, 2015–2017 saw a decline from 262,593 to 259,013 units. Thus, the average sales amounted to 265,818.92 units per year, but there was a –4.09% decline in sales from 2012–2017.
The automobile service industry plays an important role in providing after-sales services to guarantee vehicle maintenance. In addition to maintaining and improving service quality, companies are required to conduct service innovation in order to provide satisfaction and be able to compete with competitors in a sustainable manner. Based on data from J.D. Power [8] and the Taiwan Customer Service Index (CSI) study, we measure new-vehicle owner satisfaction with the after-sales service process by examining dealership performance via five factors: service quality, service innovation, vehicle pick-up, service advisors, and service facilities. The study examines service satisfaction in the mass market segment. Those with more vehicle service experience for 75% of the automobile owner population in Taiwan, among whom overall satisfaction is 816 (based on a 1000-point scale), which is 23 points lower than the 839 points among those who service their vehicles less frequently. Moreover, satisfaction with this group has decreased by 39 points since 2015 (816 vs. 855, respectively). Customers with more vehicle service experience have a higher expectation of overall service.
Measurement of service innovation in the automobile industry is necessary to provide information to companies, the extent to which service innovations have been implemented through performance, their impact on customer satisfaction and, ultimately, the ability to increase company revenue. Therefore, a model is needed to measure the implementation of service innovation in the automobile service industry that is in accordance with industry characteristics. Measuring industry performance in offering service innovation to the consumer requires a representative measurement model. In building the model, we focus on several factors, e.g., the basic theory, a conceptual model, which is a formulation of the basic model, and additional dimensions or variables that are expected to represent real conditions. Development of a service innovation model for service industries began in the 1990s. den Hertog [9] published one of the first important service innovation models.
Previous studies on service innovation have been conducted by several researchers, including den Hertog et al. [10], Chen et al. [11], Lin and Chen [12], Baregheh et al. [13], Thakur and Hale [14], and Lay et al. [15], all of whom have contributed to development of a service innovation models. However, while the implementation of these studies has been carried out in the general industry, it has not considered the characteristics of each industry, especially those of the automotive service industry. Farid and Day [16] carried out the publication of service innovation in the automotive service industry by taking samples from managers of authorized service centers in Makassar, Indonesia’s motorcycle industry. The model has limitations due to qualitative testing, has not used a large enough sample, and still requires confirmatory factor analysis.
To fill in the gap, a service innovation model with the characteristics of the automobile industry is required. We constructed a service innovation model in the automobile service industry with a conceptual model based on a basic model by combining previous service innovation research by incorporating characteristics of the automobile industry through the addition of service quality factors. The aim of this study was to evaluate the effect of several factors on service innovation. The results enabled us to understand enabler factors and offers of new service to improve service innovation and the effect on a firm’s performance. Our paper is organized as follows: We begin with the introduction. We explain the material and methods in Section 2. Then, Section 3 presents the results of this study. Section 4, discusses the findings, and the closing section concludes the paper.

2. Material and Methods

The typical systematic analysis is used in the SEM method. Measurements of the relationship between latent and manifest variables, and between entire latent variables integrated into a linear model [17,18,19], are considered. Generally, the primary stages can be described in key processes as follows: specification of the model; model identification; data collection; parameter estimation; testing model fit; and modification of the model [20,21].

2.1. Specification of the Model

The first step of SEM is a model specification. The form of a path diagram or casual model represents a sequence of equations is built on the conversion of the verbal hypothesis. The previous experience or theoretical knowledge becomes a reference in building the relationship [21].

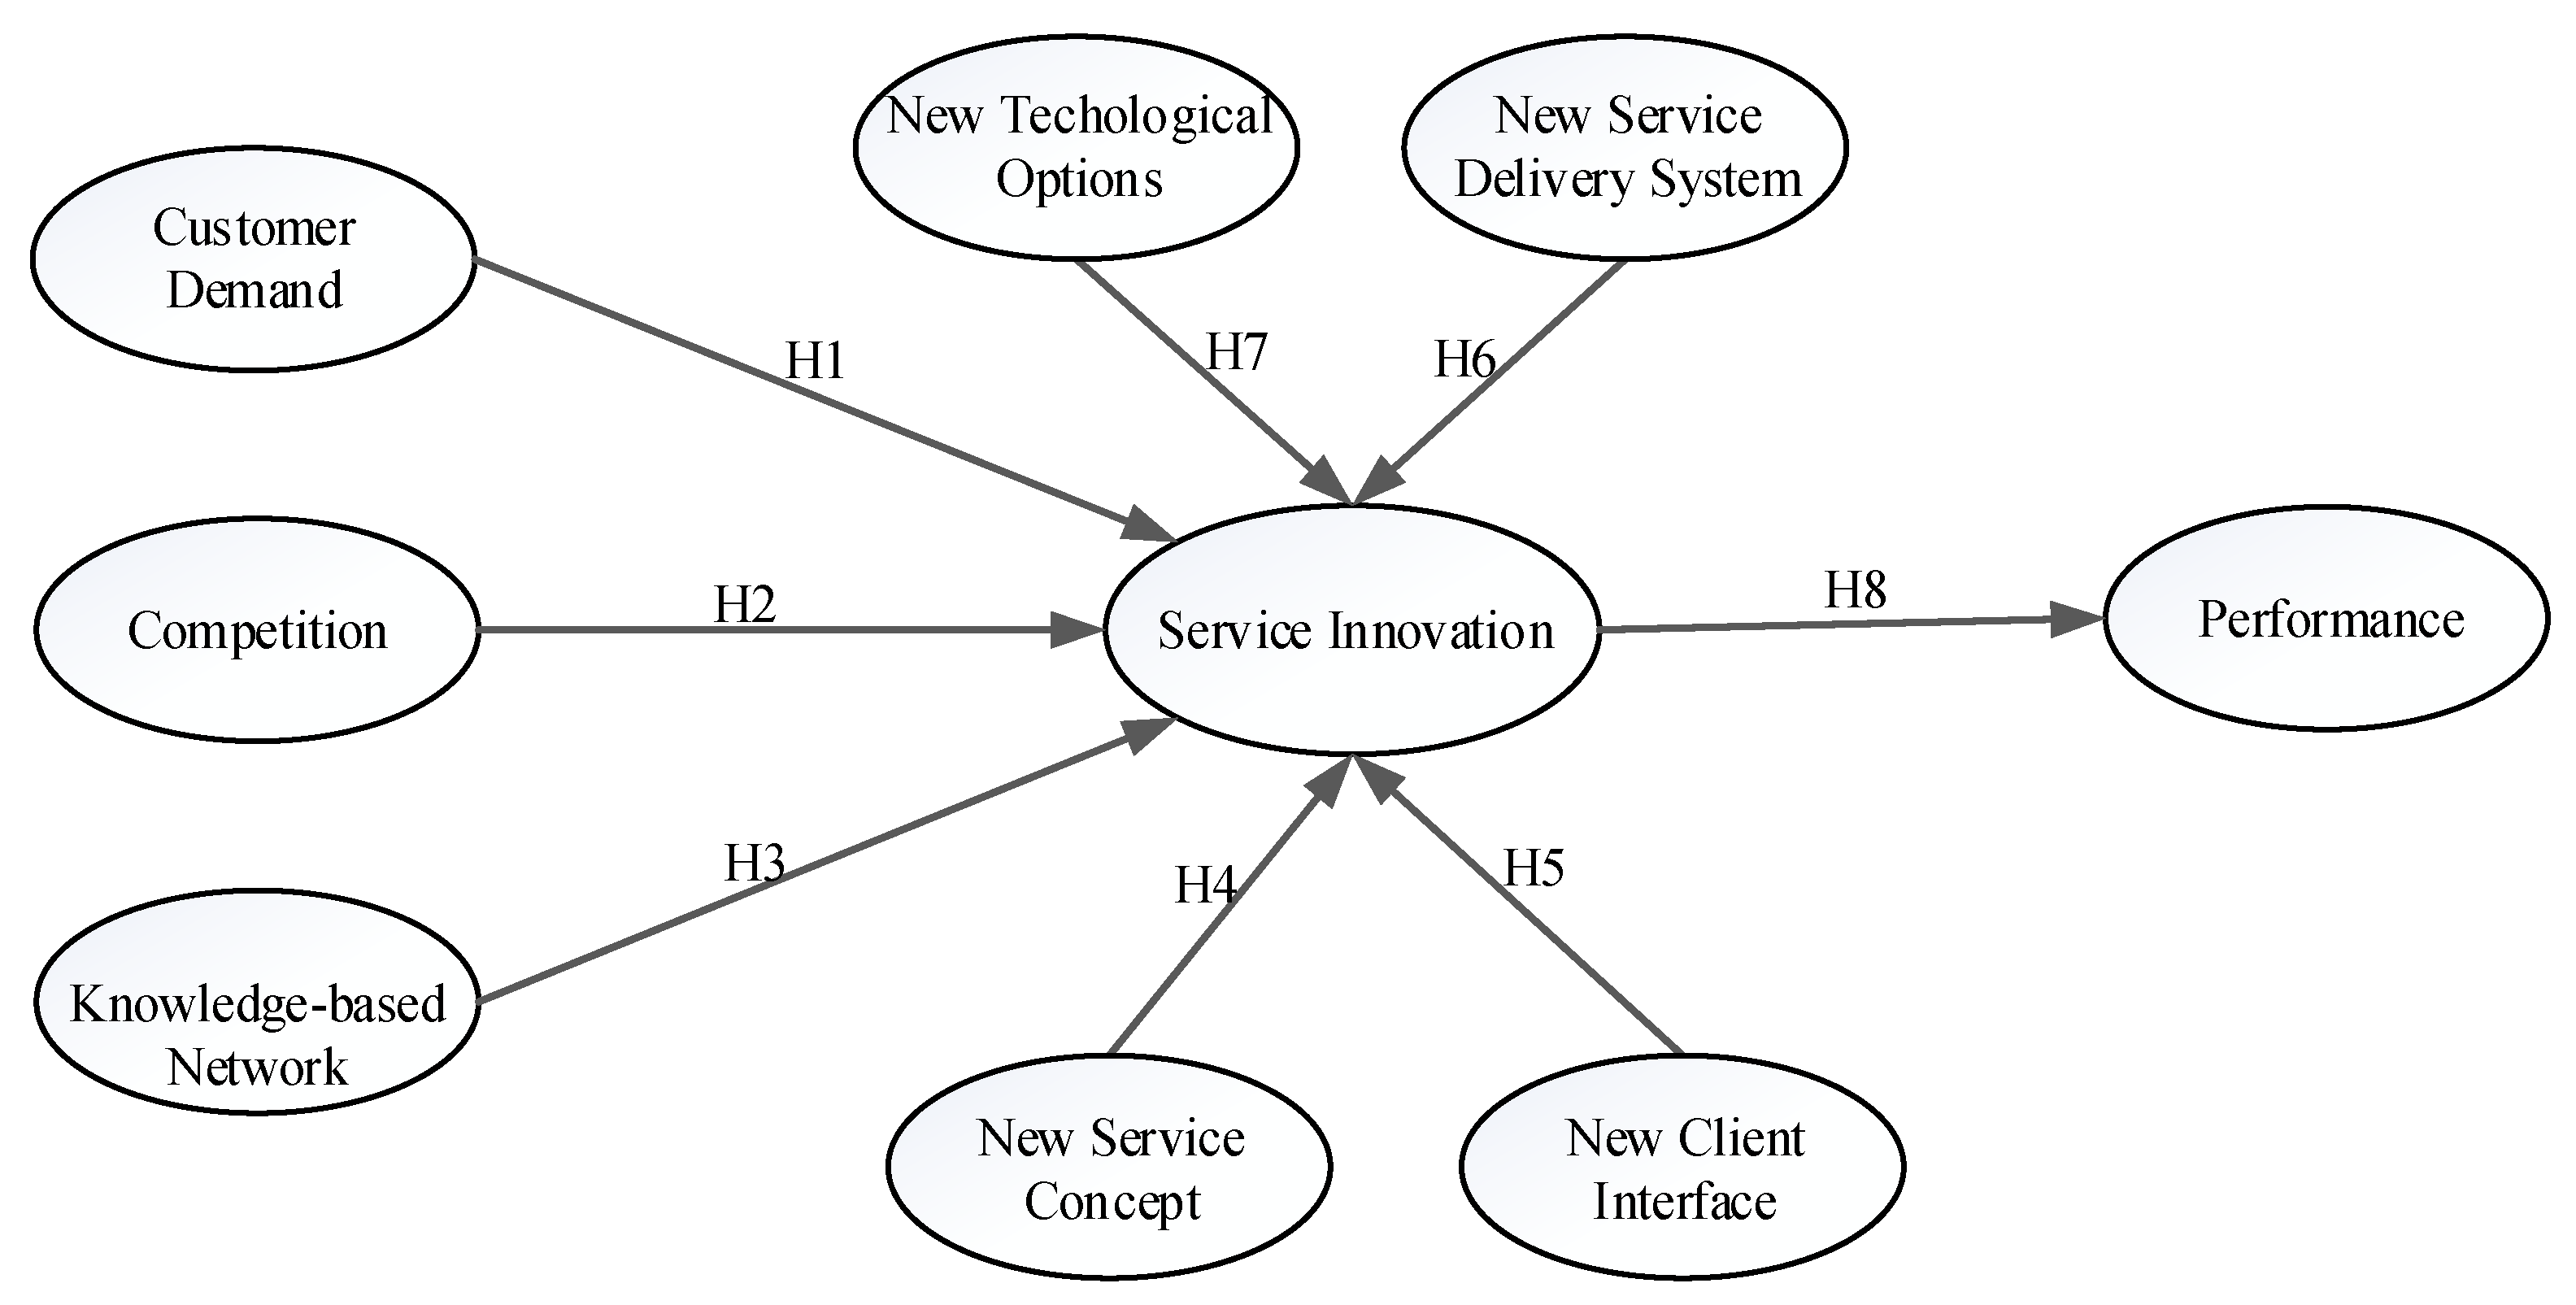
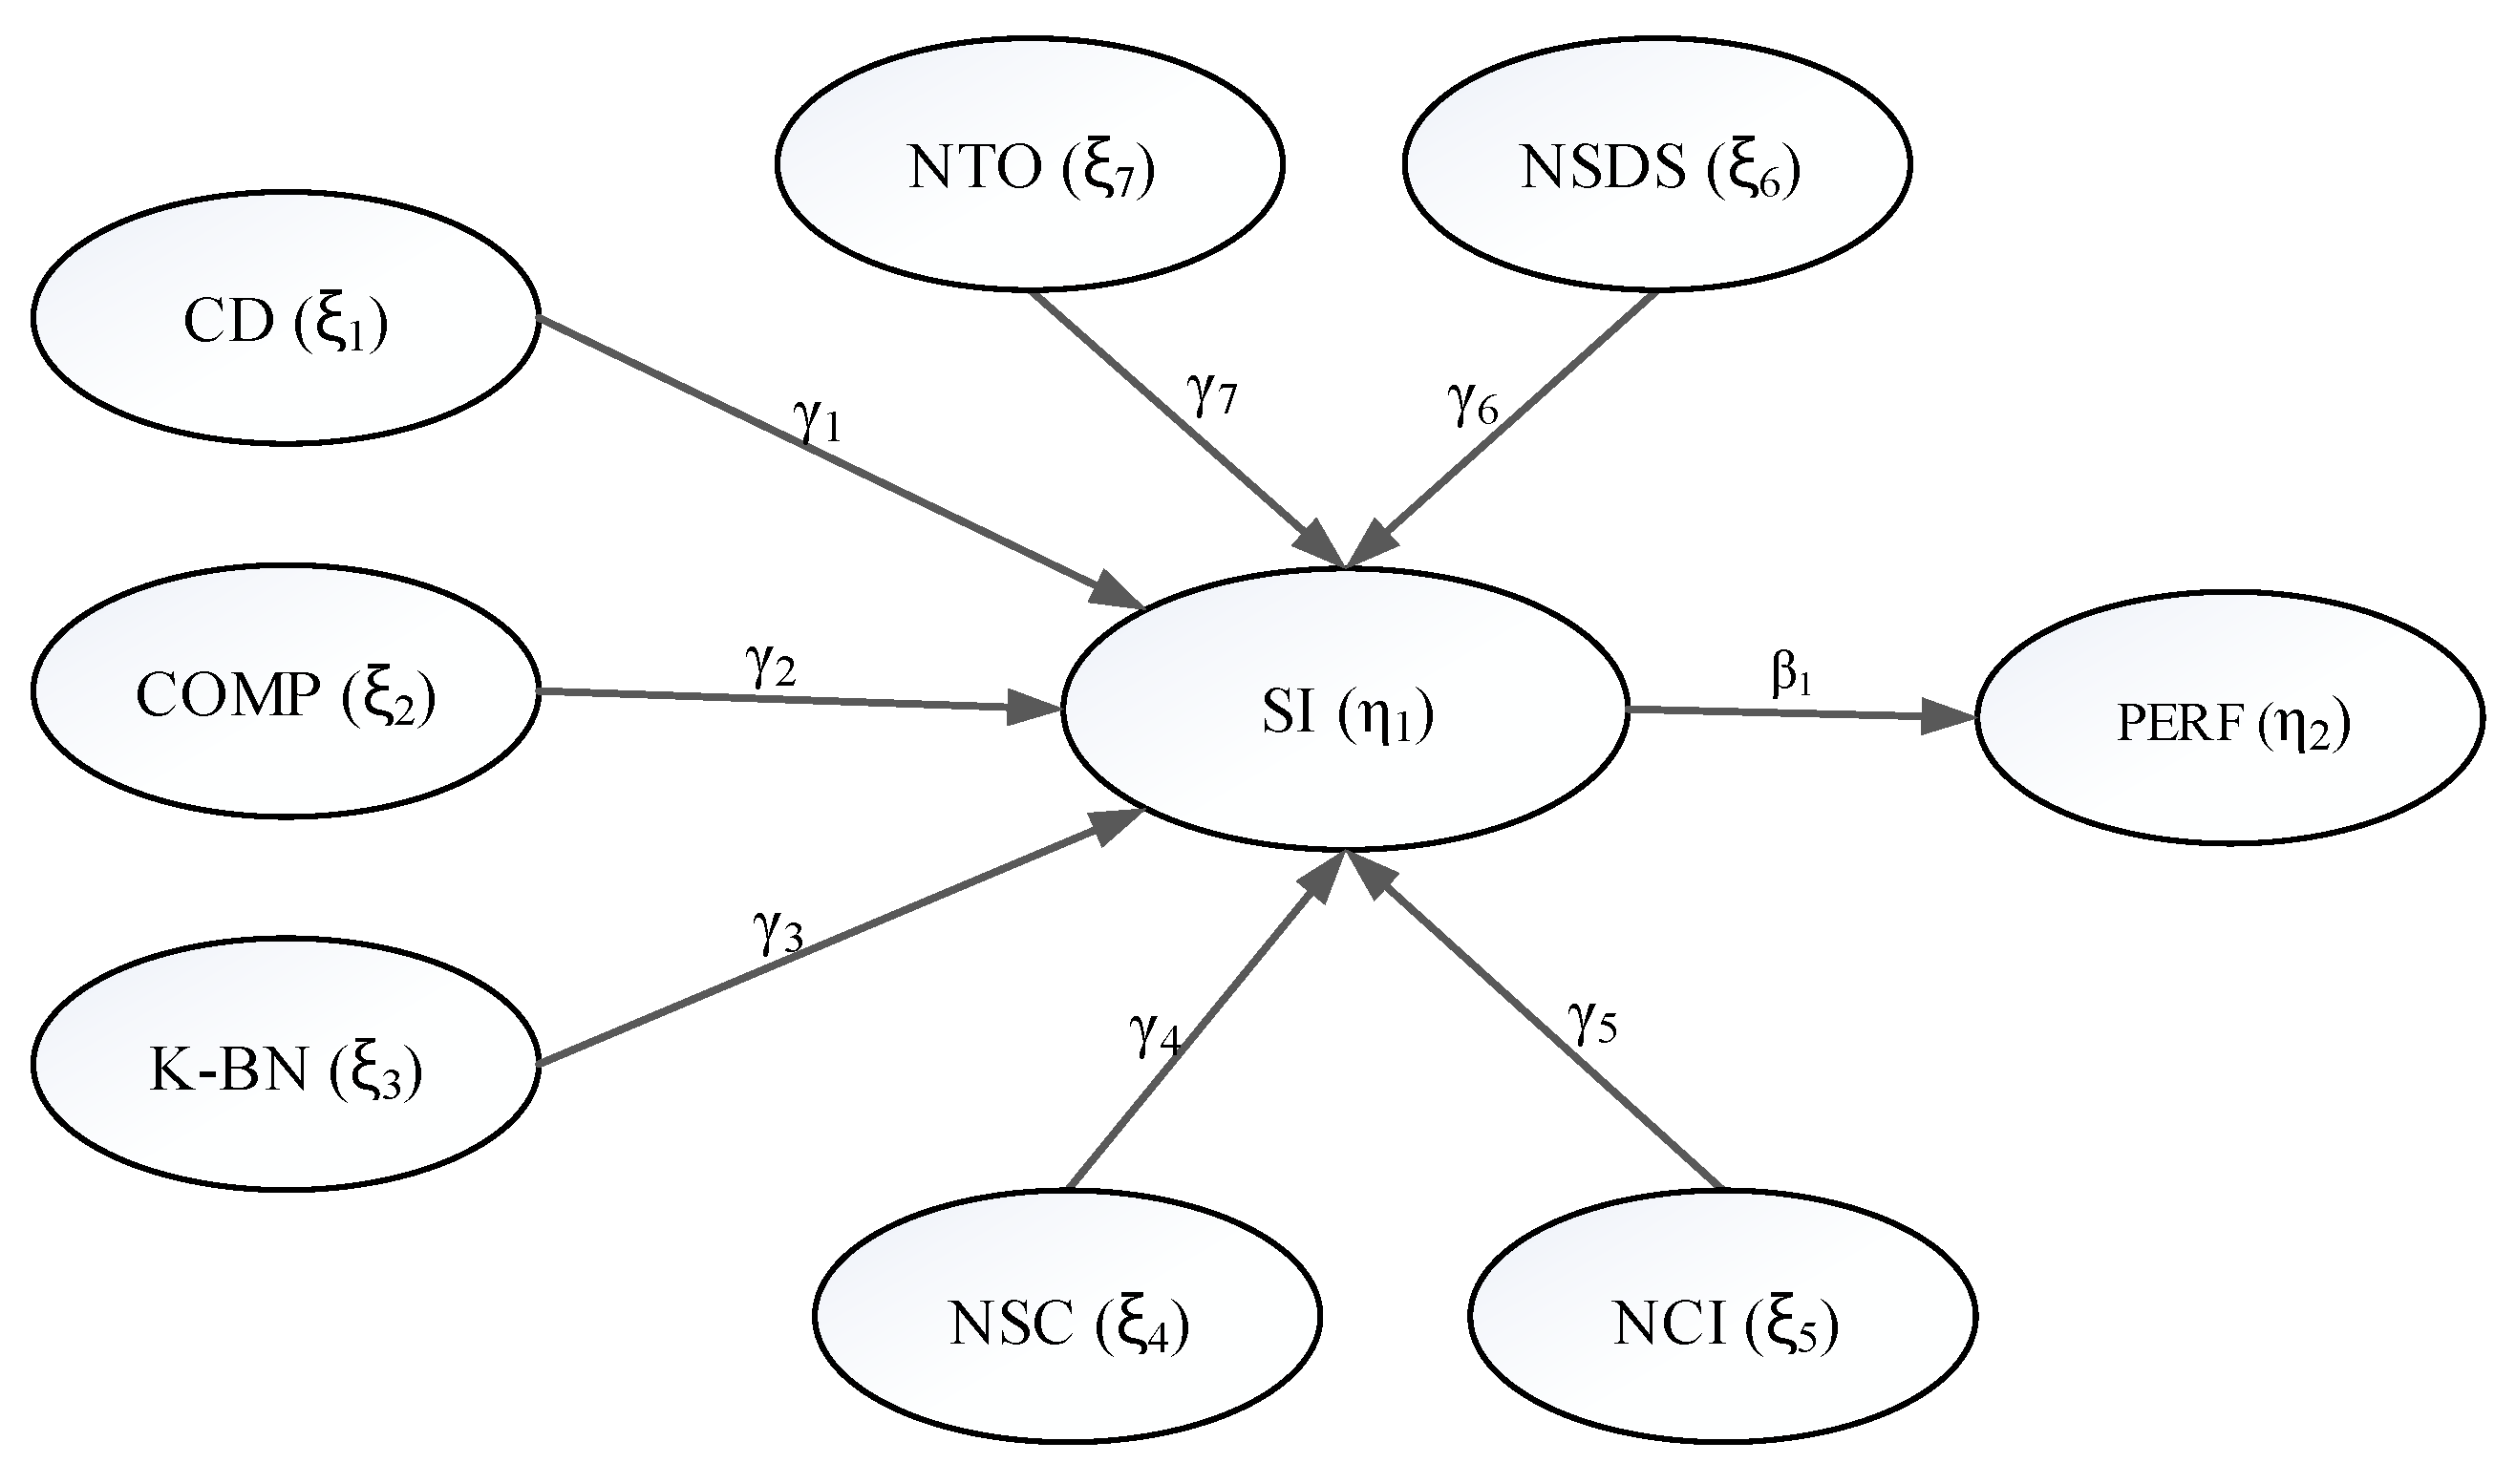
2.1.1. Conceptual Model

Model development comes from a combination of service innovation models developed by den Hertog [9] and Takur and Hale [14] for the conceptual model. Furthermore, the service quality model developed by Farid and Wiratmadja [22] to adopt manifest variables according to the characteristics of the automobile service industry is used.
Hertog [9] developed a dimensional model of service innovation, i.e., a new service concept, new client interface, new service delivery system, and new technological options. Thakur and Hale [14] offer a model using the structure-conduct-paradigm (S-C-P) pattern: further, they construct a service innovation model using the following dimensions: 1) enablers, variables: customer demand, competition, and knowledge-based network; 2) barriers, variables: economic factors, internal factors, and external factors; and 3) performance, variables: nonfinancial outcome and financial outcome.
In this study, we used all of the variables from Hertog’s model [9]. Then, we used many variables from Thakur and Hale’s model [14], e.g., customer demand, competition, knowledge-based network, and performance, by adjusting the relevance of the study needs.

2.1.2. Hypotheses

Changes in customer demand have responded to innovations in service [23]. If compared between manufactured goods, service mostly involves more contact points or variant customer experiences. Therefore, innovations of market-creating are required via managing customer contacts; furthermore, experiences are also considered relevant to some degree [24]. The need to develop new services to meet customer demands, responsively and on time, is a concern of competing for service firms. Innovation is the essence of market pull theory. Furthermore, society requires a specific part of the market to become a stimulus for the presence of innovation. In reality, one listens to customer demands by predicting and developing innovative value-added services that encourage the marketplace to contribute to a company’s success [14].
Hypothesis 1.
Customer demand has a related effect on service innovation.
The industry will survive in the global competition era via innovation and improvement ability as a requirement of competitiveness. Furthermore, through challenges and pressure, an industry typically benefits against the best competitors [25,26]. The intensity of competition in the service industry is increased through the globalization of the market economy [14].
Hypothesis 2.
Competition is positively related to service innovation.
The knowledge-based network is defined as creating, acquiring, managing, and exchanging information within/between departments and the exchange facilities knowledge development [14]. Through establishing a system, the firm utilized professional knowledge and skills in the maintenance and repair of vehicles. The knowledge flow was considered capable to distinguish among the resources and services required [27].
Hypothesis 3.
The knowledge-based network is positively related to service innovation.
Opportunities to improve the efficiency and quality of the service delivery process, as well as facilitating the introduction of new service concepts, are provided by innovation [28]. The new service concept is related with how to organize a solution to a problem or customer demands. The application of the service concept in a market is dependent on service conditions and markets. There is a service concept that is familiar in a market but has not been used in other markets. The most important thing is that a new service concept is applied to a particular market [9].
Hypothesis 4.
New service concepts have a positive effect on service innovation.
Interface design between the service provider and its clients is the new client interfaces. A good deal of service innovation must focus on these interfaces [9]. Firms typically consider a client-specific means in offering and marketing services. The desires, characteristics, and potential of the customers become a company’s material for making adjustments in the client interface [28].
Hypothesis 5.
The new client interface has a positive effect on service innovation.
Dimensions of service delivery concern the preparations of an internal organization that has to be organized so that workers can work well, then offer and develop service innovations, in addition to designing inputs, financial transactions, and after-sales service [9]. Hence, it could be defined as the internal work arrangements and processes in the service industry [28].
Hypothesis 6.
The new service delivery system has a positive effect on service innovation.
Technology facilitates innovation in a service firm. Thus, a great many opportunities for improving service innovation are derived through the new technology [29]. In terms of technology utilization, service firms have differences in their application according to their needs, i.e., the options to arrange the required technology or ability to acquire the connection to the necessary knowledge and the extent to which they can act as customers who demand and articulate their technological requirements [9].
Hypothesis 7.
New technological has a positive effect on service innovation.
Assessment of firm performance on aspects such as employee satisfaction, customer satisfaction, and a company’s operational activities that focus more on alternatives is used to carry out an integrated assessment [30]. Thakur and Hale [14] divide performance between financial and non-financial outcomes. The financial outcome includes company profitability, sales, and market share. Non-financial outcomes include new customers, perceived image, loyalty, and competitive position.
Hypothesis 8.
Service innovation will have a significant positive effect on firm performance.
The hypothesis model, i.e., the SEM model, is shown in Figure 2. Customer demand, competition, knowledge-based networks, new service concepts, new client interfaces, new service delivery systems, new technological options, service innovations, and performance are all latent variables.

2.2. Model Identification

The process of checking whether the model parameters can be derived from an observable set of variance and covariance as part of model identification. A necessary condition is the use of a possibly over-identified model where the degree of freedom is greater than zero (d.f. > 0). The degree of freedom is calculated by subtracting the number of a parameters from the number of variances and covariances in the model [21].

2.3. Data Collection

2.3.1. Questionnaire Design

The structured questionnaire is aimed to capture a general picture of service innovation implementation of an authorized automobile service center. The questionnaire consists of two parts: demographic information and the implementation of service innovation. The first parts ask for basic information from respondents, including brand, a name of the company, the establishment of the company, number of employees, working experience, position, and length of time in the position. The second parts examine the relevant knowledge about the implementation of service innovation, e.g., customer demand, competition, knowledge-based network, new service concept, new client interface, new service delivery system, and new technologies. Furthermore, we measure the service innovation effect on performance. Every latent variable measured by many manifest variables is based on the conceptual model referred to in [9,14,22]. Within this section, respondents rated their interpretation by a five-point Likert scale [31], as shown in Table 1, ranging from 1, referring to no involvement, to 5, very high involvement. The specific items in the second section are shown in Table A1. The instrument was pre-tested with five participants involved with their firm’s service division. The five pilot test respondents filled out the questionnaire. After establishing face and content validities, pre-testing of the instrument was conducted.

2.3.2. Data Collection

The data collection was conducted by staff who were involved in the automobile service industry. This sample group was selected from a list of the authorized service center in Kaohsiung, Taiwan from July–August 2018. The participants were persons who have a responsibility in this company, including the manager, assistant manager, service advisor, technician, customer service, front desk/receptionist, claims commissioner, cashier, and sales consultant.

2.4. Parameter Estimation

The aim of this step is to assess the value of the unidentified parameters, such as the standardized path coefficient, in such a way that the predicted moment matrix adjustment to the observed variance-covariance matrix is optimally [21].

Estimation Approach

The structural model and the measurement model are parts of The SEM is shown in Figure 3, in which the former reflects the relationship between the manifest variables and the latent variables, while the latter reflects the structural relation between latent variables, which is usually composed of three matrix equations [17,18,19], as follows:
The measurement model for endogenous manifest variable x
x = Λx ξ + γ
The measurement model for endogenous manifest variable y
y = Λy η + ε
Structural equation model:
η = βη + Γξ + ζ

2.5. Testing Model Fit

This step is to assess whether or not the model fits the data via a statistical process by using a goodness-of-fit (GOF) test. The model fit is determined by comparing the covariance in the experimental data with the predictable ones [18]. Measurement model validity depends on the GOF for the measurement model and specific evidence of construct validity. There are some basic elements in calculating GOF measures, such as a chi-square (x2), Comparative Fit Index (CFI), root mean square error of approximation (RMSEA), and Tucker-Lewis Index (TLI) [18].

2.6. Modification of Model

If, by the goodness of fit tests in the previous stage, the obtained result did not meet the requirement, due to the complexity and number of constraints that exist, the model is usually rejected. Furthermore, improving the fit, or its simplicity, needed modification of the model [18].

3. Result

3.1. Sample Description

A total of 79 firms were visited, and only 61 firms were willing to give a chance to collect data. We always ask a company to provide at least two respondents in each company. However, 70.49% of firms only provide one respondent, 26.23% provided two respondents, and 3.28% offered 3–6 respondents. Eighty-seven respondents participated in answering the questionnaire; there were two respondents who were invalid in completing the questionnaire. Table 2 shows demographic information of respondents and firms.

3.2. Data Validation

In this part, the proposed model will be verified and validated. The testified would be further used in model estimation. Item analysis is adopted to validate the effectiveness of each observation item. The unjustified item should modify the expression or be excluded from the scale to guarantee the persuasiveness of the conclusion [18].
By using Microsoft Excel version 2016 (Microsoft Corp., Xinyi, Taipei), to measure the validity of question items. The method of item-scale correlations is adopted to process the item analyses among 42 items, as shown in Table 3. The result of item-scale correlations is between 0.333 and 0.687, which is in line with the requirement of being above 0.3 [32], hence representing that the measurement instrument validation is good.
Testing the consistency and stability of the instrument in measuring latent variables is a requirement of the research. Reliability test indicators commonly use Cronbach’s α and, for verification purposes, the value of α greater than 0.7 is acceptable [18]. However, values greater than 0.8 are considered to be better [19]. This measurement uses the R language with ‘semTools’ [33] and ‘lavaan’ packages [34]. Cronbach’s α coefficient of the latent variables is between 0.710 and 0.957, as shown in Table 4, which is in line with the requirement of being greater than 0.7, thus indicating that the reliability of the measurement model is good.

3.3. Testing Model Fit

In this study, we use the R language with ‘semTools’ and ‘lavaan’ packages to estimate Equations (1)–(3), based on the standardized data [33,34,35]. The SEM of service innovation for automobile industry acceptance is shown in Figure 3. This paper assesses the goodness-of-fit (GOF), indicating how well the specified model reproduces the covariance matrix among the indicator items [19]. The output of ‘lavaan’ produced the GOF of the model using p-values (chi-square), the comparative fit index (CFI), Tucker-Lewis Index (TLI), and the root mean square error of approximation (RMSEA).
Table 5 shows that the p-value (chi-square) is 0.00; typically, smaller p-values (less than 0.05) are desired in order to show that a relationship exists. The value of CFI = 0.755 and TLI = 0.738, with a recommended standard of ≥0.90. The value of RMSEA = 0.101 with a recommended standard of ≤0.08. It did not meet the compatibility criteria of a good model. In the development of a model, if the testing model fit has not produced a fit model, it was possible to modify the model while still using the same data [18]. Therefore, the next step is to modify the model.

3.4. Model Modification

3.4.1. The First Modification

Based on the results of Table 5, we identify possible reciprocal influences between latent variables. Furthermore, we modified the model by adding two-way regression between latent variables, e.g., new service concept, new client interface, new service delivery system, and new technological options with service innovation. Hence, the four latent variables are also influenced by service innovation [9]. Table 6 shown the result are obtained p-value (chi-square) = 0.00, CFI = 0.877, TLI = 0.864, and RMSEA = 0.087. This indicates that a change in the results is close to the good suitability requirements of the model.

3.4.2. The Second Modification

The result of the first modification above shows that the scores of CFI, TLI, and RMSEA need to improve in order to meet the standard score. We modify again by considering adding a relationship with the other latent variables, such as customer demand and knowledge-based network, which were previously conducted in the first modification for other latent variables. Table 7 shows the results, wherein the CFI score declined from 0.877 to 0.806 and the TLI score declined from 0.864 to 0.808. However, the RMSEA score increased from 0.087 to 0.099.
In the results of the comparison between the first and the second modification models, the first modification model fared better in CFI and TLI scores. However, the RMSEA score of the second is higher than the first. Therefore, the first modification model is the final model for this study.

3.5. Path Analysis and Hypotheses Testing

After performing the path analysis, the standardized regression weights among latent variables and their corresponding observed variables can be obtained, as shown in Table 8 below.
The results show p-values <0.05 of all correlations among latent variables seen in Table 6. Furthermore, z-values >1.96 of correlations are shown among latent variables. Thus, the path among latent variables and their corresponding observed variables all achieve significant levels (Table 9).

4. Discussion

The company dominated at 34.43% for 21–50 years and for 11–20 years at 27.87%, and only around 6.56%, <5 years. A company’s age factor in serving consumers will contribute in the form of experience and potential in developing service quality and innovation. This indicates that length contributes to a company in implementing service innovation.
The respondents come from 10 different job positions, with the two most participating positions being a service advisor (20%) and manager (19%). This shows that all employees with different job positions have contributed to the questionnaire and represent views on the implementation of service innovation in the automobile service industry.
The company’s ability to respond to customer demand on a regular basis increases service quality that already exists [22] and offering newer service will contribute to improving service innovation [14]. Furthermore, the competition that occurs both globally and locally will have an impact on a company: thus, its ability to adapt is important. This then becomes information for existing departments to further synergize among departments by considering input from stakeholders to produce a formulation for service innovation ideas.
The formulation of ideas typically develops into new innovations in more detail by referring to new things via outlining conceptual approaches, client interface, delivery system, and technology [10]. New concept offerings make it easier for customers to access information through a call center and Internet services. Periodically, customer service will contact consumers about schedules of maintenance or repair. Emergency services must also become a priority. Booking services reduce customer queues at the service center and make the customers more efficient. However, the company is still not paying enough attention to provide home/mobile services.
Model testing is done through several stages, such as testing model fit and modification modeling. The testing model fit has a value of CFI = 0.755 and TLI = 0.738, with a recommended standard ≥0.90. The value of RMSEA = 0.101 with a recommended standard ≤0.08. It did not meet the compatibility criteria of a good model. Furthermore, we modified the model by adding two-way regression for latent variables, e.g., new service concept, new client interface, new service delivery system, and new technological options with service innovation. Hence, the four latent variables are also influenced by service innovation [9]. The result obtained show CFI = 0.877, TLI = 0.864, and RMSEA = 0.087. This indicates that a change in results is close to the good suitability requirements of the model.
Finally, we tried the second modification by considering adding a relationship with the other latent variables, such as customer demand and knowledge-based network, which were previously conducted in the first modification for other latent variables. The result of the CFI score declined from 0.877 to 0.806, and the TLI score declined from 0.864 to 0.808. However, the RMSEA score increased from 0.087 to 0.099. In the result of a comparison between the first and the second modification model, the first modification model fared better in CFI and TLI scores, which are higher than those of the second. However, the RMSEA score of the second is higher than the first. Therefore, the first modification model is the final model for this study.
Implementation of service innovation in the automobile service industry improves existing customer loyalty, has a positive impact on companies perceived, enhances the profitability of other products, and attracts a significant number of new customers. Finally, service innovation has a positive impact on a firm’s performance, including market share achievement, sales objectives, and profitability.

5. Conclusions

Previous studies about the service innovation model are generally used to measure samples for many industries. Thus, we have not measured the characteristics of each different industry. By considering this, we develop a model of service innovation in the automobile industry by adopting basic models that are relevant to the needs of the automotive industry. Furthermore, we adjust to industry characteristics by using references to automobile service quality research.
The SEM of service innovation for automobile service industry acceptance is established and justified to illustrate the influence of customer demand, competition, knowledge-based network, new service concept, new client interface, new service delivery system, and new technological options, all of which have positive effects on service innovation. Furthermore, service innovation has a positive effect on a firm’s performance.
The limitations of this study are as follows: First, SEM requires a large number of samples. However, this study was only carried out in the city of Kaohsiung, Taiwan. Thus, the amount was adjusted to the number of authorized automobile service centers. Second, the level of participation of each firm involved more employees from every division. Thus, simply obtaining a representative respondent is inadequate. Third, the development of manifest variables especially to measure two latent variables, such as service innovation and performance, is required. In order to represent those variables, a study of relevant references and a discussion with stakeholders is necessary. Fourth, the value of CFI = 0.877 with a standard >0.90, indicates the model is close to the standard value. However, an improvement is required by considering the third factor mentioned above.

Author Contributions

Conceptualization: J.-D.D. and M.F.; methodology: C.-N.W., J.-D.D., and M.F.; validation: J.-D.D. and M.F.; formal analysis: C.-N.W. and J.-D.D.; data curation: J.-D.D. and M.F.; writing—original draft preparation: M.F.; writing—review and editing: C.-N.W. and J.-D.D.; visualization: J.-D.D. and M.F.; supervision: C.-N.W. and J.-D.D.

Funding

This research was funded by The Ministry of Research, Technology and Higher Education of the Republic of Indonesia.

Conflicts of Interest

The authors declare no conflict of interest.

Appendix A

Table A1. Items in the seven subscales of the service innovation model.
Latent VariablesItem NumberObservation ItemReferences
Customer Demand (CD)3
  • Customer demand for newer service
  • Customer demand for services of superior value
  • Customer demand for improved service quality
[14]
Competition (C)6
  • Globalization of the market economy
  • Intensified Competition
  • The threat of foreign competition
  • Low barriers to entry
  • Service competition among the authorized company of the brand (same brand)
  • Service competition between the brand car (other brands)
[14,22]
Knowledge-based Network (K-BN)4
  • Acquisition of knowledge through collaboration
  • Using their ability in creating, acquiring and managing knowledge
  • Stimulating information exchange between departments
  • Stimulating information exchange with partners or suppliers
[14]
New Service Concept (NSC)6
  • Call center service
  • Application service provider, data service company (workshop) virtual in internet
  • Integrated service information about regular maintenance and repair
  • Provide home/mobile service for a customer, if they did not have time go to the service center
  • Provide emergency service for a customer who suffered car damage on the road
  • Provide a booking service to reduce the queue when the customer comes to office
[9]
New Client Interface (NCI)5
  • Electronic Data Interchange (EDI), which represents an effort to establish common formats for electronic documents that allow for a wide range of interactions to be partially automated – including various elements of design as well as ordering and invoicing.
  • Remind consumers of schedules for regular maintenance or repair car by phone/SMS/email
  • Application to remind of maintenance or repair car time
  • Home/mobile service
  • Emergency service
[9]
New Service Delivery System (NSDS)5
  • The large-scale introduction of home services – or consumer e-commerce – may cause a substantial change in the ways in which service provider and client related
  • Introducing e-commerce in business processes may require serious business process reengineering
  • Customer meeting forum, to know demand and suggestion from a customer
  • Advanced competence and knowledge management systems and more flexible employability based labor conditions.
  • Opening hours for a customer in a weekend (Saturday and Sunday)
[9,22]
New Technological (NTO)4
  • Tracing and monitoring systems that enable service providers to monitor the progress of the fleet of home/emergency to serve a customer.
  • New ICT systems allow for optimization service and development of personalized E-service applications
  • The authorized Branch service program
  • The use of measuring tools adapts new car technologies to improve service to consumers.
[9,14,22]
Service Innovation (SI)4
  • The new service improved the loyalty of the company’s existing customers
  • The new service had a positive impact on the company’s perceived
  • The new service enhanced the profitability of other products
  • The new service attracted a significant number of new customers to the company
[14]
Performance (Perf)5
  • The new service exceeded its market share objectives
  • The new service exceeded its sales objectives
  • The profitability of new service exceeded its objectives
  • The new service was profitable
  • Total sales of new service were high
[14]

References

  1. Kindström, D.; Kowalkowski, C. Service innovation in product-centric firms: A multidimensional business model perspective. J. Bus. Ind. Mark. 2014, 29, 96–111. [Google Scholar] [CrossRef]
  2. Fraser, K.; Watanabe, C.; Hvolby, H.-H. Commitment to service quality in automotive dealerships: Results from an Australian pilot study. J. Serv. Res. 2013, 13, 7–29. [Google Scholar]
  3. OECD. The Contribution of Services to Development and the Role of Trade Liberalization and Regulation. OECD Global Forum VII on International Investment. 2008. Available online: http://www.oecd.org/investment/globalforum/40302909.pdf (accessed on 26 November 2018).
  4. Statistica, Taiwan: Distribution of Gross Domestic Product (GDP) Across Economic Sectors Taiwan. 2019. Available online: https://www.statista.com/statistics/706367/taiwan-distribution-gdp-across-economic-sectors/ (accessed on 8 January 2019).
  5. Fraser, K.; Tseng, B.; Hvolby, H.-H. TQM in new car dealerships: A study from the firms’ perspective. TQM J. 2013, 25, 5–17. [Google Scholar] [CrossRef]
  6. Vaz, C.R.; Rauen, T.R.S.; Lezana, A.G.R. Sustainability and innovation in the automotive sector: A structured content analysis. Sustainability 2017, 9, 880. [Google Scholar]
  7. OICA. 2015–2017 Sales Statistics. 2018. Available online: http://www.oica.net/category/sales-statistics/ (accessed on 5 November 2018).
  8. Power, J.D. Taiwan Customer Satisfaction Index. 2018. Available online: https://www.jdpower.com/business/press-releases/jd-power-2018-taiwan-customer-satisfaction-index-csi-study (accessed on 27 November 2018).
  9. Den Hertog, P. Knowledge-intensive business services as co-producers of innovation. Int. J. Innov. Manag. 2000, 4, 491–528. [Google Scholar] [CrossRef]
  10. Den Hertog, P.; van der Aa, W.; de Jong, M. Capabilities for managing service innovation: Towards a conceptual framework. J. Serv. Manag. 2010, 21, 490–514. [Google Scholar] [CrossRef]
  11. Chen, J.S.; Tsou, H.T.; Ching, R.K.H. Co-production and its effects on service innovation. Ind. Mark. Manag. 2011, 40, 1331–1346. [Google Scholar] [CrossRef]
  12. Lin, R.; Chen, C.L. Constructing Service Innovation Model for a Cultural and Creative Industries—A Case study of NTUA Cultural and Creative Industry Park. In Proceedings of the International Conference on Information Management, Innovation Management and Industrial Engineering, Shenzhen, China, 26–27 November 2011; pp. 365–368. [Google Scholar]
  13. Baregheh, A.; Rowley, J.; Sambrook, S. Innovation in food sector SMEs. J. Small Bus. Enter. Dev. 2012, 19, 300–321. [Google Scholar] [CrossRef]
  14. Thakur, R.; Hale, D. Service innovation: A comparative study of U.S. and Indian service firms. J. Bus. Res. 2013, 66, 1108–1123. [Google Scholar] [CrossRef]
  15. Lay, H.T.; Boon, C.C.; Syaiful, R.H. Service innovation in Malaysian banking industry towards sustainable competitive advantage through environmentally and socially practices. Procedia Soc. Behav. Sci. 2015, 224, 52–59. [Google Scholar]
  16. Farid, M.; Day, J.-D. Constructing Service Innovation Model for SMEs in Automotive Service Industries: A Case Study of Auto Repair Motorcycle in Makassar City. In Proceedings of the ICIMIE, Kyoto, Japan, 10–11 November 2016; pp. 812–816. [Google Scholar]
  17. Zhang, K.; Guo, H.; Yao, G.; Li, C.; Zhang, Y.; Wang, W. Modeling Acceptance of Electric Vehicle Sharing Based on Theory of Planned Behavior. Sustainability 2018, 10, 4686. [Google Scholar] [CrossRef]
  18. Hair, J.F.; Black, B.; Babin, B.J. Multivariate Data Analysis, 7th ed.; Englewood Cliffs: Prentice Hall, NJ, USA, 2011. [Google Scholar]
  19. Li, W.; Wei, X.; Zhu, R.; Guo, K. Study on Factors Affecting the Agricultural Mechanization Level in China Based on Structural Equation Modeling. Sustainability 2018, 11, 51. [Google Scholar] [CrossRef]
  20. Bollen, K.A.; Long, J.S. Testing Structural Equations Model; Sage: Thousand Oaks, CA, USA, 1993. [Google Scholar]
  21. Iriondo, J.M.; Albert, M.J.; Escudera, A. Structural Equation Model: An Alternative for Assessing Causal relationships in Threatened Plant Populations. Biol. Conserv. 2003, 113, 367–377. [Google Scholar] [CrossRef]
  22. Farid, M.; Wiratmadja, I.I. Development Model of Service Quality in Automotive Service Industry. In Proceedings of the Seminar Nasional Teknik Industri & Kongres BKSTI, Medan, Indonesia, 10–11 October 2011. IIA-148-156 (In Indonesian). [Google Scholar]
  23. Ettlie, J.E.; Rosenthal, S.R. Service versus manufacturing innovation. J. Prod. Innov. Manag. 2011, 28, 285–299. [Google Scholar] [CrossRef]
  24. Berry, L.L.; Shankar, V.; Paris, J.T.; Cadwallader, S.; Dotzel, T. Creating New Markets through service innovation. MIT Sloan Manag. Rev. 2006, 47, 56–63. [Google Scholar]
  25. Porter, M.E. The Competitive Advantage of Nations. Harvard Business Review, March–April 1990. [Google Scholar]
  26. Day, J.-D.; Farid, M. Stepwise Strategies for Taiwan’s Semiconductor Industry as Core Technology. In Proceedings of the International Conference on Business, Economics, Socio-Culture & Tourism, Semarang, Indonesia, 24 August 2016; pp. 1–8. [Google Scholar]
  27. Shang, S.S.C.; Lin, S.-F.; Wu, Y.-L. Service innovation through dynamic knowledge management. Ind. Manag. Data Syst. 2009, 109, 322–337. [Google Scholar] [CrossRef]
  28. De Jong, J.P.J.; Bruins, A.; Dolfsma, W.; Meijaard, J. Innovation in Service Firms Explored: What, How and Why? EIM Businees & Policy Research: Amsterdam, The Netherlands, 2003. [Google Scholar]
  29. Aa, D.W.V.; Elfring, T. Realizing innovation in services. Scand. J. Manag. 2002, 18, 155–171. [Google Scholar]
  30. Farid, M. Performance evaluation of automotive service industry through balanced scorecard strategy. Realizing innovation in services. Arika 2010, 4, 167–174. (In Indonesian) [Google Scholar]
  31. Diaz-Reza, J.R.; Garcia-Alcaraz, J.L.; Avelar-Sosa, L.; Mendoza-Fong, J.R.; Diez-Muro, J.C.S.; Blanco-Fernandez, J. The Role of Managerial Commitment and TPM Implementation Strategies in Productivity Benefits. Appl. Sci. 2018, 8, 1153. [Google Scholar] [CrossRef]
  32. Field, A. Discovering Statistics Using SPSS, 3rd ed.; SAGE: London, UK, 2009. [Google Scholar]
  33. Jorgensen, T.D.; Pornprasertmanit, S.; Schoemann, A.; Rosseel, Y. semTools: Useful Tools for Structural Equation Modeling. R package version 0.5-1. 2018. Available online: https://CRAN.R-project.org/package=semTools (accessed on 11 December 2018).
  34. Rosseel, Y. lavaan: An R Package for Structural Equation Modeling. J. Statist. Softw. 2012, 48, 1–36. Available online: http://www.jstatsoft.org/v48/i02/ (accessed on 6 November 2018). [CrossRef]
  35. Rosseel, Y. The Lavaan Tutorial. 2018. Available online: http://lavaan.ugent.be/tutorial/tutorial.pdf (accessed on 6 November 2018).
Figure 1. Taiwan car sales.
Applsci 09 02403 g001
Figure 2. The hypothesis of the service innovation model for the automobile industry.
Applsci 09 02403 g002
Figure 3. Structural model of service innovation for the automobile industry.
Applsci 09 02403 g003
Table 1. Questionnaire scale.
Value12345
InterpretationNo
involvement
A little
involvement
Some
involvement
Quite a bit of
involvement
Very high
involvement
Table 2. Demographic information of respondents and firms.
Respondent’s ProfileNumberPercent (%)
Working Experience
<5 years5564.71
5–10 years1112.94
11–20 years89.41
21–30 years89.41
>30 years33.53
Position
Manager1922.35
Assistant Manager33.53
Service Advisor2023.53
Technician55.88
Customer Service33.53
Front desk/receptionist33.53
Claims Commissioner33.53
Administration Staff33.53
Cashier910.59
Sales Consultant1720.00
Time of responsible for the position
<6 months1315.29
6 months–1 year78.24
1–2 years910.59
2–4 years2731.76
>4 years2934.12
Firms establish
<5 years46.56
6–10 years1118.03
11–20 years1727.87
21–30 years914.75
>30 years2032.79
Number of employees
<534.92
6–101524.59
11–201727.87
21–502134.43
51–10046.56
>10011.64
Table 3. Summary statistics of the data set and validity test.
Latent
Variables
Manifest
Variables
MeanSDCorrected-Item
Total Correlation
CDX14.0600.8320.456
X24.3370.7030.519
X34.3490.7230.572
CX43.8071.0640.668
X54.1200.9800.687
X64.0000.9880.603
X73.3980.9620.494
X83.9640.9930.449
X94.1930.9030.570
KBNX104.0360.8330.592
X113.9880.8480.629
X123.8550.9640.648
X133.9760.9370.651
NSCX142.7711.1930.625
X153.1691.2180.630
X163.1931.1090.626
X172.9761.1150.673
X183.3371.1720.409
X193.4821.1080.454
NCIX203.1571.1100.504
X213.1331.2170.607
X222.8921.2170.576
X233.3861.1130.600
X244.0600.9670.565
NSDSX253.7711.0160.562
X264.1330.8380.461
X274.1450.9520.380
X284.3980.8690.457
X294.5660.7190.382
NTOX303.7711.0040.549
X314.2650.8710.368
X324.2890.8630.333
X333.8921.0170.571
SIY13.9160.9270.537
Y23.9640.8330.616
Y33.8430.8900.589
Y43.8920.8970.538
PERFY53.3980.9230.690
Y63.4581.0160.667
Y73.3490.9810.684
Y83.6391.0070.623
Y93..4580.9790.663
Table 4. The results of the reliability test.
Latent VariablesCronbach’s α
CD0.825
C0.823
K-BN0.911
NSC0.883
NCI0.895
NSDS0.839
NTO0.710
SI0.913
PERF0.957
Total0.945
Table 5. Goodness-of-fit indices of the model.
GOF IndexEvaluation StandardActual ValueResult
Chi-squareThe smaller the better0.000Good fit
CFI≥0.900.755Not fit
TLI≥0.900.738Not fit
RMSEA≤0.080.103Not fit
Table 6. Goodness-of-fit indices of the model modification.
GOF IndexEvaluation StandardActual ValueResult
Chi-squareThe smaller the better0.000Good fit
CFI≥0.900.877Not fit, but close
TLI≥0.900.864Not fit, but close
RMSEA≤0.080.087Good fit
Table 7. Comparison of goodness-of-fit indices in two model modification.
GOF IndexEvaluation Standard1st Modification2nd ModificationResult
Chi-squareThe smaller the better0.0000.000Same
CFI≥0.900.8770.826Declined
TLI≥0.900.8640.808Declined
RMSEA≤0.080.0870.099Increased
Table 8. The results of the regression analysis.
PathEstimateStd. Errorz-Valuep (>|Z|)
CD -> SI 0.2540.0872.9140.004
C -> SI0.5180.2184.0570.000
K-BN -> SI0.4200.1083.8830.000
NSC -> SI0.3660.1302.8110.005
NCI -> SI0.3170.1302.4450.014
NSDS -> SI0.4710.1114.2530.000
NTO -> SI0.1970.0812.4310.015
SI -> PERF0.6120.8096.8560.000
Table 9. Verification of the hypotheses.
PathDirectionResult
H1: CD->SI+Supported
H2: C->SI+Supported
H3: K-BN->SI+Supported
H4: NSC<->SI+Supported
H5: NCI<->SI+Supported
H6: NSDS<->SI+Supported
H7: NTO<->SI+Supported
H8: SI->PERF+Supported

