Article

Composite Films of Polydimethylsiloxane and Micro-Graphite with Tunable Optical Transmittance

Engineering Research Center of Optical Instruments and Systems, Ministry of Education and Shanghai Key Laboratory of Modern Optical Systems, University of Shanghai for Science and Technology, Shanghai 200093, China
*
Author to whom correspondence should be addressed.
Appl. Sci. 2019, 9(12), 2402; https://doi.org/10.3390/app9122402
Submission received: 24 May 2019 / Revised: 10 June 2019 / Accepted: 10 June 2019 / Published: 13 June 2019
(This article belongs to the Special Issue Synthesis, Characterization and Application of Hybrid Composites)

Abstract

:
In this paper we introduce a polydimethylsiloxane (PDMS) composite fabricated using a simple production process and demonstrate the optical transmittance properties of this composite in the 300–1000 nm wavelength region. We control the material’s transmittance by varying the microcrystalline graphite powder concentration or the composite film’s thickness. In addition, we tailor the specimens into various trapezoidal shapes and load these specimens by mechanically stretching them in the direction perpendicular to both their base lines and their top lines. The advantage of this method is that a wide range of transmittance properties can be obtained for a given specimen. Furthermore, samples with different trapezoidal shapes have different transmittance tuning capabilities.

1. Introduction

Composite optical materials are designed to have enhanced optical properties that are superior to those of their individual component materials [1,2,3]. At present, composites are used in a wide range of applications, including strain sensors, electronic displays, optical attenuators and smart windows [4,5,6,7,8,9,10]. Composites, which use carbon materials in high-performance applications, have been widely used owing to their strengthening effect, high stiffening and feasible preparation, such as graphene oxide-silica nanohybrid [11,12,13,14,15,16], graphene/polydimethylsiloxane [17,18] and polylactic acid (PLA) as a host polymer and different forms of carbon fillers [19,20]. Considerable progress has already been made in these fields. Composites have also been designed to have tunable transparency under specific electrical, magnetic, optical, thermal and chemical driving conditions but most industrially available devices of this type are costly and bulky [21]. There is thus a need for novel mechanisms to allow tunable composites to be realized.
Recently, many researchers have reported on their efforts to develop devices based on lightweight elastomers [22] such as polydimethylsiloxane (PDMS). PDMS is a macromolecule compound that is widely used in numerous fields because of its superb characteristics, which include good elasticity, optical properties, breathability, insulation properties and stability, along with a low glass transition temperature. PDMS-based devices thus have obvious advantages and increasing numbers of researchers are fabricating and integrating optical components using this flexible material [23,24,25,26,27,28]. In particular, a number of researchers have been considering the use of PDMS composites. By controlling the dopants that are added to the PDMS, they can control many of the properties of the resulting composites, including optical, electrical and mechanical properties [29,30,31,32,33,34,35,36,37,38]. However, these composites must be fabricated with high precision using vacuum deposition or evaporation or even by implantation via aerodynamic acceleration. While these methods have advantages, the fabrication techniques can be both complex and costly.
In this work, we propose a PDMS composite that can be fabricated using a simple production process and that offers flexibly tunable optical transmittance. We fabricated thin films of PDMS mixed with microcrystalline graphite powder, which can alter the transparency of the samples. By varying the concentration of the microcrystalline graphite powder and the sample thickness, we were able to control the transmittance of the resulting composite film. In addition, we tailored samples of the composite into various trapezoidal shapes and stretched them to tune their optical transmittance.

2. Experimental Section

2.1. Materials

Our experimental samples were made from PDMS polymer SYLGARD 184 SILICONE ELASTOMER, Dow Corning, Midland, TX, USA) consisting of two parts, the base polymer and the corresponding curing agent. The microcrystalline graphite powder (MCGP-1000, Sinopharm Chemical Reagent Co. Ltd. Shanghai, China) was about 1 micron in diameter, with the characteristics of excellent lubrication, conductivity and resistance for acid and alkali.

2.2. Preparation Routes

First, we mixed the base polymer together with its corresponding curing agent and the microcrystalline graphite powder and churned the mixture for 20 min to ensure that all materials were completely mixed. Specifically, the mass ratio of the base polymer to the curing agent was 15:1 and the microcrystalline graphite powder had a size of 1–3 microns. We weighed the materials using an electronic analytical balance that was accurate to 0.1 mg. Then the mixture was placed into a vacuum chamber to remove the gross air bubbles. Subsequently, we poured the mixture onto a glass substrate (7 × 7 cm) and degassed it in a vacuum chamber for a second time until no bubbles were observed. The liquid mixture was then solidified in an oven at 100 °C for 90 min to obtain a uniform thickness ( h 0 ) of approximately 1 mm. By that stage, the composite film was completely solidified and could be separated from the substrate.

2.3. Characterizations

We used a spectrophotometer (Lambda 1050, PerkinElmer, Waltham, MA, USA), which is a two-beam scanning spectrophotometer with a double monochromator, to measure the samples’ transmittance. The spectrophotometer performs the measurement of optical characteristics such as optical density, reflection and transmission coefficients of liquid and solid materials, including light-scattering inorganic, organic and biological objects within the wavelength range of 175–3300 nm. Metallographic Microscopes (10XB-PC, Shanghai Optical Instrument Factory, Shanghai, China) were used to observe the dispersion of the microcrystalline graphite powder in the composite films.
Figure 1a shows a pure PDMS sample placed on a piece of paper that has colored fonts on it. It is obvious that the pure PDMS has high transmittance. Figure 1b shows a composite PDMS sample placed in the same position. Figure 1b shows that the transmittance decreased considerably when compared with that of the pure PDMS sample. We also observed the formation of the composite film under an optical microscope, as shown in Figure 1c. When the sample was cured, it appeared to take the form of a nearly isotropic colloidal composite composed of microcrystalline graphite powder embedded in the PDMS.

3. Results and Discussion

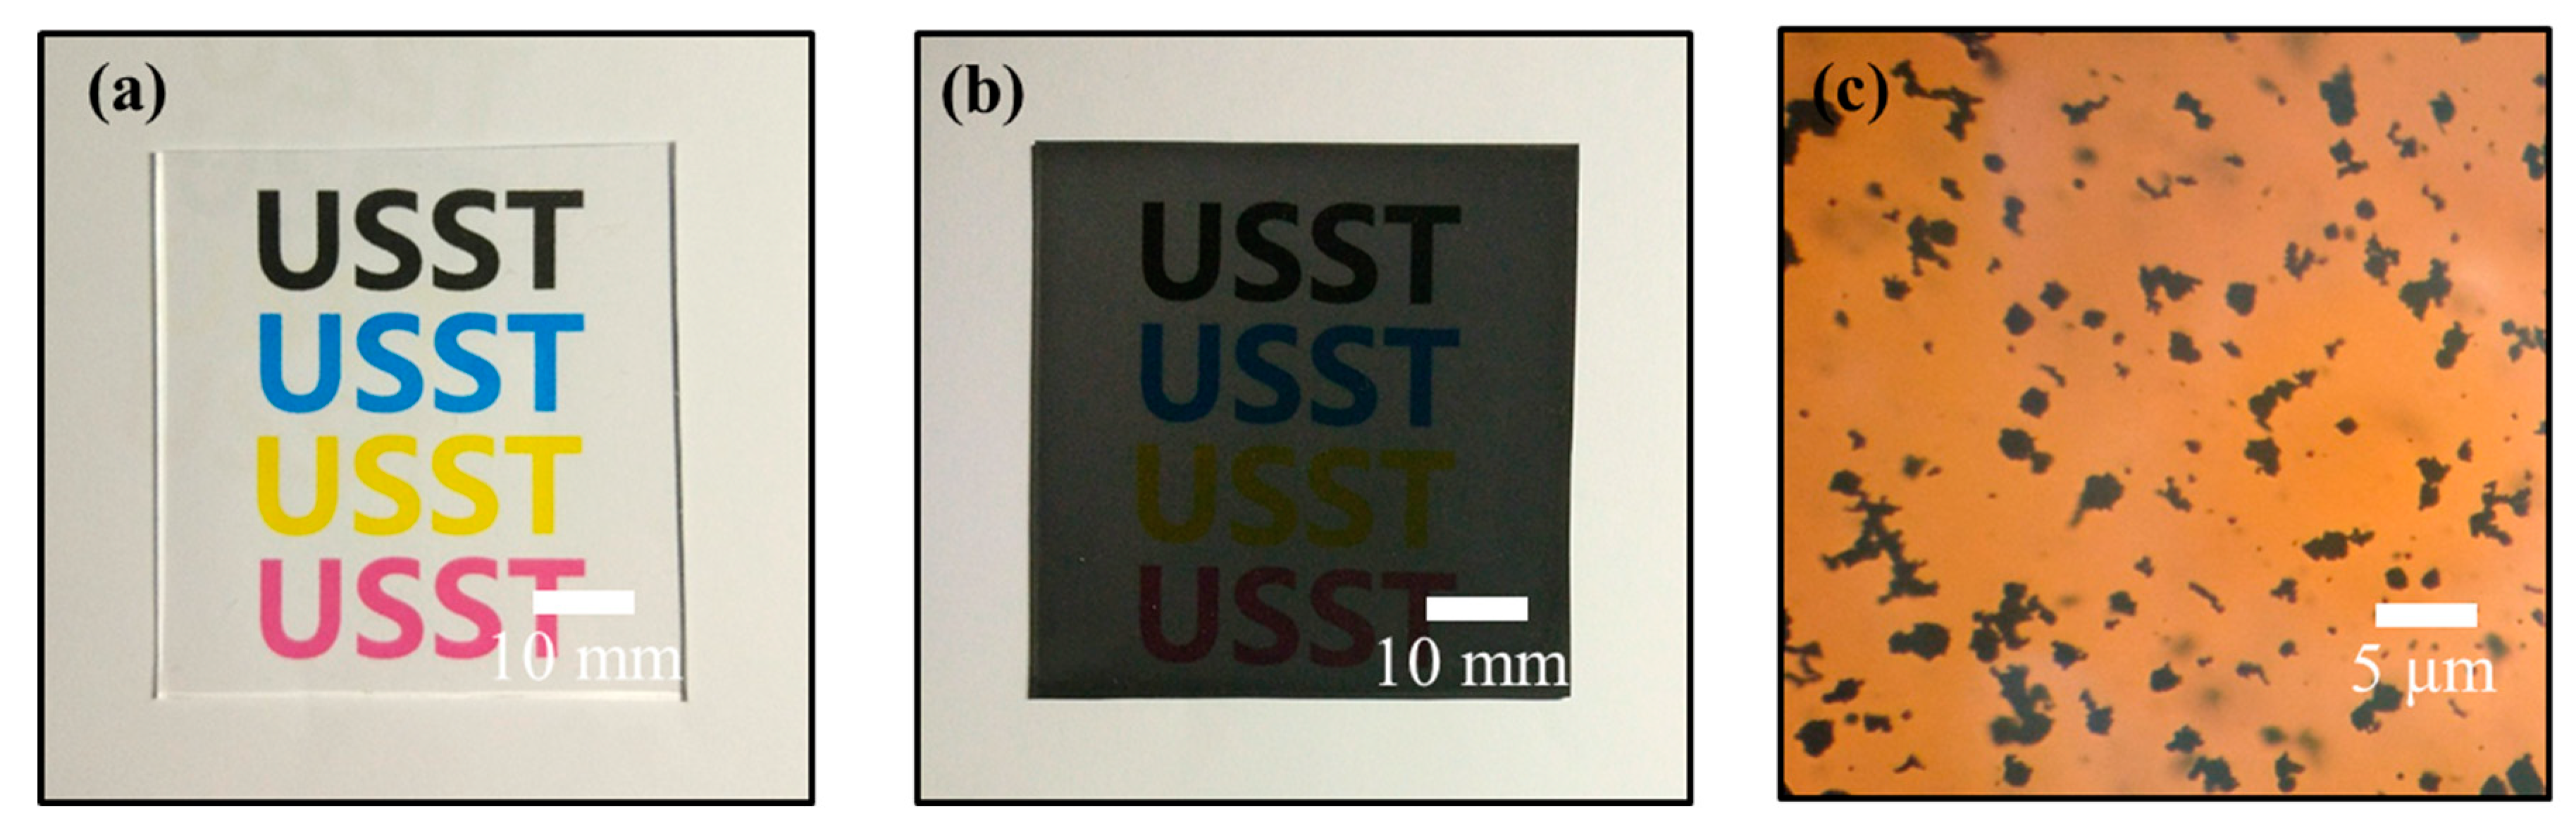
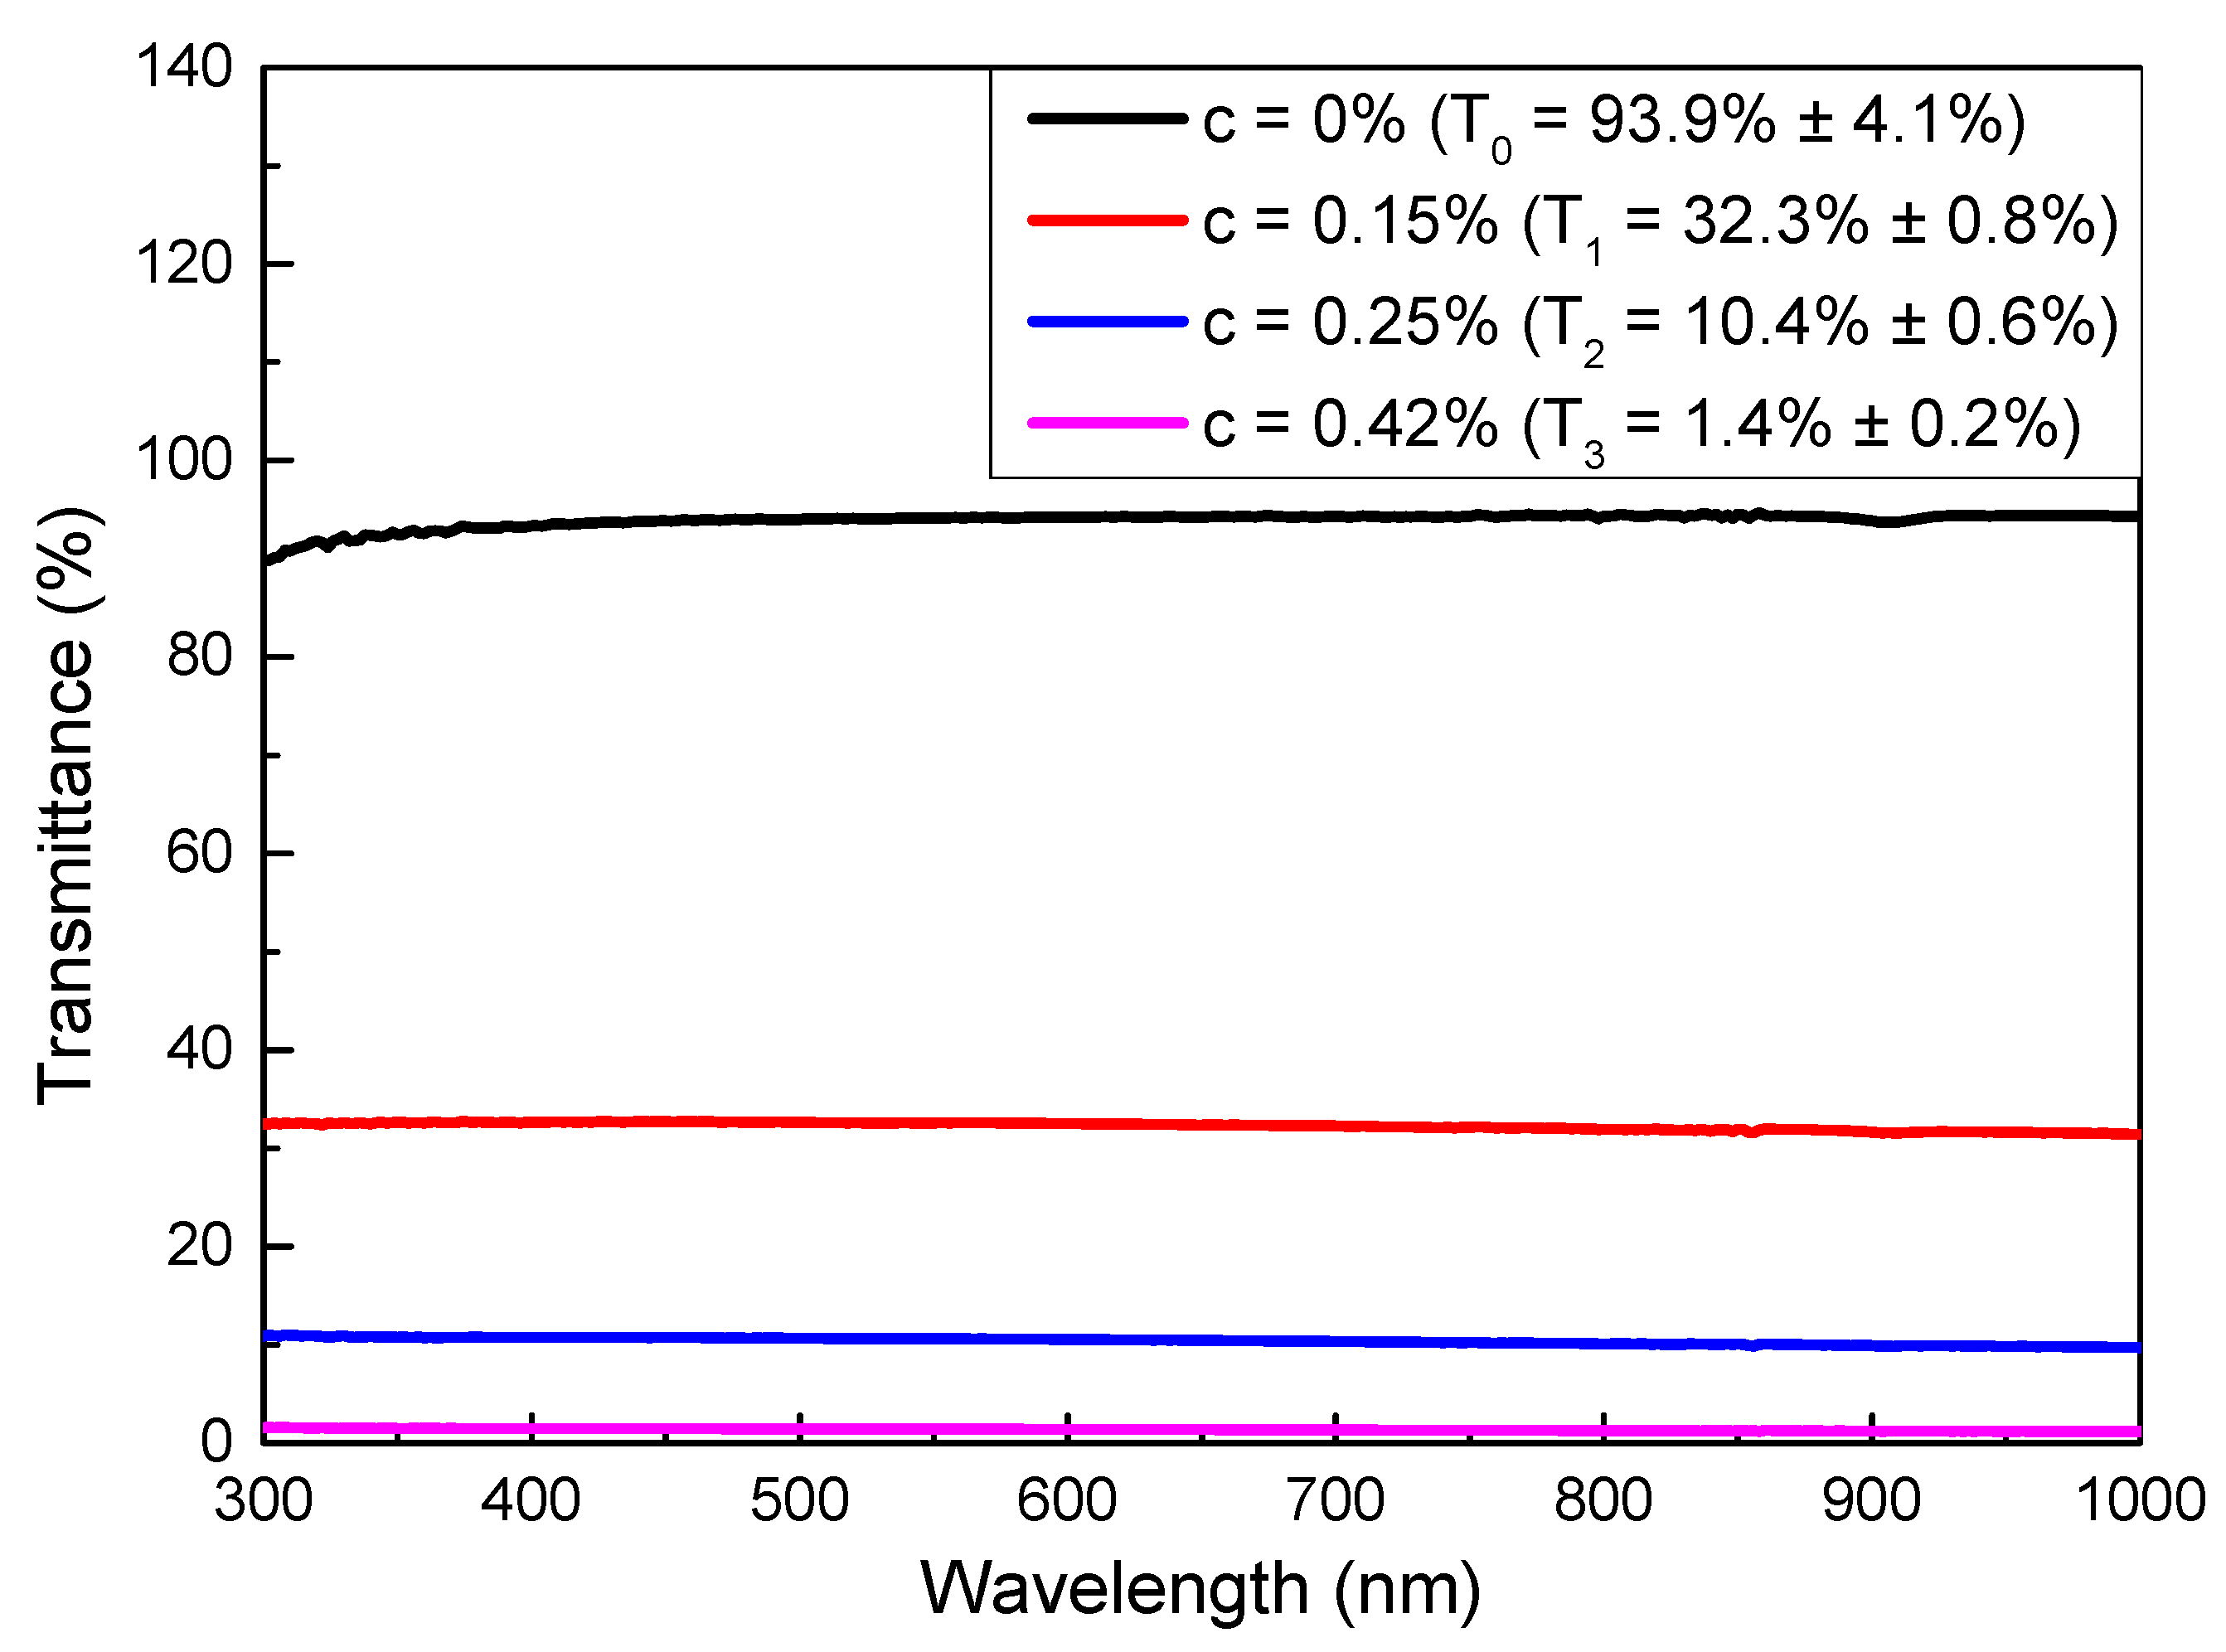
3.1. Transmittance Characterization for Different Concentrations

The transmittance distribution is an important property of each sample and this distribution was measured using a spectrophotometer (PerkinElmer Lambda 1050) over the 300–1000 nm range. As shown in Figure 2, the four transmission lines illustrate one pure PDMS film sample and three composite film samples of PDMS and microcrystalline graphite powder with different concentrations. For the different sample concentrations, which were 0%, 0.15%, 0.25% and 0.42%, the mean transmittance values over the 300–1000 nm range were T 0 = 93.9 ± 4.1%, T 1 = 32.3 ± 0.8%, T 2 = 10.4 ± 0.6% and T 3 = 1.4 ± 0.2%, respectively. These results illustrate that each line shows an approximately constant level. The relative standard deviation (i.e., the ratio of the standard deviation to the corresponding transmissivity) of the sample is extremely low at approximately 0.01–0.07. This indicates that the transmittance shows almost no dependence on the wavelength of the incident light.
In accordance with the Beer–Lambert law,
T = 10 k c h 0
where T is the transmittance of the sample, k is the absorptivity, c is the microcrystalline graphite powder concentration and h 0 is the sample thickness. If k and h 0 are both constants, then T and c will have an exponential relationship.
We fit a relationship curve between the transmittance and the powder concentration using the experimental data obtained, as shown in Figure 3, where k = 3.24 and h 0 = 1 mm. As the figure shows, the experimental data are in good agreement with the values that were theoretically predicted using the Beer–Lambert equation.

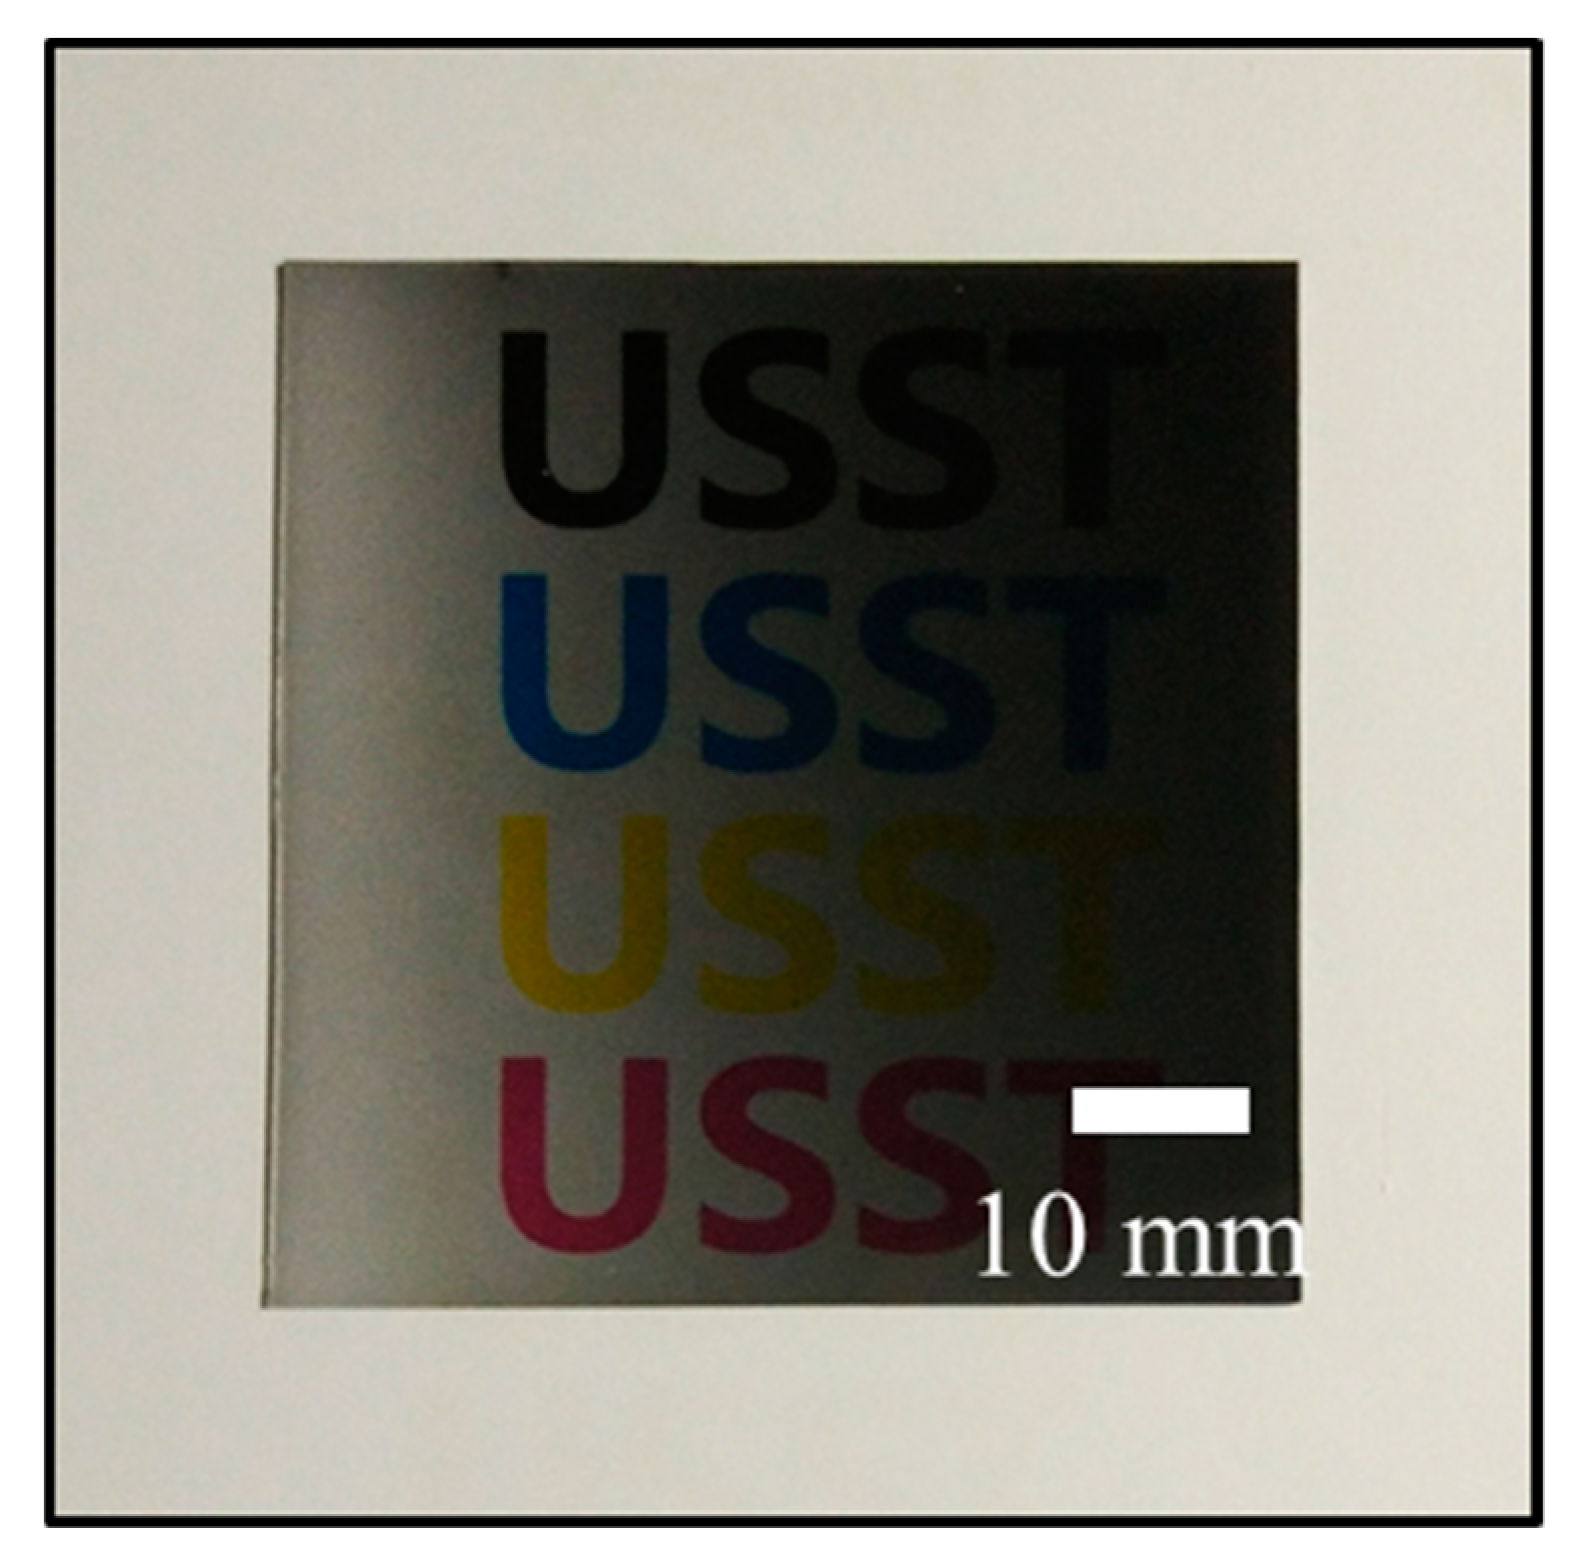
3.2. Transmittance Characterization of Wedge-Shaped Specimen

In addition to the microcrystalline graphite powder concentration, the sample thickness (i.e., the length of the optical path) also affects the transmittance. To demonstrate the regular pattern of the transmittance, we fabricated a cuneiform sample with a thickness that changed evenly from one side to the other while maintaining the same microcrystalline graphite powder concentration. Figure 4 shows a photograph of the cuneiform specimen. The transparency clearly shows a gradual change from the left side towards the right side.
We took measurements at several different positions on the wedge-shaped sample along the direction of the change in thickness. In keeping with the Beer–Lambert law, when k and c are constant, the relationship between the transmittance and the thickness should be an exponential function. In Figure 5, we plotted lgT as a function of the specimen thickness (h), which can be changed along with the spatial position. The resulting relationship can then be expressed as follows:
lgT = ε h
where the thickness has a value in the 0.3 mm < h < 2.0 mm range and ε = k c (where k is the specimen absorptivity, c is the microcrystalline graphite powder concentration and both values are constant) is calculated to be 0.93. This shows good agreement with the value calculated using the Beer–Lambert law.

3.3. Mechanical Stretching of Trapezoid-Shaped Composite Films with Uniform Thickness

Mechanical loading can be used to control the transmittance of the sample by varying its thickness. Both uniaxial stretching and biaxial stretching can be used for this purpose. López [29] verified the feasibility of this method. However, because their sample had uniform thickness, it could only provide uniform transmittance on any given sample, even after being stretched.
To obtain a wide transmittance range on a specific sample, we tentatively proposed a more flexible method: first, we cut the uniform-thickness composite film into different trapezoidal shapes in plane and then stretched the resulting samples in the direction perpendicular to the base line and the top line. We tailored the samples to produce three different trapezoidal shapes as shown in Figure 6a. All three trapezoidal samples had the same base line length of 30 mm and the same height of 60 mm, but the lengths of their top lines were 10 mm, 15 mm and 20 mm. Henceforth, we called the three trapezoidal samples listed above A, B and C, respectively. We then fixed sample A using its base line and added a mechanical stretching load on its top line. This trapezoidal specimen was stretched out to an elongation of 20%; in other words, the height of the stretched specimen increased to 72 mm. The measurements were repeated and taken for the other two samples, B and C, in turn.
For simplicity, we considered the case in which stretching occurred in the plane perpendicular to the direction of propagation of the light when loading was applied. When we stretched the sample, because of its incompressibility, the concentration of the microcrystalline graphite powder remained unaffected; however, the sample’s thickness gradually decreased, i.e., the optical path was reduced by degrees. To be precise, the sample’s thickness changed gradually from top to bottom because the forces that acted at the different locations were different. In this way, we acquired a type of composite film with a special feature in that its transmittance varied gradually from one side of the sample to the other. After stretching, we took the base line of the sample to be the initial position, i.e., x = 0, and then measured the transmittance values of the three trapezoidal samples at their central line along the stretching direction X at 10 mm intervals. Figure 6b shows the results.
If the stretched trapezoid-shaped samples maintain their normal trapezoidal shapes, then the thickness variation in the X direction will be linear. However, in the experiments, both the sides and the centers of the samples showed inhomogeneous shrinkage along the stretching direction. This led to inhomogeneous thickness gradients on all three stretched composite films, where the rate of variation in thickness increased as the measurement point became closer to the top side. The variation of transmittance shown in Figure 6b was consistent with the variation of thickness of the stretched composites. Furthermore, we found that samples with different trapezoidal shapes have different transmittance tuning capabilities. In addition, both the rate and the range of the variation in transmittance in sample A, which had the shortest top length, were maxima. In contrast, both the rate and the range of the variation in transmittance of sample C, which had the longest top length, were minimal. As a result, for samples A, B and C, the transmittance changed by 200.0%, 173.5% and 147.4% compared to their original transmittances, respectively.
This technique could enhance the optical transmittance tuning abilities of these composites. The novel opportunities that are offered by this composite material with its specific optical response can be used to provide system functionality with a wide range of potential applications.

4. Conclusions

In this work, we reported the fabrication of PDMS composite films and demonstrated the optical transmittance properties of these films in the 300–1000 nm wavelength region. By varying the microcrystalline graphite powder concentration or the composite film thickness, we could control the film’s transmittance. It has been proved that the relationship among the transmittance, the concentration and the thickness follows the Beer–Lambert law. Furthermore, we focused on loading via mechanical stretching of the trapezoidal sample. Using this method, our system was able to tune the sample transmittance more flexibly. Specifically, the transmittance varied gradually from one side of a given sample to the other side. In addition, after stretching, samples with different trapezoidal shapes showed differing transmittance tuning abilities.

Author Contributions

Conceptualization, B.S., H.W. and Q.W.; writing—original draft preparation, H.W., B.S. and Q.W.; writing—review and editing, B.S., Y.H., D.Z. and S.Z.; supervision, B.S. and Y.H.; project administration, B.S. and Y.H.; funding acquisition, B.S. and Y.H.

Funding

This research was partially supported by the Natural Science Foundation of Shanghai (19ZR1436100), the National Natural Science Foundation of China (61775140, 61775141 and 11105149), the National Key Research and Development Program of China (2016YFB1102303) and the National Key Foundation for Exploring Scientific Instruments (2016YFF0101904).

Acknowledgments

We would like to express our gratitude to the editors and the reviewers for their constructive and helpful review comments.

Conflicts of Interest

The authors declare no conflict of interest.

References

  1. Ma, J.; Hu, J.; Li, Z.; Nan, C.W. Recent progress in multiferroic magnetoelectric composites: From bulk to thin films. Adv. Mater. 2011, 23, 1062–1087. [Google Scholar] [CrossRef] [PubMed]
  2. Qi, L.; Lee, B.I.; Chen, S.H.; Samuels, W.D.; Exarhos, G.J. High-dielectric-constant silver–epoxy composites as embedded dielectrics. Adv. Mater. 2005, 17, 1777–1781. [Google Scholar] [CrossRef]
  3. Jones, R.M. Mechanics of composite materials, 2nd ed.; Taylor & Francis Group: Abingdon, UK, 1999; pp. 389–400. [Google Scholar]
  4. Chen, J.; Zheng, J.; Gao, Q.; Zhang, J.; Zhang, J.; Omisore, O.M.; Wang, L.; Li, H. Polydimethylsiloxane (PDMS)-Based Flexible Resistive Strain Sensors for Wearable Applications. Appl. Sci. 2018, 8, 345. [Google Scholar] [CrossRef]
  5. Gandhi, S.S.; Chien, L.C. High transmittance optical films based on quantum dot composites nanoscale polymer dispersed liquid crystals. Opt. Mater. 2016, 54, 300–305. [Google Scholar] [CrossRef]
  6. Granqvist, C.G.; Avendaño, E.; Azens, A. Electrochromic coatings and devices: Survey of some recent advances. Thin Solid Films 2003, 442, 201–211. [Google Scholar] [CrossRef]
  7. Dyer, A.L.; Grenier, C.R.G.; Reynolds, J.R.A. Poly(3,4-alkylenedioxythiophene) Electrochromic Variable Optical Attenuator with Near-Infrared Reflectivity Tuned Independently of the Visible Region. Adv. Funct. Mater. 2007, 17, 1480–1486. [Google Scholar] [CrossRef]
  8. Sampanthar, J.T.; Neoh, K.G.; Ng, S.W.; Kang, E.T.; Tan, K.L. Flexible Smart Window via Surface Graft Copolymerization of Viologen on Polyethylene. Adv. Mater. 2000, 12, 1536–1539. [Google Scholar] [CrossRef]
  9. Parkin, I.P.; Manning, T.D. Intelligent Thermochromic Windows. J. Chem. Educ. 2006, 83, 393–400. [Google Scholar] [CrossRef]
  10. Hoi, S.K.; Chen, X.; Kumar, V.S.; Homhuan, S.; Sow, C.H.; Bettiol, A.A. Microfluidic Chip with Integrated Colloidal Crystal for Online Optical Analysis. Adv. Funct. Mater. 2011, 21, 2847–2853. [Google Scholar] [CrossRef]
  11. Scaffaro, R.; Maio, A. Influence of Oxidation Level of Graphene Oxide on the Mechanical Performance and Photo-Oxidation Resistance of a Polyamide 6. Polymers 2019, 11, 857. [Google Scholar] [CrossRef]
  12. Scaffaro, R.; Maio, A. A green method to prepare nanosilica modified graphene oxide to inhibit nanoparticles re-aggregation during melt processing. Chem. Eng. J. 2017, 16, 1034–1047. [Google Scholar] [CrossRef]
  13. Lee, H.; Low, M.J.; Lim, C.H.J.; An, J.; Sandeep, C.S.; SRohith, T.M.; Rhee, H.; Murukeshan, V.M.; Kim, Y. Transferable ultra-thin multi-level micro-optics patterned by tunable photoreduction and photoablation for hybrid optics. Carbon 2019, 149, 572–581. [Google Scholar] [CrossRef]
  14. Scaffaro, R.; Maio, A.; Re, G.L.; Parisi, A.; Busacca, A. Advanced piezoresistive sensor achieved by amphiphilic nanointerfaces of graphene oxide and biodegradable polymer blends. Compos. Sci. Technol. 2018, 156, 166–176. [Google Scholar] [CrossRef]
  15. Zhang, Y.; Lu, Y.; Yan, X.; Gao, W.; Chen, H.; Chen, Q.; Bai, Y.X. Functional & Enhanced Graphene/Polyamide 6 composite fiber Constructed by A Facile and Universal Method. Compos. Part A 2018, 57, 10967–10976. [Google Scholar]
  16. Wang, W.; Zhang, Y.; Han, B.; Ma, J.; Wang, J.; Han, D.; Ma, Z.; Sun, H. A complementary strategy for producing moisture and alkane dual-responsive actuators based on graphene oxide and PDMS bimorph. Sens. Actuators B 2019, 290, 133–139. [Google Scholar] [CrossRef]
  17. Wang, Y.; Yang, R.; Shi, Z.; Zhang, L.; Shi, D.; Wang, E.; Zhang, G. Super-Elastic Graphene Ripples for Flexible Strain Sensors. ACSNANO 2011, 5, 3645–3650. [Google Scholar] [CrossRef]
  18. Kou, H.; Zhang, L.; Tan, Q.; Liu, G.; Dong, H.; Zhang, W.; Xiong, J. Wireless wide-range pressure sensor based on graphene/PDMs sponge for tactile monitoring. Sci. Rep. 2019, 9, 3916. [Google Scholar] [CrossRef]
  19. Scaffaro, R.; Maio, A. Integrated ternary bionanocomposites with superior mechanical performance via the synergistic role of graphene and plasma treated carbon nanotubes. Compos. Part B 2019, 168, 550–559. [Google Scholar] [CrossRef]
  20. Scaffaro, R.; Maio, A.; Lopresti, F. Effect of graphene and fabrication technique on the release kinetics of carvacrol from polylactic acid. Compos. Sci. Technol. 2019, 169, 60–69. [Google Scholar] [CrossRef]
  21. Baetens, R.; Jelle, B.P.; Gustavsen, A. Properties, requirements and possibilities of smart windows for dynamic daylight and solar energy control in buildings: A state-of-the-art review. Sol. Energy Mater. Sol. Cells 2010, 94, 87–105. [Google Scholar] [CrossRef] [Green Version]
  22. Molberg, M.; Leterrier, Y.; Plummer, C.J.G.; Walder, C. Frequency dependent dielectric and mechanical behavior of elastomers for actuator applications. J. Appl. Phys. 2009, 106, 054112–054117. [Google Scholar] [CrossRef]
  23. Sheng, B.; Luo, L.; Huang, Y.; Chen, G.; Zhou, H.; Zhang, D.; Zhuang, S. Tailorable Elastomeric Grating with Tunable Groove Density Gradient. IEEE Photonics J. 2017, 9, 2400406. [Google Scholar] [CrossRef]
  24. Rosset, S.; Shea, H.R. Flexible and stretchable electrodes for dielectric elastomer actuators. Appl. Phys. A 2013, 110, 281–307. [Google Scholar] [CrossRef]
  25. Zhang, Y.; Xu, S.; Fu, H.; Lee, J.; Su, J.; Hwang, K.C.; Rogers, J.A.; Huang, Y. Buckling in serpentine microstructures and applications in elastomer-supported ultra-stretchable electronics with high areal coverage. Soft Matter 2013, 9, 8062–8070. [Google Scholar] [CrossRef] [PubMed] [Green Version]
  26. Adrega, T.; Lacour, S.P. Stretchable gold conductors embedded in PDMS and patterned by photolithography: Fabrication and electromechanical characterization. J. Micromech. Microeng. 2010, 20, 055025. [Google Scholar] [CrossRef]
  27. Tooley, W.W.; Feghhi, S.; Han, S.J.; Wang, J.; Sniadecki, N.J. Thermal fracture of oxidized polydimethylsiloxane during soft lithography of nanopost arrays. J. Micromech. Microeng. 2011, 21, 54013–54019. [Google Scholar] [CrossRef]
  28. Xin, Q.B.; Ookawa, K.; Wong, J.Y. Evaluation of polydimethylsiloxane scaffolds with physiologically-relevant elastic moduli: Interplay of substrate mechanics and surface chemistry effects on vascular smooth muscle cell response. Biomaterials 2005, 26, 3123–3129. [Google Scholar]
  29. López Jiménez, F.; Kumar, S.; Reis, P.M. Soft Color Composites with Tunable Optical Transmittance. Adv. Opt. Mater. 2016, 4, 620–626. [Google Scholar] [CrossRef]
  30. Minnai, C.; Di, V.M.; Milani, P. Mechanical-optical-electro modulation by stretching a polymer-metal nanocomposite. Nanotechnology 2017, 28, 355702. [Google Scholar] [CrossRef]
  31. Mohamed-Noriega, N.; Hinojosa, M.; González, V.; Rodil, S.E. Polymer-based composite with outstanding mechanically tunable refractive index. Opt. Mater. 2016, 58, 18–23. [Google Scholar] [CrossRef]
  32. Apostoleris, H.N.; Chiesa, M.; Stefancich, M. Improved transparency switching in paraffin-PDMS composites. J. Mater. Chem. C 2015, 3, 1371–1377. [Google Scholar] [CrossRef]
  33. Prasse, T.; Flandin, L.; Schulte, K.; Bauhofer, W. In situ observation of electric field induced agglomeration of carbon black in epoxy resin. Appl. Phys. Lett. 1998, 72, 2903–2905. [Google Scholar] [CrossRef] [Green Version]
  34. Cooper, C.A.; Ravich, D.; Lips, D.; Mayer, J.; Wagner, H.D. Distribution and alignment of carbon nanotubes and nanofibrils in a polymer matrix. Compos. Sci. Technol. 2002, 62, 1105–1112. [Google Scholar] [CrossRef]
  35. Schwarz, M.K.; Bauhofer, W.; Schulte, K. Alternating electric field induced agglomeration of carbon black filled resins. Polymer 2002, 43, 3079–3082. [Google Scholar] [CrossRef]
  36. Ajayan, P.M. Aligned carbon nanotubes in a thin polymer film. Adv. Mater. 1995, 7, 489–491. [Google Scholar] [CrossRef]
  37. Kimura, T.; Ago, H.; Tobita, M.; Ohshima, S.; Kyotani, M.; Yumura, M. Polymer Composites of Carbon Nanotubes Aligned by a Magnetic Field. Adv. Mater. 2002, 14, 1380–1383. [Google Scholar] [CrossRef]
  38. Choi, E.S.; Brooks, J.S.; Eaton, D.L.; Al-Haik, M.S. Enhancement of thermal and electrical properties of carbon nanotube polymer composites by magnetic field processing. J. Appl. Phys. 2003, 94, 6034–6039. [Google Scholar] [CrossRef]
Figure 1. (a) Sample of pure polydimethylsiloxane (PDMS) (thickness h 0 = 1 mm), placed on top of paper with printed colored fonts. (b) Sample of the dyed PDMS (thickness h 0 = 1 mm), placed in the same position as that of the sample in (a). (c) Formation of the composite film observed under an optical microscope.
Applsci 09 02402 g001
Figure 2. Four transmission lines for the pure PDMS sample and the three concentrations (0%, 0.15%, 0.25% and 0.42%) of microcrystalline graphite powder composites in the polydimethylsiloxane (PDMS) samples within the 300–1000 nm wavelength range.
Applsci 09 02402 g002
Figure 3. Transmittance characterization versus microcrystalline graphite powder concentration for samples with the same thickness ( h 0 = 1 mm).
Applsci 09 02402 g003
Figure 4. Cuneiform specimen (concentration c = 0.2 %; thickness, 0.3 mm < h < 2.0 mm), placed on top of paper with printed colored fonts.
Applsci 09 02402 g004
Figure 5. Characterization of transmittance versus sample thickness.
Applsci 09 02402 g005
Figure 6. (a) Three different trapezoid-shaped samples with top line dimensions of (A) 10 mm, (B) 15 mm and (C) 20 mm; (b) transmittance at the central line for stretched composite films A, B and C along their stretching directions at intervals of 10 mm; the inset shows a diagram of the stretched sample.
Applsci 09 02402 g006

