Article

High Temperature (Up to 950 °C) Sensor Based on Micro Taper In-Line Fiber Mach–Zehnder Interferometer

1
Key Laboratory of Nondestructive Test (Ministry of Education), Nanchang Hangkong University, Nanchang 330063, China
2
National Engineering Laboratory for Destructive Testing and Optoelectronic Sensing Technology and Application, Nanchang HangKong University, Nanchang 330063, China
3
State Key Laboratory of Information Photonics and Optical Communications, Beijing University of Posts and Telecommunications, Beijing 100876, China
4
State Key Lab of Advanced Optical Communication Systems and Networks, Shanghai Jiao Tong University, 800 Dongchuan Rd, Shanghai 200240, China
5
Faculty of Engineering and Environment, Northumbria University, Newcastle Upon Tyne NE1 8ST, UK
*
Authors to whom correspondence should be addressed.
Appl. Sci. 2019, 9(12), 2394; https://doi.org/10.3390/app9122394
Submission received: 24 April 2019 / Revised: 30 May 2019 / Accepted: 6 June 2019 / Published: 12 June 2019
(This article belongs to the Special Issue Recent Progress in Fiber Optic Sensors: Bringing Light to Measurement)

Abstract

:

Featured Application

The sensor developed in the paper can be used for high sensitivity temperature detection of power system, biomedicine, aerospace, and so on.

Abstract

A high temperature (up to 950 °C) sensor was proposed and demonstrated based on a micro taper in-line fiber Mach–Zehnder interferometer (MZI) structure. The fiber MZI structure comprises a single mode fiber (SMF) with two micro tapers along its longitudinal direction. An annealing at 1000 °C was applied to the fiber sensor to stabilize the temperature measurement. The experimental results showed that the sensitivity was 0.114 nm/°C and 0.116 nm/°C for the heating and cooling cycles, respectively, and, after two days, the sensor still had a sensitivity of 0.11 nm/°C, showing a good stability of the sensor. A probe-type fiber MZI was designed by cutting the sandwiched SMF, which has good linear temperature responses of 0.113 nm/°C over a large temperature range from 89 to 950 °C. The probe-type fiber MZI temperature sensor was independent to the surrounding refractive index (RI) and immune to strain. The developed sensor has a wide application prospect in the fields of high temperature hot gas flow, as well as oil and gas field development.

1. Introduction

Optical fiber interferometer sensors have the advantages of small size, compactness, and high sensitivity, which is why they are widely used in petroleum, chemical industries, and physical and biomedicine sensing [1,2,3,4,5]. There are various types of optical fiber interferometers, including the fiber Fabry–Pérot interferometer, the Mach–Zehnder interferometer (MZI), and the Michelson and Sagnac interferometer [6,7,8,9,10,11,12,13,14,15]. Among these sensor structures, the optical fiber MZI sensor has attracted considerable research interest and been applied for various parameter measurements, such as temperature, strain, bending, liquid level, and refractive index (RI), due to its flexibility in structure design [16,17,18,19,20,21,22,23]. A single mode–multimode–single mode (SMS) fiber structure is a typical fiber inline MZI configuration, where the multimode fiber (MMF) section could be a multimode fiber [24], photonic crystal fiber [25], thin-core fiber [26,27,28], no-core fiber, and twin/multiple core fiber [29,30,31,32,33]. These structures are based on the fusion splicing between two single mode fibers (SMFs) and a multimode fiber section. Once the MMF section is given, very limited flexible design of the sensor can be provided.
In this paper, a novel in-line fiber MZI sensor based on a micro taper structure was proposed and investigated in both theoretical and experimental studies. The structure is based on a single SMF, where two micro tapers are created with a short SMF sandwiched between the two micro tapers. The first micro taper’s purpose is to excite multiple modes transmitting within both the core and the cladding of the sandwiched SMF, and the second micro taper is to collect these multiple modes into the output SMF. Since the micro taper can be created using a common commercial fusion splicer, the structure of the micro taper can be changed simply by controlling the arc-discharge parameters, such as arc-discharged time, power, and stepped length, resulting in different coupling coefficients from the input SMF to the sandwiched SMF and, thus, a flexible design of the sensor structure. To demonstrate the application of the micro taper design, a high-temperature measurement (up to 950 °C) was studied experimentally. In addition, to demonstrate the practical application of the sensor, a probe-type fiber MZI was studied for high temperature measurement by cutting the sandwiched SMF.

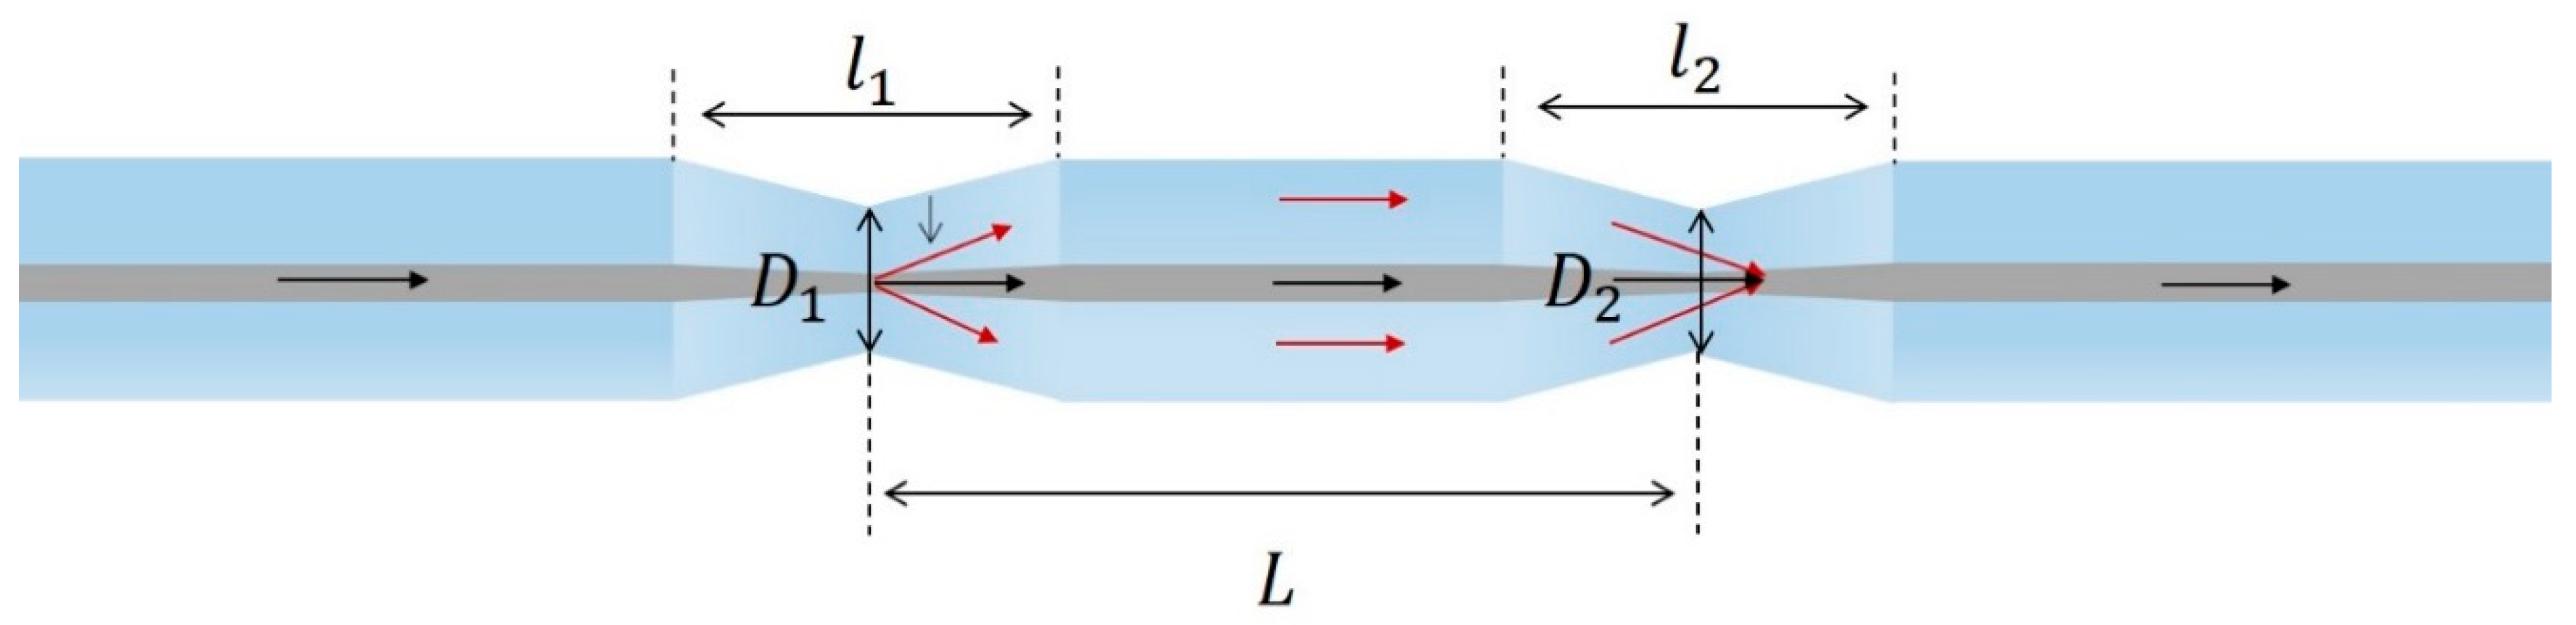
2. Theoretical Analysis and Simulations

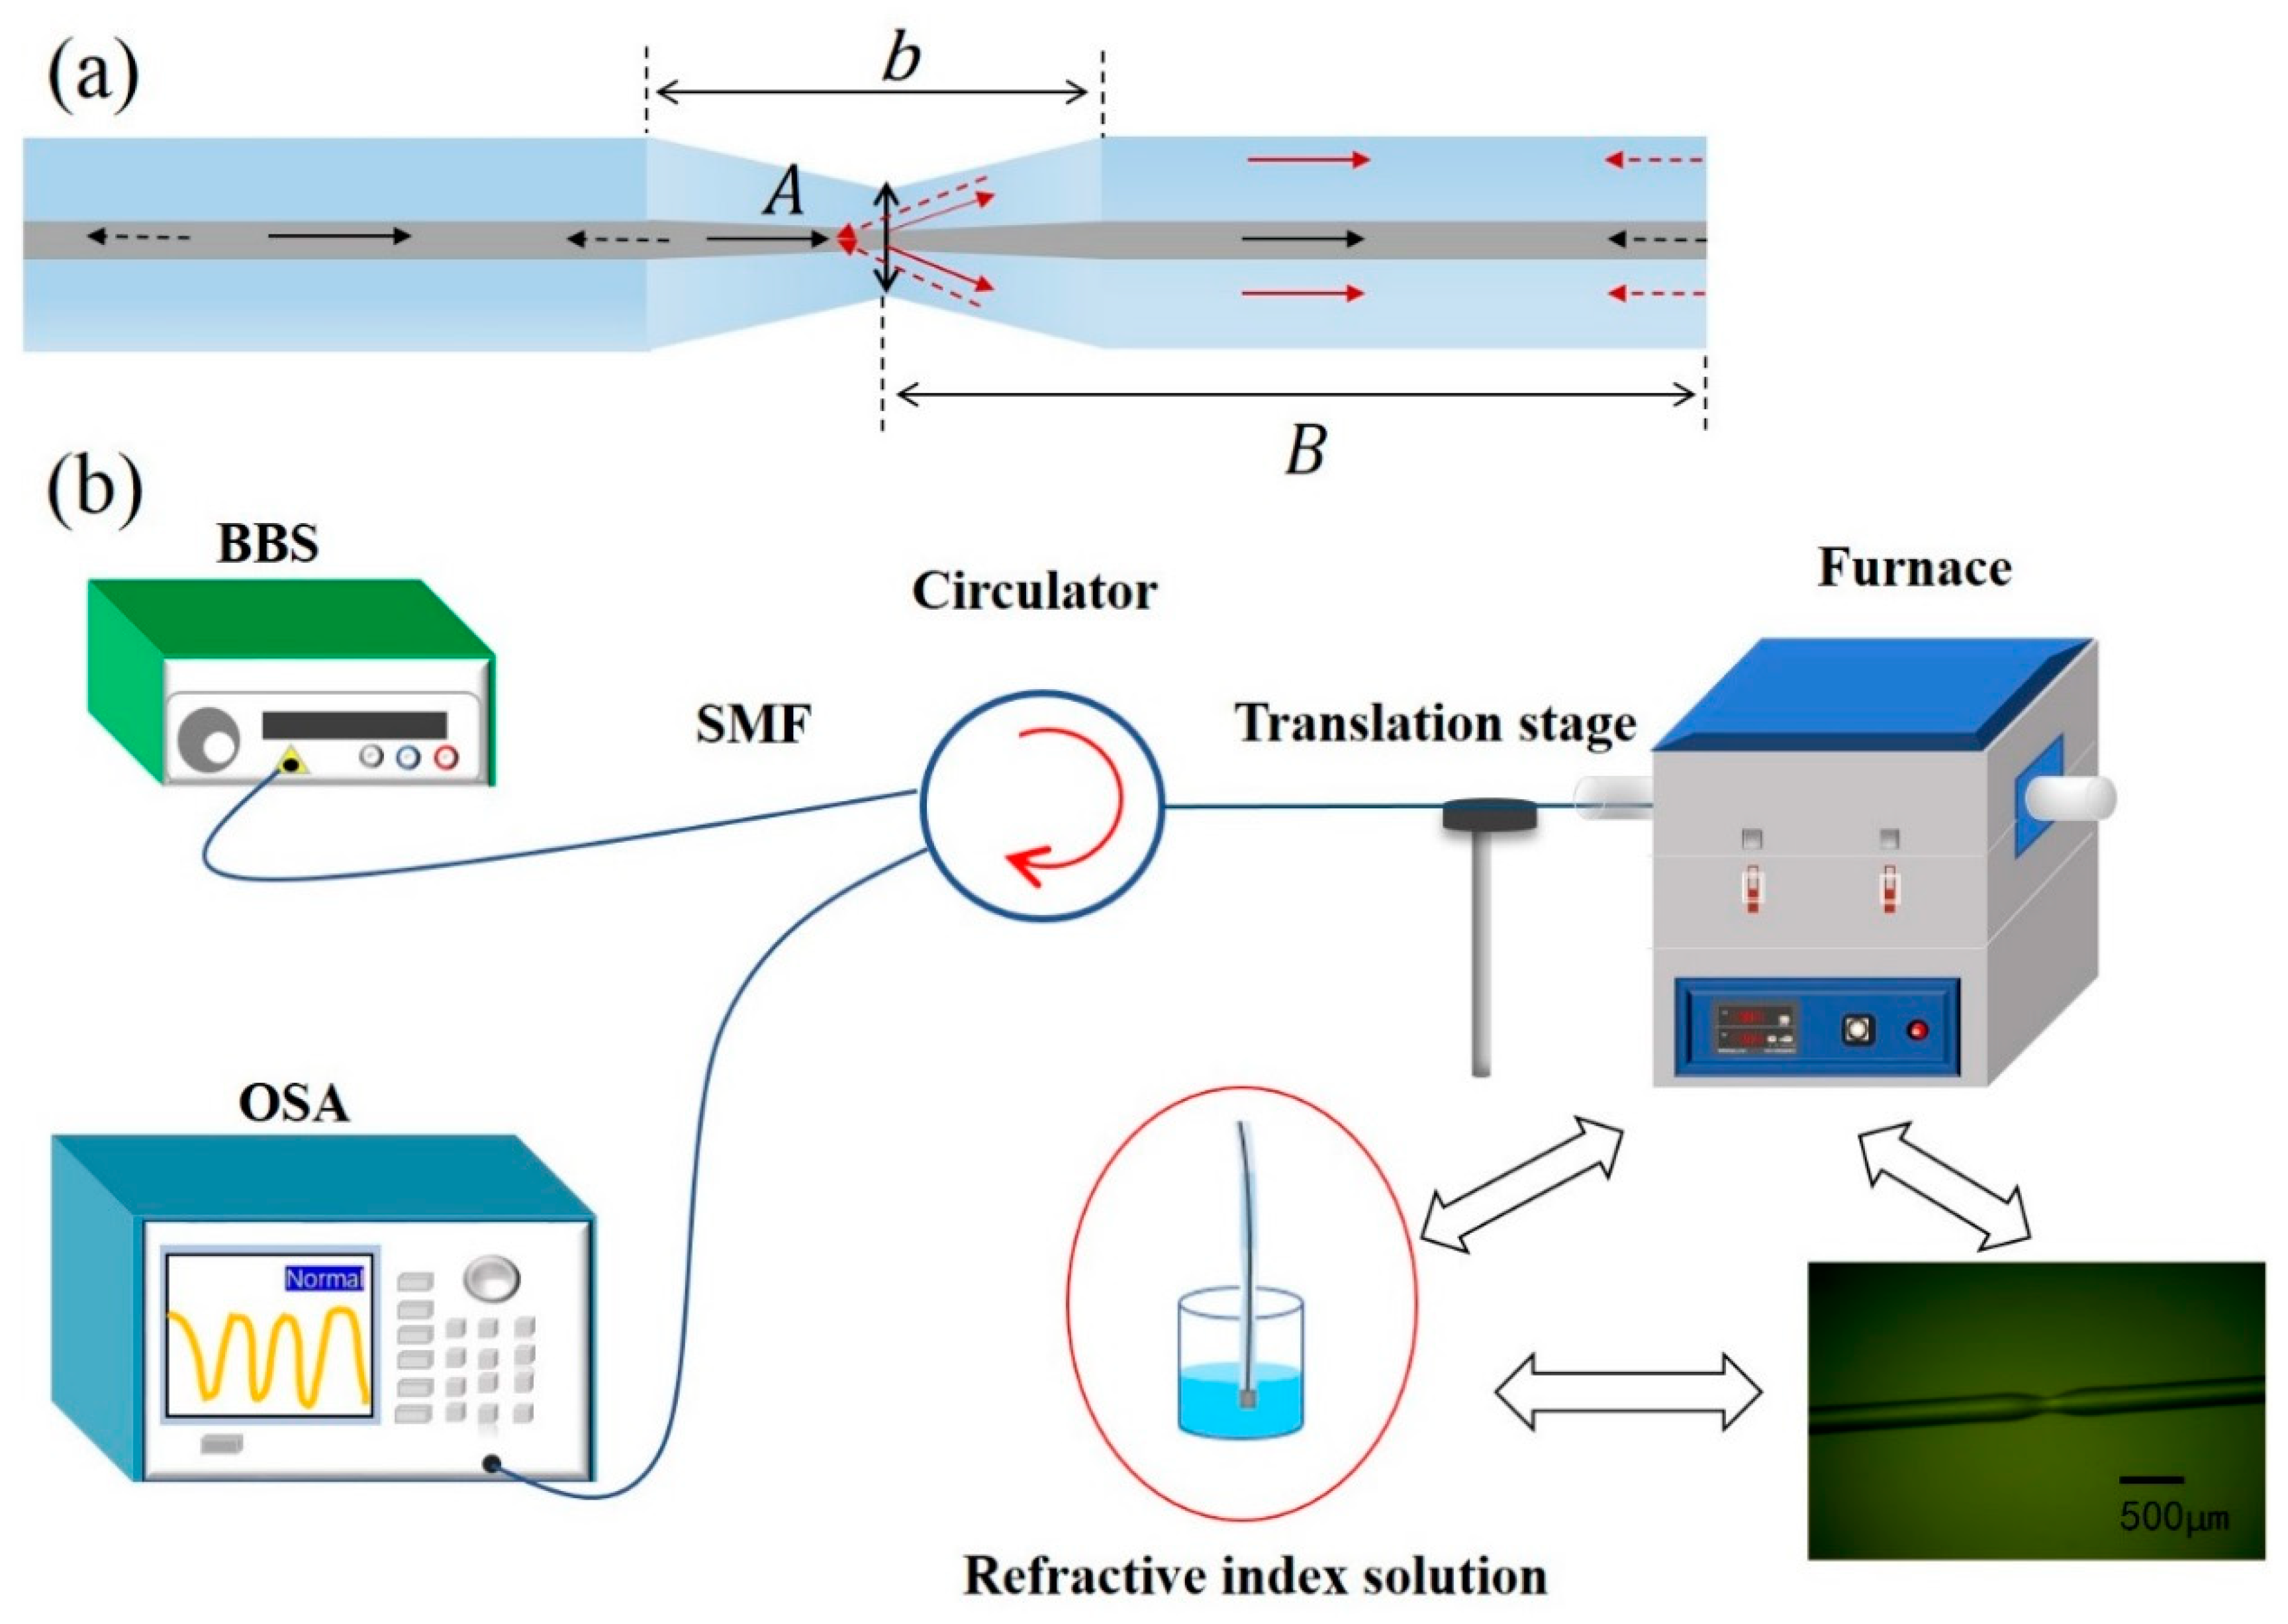
2.1. Theoretical Analysis
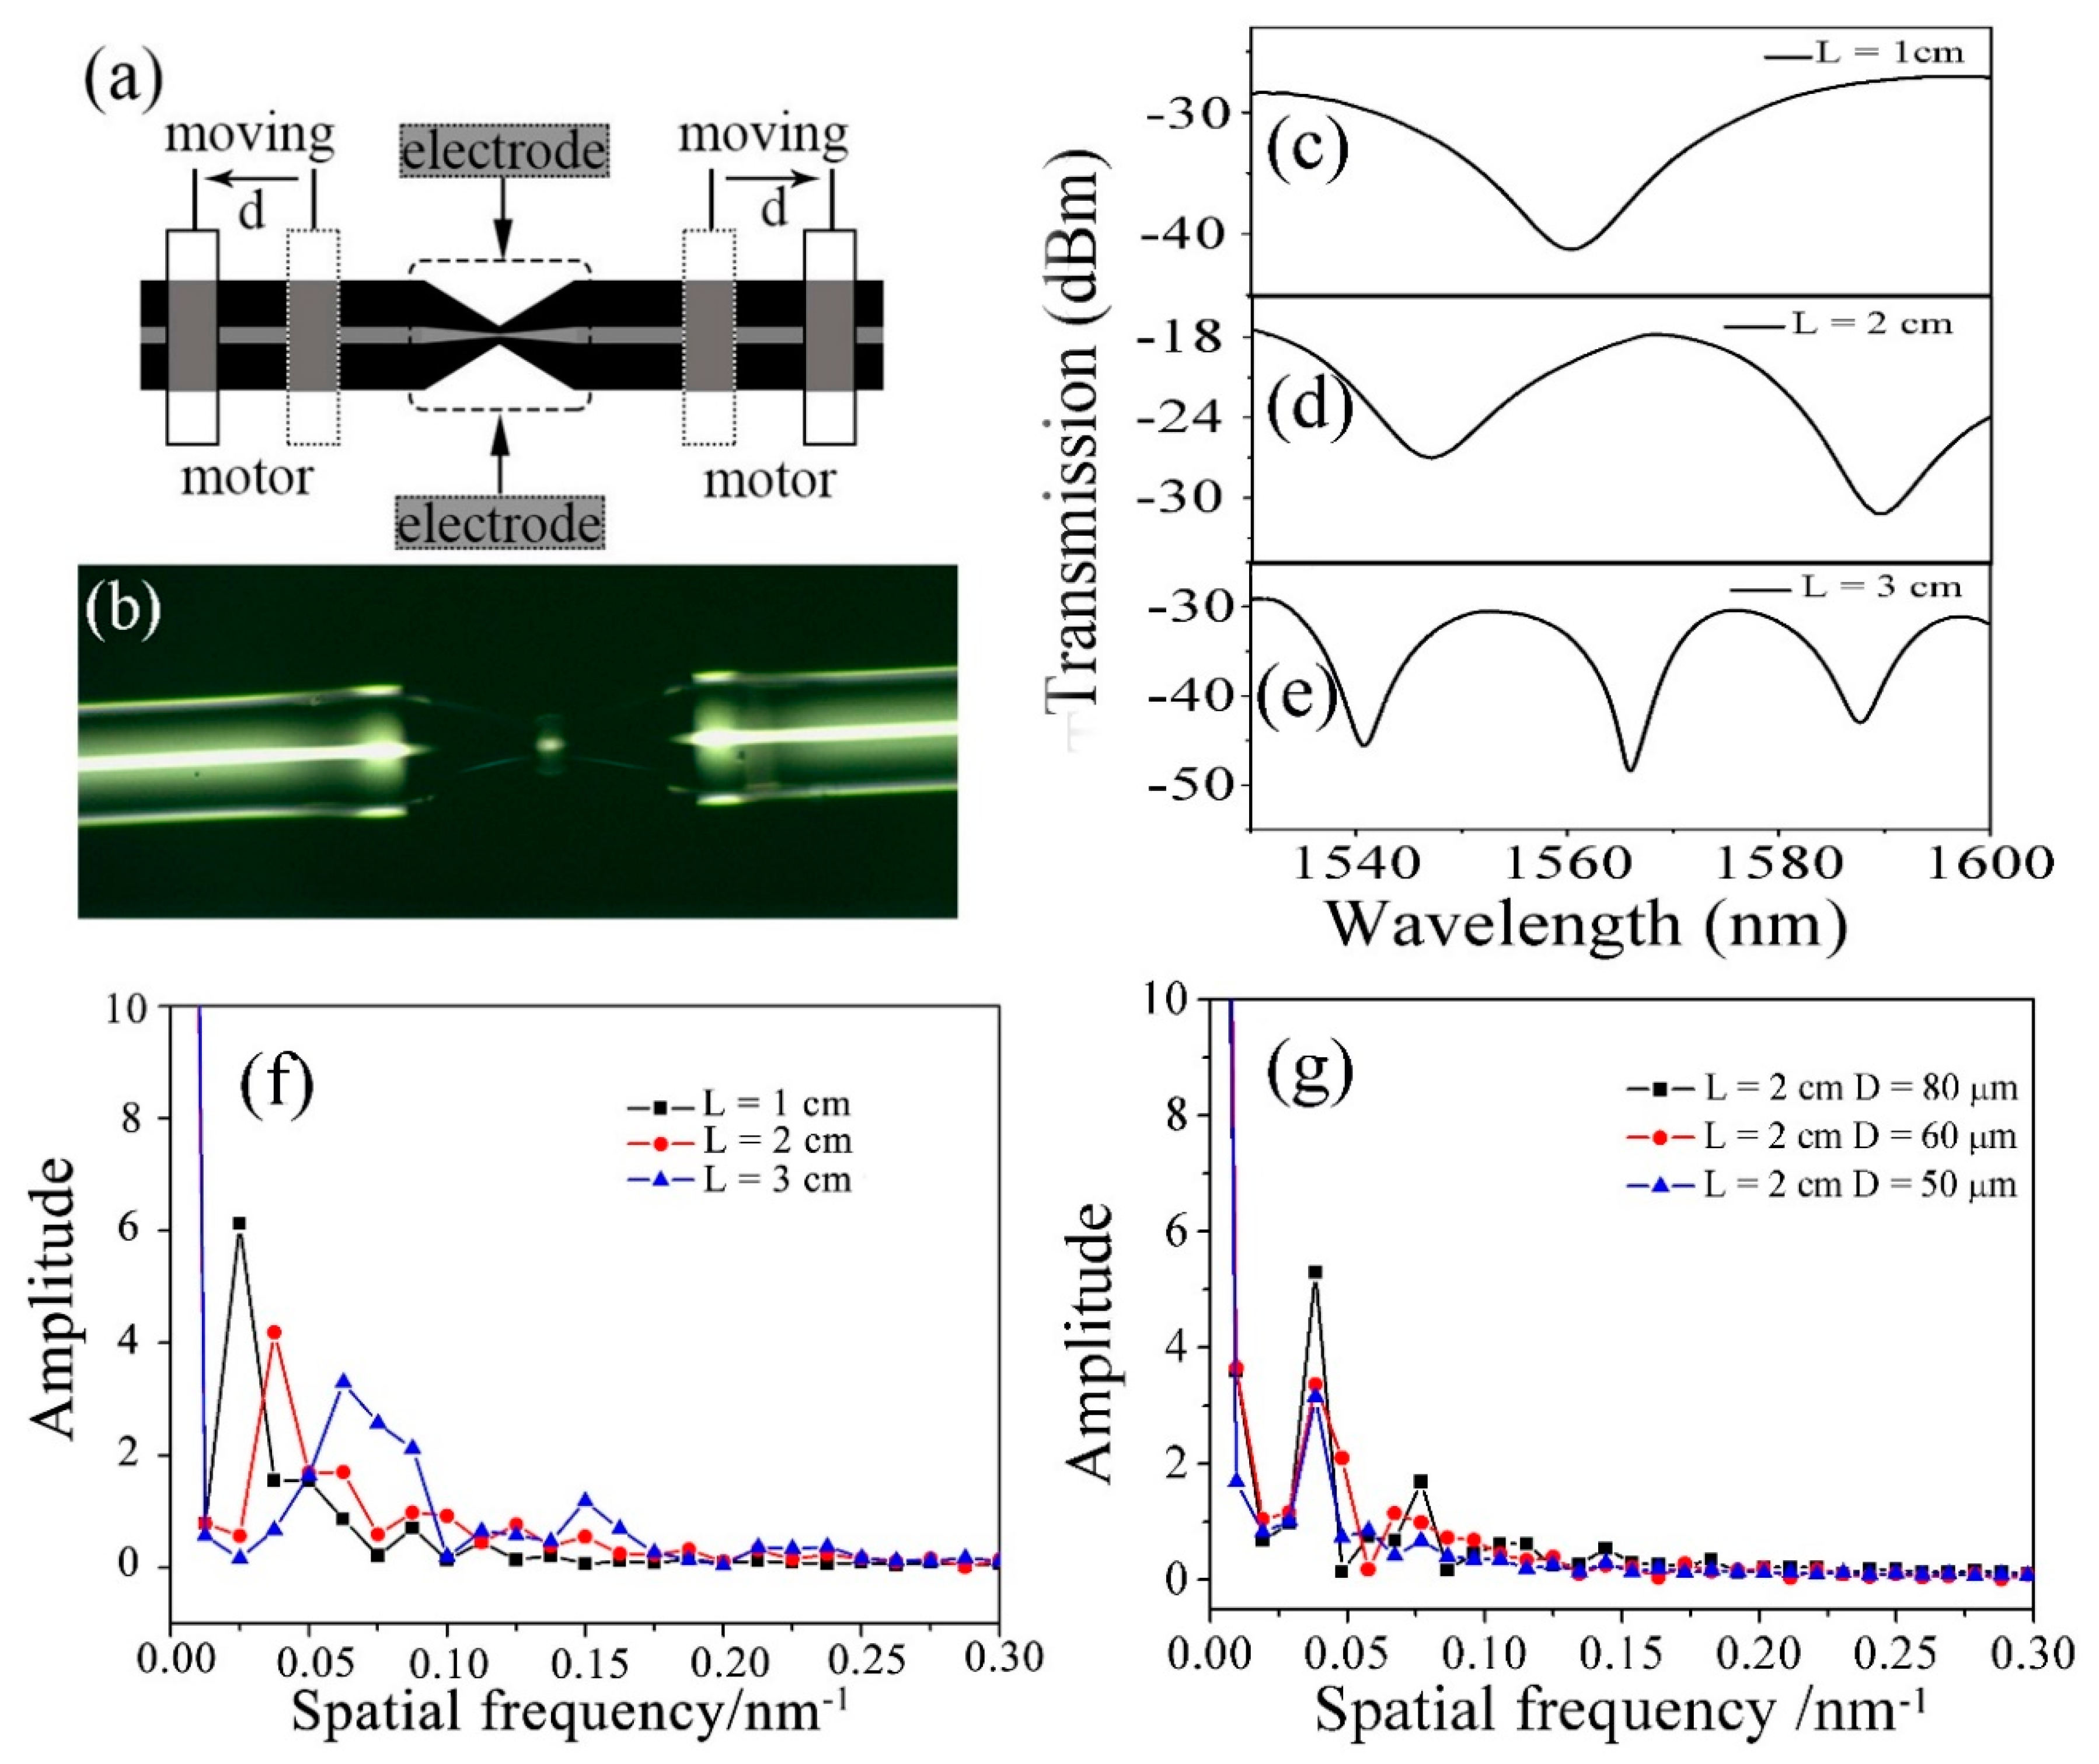
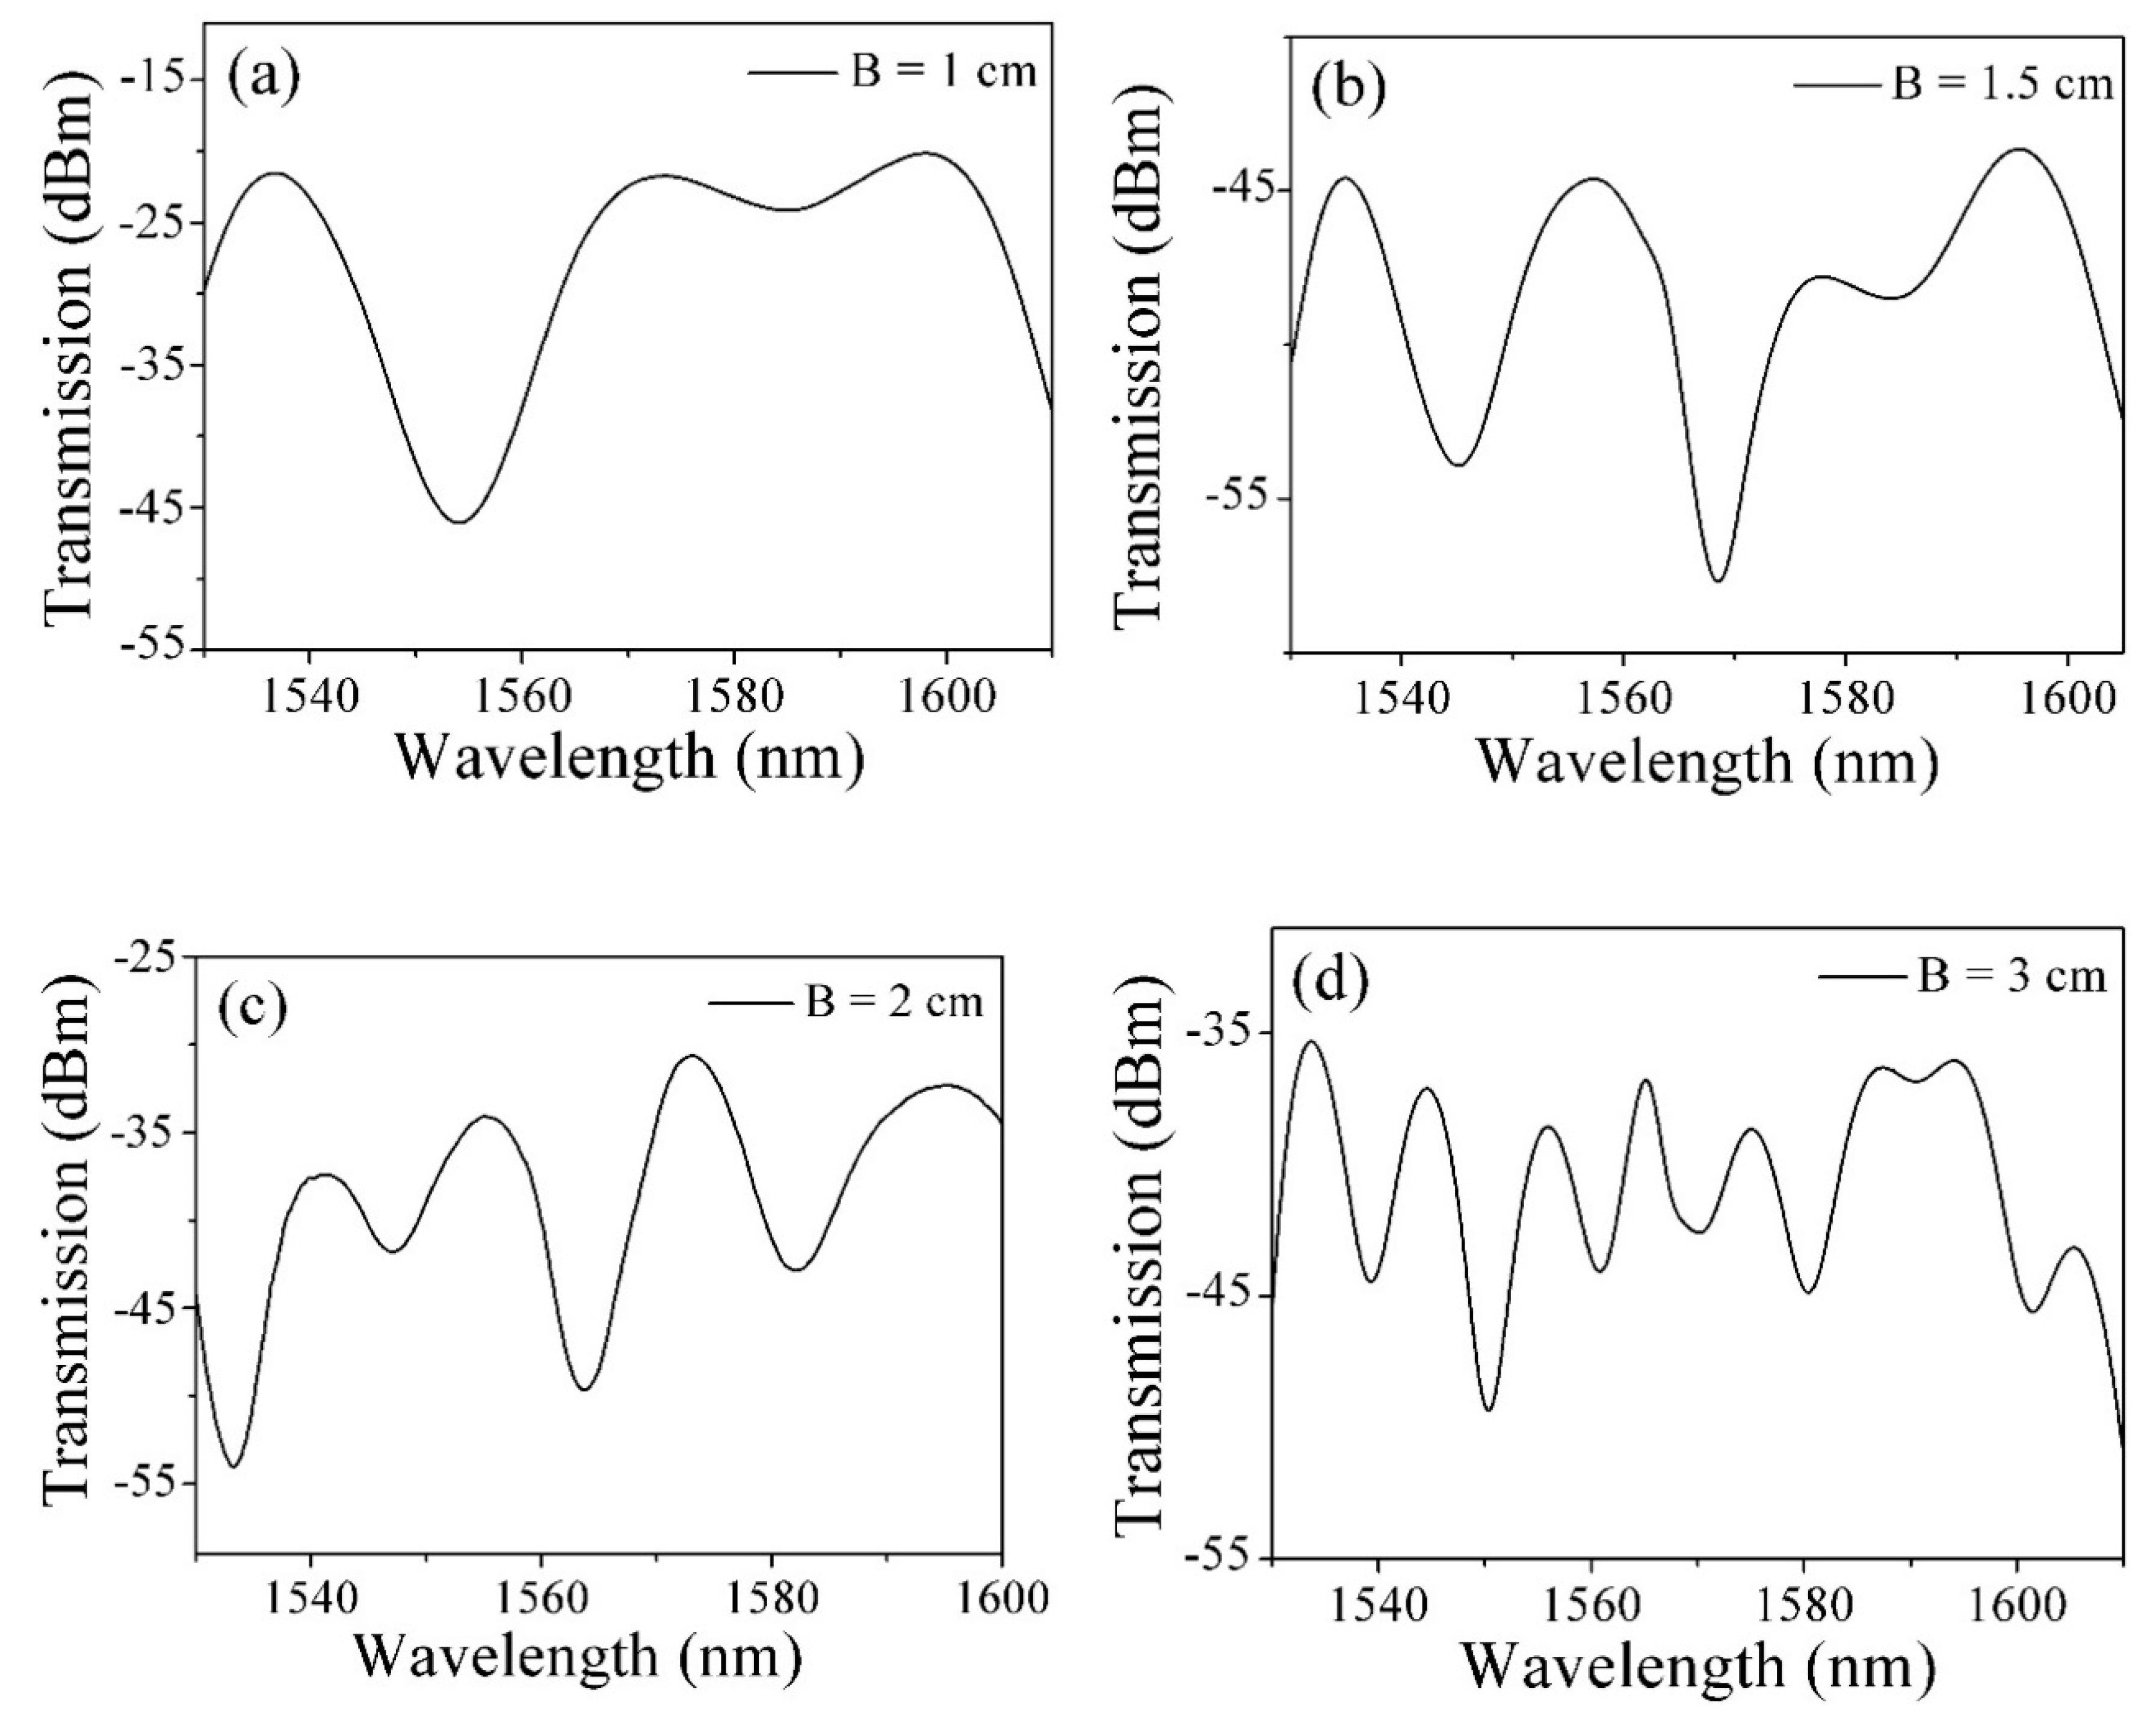
A schematic diagram of the micro taper in-line fiber MZI is shown in Figure 1.
In Figure 1, L is the length of the sandwiched SMF between two taper waists of the sensor, l1 and l2 are the lengths of the micro taper, and D1 and D2 are the waist diameters of the micro taper. Light is injected from the broadband source into the input SMF and then transmitted in the core of the SMF. In the taper section, since the taper is not adiabatic, the light in the core of the SMF will excite the cladding modes, and these modes, together with the core mode, will transmit independently within both the core and the cladding of the sandwiched SMF between the two tapers (D1 and D2). Since these modes have different propagation constants, when they recouple into the output SMF at the second taper D2, interference between these modes will take place, resulting in power variations. The intensity of the output of the proposed MZI owing to the interference between the core mode and order cladding mode is:
I T = I 1 + I 2 + 2 I 1 I 2 cos ( Δ φ )
where I 1 and I 2 are the light intensities of the core and cladding modes, and Δ φ is the phase difference between them. Assuming L is the length of the sandwiched SMF between two taper waists the phase Δ φ can be expressed as below:
Δ φ = 2 π ( n c o n c l ) L λ
where nco and ncl are the effective refractive indexes of the core and cladding, respectively, λ is the input wavelength and L is distance of sandwiched SMF between two taper waists. The free spectral range (FSR) of the fabricated MZI can be expressed as:
FSR = λ 2 ( n c o n c l ) L
The FSR is inversely proportional to the interaction length, and the wavelength with minimum output light intensity are located at:
λ d i p = 2 2 m + 1 ( n c o n c l ) L
where m = 0, 1, 2… When the surrounding temperature of the fiber changes, the sensitivity of the sensor can be expressed as:
d λ d T [ λ Δ n e f f m ( Δ n e f f m n c o d n c o d T + Δ n e f f m n c l d n c l d T ) + λ d L L d T ] 1 λ Δ n e f f m Δ n e f f m λ
where Δ n e f f m is the effective refractive index (RI) difference between the core and cladding mode.

2.2. Simulations

Based on the above theoretical analysis, the fiber-optic sensor was numerically simulated using the beam propagation method (BPM). The simulate conditions were based on a 2D model with a mesh size in the X and Z directions of 0.1 μm and 1 μm, respectively; the boundary condition adopted a perfectly matched layer (PML) condition in the model. The SMF core and cladding diameters were 8.2 μm and 125 μm, and the corresponding RIs were 1.4682 and 1.4628, respectively. The length (l1 = l2) and taper diameter (D1 = D2) of the micro taper fiber were set as 500 μm and 80 μm, respectively. The simulated transmission spectra had lengths of L = 1, 2, and 3 cm and a wavelength range of 1540–1600 nm, as shown in Figure 2a. The corresponding spatial spectrogram calculated with fast Fourier transform (FFT) is shown in Figure 2b. Figure 2c,d show distributions of the optical field propagating along the MZI and the corresponding normalized optical intensity change at dip A and peak B, respectively. The spatial spectrum ε relationship is [34]:
ε = Δ m e f f L / λ 2 , Δ m e f f = Δ n e f f λ 0 λ Δ n e f f
where Δ n e f f is the effective RI difference due to the inter-mode dispersion, Δ m e f f indicates the effective RI difference caused by inter-mode dispersion, and λ is input wavelength, when it is constant, the spatial spectrum is proportional to the effective RI difference Δ m e f f and the interference length. As can be seen from Figure 2b, for all the three L, there are several peaks in the MZI spatial spectrum, indicating that there are multiple modes participating and interfering with each other. A main peak (exclude the frequency 0) whose amplitude is much larger than other small peaks can be observed, and the spatial frequency increases as L increases. Since the high-order cladding mode corresponds to a higher spatial frequency, the low-order cladding mode dominates the inter-mode interference, as shown in Figure 2b. Therefore, it is reasonable to assume that the MZI is mainly caused by interference between the excited low-order cladding mode and core mode.

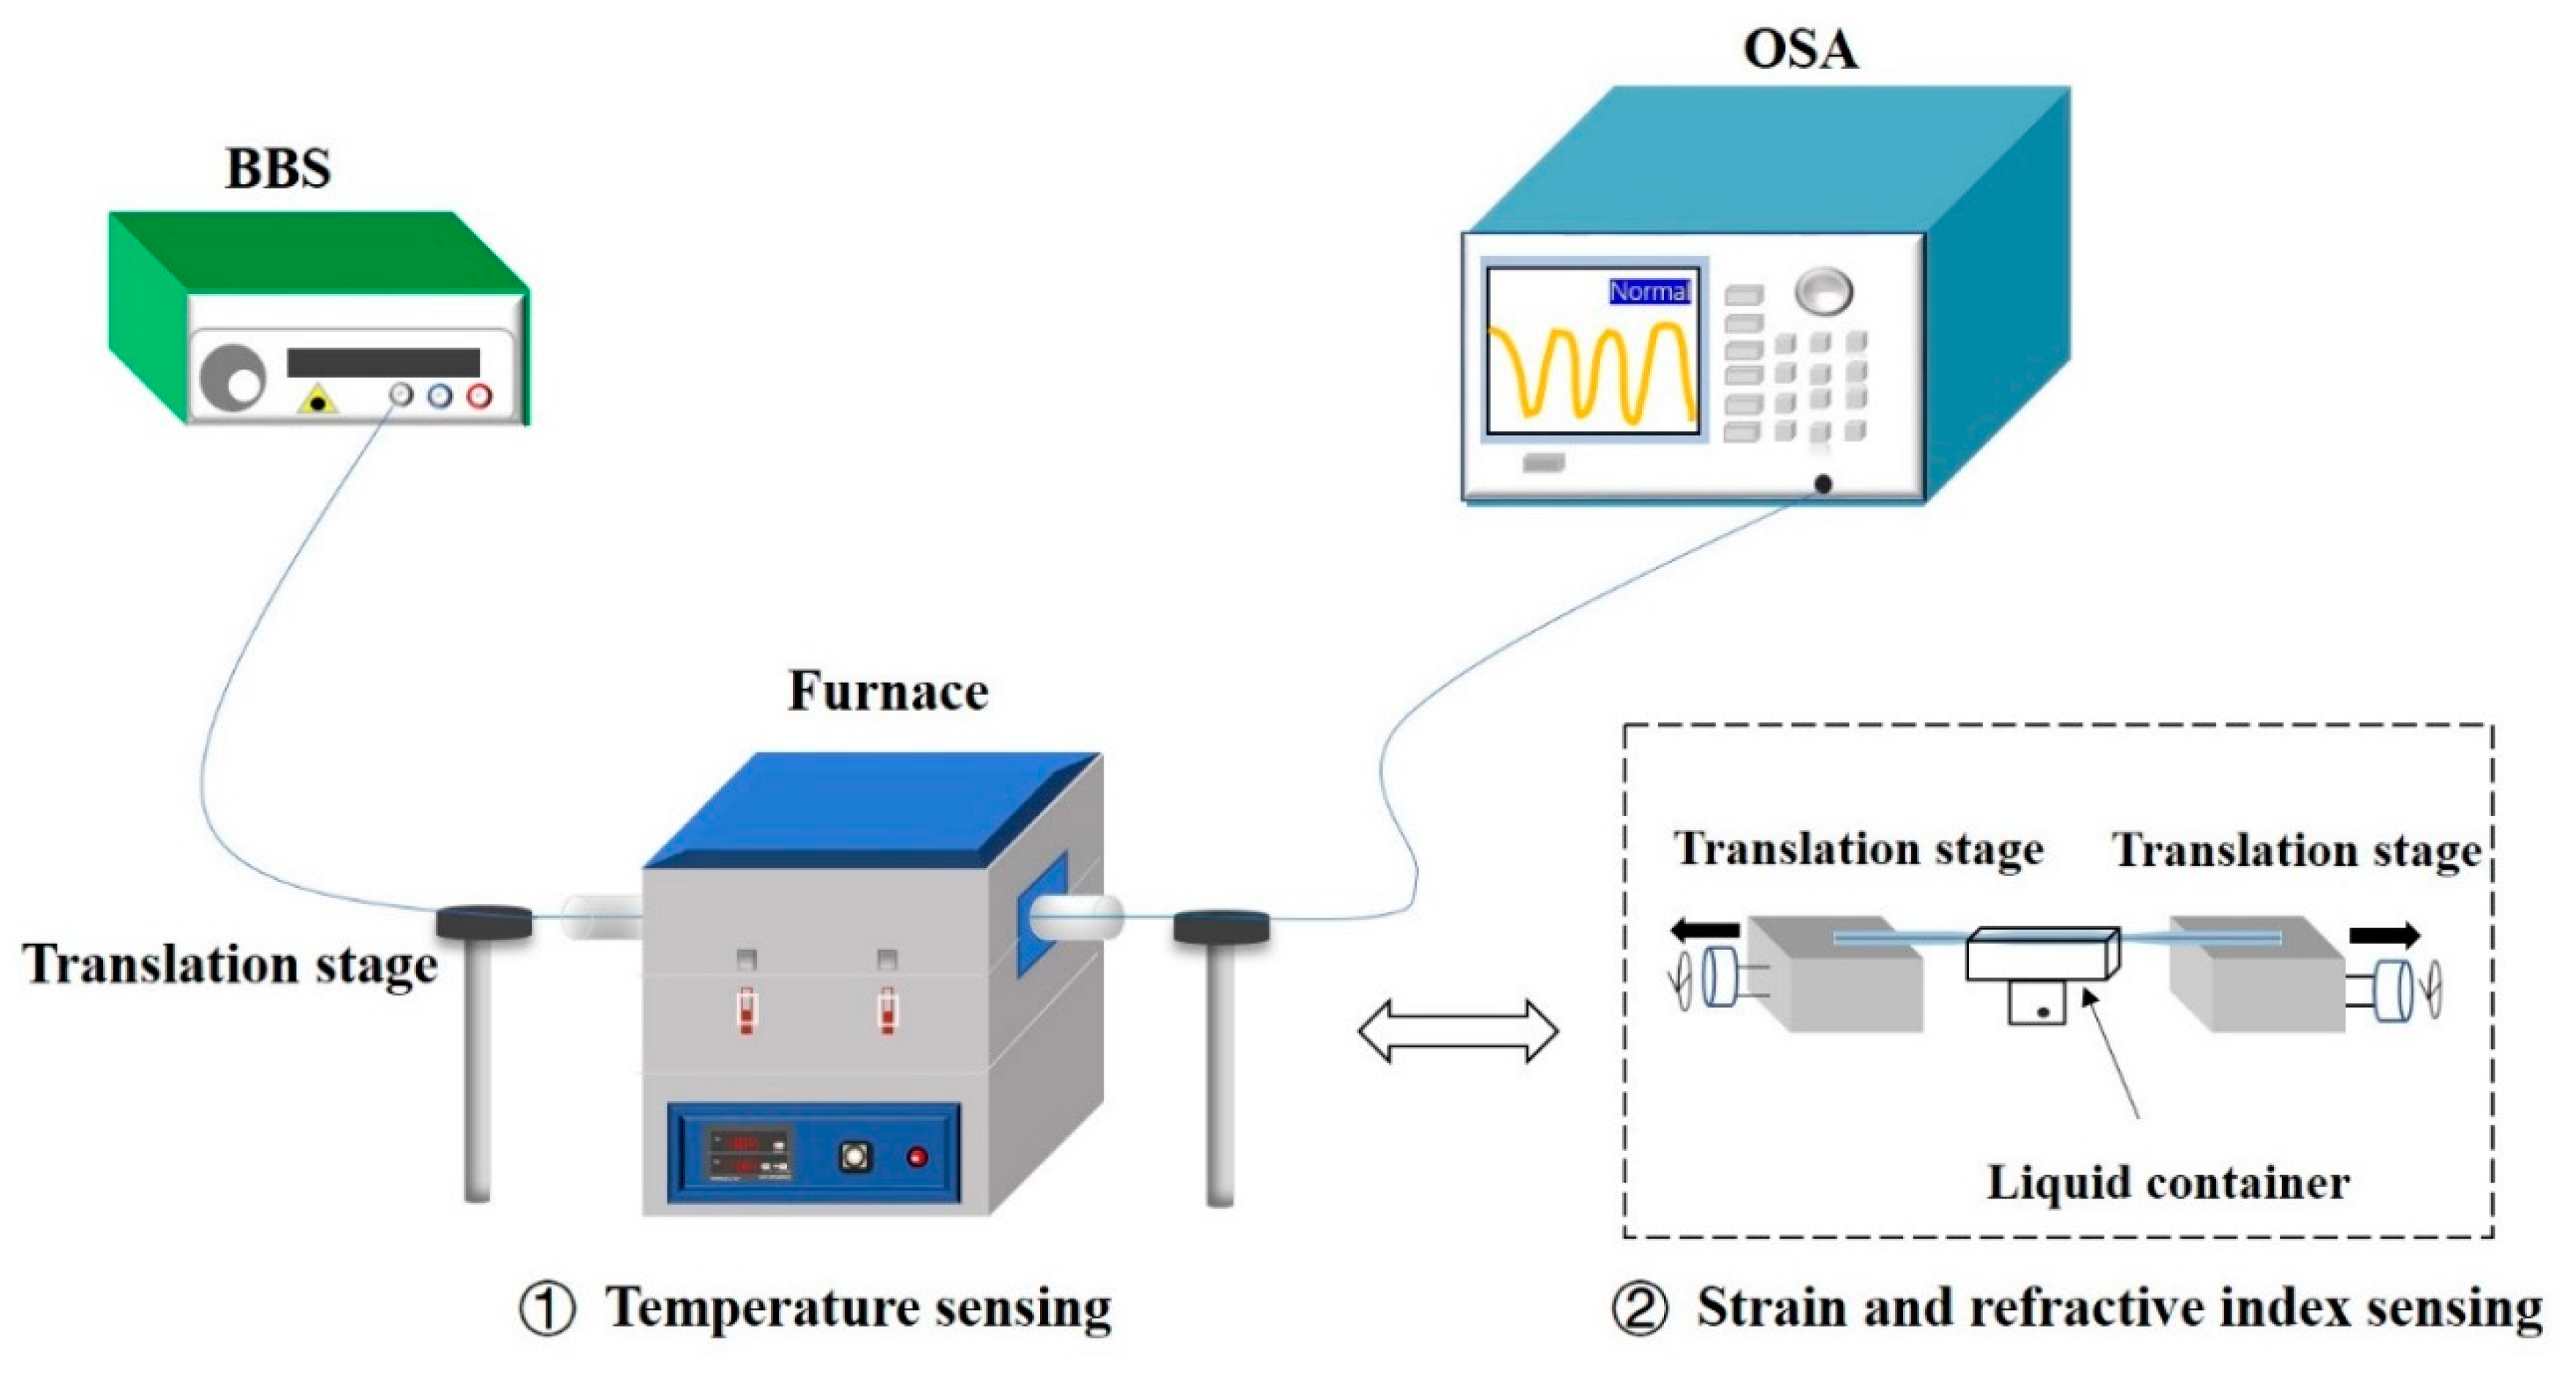
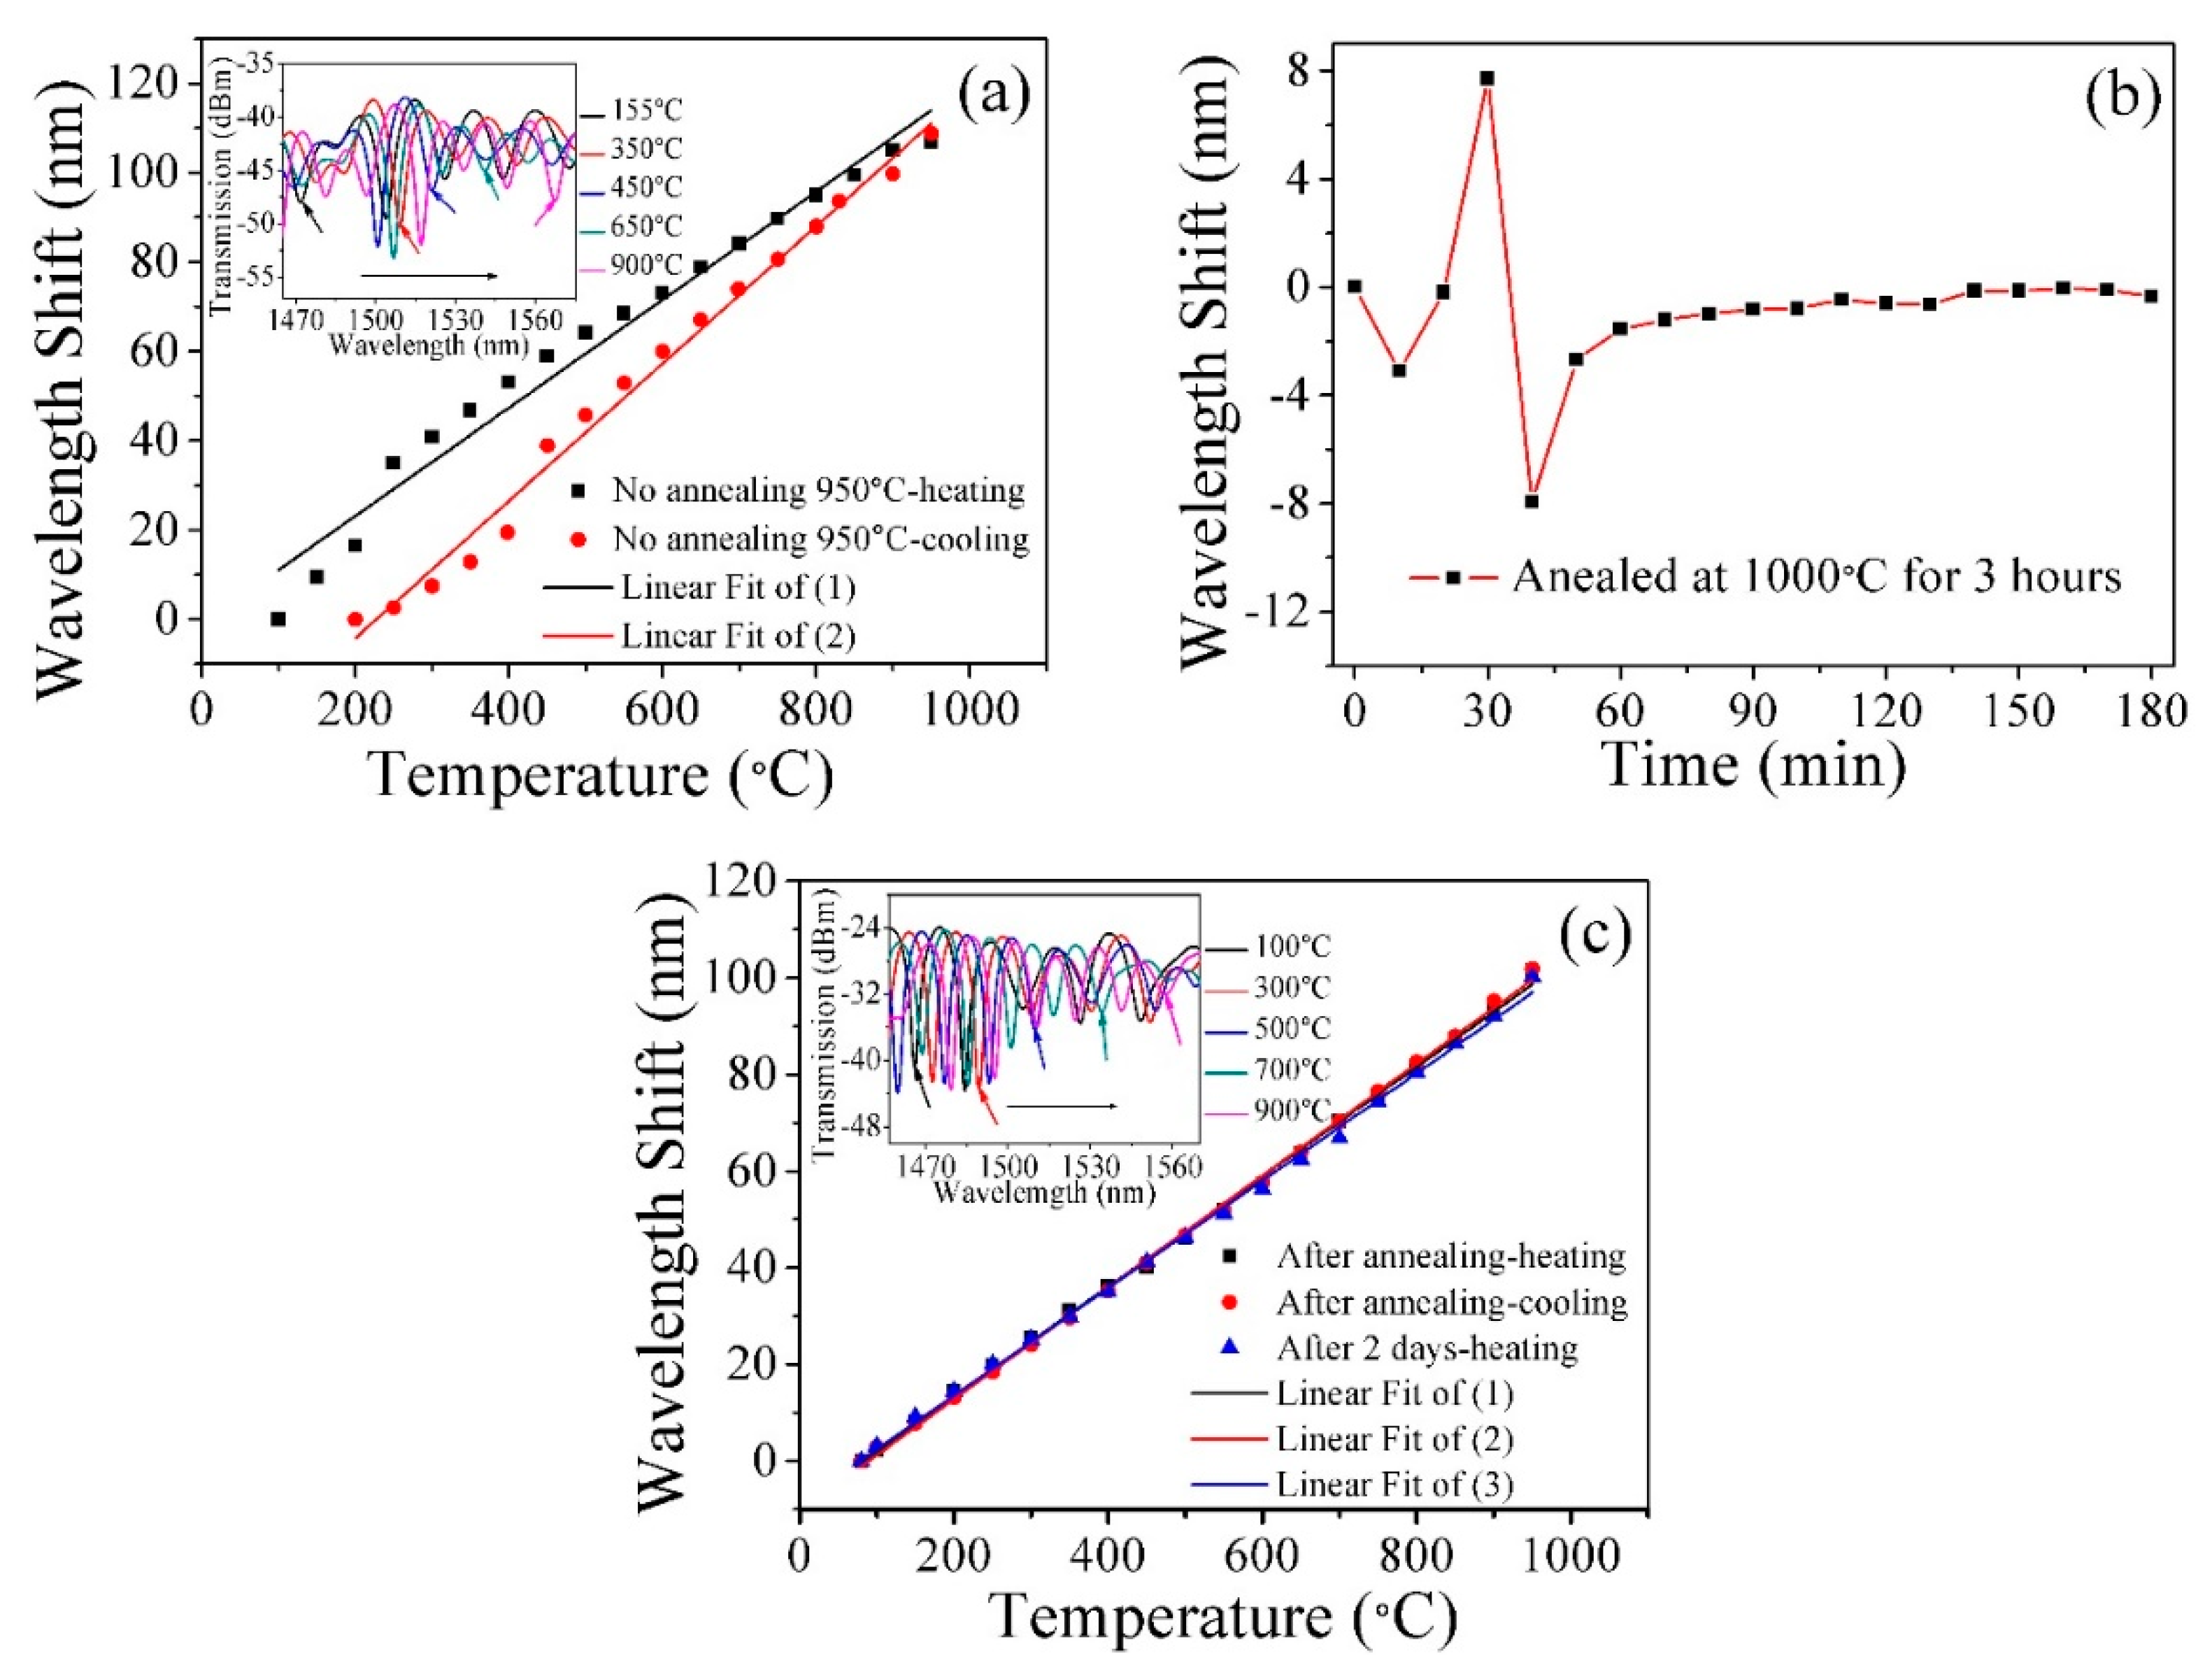
3. Experiments and Results
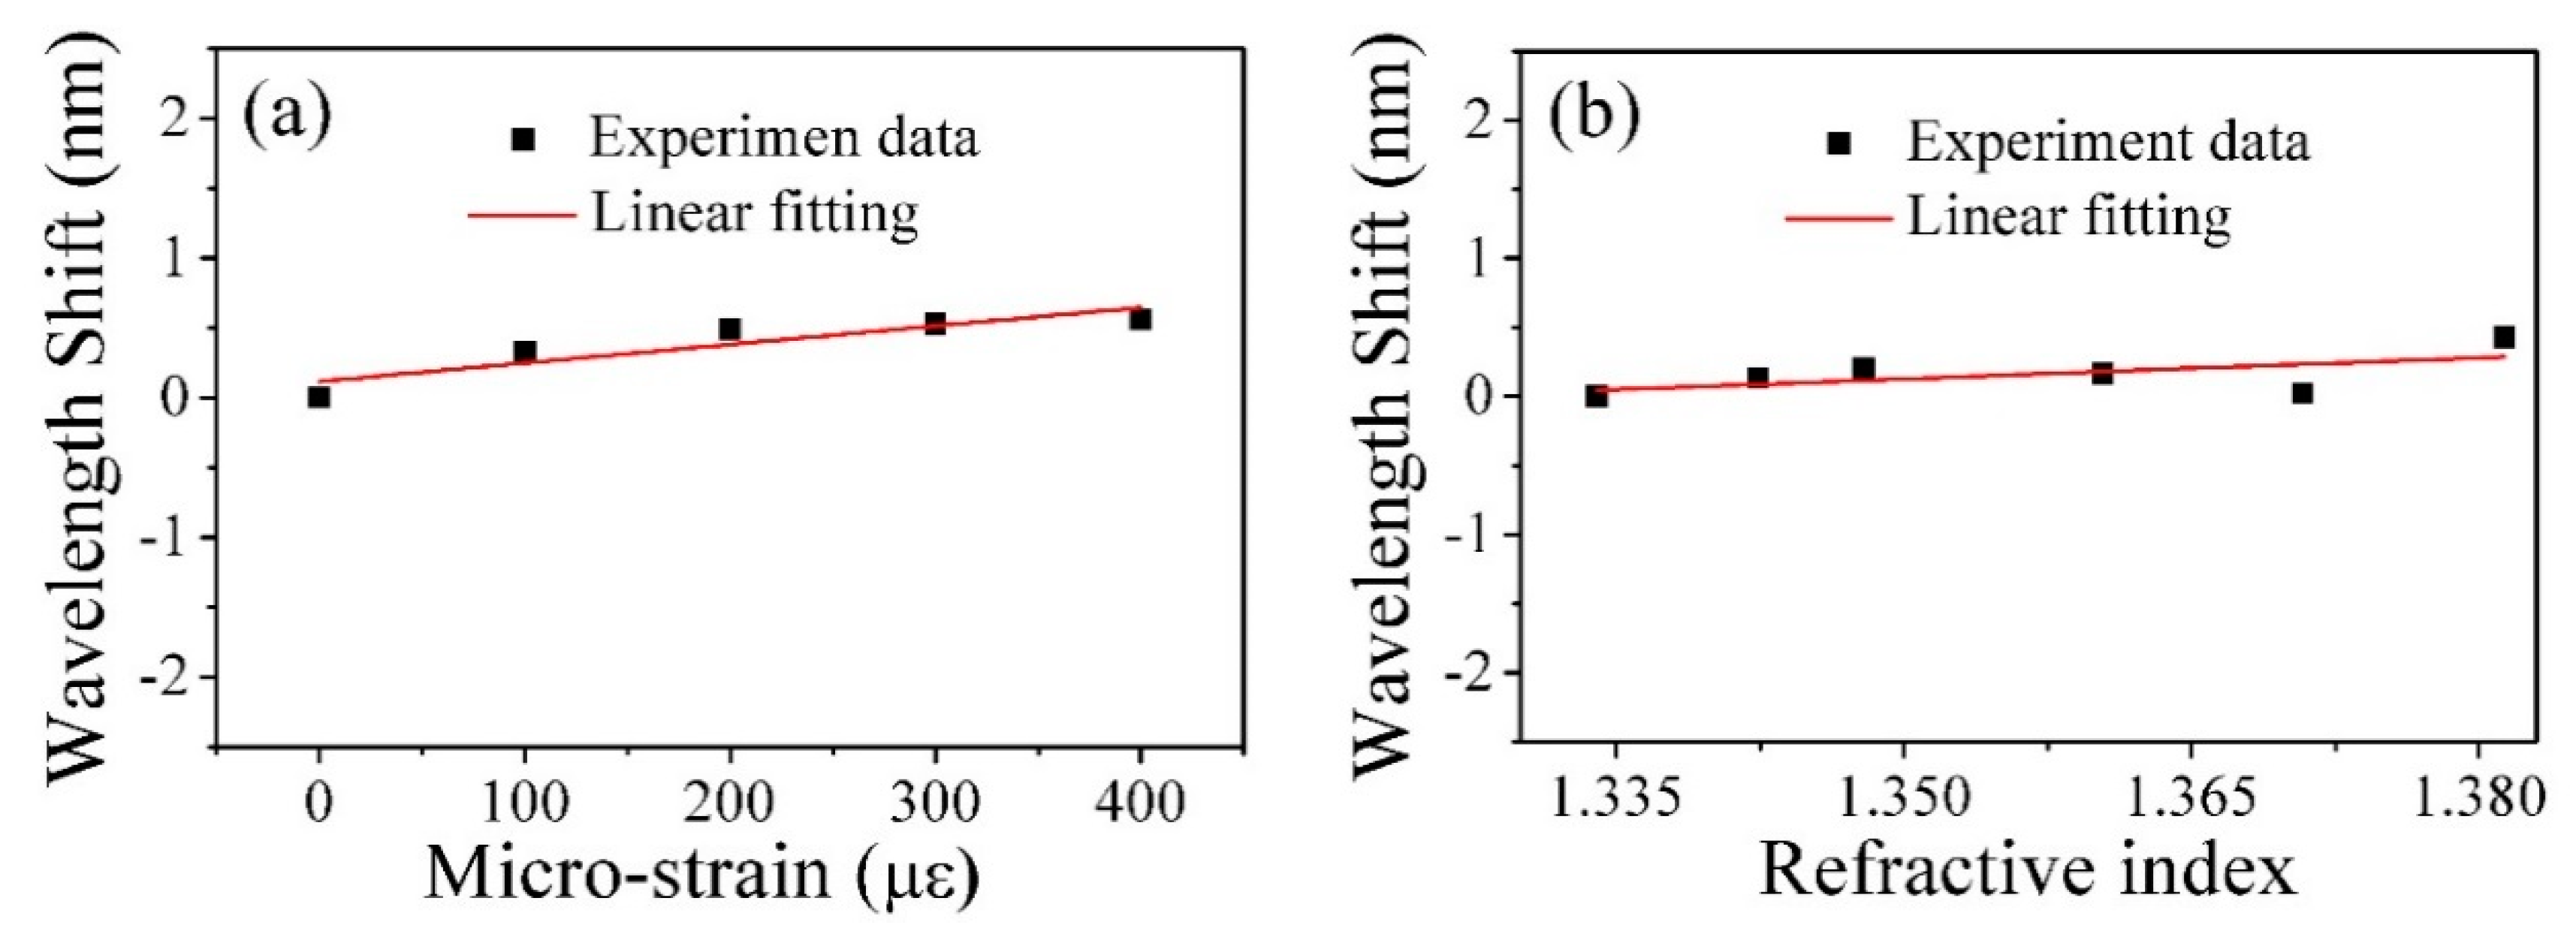
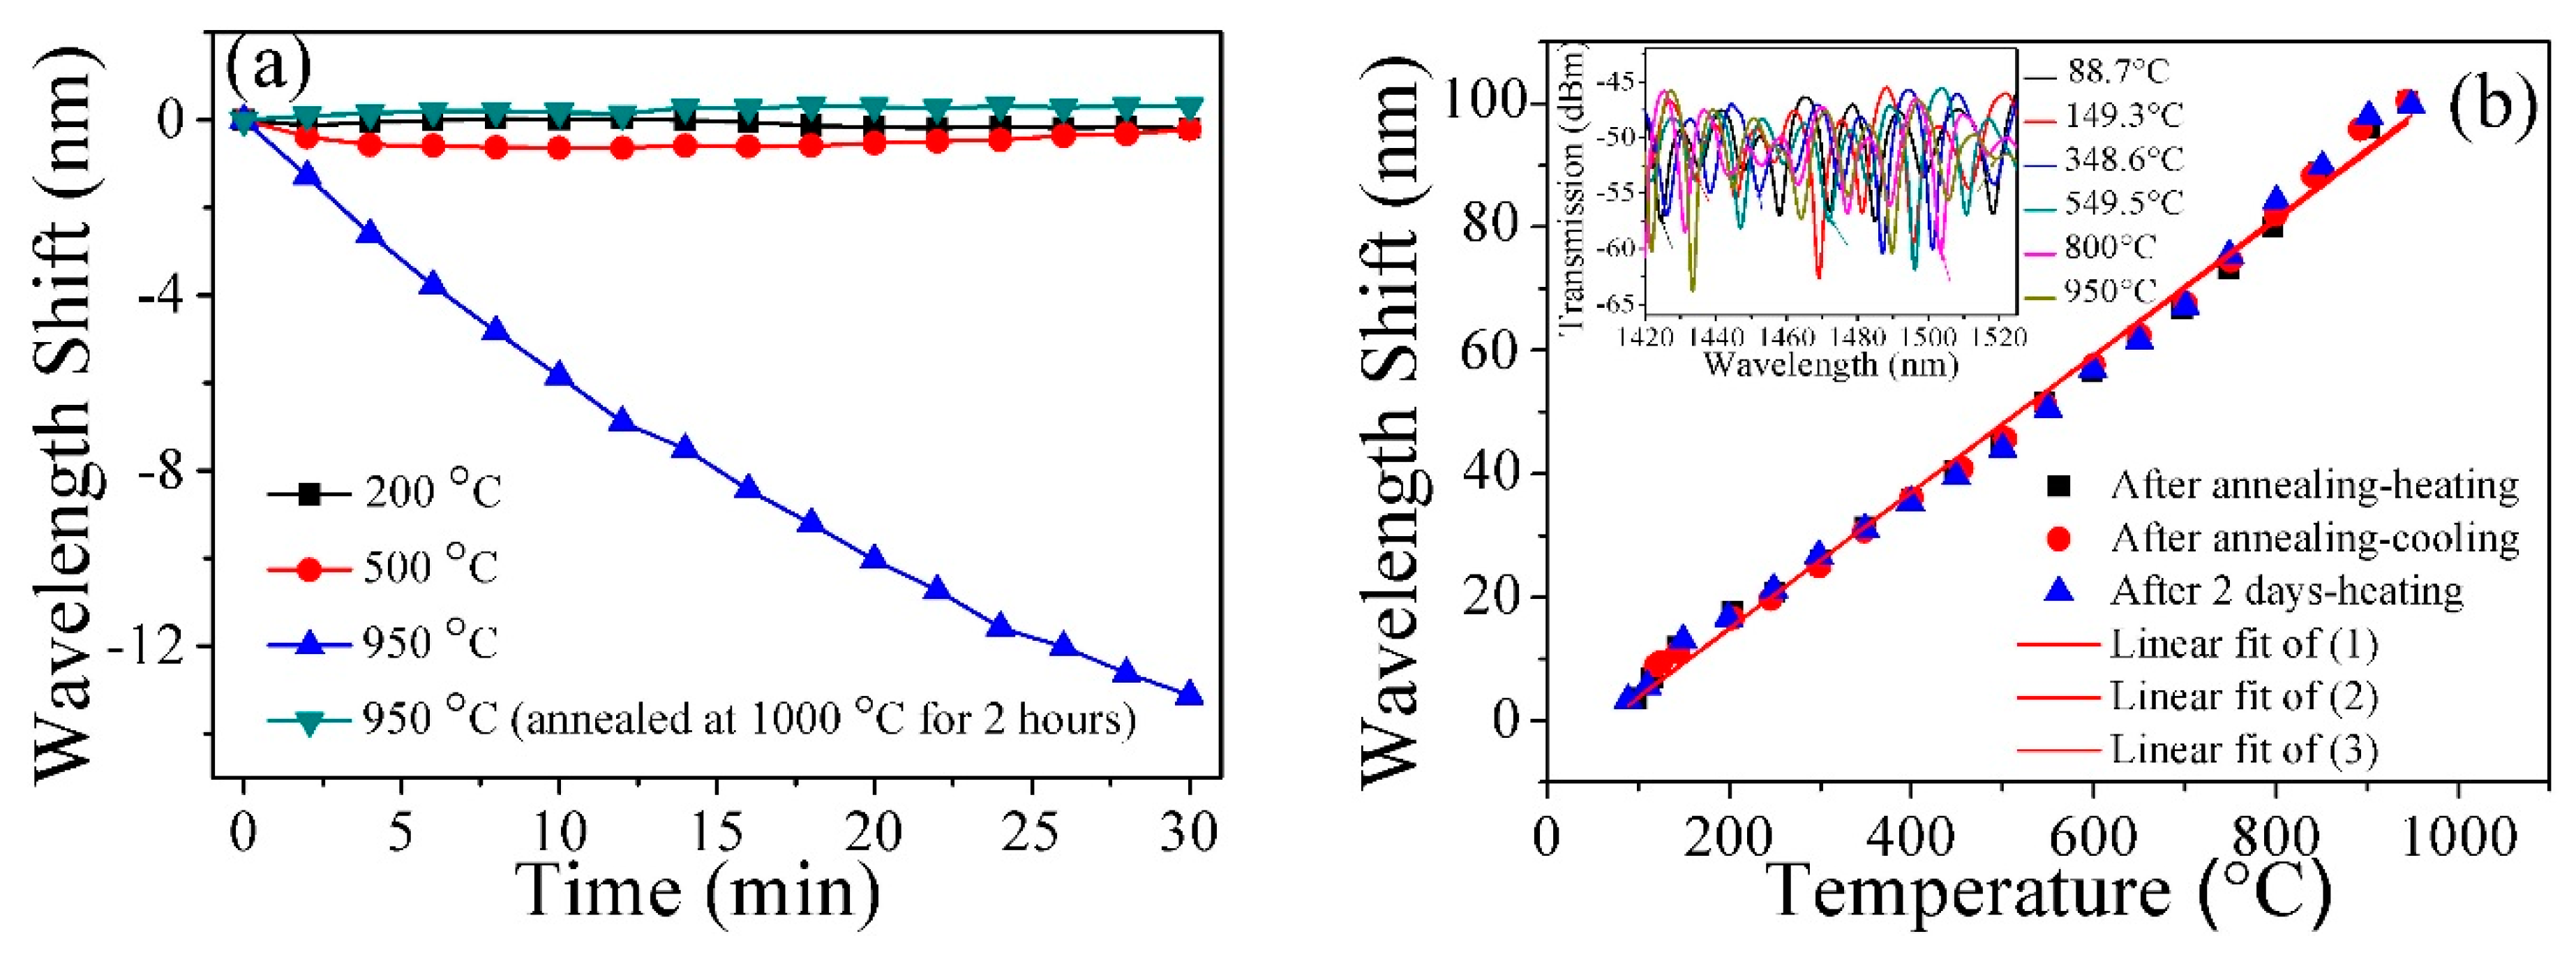
3.1. MZI Sensor

The manual operation of the arc-discharge of the fusion splicer (Fujikura 80c) was adopted in this study to fabricate two micro tapers in a single SMF (G652D), as show in Figure 3a. Firstly, the jacket at the middle of the SMF was removed; then, both ends of the optical fiber were fixed on the fusion splicer by two fiber clamps. Multiple arc-discharges were applied to the bare fiber, and pulled the bare fiber during arc-discharges. The size of the micro taper fiber (taper transition length and taper waist diameter) can be controlled with the precise control of arc-discharged time, power, and pulling step length. In our experiments, the arc-discharged time and power were set to 200 ms and 50 bit, respectively, and the step length was set to 500 μm. Figure 3b shows a microphotograph of the micro taper fiber made by the above method and parameters. An optical fiber MZI sensor can be fabricated by cascading two micro taper fibers, as shown in Figure 1. Figure 3c–e show the transmission spectra of the fabricated fiber MZI with lengths L of 1, 2, and 3 cm, respectively, at a fixed temperature of 30 °C. One can see that as the L increases, the intensity of interference dips increases. The corresponding Fourier space spectrum was obtained by a fast Fourier transform (FFT) of transmission spectrum. The spatial spectrogram with lengths L of 1, 2, and 3 cm are shown in Figure 3e. In addition, there is only one main peak in the Fourier spectrum. The spatial frequency of the main peaks with L = 1, 2, and 3 cm agrees well with that of the simulation results. We also considered the influence of waist diameter D on the extinction ratio of the structure. Figure 3f shows the measured Fourier space spectra with waist diameters of D = 50, 60, and 80 µm, respectively. According to the experimental results, with the same length L, the maximum amplitude of main peak was observed for the structure with D = 80 µm, where the extinction ratio of over 10 dB with D = 80 µm was observed in Figure 3c–e.
Figure 4 shows the experimental setup for temperature, strain, and RI measurements. The transmission spectra of the sensors were measured by using an SC-5-FC broadband light source (BBS) as an optical source and an optical spectrum analyzer (OSA, AQ6370) as a piece of demodulation equipment. In addition, the MZI sensor with a sandwiched SMF length of about L = 3 cm was selected for testing. Since the furnace used as a heat source in our experimental setup had a heat channel with a heating length of up to 20 cm, it was believed that the furnace could provide a uniform temperature distribution for our sensor with a sensor length of circa 3 cm.
The temperature response of the sensor was investigated without first annealing. As can be seen from Figure 5a, as the temperature increased from 100 to 950 °C, the spectral dip wavelength shifted to longer wavelengths and vice versa. However, the wavelength shift during cooling did not match with that of increasing temperature. This result indicates that the sensor isn’t stable within the temperature measurement range. Therefore, an annealing process on the sensor was applied to the sensor at a high temperature of 1000 °C for three hours, as shown in Figure 5b. Then, we used the annealed sensor to study the high-temperature sensing characteristics from 80 to 950 °C, as shown in Figure 5c. The results show that the wavelength shifts for both heating and cooling overlapped well with the sensitivities of 0.114 nm/°C and 0.116 nm/°C, respectively, indicating that the sensor has stable temperature measurements. After two days, we also performed a repetitive experiment, and the result overlapped well with the previous results sensitivity of 0.111 nm/°C, as show in Figure 5c.
Since the most common cross-sensitivity is caused by surrounding RI and strain applied to the sensor, the influence of RI and strain on the sensor’s spectral response was investigated, as shown in Figure 6. Figure 6a shows that the sensor has an RI sensitivity of 5.128 nm/refractive index unit (RIU), and Figure 6b shows that the sensor has a strain sensitivity of 1.33 pm/µε. Since the surrounding air of the sensor had a very low RI variation due to temperature, for example, at normal pressure, the refractive indexes of air were 1.00027 and 1.00029 at 0 °C and 20 °C, respectively; when the surrounding air has only 2 × 10⁻⁵ RI variations, the RI-induced wavelength shift was negligible. Hence, the air-induced RI variations have limited influence on the measurement accuracy for the temperature sensor. However, the temperature is sensitive to strain, which is a disadvantage of this type of sensor.

3.2. MZI Probe

In a real-life application, it is more convenient to use a probe-type sensor structure. The sensor fabrication method is similar as that illustrated in Section 3.1. The only difference is that only one micro taper is fabricated, and the sandwiched SMF is cut smoothly using a cleaver. A schematic diagram of an MZI probe based on the micro-fiber taper is shown in Figure 7a. The experimental setup of temperature measurement with the probe-type MZI is shown in Figure 7b. The incident light travels through the circulator to the sensor probe. At the end of the fiber sensor probe, due to the Fresnel reflection, the reflected light passes through the circulator again and is detected by an OSA. The advantage of the probe structure is that it can be inserted directly into the object or solution to be tested without being affected by strain. Four MZI probes were made, and the effects of the interference arms on the performance of the sensor probe were investigated using different arm lengths B = 1, 1.5, 2, and 3 cm. The diameter and micro taper length of the sensor were A = 80 μm and b = 500 μm, respectively. The corresponding transmission spectra are shown in Figure 8a–d, respectively. As the length of B increases, the fringe-free spectral range (FSR) decreases, and the extinction ratio of all probes also exceeds 10 dB.
A probe-type MZI with a length B of 2 cm was selected to test temperature response. As can be seen from Figure 9a, we measured the stability of the sensor at a constant temperature (200, 500, and 950 °C), each for 30 min. As shown in Figure 9a, the sensor had a wavelength shift of less than 0.3 nm at 200 °C and 500 °C, indicating the good stability of the sensor. However, when the temperature increased to 950 °C, the wavelength had a significant blue shift of 13.13 nm within 30 min, indicating that the sensor is not suitable for high temperature measurements. This problem can be addressed by an annealing process [29]. In our experiments, an annealing process at 950 °C for 2 h was conducted. It can be clearly seen that the wavelength had very small shifts (<0.3 nm) at 950 °C after annealing. The temperature response of the sensor after annealing is shown in Figure 9b, with the temperature varying from 89 to 950 °C. There are three measured curves in Figure 9b, namely the heating circle, the cooling circle, and the heating circle after 2 days. Linear fitting to the three measurement results were conducted, and the results show that temperature sensitivity of the three linear fittings are the same as 0.11 nm/°C, which is ten times as that of traditional Fiber Bragg gratings (FBG) and a single mode–multimode–single mode fiber [35]. The correlation coefficients R 2 of the linear fitting curves are 0.99433, 0.99388, and 0.99211, respectively, showing a good linearity of the results.

4. Conclusions

In this work, a novel micro taper in-line fiber MZI structure for temperature measurement was proposed and studied in both simulation and experiments. The sensor has a maximum temperature sensitivity of 0.116 nm/°C, with a good stability at 950 °C after a proper annealing process. The influence of surrounding RI and strain applied to the sensor was investigated, and the results demonstrated that the temperature sensitivity is independent to surrounding RI but sensitive to strain. An improved probe-type fiber MZI was proposed and experimentally investigated to overcome the strain sensitivity. The MZI probe after an annealing process has a temperature sensitivity as high as 0.11 nm/°C over a wide temperature range 89 °C~950 °C with good stability. The proposed in-line fiber MZI temperature sensor has the advantages of good reproducibility, simple manufacturing, a compact structure, and a wide measurement range.

Author Contributions

B.L. and Q.W. conceived the idea. Y.-C.L., B.L. and, Q.W. designed the experiments, carried out data analysis and co-wrote the main manuscript. Y.-C.L. carried out experimental investigation, B.L. carried out numerical simulations. B.L. supervised the project, S.-P.W., J.L. and X.F. co-supervised the project and participated in analysis of experimental results. X.-D.H., J.Y., and X.F. participated in data analysis, explanation of the results and revision of the manuscript. All authors reviewed the manuscript.

Funding

This research was funded by the National Natural Science Foundations of China (Grant No.11864025 and 61665007), Jiangxi provincial department of education science and technology project (Grant No. GJJ170609), and Nanchang Hangkong University graduate student innovation special fund project (Grant No. YC2018-S378), State Key Laboratory of Advanced Optical Communication Systems and Networks, Shanghai Jiao Tong University, China.

Conflicts of Interest

The authors declare no conflict of interest.

References

  1. Wang, Y. Review of long period fiber gratings written by CO2 laser. J. Appl. Phys. 2010, 108, 11–279. [Google Scholar] [CrossRef]
  2. Rao, Y.J.; Webb, D.J.; Jackson, D.A.; Zhang, L.; Bennion, I. High-resolution, wavelength-divisionmultiplexed in-fibre Bragg grating sensor system. Electron. Lett. 1996, 32, 924–926. [Google Scholar] [CrossRef]
  3. Cusano, A.; Paladino, D.; Iadicicco, A. Microstructured Fiber Bragg Gratings. J. Light. Technol. 2009, 27, 1663–1697. [Google Scholar] [CrossRef]
  4. Lee, B.H.; Kim, Y.H.; Park, K.S.; Eom, J.B.; Kim, M.J.; Rho, B.S.; Choi, H.Y. Interferometric fiber optic sensors. Sensors 2012, 12, 2467–2486. [Google Scholar] [CrossRef] [PubMed]
  5. Zhu, T.; Wu, D.; Liu, M.; Duan, D.W. In-line fiber optic interferometric sensors in single-mode fibers. Sensors 2012, 12, 10430–10449. [Google Scholar] [CrossRef] [PubMed]
  6. Wei, T.; Han, Y.; Tsai, H.L.; Xiao, H. Miniaturized fiber inline Fabry-Perot interferometer fabricated with a femtosecond laser. Opt. Lett. 2008, 33, 536–538. [Google Scholar] [CrossRef]
  7. Lee, C.L.; Ho, H.Y.; Gu, J.H.; Yeh, T.Y.; Tseng, C.H. Dual hollow core fiber-based Fabry-Perot interferometer for measuring the thermo-optic coefficients of liquids. Opt. Lett. 2015, 40, 459–462. [Google Scholar] [CrossRef]
  8. Liu, S.; Wang, Y.P.; Liao, C.R.; Wang, G.J.; Li, Z.Y.; Wang, Q.; Zhou, J.T.; Yang, K.M.; Zhong, X.Y.; Zhao, J.; et al. High-sensitivity strain sensor based on in-fiber improved Fabry-Perot interferometer. Opt. Lett. 2014, 39, 2121–2124. [Google Scholar] [CrossRef]
  9. Li, Z.Y.; Liao, C.R.; Wang, Y.P.; Xu, L.; Wang, D.N.; Dong, X.P.; Liu, S.; Wang, Q.; Yang, K.M.; Zhou, J.T. Highly-sensitive gas pressure sensor using twin-core fiber based in-line Mach-Zehnder interferometer. Opt. Express 2015, 23, 6673–6678. [Google Scholar] [CrossRef]
  10. Li, Z.Y.; Liao, C.R.; Song, J.; Wang, Y.; Zhu, F.; Dong, X.P. Ultrasensitive magnetic field sensor based on an in-fiber Mach-Zehnder interferometer with a magnetic fluid component. Photonics Res. 2016, 4, 197–201. [Google Scholar] [CrossRef]
  11. Wang, P.; Ni, K.; Wang, B.; Ma, Q.; Tian, W. Methylcellulose coated humidity sensor based on Michelson interferometer with thin-core fiber. Sens. Actuators A Phys. 2019, 288, 75–78. [Google Scholar] [CrossRef]
  12. Zhang, S.; Liu, Y.; Guo, H.; Zhou, A.; Yuan, L. Highly Sensitive Vector Curvature Sensor Based on Two Juxtaposed Fiber Michelson Interferometers with Vernier-Like Effect. IEEE Sens. J. 2019, 19, 2148–2154. [Google Scholar] [CrossRef]
  13. Xiao, S.; Wu, B.; Dong, Y.; Xiao, H.; Yao, S.; Jian, S. Strain and temperature discrimination using two sections of PMF in Sagnac interferometer. Opt. Laser Technol. 2019, 113, 394–398. [Google Scholar] [CrossRef]
  14. Wu, B.; Zhao, C.; Xu, B.; Li, Y. Optical fiber hydrogen sensor with single Sagnac interferometer loop based on vernier effect. Sens. Actuators B Chem. 2018, 255, 3011–3016. [Google Scholar] [CrossRef]
  15. Wang, X.; Wang, Q. A High-Birefringence Microfiber Sagnac-Interferometer Biosensor Based on the Vernier Effect. Sensors 2018, 18, 4114. [Google Scholar] [CrossRef] [PubMed]
  16. Tian, Z.; Yam, S.S.H.; Barnes, J.; Bock, W.; Greig, P.; Fraser, J.M.; Loock, H.P.; Oleschuk, R.D. Refractive Index Sensing With Mach–Zehnder Interferometer Based on Concatenating Two Single-Mode Fiber Tapers. IEEE Photonics Technol. Lett. 2008, 20, 626–628. [Google Scholar] [CrossRef]
  17. Tian, Z.; Yam, S.H. In-line abrupt taper optical fiber Mach-Zehnder interferometric strain sensor. IEEE Photonics Technol. Lett. 2009, 21, 161–163. [Google Scholar] [CrossRef]
  18. Lu, P.; Men, L.; Sooley, K.; Chen, Q. Tapered fiber Mach–Zehnder interferometer for simultaneous measurement of refractive index and temperature. Appl. Phys. Lett. 2009, 94, 13110. [Google Scholar] [CrossRef]
  19. Wu, D.; Zhu, T.; Deng, M.; Duan, D.W.; Shi, L.L.; Yao, J.; Rao, Y.J. Refractive index sensing based on Mach-Zehnder interferometer formed by three cascaded single-mode fiber tapers. Appl. Opt. 2011, 50, 1548. [Google Scholar] [CrossRef]
  20. Zhang, S.; Zhang, W.; Gao, S.; Geng, P.; Xue, X. Fiber-optic bending vector sensor based on Mach-Zehnder interferometer exploiting lateral-offset and up-taper. Opt. Lett. 2012, 37, 4480–4482. [Google Scholar] [CrossRef]
  21. Li, L.; Xia, L.; Xie, Z.; Liu, D. All-fiber Mach-Zehnder interferometers for sensing applications. Opt. Express 2012, 20, 11109–11120. [Google Scholar] [CrossRef] [PubMed]
  22. Nguyen, L.V.; Hwang, D.; Moon, S.; Moon, D.S.; Chung, Y. High temperature fiber sensor with high sensitivity based on core diameter mismatch. Opt. Express 2008, 16, 11369–11375. [Google Scholar] [CrossRef] [PubMed]
  23. Zhao, N.; Lin, Q.; Jing, W.; Jiang, Z.; Wu, Z.; Yao, K.; Tian, B.; Zhang, Z.; Shi, P. High temperature high sensitivity Mach–Zehnder interferometer based on waist-enlarged fiber bitapers. Sens. Actuators A Phys. 2017, 267, 491–495. [Google Scholar] [CrossRef]
  24. Wu, Q.; Semenova, Y.; Wang, P.; Farrell, G. High sensitivity SMS fiber structure base refractometer – analysis and experiment. Opt. Express 2011, 19, 7937–7944. [Google Scholar] [CrossRef] [PubMed]
  25. Wu, C.; Fu, H.Y.; Qureshi, K.K.; Guan, B.O.; Tam, H.Y. High-pressure and high-temperature characteristics of a Fabry-Perot interferometer based on photonic crystal fiber. Opt. Lett. 2011, 36, 412–414. [Google Scholar] [CrossRef] [PubMed]
  26. Wu, J.; Miao, Y.; Song, B.; Lin, W.; Zhang, K.; Zhang, H.; Liu, B.; Yao, J. Simultaneous measurement of displacement and temperature based on thin-core fiber modal interferometer. Opt. Commun. 2015, 340, 136–140. [Google Scholar] [CrossRef]
  27. Wu, Q.; Semenova, Y.; Wang, P.; Farrell, G. A comprehensive analysis verified by experiment of a refractometer based on an SMF28- Small-Core Singlemode fiber (SCSMF) -SMF28 fiber structure. J. Opt. 2011, 13, 125401. [Google Scholar] [CrossRef]
  28. Gu, B.; Yin, M.J.; Zhang, A.P.; Qian, J.W.; He, S. Low-cost high-performance fiber-optic pH sensor based on thin-core fiber modal interferometer. Opt. Express 2009, 17, 22296. [Google Scholar] [CrossRef] [PubMed]
  29. Liu, D.; Wu, Q.; Mei, C.; Yuan, J.; Xin, X.; Mallik, A.K.; Wei, F.; Han, W.; Kumar, R.; Yu, C.; et al. Hollow Core Fiber Based Interferometer for High-Temperature (1000 °C) Measurement. J. Light. Technol. 2018, 36, 1583–1590. [Google Scholar] [CrossRef]
  30. Li, Y.; Liu, Z.; Jian, S. Multimode interference refractive index sensor based on coreless fiber. Photonic Sens. 2014, 4, 21–27. [Google Scholar] [CrossRef]
  31. Antonio-Lopez, J.E.; Eznaveh, Z.S.; LiKamWa, P.; Schülzgen, A.; Amezcua-Correa, R. Multicore fiber sensor for high-temperature applications up to 1000°C. Opt. Lett. 2014, 39, 4309. [Google Scholar] [CrossRef] [PubMed]
  32. Yin, B.; Yang, L.; Liu, Z.-B.; Feng, S.; Bai, Y.; Xu, Y.; Jian, S. Investigation on a compact in-line multimode-single-mode-multimode fiber structure. Opt. Laser Technol. 2016, 80, 16–21. [Google Scholar] [CrossRef]
  33. Zhou, S.; Huang, B.; Shu, X. A multi-core fiber based on interferometer for high temperature sensing. Meas. Sci. Technol. 2017, 28, 045107. [Google Scholar] [CrossRef]
  34. Shao, M.; Qiao, X.; Fu, H.; Li, H.; Zhao, J.; Li, Y. A Mach–Zehnder interferometric humidity sensor based on waist-enlarged tapers. Opt. Lasers Eng. 2014, 52, 86–90. [Google Scholar] [CrossRef]
  35. Wu, Q.; Hatta, A.M.; Semenova, Y.; Farrell, G. Use of a SMS fiber filter for interrogating FBG strain sensors with dynamic temperature compensation. Appl. Opt. 2009, 48, 5451–5458. [Google Scholar] [CrossRef]
Figure 1. Schematic diagram of the micro taper in-line fiber Mach–Zehnder interferometer (MZI).
Applsci 09 02394 g001
Figure 2. (a) The simulated spectral response of the fiber MZI with arm lengths L of 1, 2, and 3 cm, respectively; (b) the corresponding spatial frequency; (c,d) the distributions of the optical field and the normalized optical intensity propagating along the MZI with an arm length of 3 cm at dip a 1571.2 nm and peak b 1578.8 nm.
Applsci 09 02394 g002
Figure 3. (a) Schematic diagram of the micro taper structure fabrication process; (b) the photo under microscope; (ce) the spectral responses with a sandwiched single mode fiber (SMF) length of 1, 2, and 3 cm, respectively; (f) the fast Fourier transform (FFT) spatial frequency spectra with arm lengths of 1, 2, and 3 cm, respectively. (g) The FFT spatial frequency spectra with waist diameters of 50, 60, and 80 μm, respectively.
Applsci 09 02394 g003
Figure 4. Schematic diagram of experimental setup for temperature, strain, and refractive index (RI) measurements.
Applsci 09 02394 g004
Figure 5. Wavelength shift versus temperature for the MZI-based sensor (L = 3 cm): (a) Wavelength shift of a sensor with no-annealing process. (b) The corresponding stability test in 3 h before and after the annealing process at 1000 °C. (c) The same dip was chosen for annealing processes and in the inset an example of the temperature shifting of the sensor after annealing at 1000 °C for 3 h.
Applsci 09 02394 g005
Figure 6. (a) Relationship between micro-stain and wavelength. (b) Relationship between RI and wavelength.
Applsci 09 02394 g006
Figure 7. (a) Schematic diagram of the probe-type MZI. (b) Experimental setup. The inset figure is the optical microscope image of the probe-type MZI. BBS: Broadband source; OSA: Optical spectrum analyzer; SMF: Single mode fiber.
Applsci 09 02394 g007
Figure 8. The transmission spectra of the proposed probe-type MZI with different B (interference length); (ad) are 1, 1.5, 2, and 3 cm, respectively.
Applsci 09 02394 g008
Figure 9. (a) Probe-type MZI-based sensor (B = 2 cm) stability test; (b) wavelength shift of the sensor during the heating and cooling of the after annealing. The inset figure is the temperature response of interference spectra from 89 to 950 °C.
Applsci 09 02394 g009

