Article

Predicting Behavior of Grouted Dowel Connections Using Interfacial Cohesive Elements

1
NTH Consultants Ltd., Northville, MI 48168, USA
2
Department of Civil and Environmental Engineering, Western University, London, ON N6A 5B9, Canada
3
Department of Civil and Environmental Engineering, University of Windsor, Windsor, ON N9B 3P4, Canada
*
Author to whom correspondence should be addressed.
Appl. Sci. 2019, 9(11), 2344; https://doi.org/10.3390/app9112344
Submission received: 9 May 2019 / Revised: 24 May 2019 / Accepted: 31 May 2019 / Published: 7 June 2019
(This article belongs to the Section Civil Engineering)

Abstract

:
Grouted dowel connections are used extensively in precast load bearing walls owing to their simple construction and forgiving tolerances. Current design guidelines do not adequately consider the composite nature of such connections. Moreover, robust numerical models for these connections are yet to be developed. Therefore, a finite element model of grouted dowel connections was developed in this paper. The model adopts a phenomenological bond–slip constitutive law to predict the load versus slip response of grouted bars and considers tensile yielding of the reinforcement. The local bond–slip law used was generated from carefully designed experiments to eliminate spurious effects associated with bond testing. The model was validated using experimental results on grouted connections, as well as data retrieved from the open literature. Excellent agreement between experimental and numerical results was observed, highlighting the accuracy of the model in depicting interfacial stresses of the assembly. The model requires simple calibration, is computationally efficient, and can accurately simulate the failure behavior of bars embedded in grouted connections.

1. Introduction and Background

Grouted reinforcing bar connections, or simply grouted connections are ties having a wide variety of applications in the precast construction industry. When used in the context of precast load bearing walls, these connections are attractive owing to eliminating field welding and providing a straight force path extending along the height of a precast wall. The connection comprises a single large-diameter reinforcing bar grouted inside a corrugated metallic sleeve using a non-shrink high-strength cementitious grout with a flowing consistency. A schematic diagram of grouted connections is shown in Figure 1. Under current guidelines of the American Concrete Institute ACI 318-14 [1], grouted connections are treated as a bar in concrete and designed after the development length in tension clauses disregarding the composite action of the sleeve. The corrugated duct, which in the presence of a concrete matrix facilitates longitudinal stress transfer, exerts a uniform compressive field unto the grout, restraining it from splitting failures. Previous experimental observations [2,3,4,5,6,7,8,9] highlighted this composite nature and indicated clear deviation from the assumed code treatment. Although several recently published studies provided experimental evidence for this disparity, limited information was found in the open literature addressing the numerical modeling of grouted connections, particularly on how models can be implemented into finite element simulations. Most of the proposed models were presented in relation to their respective author’s experimental work without extension to other available experimental data and lacked dedicated analytical treatments to address grouted connections specifically.
For instance, Raynor et al. [10] modeled the connections using a simple one-dimensional model, where the mechanical bearing of the bar was simulated using a series of bond springs. The model emulated the experimental results with reasonable accuracy; however, it did not physically consider the effect of the sleeve, nor did it take into consideration the interaction between the connection and the surrounding concrete. A similar approach was recently conducted by Zhou et al. [11], where the bond between the stainless steel and grout bound by corrugated ducts was modeled using experimentally derived phenomenological models, the results of which were implemented into a series of bond springs, and the outputs were corroborated with experimental results.
Ameli and Pantelides [12] and Wang et al. [13] modeled precast column–footing connections using force-based fiber beam–column elements to assess their seismic post-yield behavior. In the former study, the steel bar was discretized, and bond springs were used to model slippage of the bars, whereas, in the latter, connections were modeled by modifying the steel constitutive model of the bars. No details were provided on the implementation of such models. The common factor among both studies is the scale of the model, which was more geared to mimicking the global response of the subject assemblies, while the local behavior of the connections was not the focus. Most recently, Kuang and Zheng [14] presented a three-dimensional (3D) finite element (FE) model of grouted in-line splice connectors. The complex geometry of the bars and the sleeve ribs were not modeled, and the bond–slip behavior of the bars was disregarded based on insignificant slip values observed during experimental testing. In other words, they assumed perfect bond between the bar and surrounding grout, which is not the case in grouted corrugated duct connections. Additionally, Li et al. [15] used an inverse analysis technique to derive a multi-linear bond–slip law based on FE simulations of pull-out tests.
While these models compared well with their respective experimental results, several problems restrict their implementation. Firstly, these models were one-dimensional and disregarded the radial and circumferential transfer of stresses, thus limiting their usefulness to the micro-scale of the connection. Secondly, they relied on phenomenological models developed with a unique specimen form. Due to the sensitivity of bond to several factors including the experimental form of the test set-up, analytical models derived thereof cannot be generalized. This is also reflected in the fact that most of the corroborative efforts of such models are confined to the experimental findings of their respective authors. Moreover, these efforts were not sufficiently detailed to allow for their extension and implementation into a generic 3D model that can be used to model full-scale structures.
Modeling the bond-–slip between a reinforcing bar and the surrounding concrete is of special importance in jointed regions, where the effects of slip and strain penetration can be detrimental to the rotational capacity of the joint. Several methodologies with varying degrees of complexity are currently available in the literature to model such bond–slip interactions [16,17,18,19,20,21]. Some authors presented a fiber-section frame element model that takes into account slippage of the bar and subsequent bond degradations [16,17]. Cho and Pinchiera [18] used rotational springs to model the rotation of column joints due to slippage of bars in column splices and used the model to calculate the required lap splice length to sufficiently develop the bars. Others presented detailed non-linear 3D continuum models that explicitly modeled the geometry of the deformations and its bearing on the concrete keys [19,20,21]. The merit of such detailed models is that they can be used to conduct investigative studies on bond interactions between reinforcing bars and concrete, provided that adequate damage parameters are included in the model. However, considering their high computational cost, detailed non-linear 3D continuum models of complete reinforced concrete structures are deemed unpractical.
In most recent efforts to model bond–slip, researchers resorted to interfacial elements that can be defined between the reinforcing bar and the concrete [22,23,24,25,26]. These interfacial elements have constitutive relationships through which the characteristics of the bond–slip relationship of the assembly can be implemented. Input to such interface models would be the bond–slip relationship represented in interfacial elements through equivalent stress vs. displacement of the bar in the longitudinal direction.
In most recent efforts, several researchers proposed interfacial elements for use in a finite element (FE) platform. Cox and Hermann [22] were amongst the earliest researchers who presented an element that utilizes an elastoplastic treatment for the bond stress–displacement relationship at the bar–concrete interface. This treatment modeled the effect of the normal stress on the bond stress via a yield function, while the shear dilatation caused by the bar ribs was accounted for using a non-associated flow rule. The validation of the model was carried out using a series of pull-out tests, which highlighted the accuracy and computational efficiency of the model [23]. A similar model was published by Lundgren and Magnusson [24], who proposed 3D interfacial elements with a different elastoplastic constitutive law to model the bond–slip behavior in FE simulations.
The studies by Lowes et al. [25] and Murcia-Delso and Shing [26] are different from those discussed above, in the sense that they utilized a phenomenological bond–slip law in their element formulations. Such phenomenological models were based on experimental observations, similar to that developed by Eligehausen et al. [27], where a basic bond–slip relationship was modified by parameters that account for various effects, such as strain in bar, damage to the concrete, and bar spacing. This methodology is generally more efficient than the plasticity-based formulation discussed above. Unlike plasticity models where iterations are required to calculate stresses at the interface, phenomenological models calculate interfacial bond stresses directly for a given slip increment. The model presented by Lowes et al. [16] relied on data from neighboring concrete elements to calculate damage parameters and update the bond stresses for a given bar slip. This interdependency, which involves an iterative approach, complicates the implementation of this interfacial model in an FE platform. The formulation presented by Murcia-Delso and Shing [26] does not involve an iterative solution; however, their phenomenological model was based on experimental observations made on bars embedded in well-confined concrete, although tensile cracking in the concrete block was reported. In an experimental investigation conducted by the authors on grouted connections [3], splitting failures were not observed inside the grout cylinder.
Accordingly, to allow accurate numerical depiction of the behavior of grouted connections for modeling applications, the present paper discuses a new interfacial formulation to model grouted connections. The model simulates the behavior of reinforcing bars bound by grouted metallic sleeves using a phenomenological bond–slip derived from a carefully conducted set of experiments, which eliminates superficial compression associated with bond testing. The interface model was implemented using cohesive element formulation in the FE analysis program LS-DYNA and was validated using experimental data from three different studies. Discussion of the different material constitutive laws and validation examples are presented in subsequent sections.

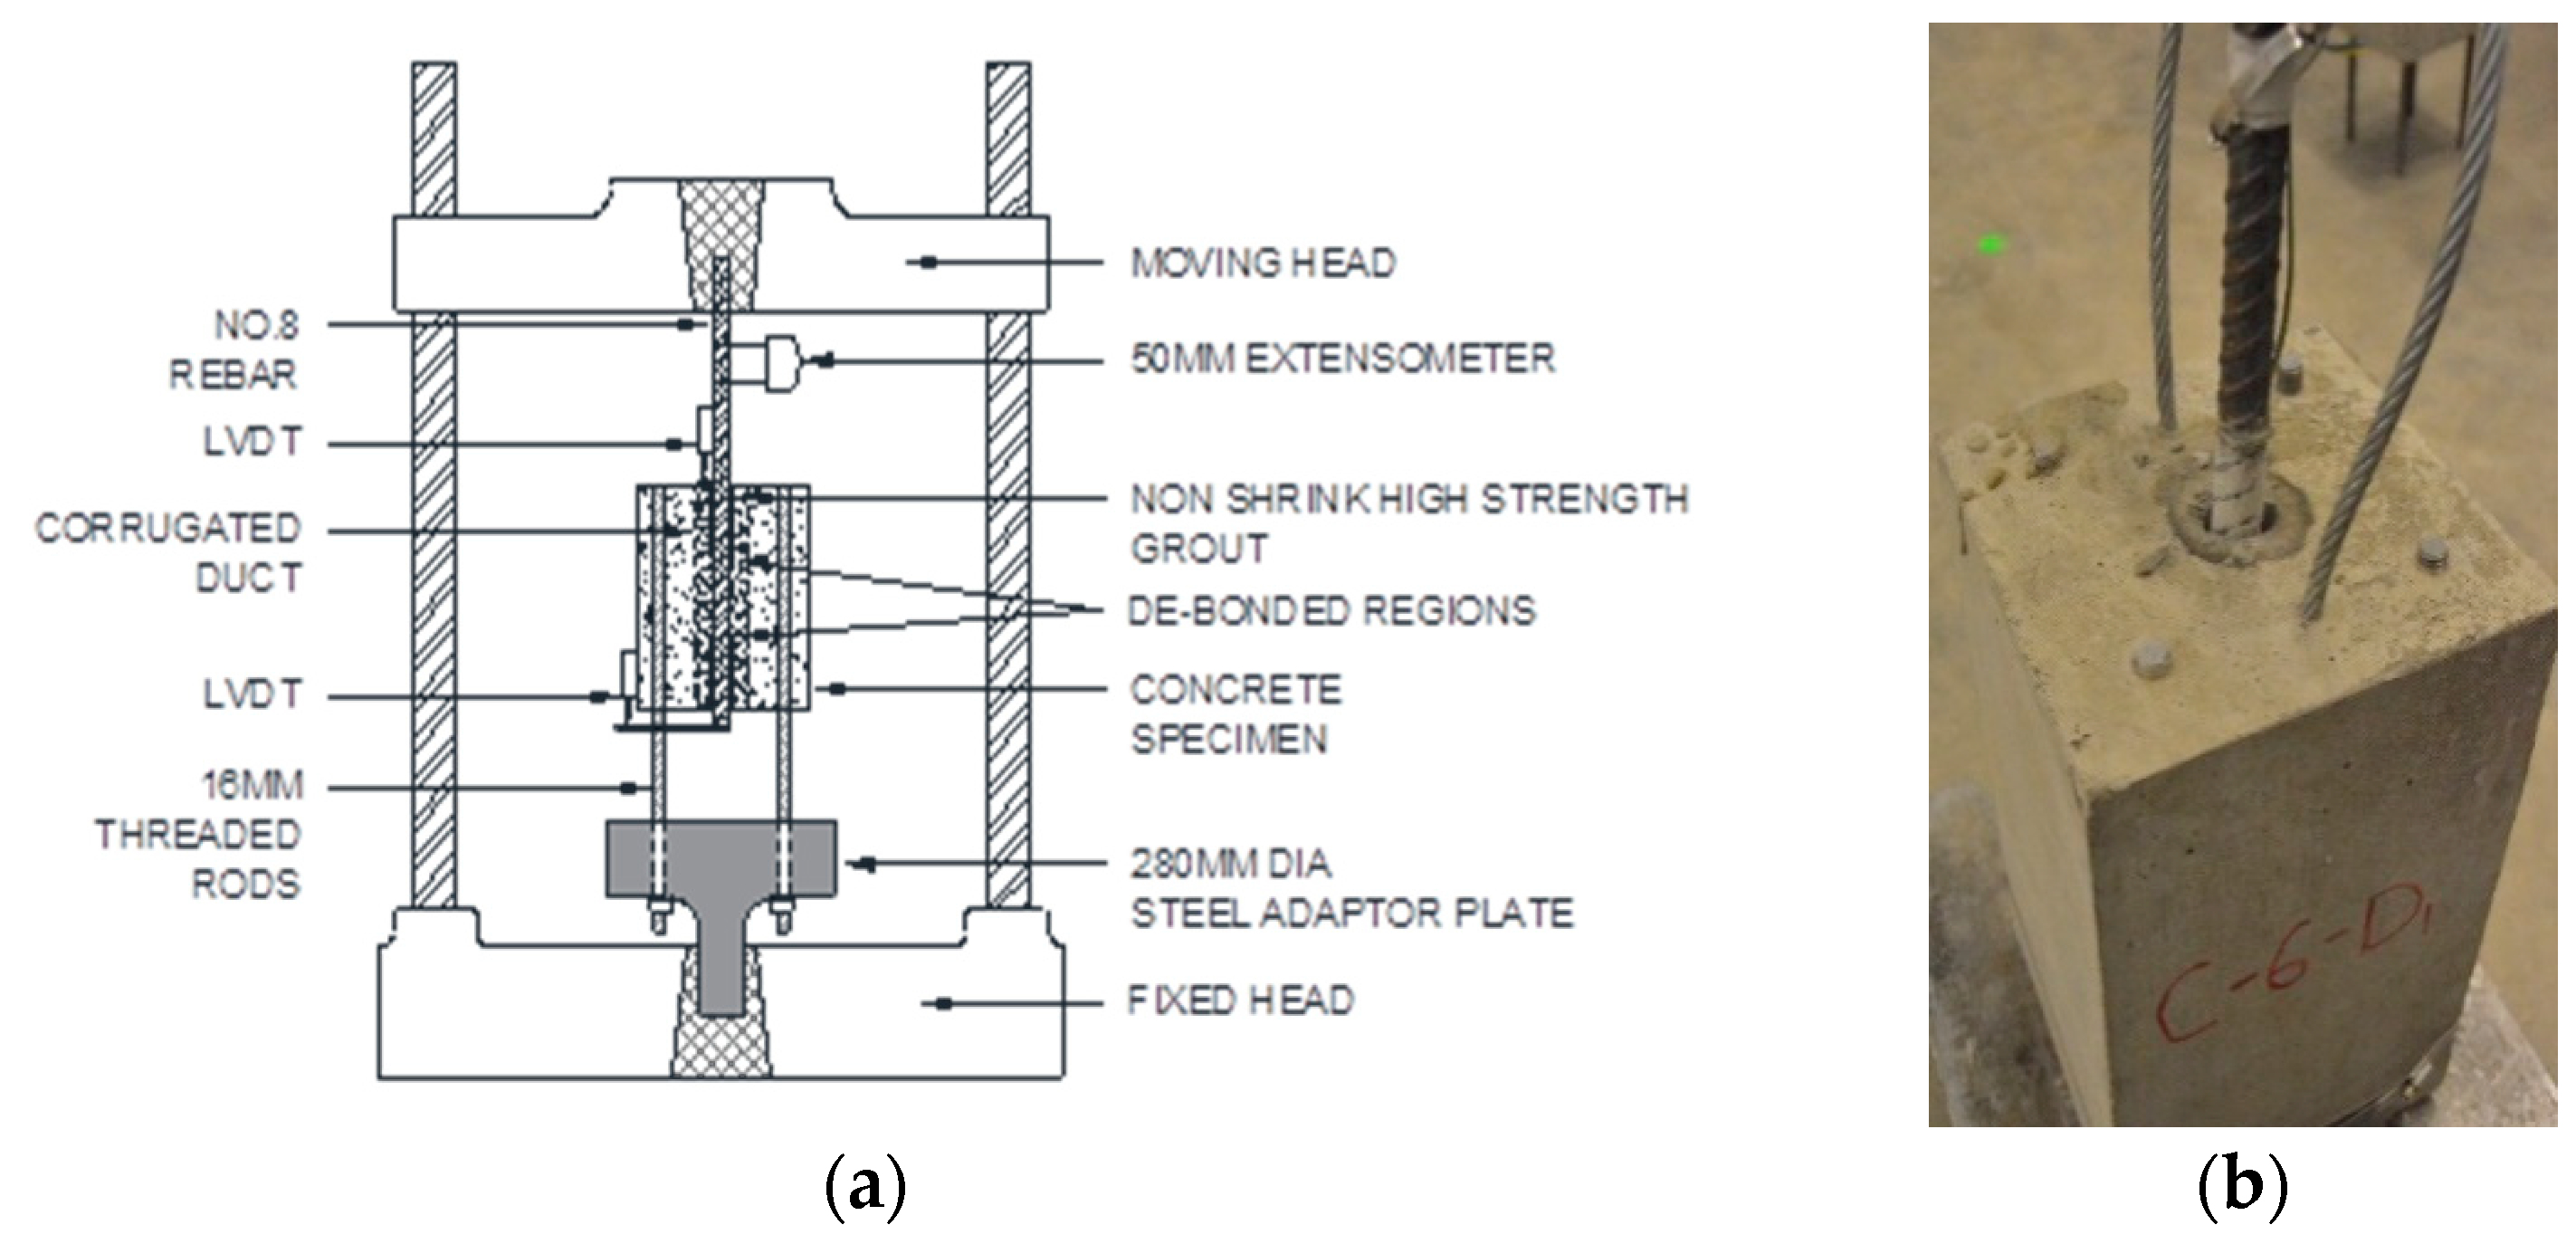
2. Experimental Procedure and Results

The test specimens used to derive the local bond stress vs. slip law are depicted in Figure 2. The specimens were carefully designed to mimic full-scale field conditions pertaining to precast concrete wall construction and to eliminate artificial compressive fields that could influence the bond. Test specimens comprised a reinforced concrete block that had dimensions of 254 × 254 × 406.4 mm (254 mm is a typical width in full-scale precast shear walls). A 76.2-mm corrugated duct was placed concentrically in the middle of the specimen. To assist in the application of the load, four high-strength 16-mm threaded rods [28] were used to reinforce the block longitudinally. Transverse reinforcement was in the form of 10-mm closed-branch stirrups spaced 203.4 mm apart. The dowel bar used in this study was No. 8, and the spacing of the ribs was 9.75 mm. The bars were de-bonded by wrapping them in 2-mm-thick polystyrene wrap. The bonded length was 4 and 6 db. After concentric placement of the de-bonded bars inside the duct, non-shrink high-strength grout was mixed at low speed for 10 min and at high speeds for 5 min. Water (about 3.75 L) was added until a flowing consistency was achieved. Grouting was then done in the vertical position, as per full-scale field grouting applications. Subsequently, the specimens were cured for 28 days at a temperature of 22 °C and relative humidity of 60%. The strain in the bar was measured via a 50-mm extensometer as shown in Figure 2. Additionally, a 10-mm strain gauge was placed amid the bonded length to measure the strain. Finally, loading was applied in displacement control at a rate of 0.02–0.025 mm/s. For detailed information about these tests, the reader is referred to Reference [8].
The test results and analytical bond–slip law presented by Eligehausen et al. [27] are portrayed in Figure 3. The local bond stresses were determined based on the classical equilibrium expression, as given in Equation (1).
τ = A π d b · d σ s d x ,
where τ = bond stress, A = cross-sectional area of the bar, db = diameter of bar, and σs = stress in bar.
The procedure for obtaining the bond stress was as follows: firstly, the strain distribution along the bonded length was determined knowing the strain value at the beginning (extensometer reading), amid the bonded length (strain gauge), and at the end (zero strain). Secondly, using information of the mechanical properties obtained from the coupons, the corresponding stress levels were determined. Thirdly, the stress values were linearly connected assuming a linear stress distribution, which is justified given the elasticity of the bar and shortness of the bonded length [27,29]. By assuming a linear distribution of stress, the bond stresses were constant between two successive strain readings and could be directly calculated using the expression given in Equation (2).
τ = d b 2 · σ s L d .
The experimental results were used to calibrate a local bond stress vs. slip envelope to be used in the model development. A discussion of the constitutive relationship used in the interface model is presented in the subsequent sections.

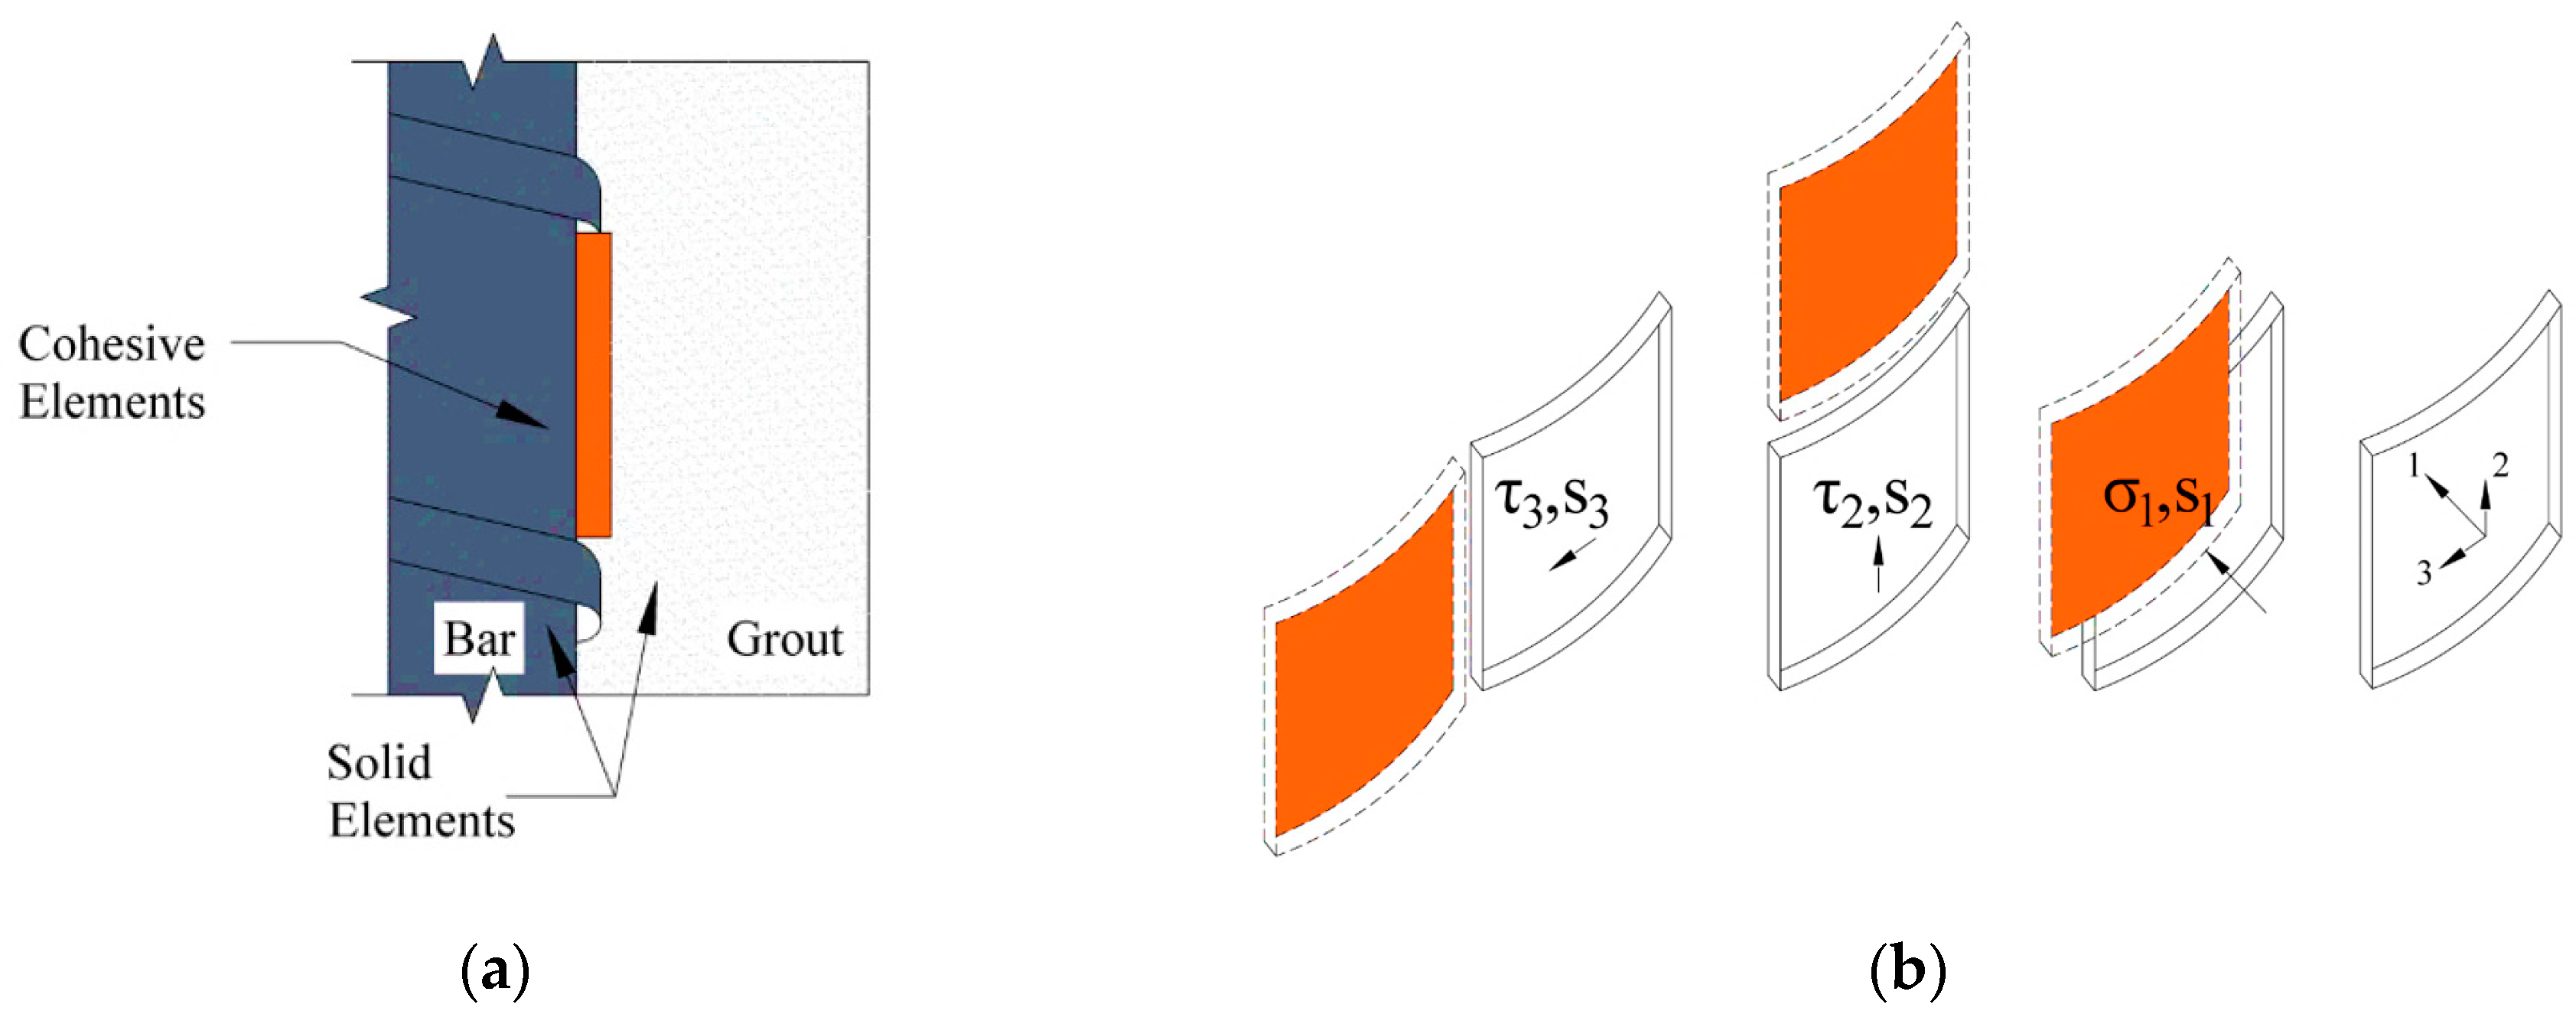
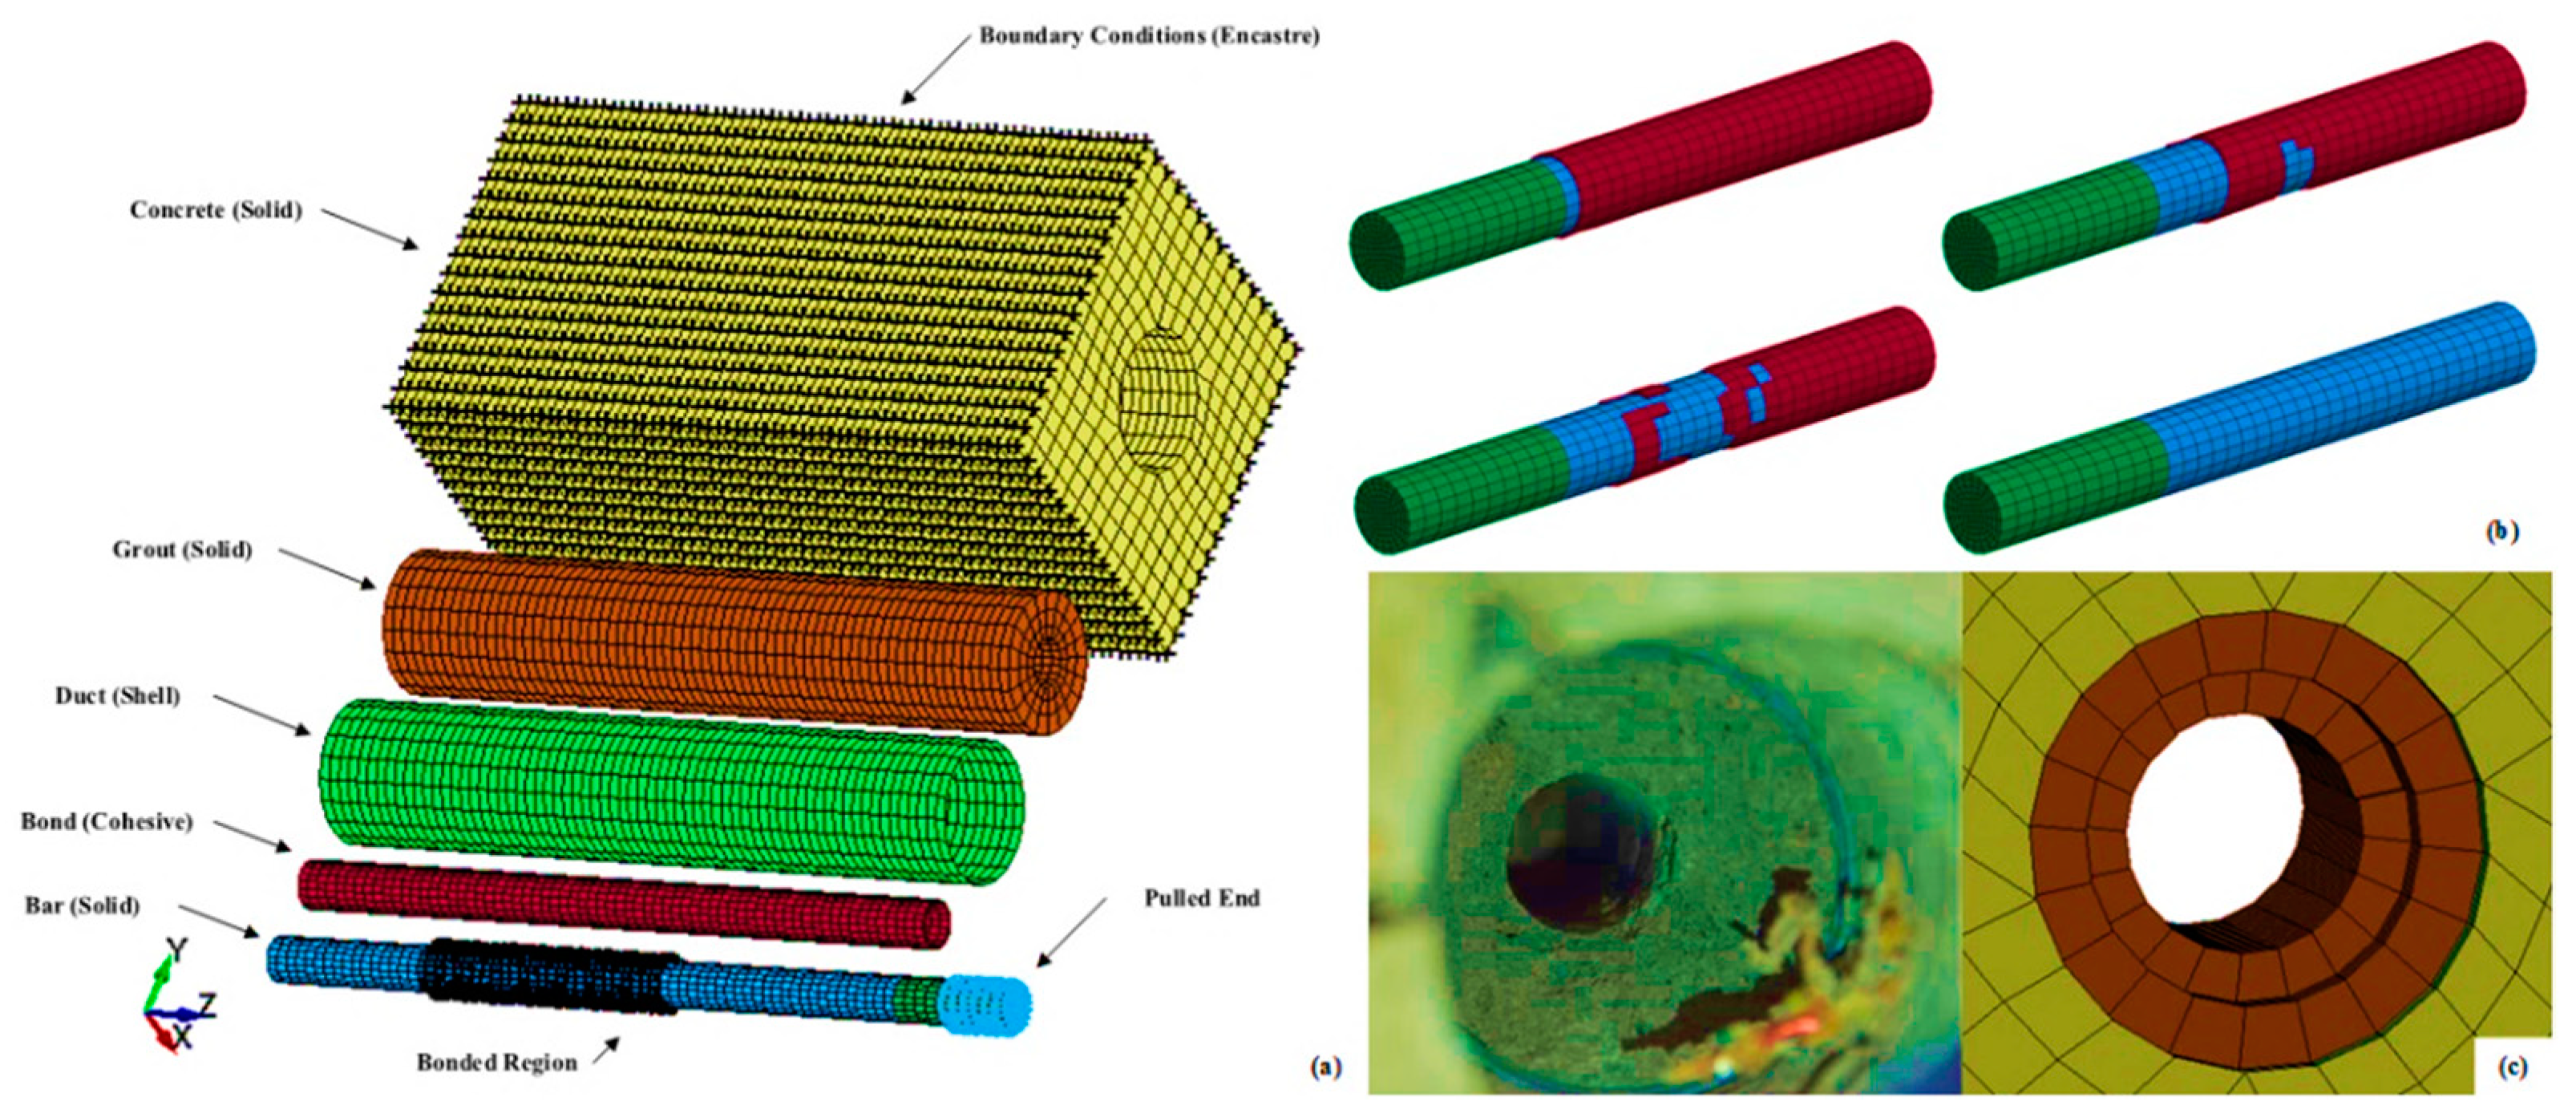
3. Interfacial Modeling
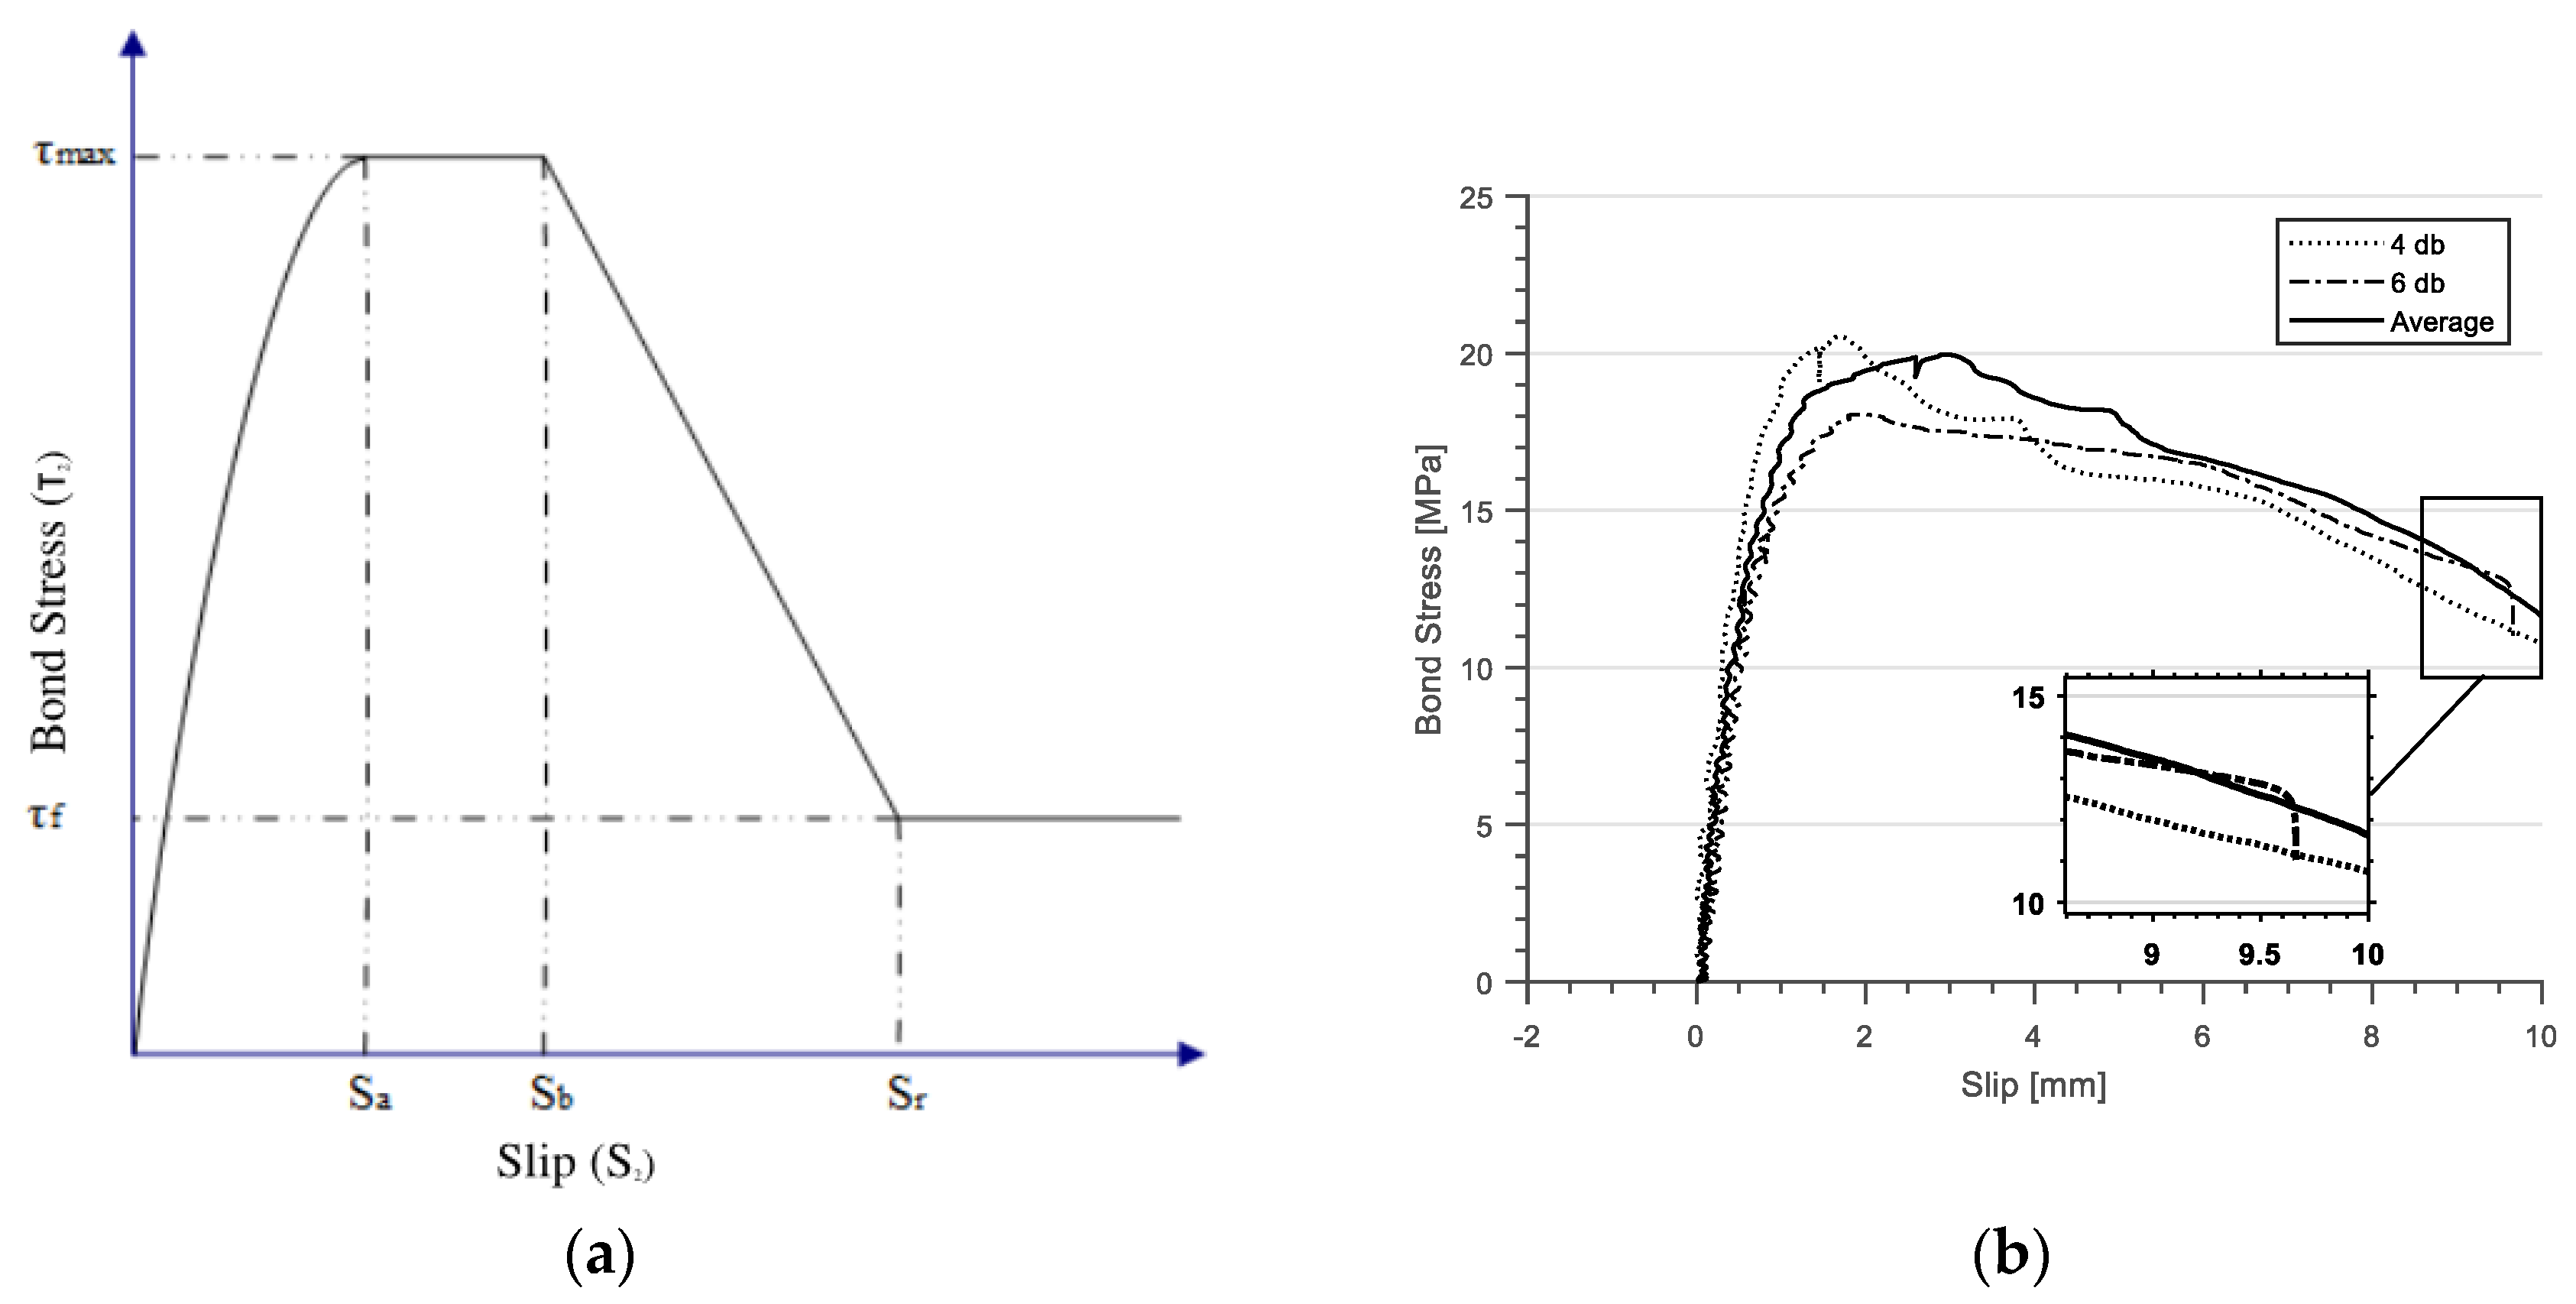
The development of the constitutive bond–slip law of interfacial elements at the bar–grout interface is described in detail below and illustrated in Figure 4, which also depicts the stress components and relative displacements. The nodes of cohesive elements were tied to the nodes of their respective neighboring elements using a tie constraint to ensure compatible displacements between respective elements. Relative displacements comprise three components: a normal component, s1, acting perpendicular to the longitudinal axis of the bar; a tangential component, s2, acting along the axis of the bar; and a tangential component, s3, acting along the transverse direction. Similarly, stresses along the interface are also defined via three components: a normal stress σ1, and two tangential components τ1 and τ2 corresponding to their respective displacements.

3.1. Bond–Slip Law

The bond–slip law adopted in this paper was motivated by the experimental results shown in Figure 3. The law was derived based on the well-known Bertero, Popov, and Eligehausen (BPE) model presented by Eligehausen et al. [27], one of the most widely reported bond–slip models in the open literature. This model is mathematically expressed as follows:
τ 2 ( s 2 ) = { τ m a x ( s 2   s a ) α s 2 < s a τ m a x s a s 2 < s b τ m a x   ( s b s 2 s b s r ) ( τ m a x τ f ) s b s 2 < s r τ f s 2 s r ,
where τmax = maximum bond stress, α = curve fitting parameter reflecting the degree of confinement, sa and sb = are bar slips corresponding, respectively, to the beginning and end of the bond strength plateau, s r = is the rib spacing, and τf = residual bond stresses.
Equation (3) presents the local bond–slip law, whose variables depend on four main parameters that need calibration based on experimental results, namely τmax; sa; sr, and τf. τf was found to be in the range of 18–20 MPa. The curve fitting parameter α was found to be in the range of 0.21–0.28. sa fell in the 1.4–1.55-mm range. sb was approximately equal to 1.2 sa (1.86 mm). sr was 9.75 mm. τf (bond stress corresponding to a slippage equal to the spacing between the lugs) was found to be in the range of 12–13 MPa, approximately 50–60% of τmax. The values of τmax and sa (smax) should be determined experimentally for each case, and no accurate theoretical model could be used to predict their values. In the absence of experimental data, Murcia-Delso and Shing proposed Equations (4) and (5) (based on bond observation of bars embedded in confined concrete).
τ m a x = 1.163 f c   0.75 ;
s m a x = 0.07   d b .
To account for the damage of the anchorage due to influencing factors, the effective bond stress is calculated as shown in Equation (6).
τ 2 * = m n ( s 1 )   m s ( ε s )   τ 2 ,
where τf* = effective bond stress, mn = modifier to account for concrete splitting (function of s1), and ms = modifier to account for post-yield behavior.
mn reflects the severity of splitting stresses in the concrete cover, which is a result of the radial tensile stresses induced unto the cover due to bar slip. This generates hoop tension, which forces the concrete to dilatate in the absence of transverse reinforcement. Consequently, regions where splitting occurs suffer from bond reduction. These failures were not observed when grouted connections were tested, irrespective of the intensity of the bond stresses developed. As such, mn was taken equal to 1 since the corrugated duct provided a continuous compressive field restraining the grout. It is also worth noting that unconfined grout cones generally observed with the pull-out of bars from grout filled connections (e.g., observed in Parks et al. [30], and Steuck et al. [2]) were not observed during the present experiments. It is not clear whether these grout cones were formed at the onset of the bonded length but were not observed due to de-bonding of the bars at the bar extremities, which shifted the unconfined length of the grout deeper inside the panels.
ms accounts for the reduction in bearing area resulting from inelastic strains, as shown in Figure 5a. Shima et al. [31] observed bond reductions of as much as 25% at the onset of yielding, with further reductions as inelastic strains continuing to accumulate. This modifier is only active when the elastic strain limit is exceeded. The value of ms depends on whether bars have yielded when the experimental bond–slip relationship is obtained. If Equation (3) was obtained from specimens exhibiting yielding, then the subsequent reduction in the bearing area is inherently accounted for by the slip domain. For all other cases, Equation (7) mathematically expresses ms as a function of ε s as follows:
m s ( ε s ) = { 1 ε s < ε y ε u ε s ε u ε y ε y ε s 3 ε y   ε s <   ε u 0 ε s   ε s ,
where εs = axial strain in rebar, εy = yield strain of the rebar at the onset of strain hardening, and εu = ultimate strain capacity of the rebar.

3.2. Normal Stress

The normal stress component σ1 is dependent on the use of an appropriate value of θ, the angle of inclination of the ribs with respect to the longitudinal axis of the bar. This is imperative for proper simulation of the wedging action at the interface since it represents the fraction of bond forces on the inclined face of the ribs. The value of θ strongly depends on various influential parameters, including the geometry of the lugs and the characteristics at the cement–aggregate interface. The exact value of θ is not known and remains a matter of great contention in the open literature.
This concept was proposed by Lutz and Gergely [32] and experimentally verified by others. They observed the formation of wedges with a face angle of 30–40 degrees in front of the lugs of reinforcement. Similar observations were reported by Cairns and Jones [33] who assumed an inclination angle of 45°. Goto [34] observed that the initiation of cracks at the bar–concrete interface occurs at an angle of approximately 60°. In most recent efforts, Ameli and Pantelides [12] observed this angle to be approximately 45°, which was later confirmed by acoustic emission measurements as reported by Parks et al. [30]. The importance of θ lies in the proper simulation of σ1, which controls splitting failures of the assembly. It should be noted that splitting failures of grouted connections were not observed experimentally in the open literature [2,3,7,8,10]. As such, σ1 was suppressed using a penalty stiffness formulation as given by Equation (8) below.
σ 1 = k 1 s 1 .

3.3. Tangential Stress
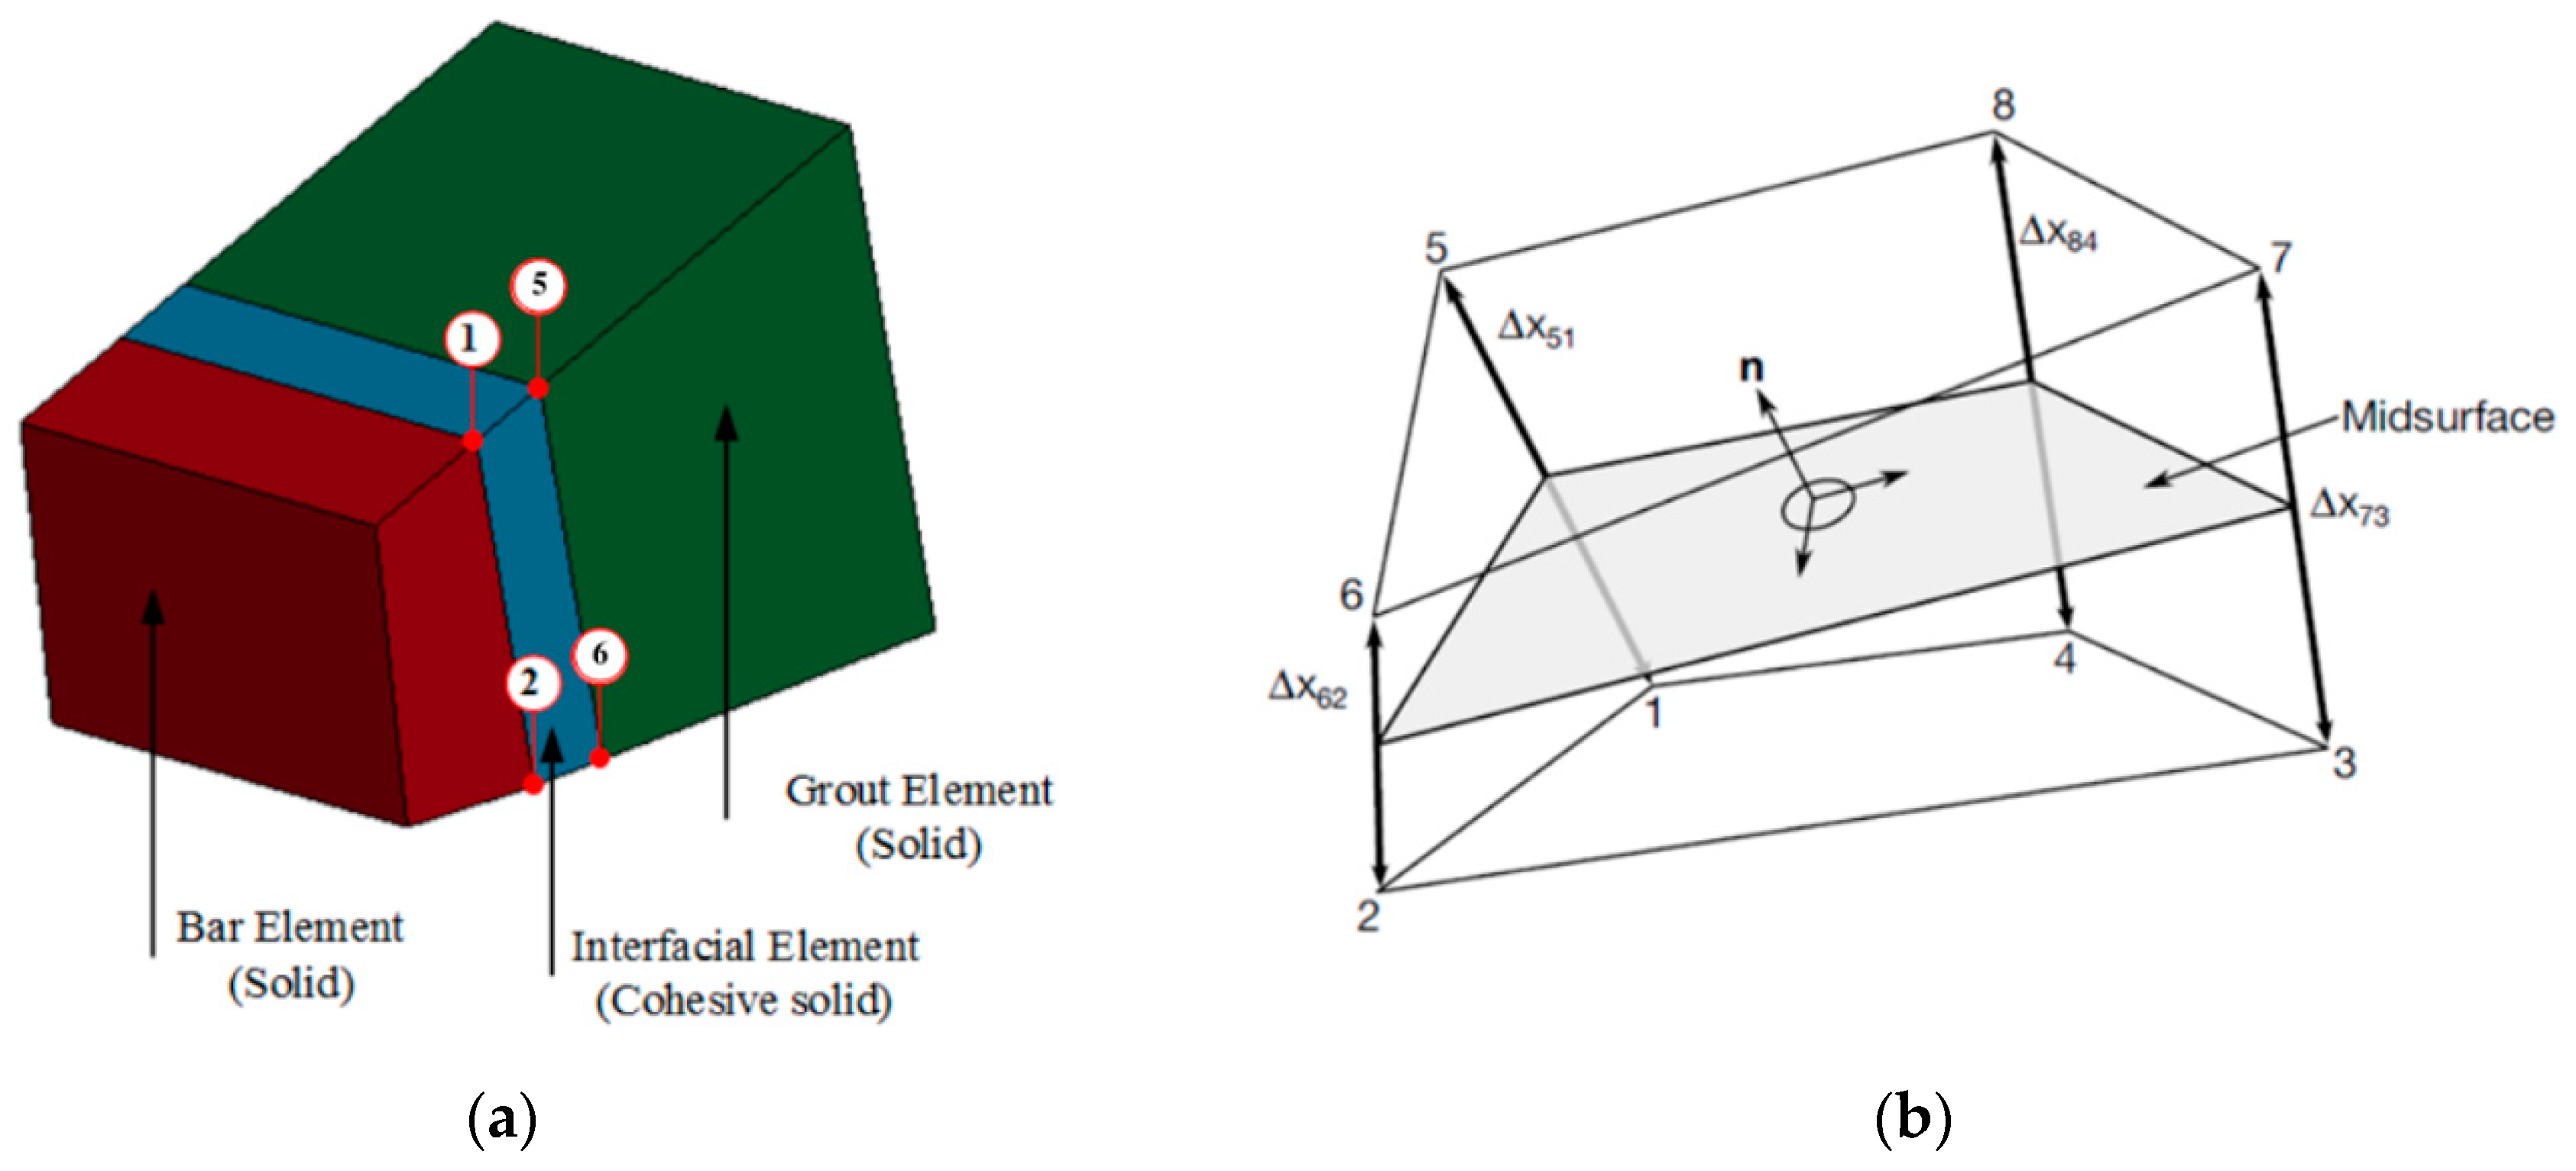
The development of tangential stress τf was suppressed by restricting the rotation of the bar (tangential slip sa in Figure 4). This was done via a penalty stiffness formulation, k3, as per Equation (9).
τ 3 = k 3 s 3 .

4. Implementation

The bond–slip law discussed above forms the basis of the constitutive relationship of cohesive elements used to model the interface between the reinforcement and the concrete, as shown in Figure 6. The interfacial cohesive element was implemented in a user-defined subroutine in the commercial finite element package LS-DYNA. The analysis was run using the default explicit non-linear solver, which is based on a modified central difference time integration scheme. The grout, concrete, and steel reinforcement were modeled using fully integrated selectively reduced eight-noded brick elements utilizing element formulation the ELFORM_2, utilizing separate parts and separate material constitutive models. The bond elements were modeled applying solid hexahedron elements utilizing element formulation ELFORM_19, which uses a traction–separation law. Steel reinforcement was modeled using ELFORM_2. The corrugated duct was modeled using fully integrated, selectively reduced four-noded shell elements, utilizing ELFORM_6. The thickness of the shell was taken to be 0.3 mm, similar to the actual measured thickness of the duct. Encastre boundary conditions were imposed on the extremities of the modeled concrete block. The load was assigned to a predefined nodal group close to the tip of the bar to ensure uniform stress application unto the bar and avoid stress localization at specific nodes. The loading was applied using boundary prescribed motion until failure was observed. An overview of the material constitutive laws, as well as a discussion of mesh sensitivity, is presented below.

4.1. Materials Constitutive Models

4.1.1. Metallic Elements

The mechanical properties used in modeling all metallic elements were obtained experimentally as per the American Society for Testing and Materials ASTM 370 guidelines. Steel reinforcement was modeled using a strain rate-independent elastoplastic model with kinematic hardening as shown in Figure 5b. The model allows element deletion based on the effective failure strain defined. The average measured yield stress and corresponding yield strain were 418 MPa and 0.2%, respectively. The ultimate tensile stress and strain were 603 MPa and 16–18%, respectively. The corrugated duct material model adopted the same steel constitutive law, with an average measured yield and tensile strength of 135 and 270 MPa, respectively. The average measured ultimate strain at failure was recorded to be in the range of 20–25%.

4.1.2. Concrete and Grout

The concrete and grout constitutive compressive and tensile constitutive laws were defined using LS-DYNA’s material MAT_273. This material model is based on the elasto-plasticity framework developed by Grassl et al. [35] as illustrated in Figure 5c,d. This model combines constitutive laws for compressive and tensile behaviors with associated damage parameters. The plasticity rule employed was based on the Menétrey–Willam [36] failure surface, whereas the fracture rule was based on the classical smeared crack approach. The compressive stress–strain relationship was described by three branches. A linear ascending branch was implemented from 0 to the critical stress f c o , values of which are widely reported to be in the range of 0.6–0.8 f c [37]. The compressive hardening rule (Figure 5c) can be approximated after the Hognestad [38] approach and the compressive stress is given by Equation (10).
σ c =   f c ( 2 ε ε c o ( ε ε c o ) 2 ) ,
where fc = uniaxial unconfined compressive strength, and εco = compressive strain at the onset of hardening, expressed as   1.71 f c E c .
The exponential tensile softening law was idealized using a bilinear function relating tensile stresses to the crack opening displacement width wc, as shown in Figure 5d. The crack opening at the partial (wl) and complete (wc) release of stress is a function of wch, which is defined as the fracture energy of concrete Gf normalized by the tensile strength ft. Gf should be obtained experimentally by means of notched beam tests. When such tests are not available, the fracture mechanism based model of Hadi et al. [39] may be used. In lieu of that, Equation (11) can be used after the statistical approach provided by Bažant and Becq-Giraudon [40].
G F =   2.5   α 0 ( f c 0.051 ) 0.46 ( 1 + d a 11.27 ) 0.22 ( w c ) 0.30 ,
where da = nominal maximum aggregate size, w c = water-to-cement ratio, and α0 = aggregate sensitive parameter dependent on the surface characteristics, taken as 1 for river aggregates and 1.11–1.44 for crushed aggregates.

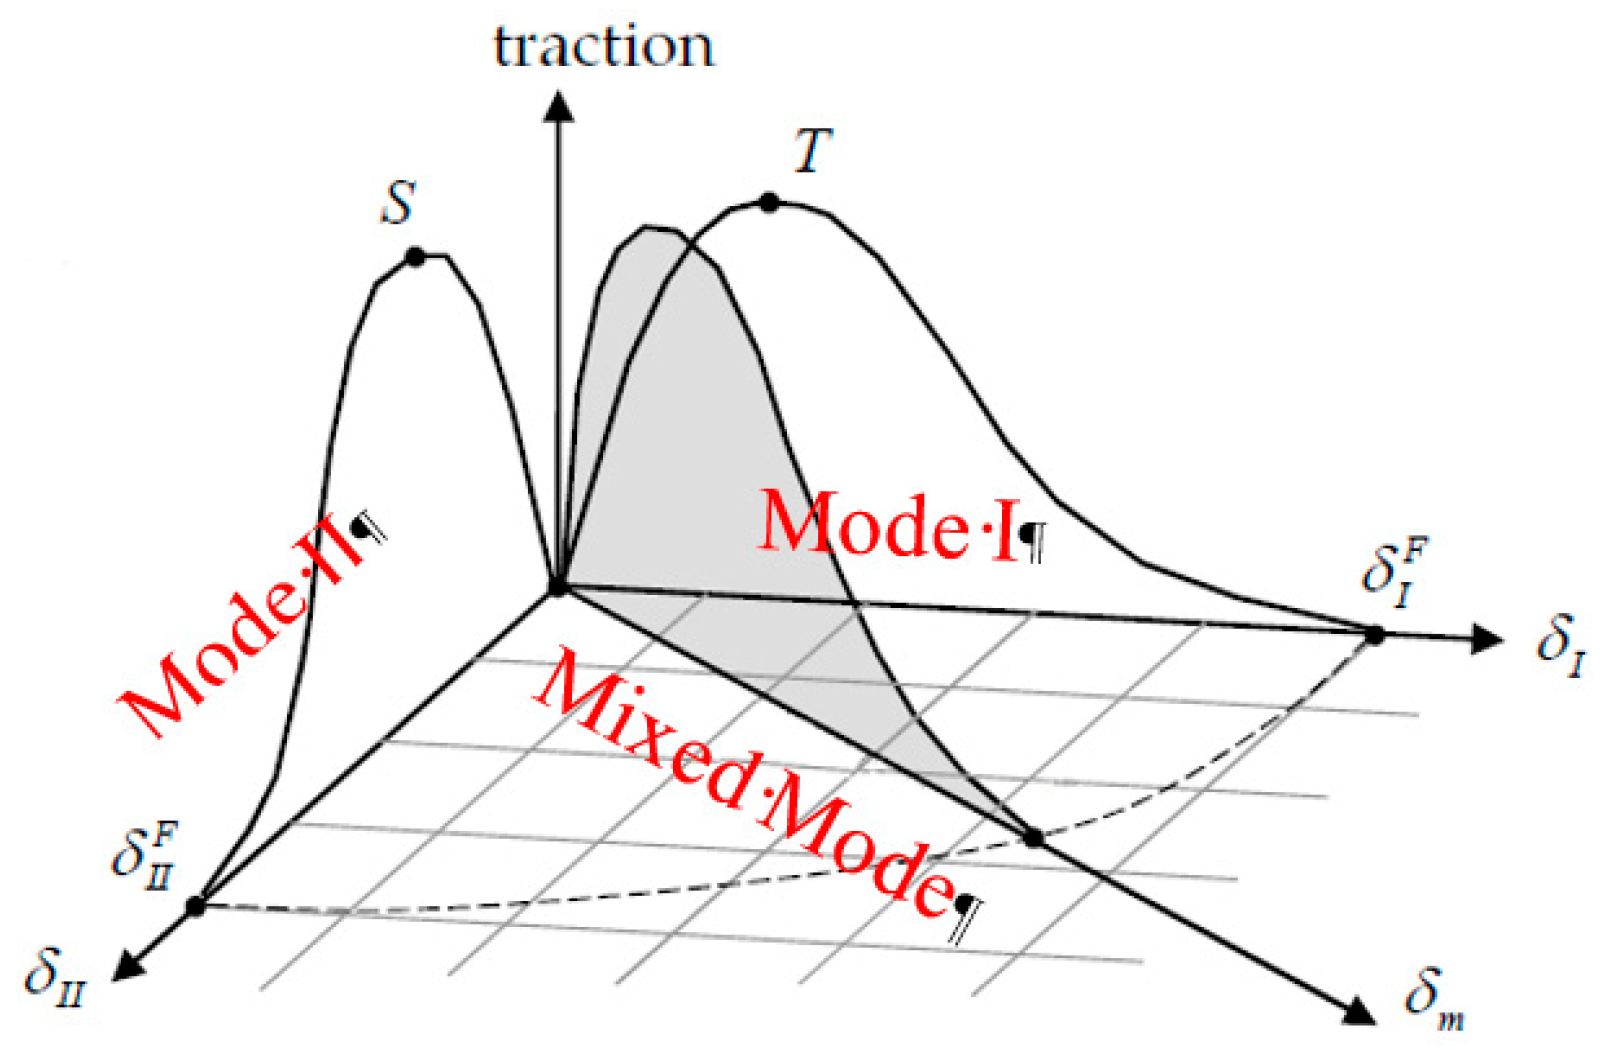
4.1.3. Cohesive Elements
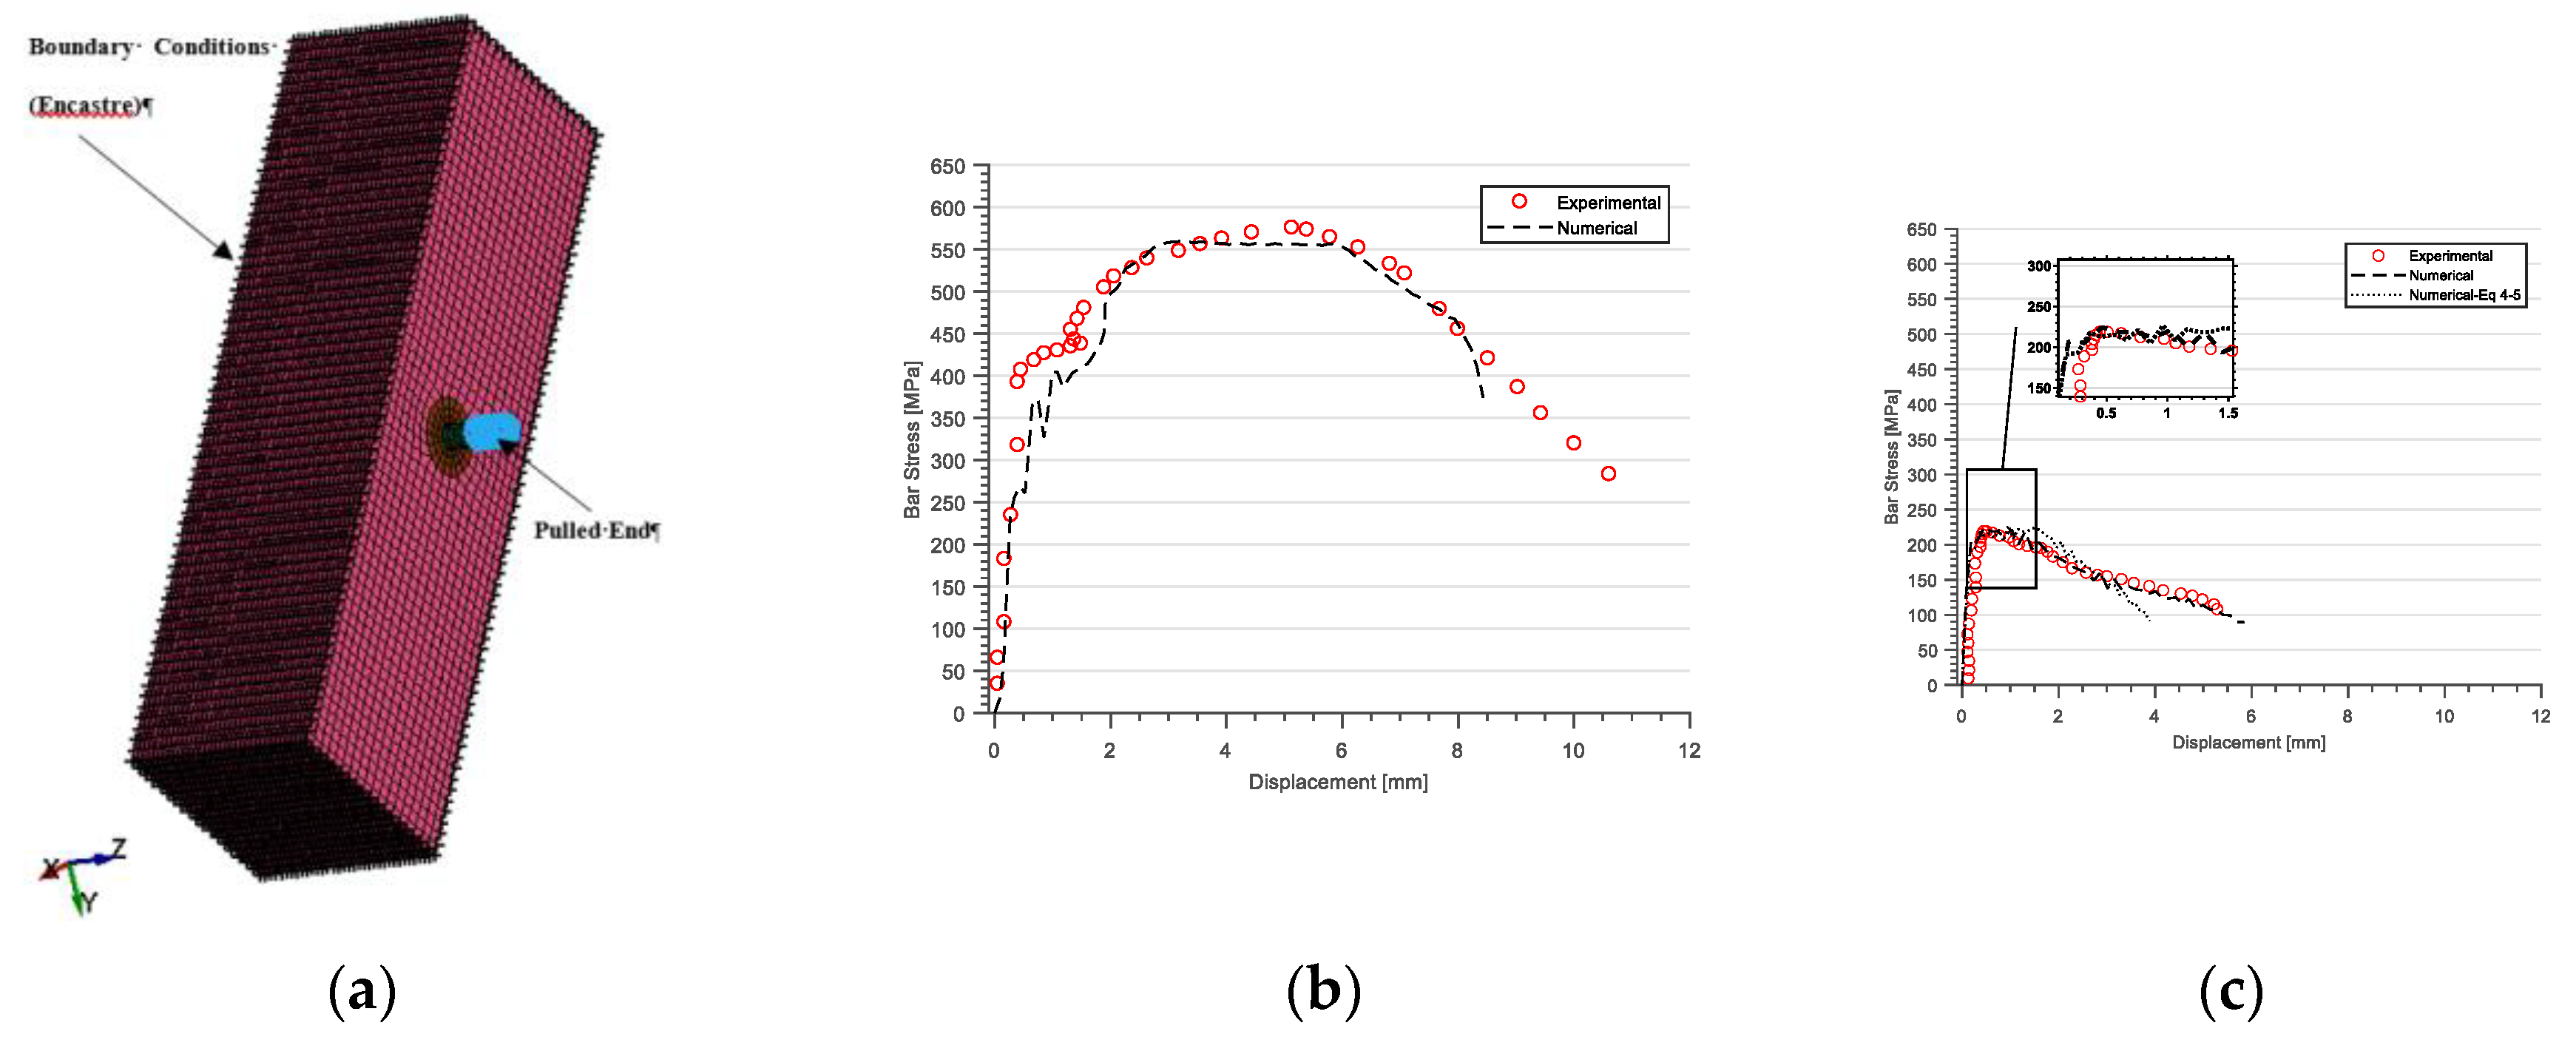
The cohesive elements used in the analysis are exhibited in Figure 6. The element follows the formulation proposed by Vigco and Hutchinson [41]. Traction stresses are calculated on the mid-surface of the element, which is defined as the mid-points between the nodal pairs 1–5, 2–6, 3–7, and 4–8. These tractions are functions of the differences of displacements between nodal pairs interpolated to the integration points. Separations have three components, two of which are in the plane of the mid-surface (s2 and s3), with the third representing the normal component (s1). The model includes three general irreversible mixed-mode interaction formulations, reflecting fracture modes in the normal directions (mode I) and the tangential directions (mode II), as shown in Figure 7. The interaction between fracture modes I and II is taken into consideration through a dimensionless separation parameter λ, which is given by Equation (12).
λ = ( s 2 δ I I F ) 2 + ( s 3 δ I I F ) 2 + ( s 1 δ I F ) 2 ,
where δ I I F and δ I F = the maximum (failure) separation in the tangential and normal directions, respectively, calculated as per Equations (13) and (14), respectively.
δ I F = G I c A ° × T ,
δ I I F = G I I c A ° × S ,
where G I c and G I I c = the fracture toughness in the tangential and normal directions, respectively, A ° = area under the normalized bond–slip curve, and T and S = are the peak traction stresses in the normal and tangential directions, respectively. The fracture toughness G I I c and the normalized area A ° were calculated using Equations (15) and (16), respectively.
G = 0 s τ ( s )   d s ,
A ° = 0 ω τ ( ω )   d ω ,
where ω is the normalized separation parameter (for example, s 2 δ I I F for separation in direction 2).
The failure criterion is initiated when the dimensionless separation parameter λ reaches a critical value of 1. Upon failure, the tangential ( τ 2 and τ 3 ) and normal ( τ 1 ) components of the traction acting on the interface are calculated based on Equation (17), expressed in matrix notation as follows:
[ σ 1 τ 2 τ 3 ] = τ ( λ ) λ [ δ I F ( δ I I F ) 2 0 0 0 δ I F ( δ I I F ) 2 0 0 0 1 δ I F ] [ s 1 s 2 s 3 ] .

5. Model Validation

The preceding sections described the constitutive laws of an interface model describing the bond behavior of grouted connections. The accuracy of the model in depicting the behavior of grouted connections was verified by comparing model calculations to experimental findings, as well as results from the open literature. Due to the scant studies on grouted connections, model results could only be compared to the results of three relevant studies. The purpose of the verification was to merely appraise the accuracy of the model under various elastic and plastic bar conditions. As mentioned earlier, one of the features of the proposed model is that it requires a simple calibration process by changing three attributes of the supposed bond–slip law (Figure 3), namely τ m a x , s m a x , and sr. The properties of the concrete and steel, along with the input parameters used in the analyses, are reported in Table 1.

5.1. Validation Metric

The validation metric described in Oberkampf and Trucano [44] was used as a basis for validation in the present study to provide a quantitative estimate of the relative error between the numerical and experimental results. This validation metric, V, is given by Equation (18) as follows:
V = 1 1 s e n d s 0 | s 0 s e n d t a n h N ( s ) E ( s ) E ( s ) d s | ,
where s0 and send are the initial and final slip, respectively, and E(s) and N(s) are the experimental and numerical domains, respectively. Some key features of Equation (18) can be identified. Firstly, it normalizes the difference between the numerical and experimental results, thus allowing the relative error to be computed. Secondly, the error is calculated over individual points on the slip domain measuring the relative error at every point in the distribution. Thirdly, when the difference between the domains is zero, the validation metric is equal to unity, which presents a perfect match between the experimental and numerical results. Finally, as the summation of the relative error becomes large, the validation metric converges to zero. The values of the calculated validation metrics are given in Table 1. Additionally, the root-mean-square error (RMSE) and mean absolute percentage error (MAPE) were calculated for the distribution, the values of which are reported in Table 1. The RMSE and the MAPE were calculated to provide a comparison between the error estimation of the metric discussed in Equation (18) and more conventional error measures reported in the literature. As observed from the error values reported in Table 1, the validation metric tends to provide an overstated impression of the relative error.

5.2. Validation Examples

5.2.1. Grouted Ducts in Walls

Finite element models of three monotonic pull-out tests conducted by Elsayed and Nehdi [3] were analyzed. The specimens consisted of concrete rectangular prisms having a cross-section of 208 × 208 × 406.4 mm, where the grouted ducts were placed concentrically. The specimens were constructed using No. 8 bars with a measured yield stress and strain of 418 MPa and 0.2%, respectively. The average 28-day compressive strengths of the concrete and grout were 50.6 and 40 MPa, respectively. The three specimens had embedded lengths of 6, 8, and 12 db. The specimens were carefully selected to highlight several key features. Firstly, an embedded length of 6 db was chosen for a direct comparison of the bond–slip model since it represents a close rendering of the local envelope of the anchorage. At such an embedment length, the difference between the observed slip at the loaded and free ends is nominal, which explains the common assumption of uniform bond stress used in bond studies. Secondly, an embedded length of 8 db represents a departure from the uniform slip assumption as moderate non-linearity is expected. Thirdly, an embedded length of 12 db represents a highly non-linear distribution as the effective bond stresses peak closer to the loaded end and attenuate toward the unloaded end. This non-linearity introduces redundant lengths along the bar, whose ribs engage as the bond toward the loaded end experiences plastification. The choice of the embedment lengths analyzed was also based on the different failure modes experienced by the specimens.
The model components, meshes, boundary conditions, and loading are shown in Figure 8a. The force versus free-end slip results, along with the results of sensitivity analyses, are displayed in Figure 9. The purpose of this analysis was to appraise convergence to the experimental solution, as well as highlight the computational efficiency of the model. The convergence criteria were both quantitative and qualitative based on evaluation of the predicted response and the relative error calculated from Equation (18) (maximum 25%). Four mesh sizes were considered, namely 6.5 × 7, 6 × 4, 3 × 2, and 1 × 2 mm, results of which are displayed in Figure 9 for 6 db embedment length. It can be observed that the convergence rate dramatically increased when the mesh size decreased from 6.5 × 7 mm to 6 × 4 mm. The rate of convergence had a slight increase as the mesh size was reduced until a mesh size of 3 × 2 mm, below which no significant improvements were observed. Good agreement between the curves was observed when the mesh size was 3 × 2 mm. The computational effort was calculated as the time required to complete the analysis on a standard single-core processor of a desktop computer. For instance, the computational time increased by 54% when the mesh was refined from 6.5 × 7 (V ≈ 0.23) to 6 × 4 (V ≈ 0.68) mm. A slight increase in computational time by 15.4% was observed when the mesh size was refined from 6 × 4 to 3 × 2 (V ≈ 0.82) mm but was justifiable given the significant improvements in the load versus slip response, as observed from Figure 8. The time required to complete the analysis for the 1 × 2 mm mesh size increased by five orders of magnitude compared to its 6.5 × 7 counterpart. Overall, the model exhibited computational efficiency even when the mesh size decreased.
It is noteworthy that, due to the presence of some induced compression at the boundary of the specimens, the ascending branch was characterized by a stiffer response. This was further verified by comparison of the confinement parameter α, which was in the range of 0.16–0.19. The bond–slip law presented in Equation (3) was based on an α value of 0.21–0.28. As anticipated, the analysis for an embedment of 6 db yielded a close rendering of the bar pull-out behavior. At 8 db, the FE results showed a similar overall trend to the experimental results, characterized by an ascending plateau and descending branches of the envelope. The transition between the ascending branch and plateau observed in the experimental results exhibits a smoother curve, apparently as a result of the actual non-linearity in the distribution of slip. It is believed that the continuous confining field provided by the corrugated duct helped magnify this behavior. This observation is further supported by the plastification of bond elements toward the loaded end as the loading continues, as depicted in Figure 8b. These modes cannot be predicted by the bond–slip model because of the lower-order function assigned to the ascending branch (Equation (3)), explaining the disparity between the numerical and experimental envelopes. The analysis at 12 db resulted in a bar fracture (detected when the plastic strain in the bar reached 23%), which was also observed in experimental results, at a nearly identical load level corresponding to the tensile capacity of the bar (~600 MPa). The numerical model could simulate the failure observed in the grout cylinder manifested by the exhaustion and deletion of the cohesive bond elements, as shown in Figure 8c. The relative error and validation metric described above were calculated and reported in Table 1. It can be observed that the model results were in good agreement with the experimental observations from the study.

5.2.2. Grouted Ducts for Segmental Bridges

The bond–slip model was implemented in an FE analysis to model the specimens presented in Zhou et al. [11]. In their study, the authors performed a series of monotonic pull-out tests on grouted connections to explore the bond–slip response and anchorage of stainless energy dissipating bars in segmental bridge columns. The specimen was in the form of a concrete beam with embedded corrugated ducts. The concrete beams were 810 × 240 × 900 mm (L × W × H). The tests were performed on imperial No. 8 (25.4 mm) and No. 11 (36 mm) bars. The average 28-day compressive strengths of the concrete and grout were 44 and 57.2 MPa, respectively. The FE model of the tests is shown in Figure 10a. The results of the analyses for two No. 8 bars embedded at 7.87 and 3.94 db are illustrated in Figure 10b,c, respectively. The selected specimens were chosen so that they allowed the verification of the model predictions under elastic and plastic bar conditions. Figure 10b shows the specimens with an embedment length of 7.87 db, where the bars yielded at a stress corresponding to ~400 MPa. The yielding of the bars was accompanied by additional slip, which is evident from the sudden dropping of the load curve at ~400 MPa. The overall trend of the numerical curve at 400 MPa shows a post-yield increase in slip. The small differences between the experimental and numerical envelopes observed in the post-yield region is attributed to the absence of a yield plateau in the assumed steel model. Overall, the model predictions are in good agreement with the experimental results in the ascending branch, plateau, and descending branch of the curve (based on the assumed model). Figure 10c shows the bar stress vs. displacements at the loaded end when the bars were embedded at 3.94 db. Acceptable correlation was observed between the model predictions and corresponding experimental results as reflected by the error calculated (19–20%) in Table 1.
Considering the relative error as calculated from Equation (18), it should be noted that the specific results were extracted by digitization of the experimental curves. Since most of the results were superimposed on single figures, the accuracy of the digitization decreased. Also, the MAPE was in the range of 8–10%, which reflects good agreement with experimental results, further highlighting the stringency of the used validation metric. Additional analysis was conducted using a hypothetical bond–slip law based on Equations (4) and (5). The model captured the trend of the experimental curve in terms of initial stiffness and plateau regions. Some discrepancies were observed in the descending branch. This is due to the assumption of residual bond stress of 50% of τmax. While this is a crude approximation of a rather complex phenomenon, the results are deemed sufficiently acceptable if no experimental results can be utilized to calibrate the model.

5.2.3. Grouted Ducts for Bridge Bents

The FE model components of the pull-out test of Steuck et al. [2] are shown in Figure 11a. The experimental results presented in this study were acquired primarily on large-diameter reinforcing bars embedded in grouted connections. The bar used in the test was No. 10 (32.3 mm). The specimen comprised a 915-mm concrete specimen in which a central corrugated duct was placed. The average 28-day compressive strengths of the concrete and grout were 42.8 and 57 MPa, respectively. The bar stress vs. loaded-end slip is shown in Figure 11. The model reproduces the ascending branch of the experimental results well until the bar stress approaches ~525 MPa. As stated earlier, the model cannot accurately depict the transition between the ascending branch and plateau, although close agreement was observed when the maximum bar stresses between both envelopes were compared (585 MPa). It is interesting to highlight that the artefacts of yielding were not experimentally observed in this study. This was also not observed in Elsayed and Nehdi [3]. The effects of bar yielding on reducing the local bond stresses of an anchorage act via two main mechanisms. Firstly, at the onset of yielding, additional slip is invoked by the large strains and subsequent deformations of the bars. Secondly, the plastic strain accumulation brings about a reduction in the cross-sectional area of the bar, which disengages the ribs close to the loaded end. At approximately 0.2 mm/mm of strain, the ribs are completely disengaged. While the reasons for the absence of these observations from the experimental results are not obvious, it could be attributed to the intimate interfacial characteristics of grouted connections due to the flowing consistency of the grout.
The relative error between the experimental and numerical results was 23%. As mentioned earlier, this metric tends to provide stringent error values (for instance, compared to the MAPE of 13.47). However, as can be observed from Figure 11, good correlation exists, highlighting the efficacy of the model in depicting the behaviour of grouted connections.

6. Conclusions

This paper discussed the development, modeling approach, and calibration of an interfacial model suitable for use in FE platforms for capturing the behavior of grouted dowel connections used in precast concrete construction. The model utilizes a phenomenological bond–slip model to predict the bond–slip behavior of grouted anchorages. This was achieved by removing geometric non-linearities associated with modeling bar lugs and replacing them with interfacial cohesive elements. This endowed the simulation with superior computational efficiency while yielding acceptable results. The proposed model requires simple calibration via three easy-to-derive mechanical properties of the connection. Due to its computational efficiency and ease of implementation, the model can be used to model complete precast buildings, a feature that was previously not possible without substantial computational cost.
To confirm the ability of the model to capture the bond–slip behavior in finite element analyses, the model was validated using several experimental tests retrieved from the open literature, including bond–slip and bar anchorage tests with different embedment lengths. The comparison between the numerical and experimental results showed that the model can reproduce the bond–slip behavior of bars embedded in grouted connections with reasonable accuracy and has the ability to effectively capture bond failures.

Author Contributions

M.E. carried out the numerical model, conducted the data analysis, and wrote the initial draft of the manuscript. M.L.N. developed the concept of the research project, supervised the development of the technical content, contributed to developing the final manuscript, and ensured the resources needed for the research. F.G. contributed expertise in numerical modeling, revision of the final manuscript and resources and logistics for part of the experimental work.

Funding

This research received no external funding.

Acknowledgments

The authors would like to thank LSTC for providing the software license, and Stubbe’s Precast for providing the specimens used in the experimental portion of this study. Part of the experimental testing was carried out at the Structures Laboratory of the University of Windsor. Matt St. Louis is thanked for his assistance with lab equipment and testing.

Conflicts of Interest

The authors declare no conflict of interest.

References

  1. ACI Committee. Building Code Requirements for Structural Concrete and Commentary; ACI Committee: Farmingt Hills, MI, USA, 2014; pp. 1–519. [Google Scholar]
  2. Steuck, K.P.; Eberhard, M.O.; Stanton, J.F. Anchorage of Large-Diameter Reinforcing Bars in Ducts. ACI Struct. J. 2009, 106, 506–513. [Google Scholar]
  3. Nehdi, M.L.; Elsayed, M. Experimental and analytical study on grouted duct connections in precast concrete construction. Mater. Struct. 2017, 50, 1–15. [Google Scholar]
  4. Brenes, F.J.; Wood, S.L.; Kreger, M.E. Anchorage Requirements for Grouted Vertical-Duct Connectors in Precast Bent Cap Systems; Technical Report No. FHWA/TX-06-4176-1; Texas Department of Transportation: Austin, TX, USA, 2006; pp. 1–251.
  5. Tazarv, M.; Saiidi, M.S. UHPC-filled duct connections for accelerated bridge construction of RC columns in high seismic zones. Eng. Struct. 2015, 99, 413–422. [Google Scholar] [CrossRef]
  6. Hosseini, S.J.A.; Rahman, A.B.A.; Osman, M.H.; Saim, A.; Adnan, A. Bond behavior of spirally confined splice of deformed bars in grout. Constr. Build. Mater. 2015, 80, 180–194. [Google Scholar] [CrossRef]
  7. Provost-Smith, D.; Elsayed, M.; Nehdi, M. Effect of early-age subfreezing temperature on grouted dowel precast concrete wall connections. Constr. Build. Mater. 2017, 140, 385–394. [Google Scholar] [CrossRef]
  8. Elsayed, M.; Ghrib, F.; Nehdi, M. Experimental and analytical study on precast concrete dowel connections under quasi-static loading. Constr. Build. Mater. 2018, 168, 692–704. [Google Scholar] [CrossRef]
  9. Lu, Z.; Huang, J.; Li, Y.; Dai, S.; Peng, Z.; Liu, X.; Zhang, M. Mechanical behaviour of grouted sleeve splice under uniaxial tensile loading. Eng. Struct. 2019, 186, 421–435. [Google Scholar] [CrossRef] [Green Version]
  10. Raynor, D.J.; Dawn, E.L.; Stanton, J.F. Bond-Slip Response of Reinforcing Bars Grouted in Ducts. ACI Struct. J. 2002, 99, 568–576. [Google Scholar]
  11. Zhou, Y.; Ou, Y.C.; Lee, G.C. Bond-slip responses of stainless reinforcing bars in grouted ducts. Eng. Struct. 2017, 141, 651–665. [Google Scholar] [CrossRef]
  12. Ameli, M.J.; Pantelides, C.P. Seismic Analysis of Precast Concrete Bridge Columns Connected with Grouted Splice Sleeve Connectors. J. Struct. Eng. 2017, 143. [Google Scholar] [CrossRef]
  13. Wang, Z.; Qu, H.; Li, T.; Wei, H.; Wang, H.; Duan, H.; Jiang, H. Quasi-static cyclic tests of precast bridge columns with different connection details for high seismic zones. Eng. Struct. 2018, 158, 13–27. [Google Scholar] [CrossRef]
  14. Kuang, Z.; Zheng, G. Computational and Experimental Mechanical Modelling of a Composite Grouted Splice Sleeve Connector System. Materials. 2018, 11, 1–12. [Google Scholar]
  15. Li, Y.; Bielak, J.; Hegger, J.; Chudoba, R. An incremental inverse analysis procedure for identification of bond-slip laws in composites applied to textile reinforced concrete. Compos. Part. B Eng. 2018, 137, 111–122. [Google Scholar] [CrossRef]
  16. Monti, G.; Spacone, E. Reinforced Concrete Fiber Beam Element with Bond-Slip. J. Struct. Eng. 2000, 126, 654–661. [Google Scholar] [CrossRef]
  17. Zhao, J.; Sritharan, S. Modelling of strain penetration effects in fibre-based analysis of reinforced concrete structures. ACI Struct. J. 2007, 104, 133–141. [Google Scholar]
  18. Cho, J.Y.; Pincheira, J.A. Inelastic Analysis of Reinforced Concrete Columns with Short Lap Splices Subjected to Reversed Cyclic Loads. ACI Struct. J. 2006, 103, 280–290. [Google Scholar]
  19. Salem, H.M.; Maekawa, K. Pre- and Postyield Finite Element Method Simulation of Bond of Ribbed Reinforcing Bars. J. Struct. Eng. 2004, 130, 671–680. [Google Scholar] [CrossRef]
  20. Gan, Y. Bond Stress and Slip Modeling in Nonlinear Finite Element Analysis of Reinforced Concrete Structures. M.Sc. Thesis, University of Toronto, Toronto, ON, Canada, 2000. [Google Scholar]
  21. Li, J. An Investigation of Behavior and Modeling of Bond for Reinforced Concrete. Ph.D. Thesis, University of Washington, Seattle, WA, USA, 2010. [Google Scholar]
  22. Cox, J.V.; Herrmann, L.R. Development of a plasticity bond model for steel reinforcement. Mech. Cohesive-Frict. Mater. 1998, 3, 155–180. [Google Scholar] [CrossRef]
  23. Cox, J.V.; Herrmann, L.R. Validation of a plasticity bond model for steel reinforcement. Mech. Cohesive-Frict. Mater. 1999, 4, 361–389. [Google Scholar] [CrossRef]
  24. Lundgren, K.; Magnusson, J. Three-Dimensional Modeling of Anchorage Zones in Reinforced Concrete. J. Eng. 2001, 127, 693–699. [Google Scholar] [CrossRef] [Green Version]
  25. Lowes, L.N.; Moehle, J.P.; Govindjee, S. Concrete-Steel Bond Model for Use in Finite Element Modeling of Reinforced Concrete Structures. ACI Struct. J. 2004, 101, 501–511. [Google Scholar]
  26. Murcia-Delso, J.; Shing, P.B. Bond-Slip Model for Detailed Finite-Element Analysis of Reinforced Concrete Structures. J. Struct. Eng. 2015, 141, 4014125. [Google Scholar] [CrossRef]
  27. Eligehausen, R.; Popov, E.P.; Bertero, V.V. Local Bond Stress-Slip Relationships of Deformed Bars under Generalized Excitations; NSF Rep. No. UCB/EERC-82/23; National Science Foundation: Berkeley, CA, USA, 1982; pp. 69–80.
  28. ASTM. Standard Specification for Deformed and Plain, Low-carbon, Chromium, Steel Bars for Concrete Reinforcement; ASTM: West Conshohocken, PA, USA, 2016; pp. 1–7. [Google Scholar]
  29. Tastani, S.P.; Pantazopoulou, S.J. Direct Tension Pullout Bond Test: Experimental Results. J. Struct. Eng. 2010, 136, 731–743. [Google Scholar] [CrossRef]
  30. Parks, J.E.; Papulak, T.; Pantelides, C.P. Acoustic emission monitoring of grouted splice sleeve connectors and reinforced precast concrete bridge assemblies. Constr. Build. Mater. 2016, 122, 537–547. [Google Scholar] [CrossRef]
  31. Shima, H.; Chou, L.L.; Okamura, H. Bond characteristics in post-yield range of deformed bars. Doboku Gakkai Ronbunshu. 1987, 6, 213–220. [Google Scholar] [CrossRef]
  32. Lutz, L.A.; Gergely, P. Mechanics of Bond and Slip of Deformed Bars in Concrete. ACI J. Proc. 1967, 64, 711–721. [Google Scholar]
  33. Cairns, J.; Jones, K. An evaluation of the bond-splitting action of ribbed bars. ACI Mater. J. 1996, 93, 10–19. [Google Scholar]
  34. Goto, Y. Cracks Formed in Concrete Around Deformed Tension Bars. ACI J. Proc. 1971, 68, 244–251. [Google Scholar]
  35. Grassl, P.; Xenos, D.; Nyström, U.; Rempling, R.; Gylltoft, K. CDPM2: A damage-plasticity approach to modelling the failure of concrete. Int. J. Solids Struct. 2013, 50, 3805–3816. [Google Scholar] [CrossRef] [Green Version]
  36. Menetrey, P.; Willam, K.J. Triaxial Failure Criterion for Concrete and its Generalization. ACI Struct. J. 1995, 92, 311–318. [Google Scholar]
  37. Lubliner, J.; Oliver, J.; Oller, S.; Oñate, E. A plastic-damage model for concrete. Int. J. Solids Struct. 1989, 25, 299–326. [Google Scholar] [CrossRef]
  38. Hognestad, E. A Study of Combined Bending and Axial Load in Reinforced Concrete Members. Bull. Ser. 1951, 399, 128. [Google Scholar]
  39. Esmaeeli, H.S.; Shishehbor, M.; Weiss, W.J.; Zavattieri, P.D. A two-step multiscale model to predict early age strength development of cementitious composites considering competing fracture mechanisms. Constr. Build. Mater. 2019, 208, 577–600. [Google Scholar] [CrossRef]
  40. Bažant, Z.P.; Becq-Giraudon, E. Statistical prediction of fracture parameters of concrete and implications for choice of testing standard. Cem. Concr. Res. 2002, 32, 529–556. [Google Scholar] [CrossRef]
  41. Tvergaard, V.; Hutchinson, J.W. The relation between crack growth resistance and fracture process parameters in elastic-plastic solids. J. Mech. Phys. Solids. 1992, 40, 1377–1397. [Google Scholar] [CrossRef]
  42. Livermore Software Technology Corporation. LS-DYNA Keyword User’s Manual Volume I; Livermore Software Technology Corporation: Livermore, CA, USA, 2016. [Google Scholar]
  43. Coronado, C.A.; Lopez, M.M. Sensitivity analysis of reinforced concrete beams strengthened with FRP laminates. Cem. Concr. Compos. 2006, 28, 102–114. [Google Scholar] [CrossRef]
  44. Oberkampf, W.L.; Trucano, T.G. Verification and Validation in Computational Fluid Dynamics. Verif. Valid. Prog. Aerosp. Sci. 2002, 38, 209–272. [Google Scholar] [CrossRef]
Figure 1. (a) Typical grouted corrugated duct connection; (b) schematic diagram of grouted connections in precast walls (reused with permission [3]).
Applsci 09 02344 g001
Figure 2. (a) Experimental set-up; (b) failed bars by shearing of the grout keys at 6 db embedment.
Applsci 09 02344 g002
Figure 3. (a) Bertero, Popov, and Eligehausen (BPE) bond–slip law (recreated after Eligehausen et al. [18]); (b) experimental results.
Applsci 09 02344 g003
Figure 4. (a) Bond modeling using interfacial elements; (b) interface coordinates, stresses, and relative displacements.
Applsci 09 02344 g004
Figure 5. (a) Modifier ms as a function of the bar strain; (b) steel stress–strain constitutive relationship; (c) compressive hardening and softening laws; (d) tensile softening law.
Applsci 09 02344 g005
Figure 6. (a) Cohesive elements at bar–grout interface; (b) tractions at mid-surface of cohesive solid elements [42].
Applsci 09 02344 g006
Figure 7. Mixed-mode interactions [42].
Applsci 09 02344 g007
Figure 8. (a) Finite element (FE) model parts, elements, and boundary conditions after Elsayed and Nehdi [3]; (b) bond plastification progression; (c) interfacial element deletion to simulate shearing of the grout keys.
Applsci 09 02344 g008
Figure 9. (a) FE analysis of bond slip tests by Elsayed and Nehdi [3]: (b,c) load vs. free-end slip response at 6, 8, and 12 db (1 × 2 mm mesh not shown for clarity).
Applsci 09 02344 g009
Figure 10. FE analysis of anchorage tests by Zhou et al. [11]: (a) model showing boundary conditions and pulled end; (b,c) bar stress vs. loaded-end displacements at 3.94 and 7.87 db, respectively (recreated using data from Zhou et al. [11]).
Applsci 09 02344 g010
Figure 11. FE analysis of anchorage tests by Steuck et al. [2]: (a) model showing boundary conditions and pulled end; (b) bar stress vs. loaded-end slip at 7.68 db (recreated using data from Steuck et al. [2]).
Applsci 09 02344 g011
Table 1. Material parameters for concrete, steel, and grout, bond–slip model calibration parameters, and model validation.
Material ParametersModel Calibration Parameters(1) Model Validation
StudyLd (db)SteelConcreteGroutRelative Error (%)VRMSEMAPE (%)
db (mm)fy (MPa)fu (MPa)fc (MPa)ft (MPa)fc (MPa)ft (MPa)(2)τmax (MPa)smax (mm)sr (mm)
Elsayed and Nehdi6.025.4418.8601.261.66.139.36.320.71.69.818.360.8226.0213.93
8.022.130.7844.9217.80
12.0
Zhou et al.3.925.4400.0635.044.84.034.53.514.74.212.019.470.8112.188.79
7.820.680.7941.9810.12
Steuck et al.8.032.2421.2700.042.83.957.04.518.13.817.523.230.7749.8313.47
Calculated as 0.6   f c [43].
Note: RMSE refers to the root-mean-square error, and MAPE refers to mean absolute percentage error. (1) Based on a mesh size of 3 × 2 mm; (2) calculated as the average bond stresses at 4 and 6 db.

