Abstract
Diffuse wave inspection benefits from multiple scattering and is suitable for the nondestructive testing of complex structures with high sensitivity. This paper aims to localize the defect in a cross-ply carbon fiber reinforced polymer composite with the diffuse wave field experimentally based on the Locadiff technique. Firstly, the wave diffusivity and dissipation parameters are determined from the diffuse waveforms. Great dissipation is found for this composite plate due to its strong viscoelasticity, which makes the amplitude attenuate fast in a short propagation distance. The signal-to-noise ratios degrade significantly at off-axis directions so that only measurements along the X and Y axes are chosen. Secondly, the decorrelation coefficients are determined using the stretching technique. The decorrelation coefficients decrease initially due to the interaction between the wave fields and the defect and subsequently increase due to the low signal-to-noise ratio at the later time. Based on these data, a sensitivity time domain is chosen to center at t = 50 μs. Together with the defect sensitivity kernel calculated under constant diffusion property assumption, the defect is localized at [270 mm, 265 mm] compared to [300 mm, 280 mm] in the final reference state. This method is promising for early damage detection in fiber reinforced composite structures.
1. Introduction
Fiber reinforced polymer composites are becoming increasingly important in modern industries due to their high specific strength-weight ratio, anti-corrosion properties, and recyclability. They are manufactured using different processes such as resin transfer molding, extrusion, and automated tape placement, according to different property requirements. Recently, additive manufacturing, combined with various reinforcement control methods (e.g., standing-wave field [1], magnetic field [2], rotational deposition [3]), has come to be considered a cost-efficient method for composite design and manufacturing. During these processes, defects such as voids, cracks, and delaminations may be introduced into the part and lead to structure failure in service.
Defect localization and characterization are critical in modern lightweight structures made of fiber reinforced composites. The early detection of these defects is beneficial to the structural integrity and maintenance. Different methods have been exploited in recent years, including pulse-thermography [4], ultrasonic [5], X ray, acoustic emission [6,7], and electric resistance variation [8,9]. Among all these methods, ultrasonic testing is considered to be promising for in-situ or online inspection. Localization sensitivity can be improved through a higher ultrasonic frequency, but with regards heterogeneous materials such as concretes, biology tissues, and fiber reinforced composites, wave propagation becomes more complicated with increasing frequency. A full understanding of such process and proper signal processing methods is required to overcome or even benefit from scattering and attenuation phenomena.
The complex internal fiber distribution results in multiple scattering in the fiber reinforced composite. In such mediums, the whole waveform can be separated into the direct (ballistic, the first arrival) wave part and the diffuse wave part [10]. The direct wave is often strongly attenuated and only exists for a short distance that corresponds to the transport mean free path [11]. Subsequently, the energy of the direct waves rapidly converts into late-arriving diffuse waves [12]. The conventional ultrasonic inspection methods tend to lower the frequency to prevent the difficulties brought by attenuation and scattering. They often rely on the information from the direct wave part including the C scan method [13] and the Lamb wave inspection method [5]. The former has been widely accepted in aerospace industry to check defect existence in composite structures with considerable capital cost, and the latter is suitable for thin plate structures and can improve inspection efficiency. Nevertheless, careful interpretation of different propagation modes and boundary reflections/refractions are required [14]. By contrast, the diffuse wave is repeatable and independent of the direct wave path [15], and it can also be applied to structure inspection. Being treated as ambient noise [16] for a long time, the diffuse wave is found to contain valuable information, especially in seismology and civil engineering. Weaver and Lobkis [17] showed that the cross-correlation of two diffuse wave fields from the same excitation is equal to the direct response of one transducer to an impulse applied to the other. More recently, there has been a growing interest in using Green’s function recovery technique to study the temperature effect on subsurface velocity variation in the lunar environment [18], to improve the near-surface ultrasonic array imaging resolution [19], etc. By comparing diffuse waves before and after external perturbations, time-lapse monitoring such as stress change [20], temperature variation [21], and progressive damage [22] can be achieved locally from only one fixed transmitter-receiver pair. Meanwhile, cross-correlation techniques with different stability and computational costs [16] have been developed under various names (e.g., cross-spectral moving-window technique (CSMWT), doublet method, stretching method, coda wave interferometry (CWI)) in different research communities. In 2002, Snieder et al. [23] showed that, together with the sensitivity kernel, the CWI technique can be expanded to have a full-field velocity perturbation. Similarly, Rossetto et al. [24] introduced an innovative technique called Locadiff for weak change inspection including emerging defects. Prior knowledge of the materials or exact wave propagation distance is not necessary with this method, which could be important for anisotropic structures [25]. Locadiff has been applied successfully for crack localization in pre-cracked concrete specimens under four point bending [12] with a spatial resolution of a few centimeters. The correlation/decorrelation coefficients are influenced by crack- and deformation-induced geometry changes. On-site detection of three dimensional multiple pre-existing cracks is also realizable for an aeronautical wind tunnel [26]. Combing the Locadiff and CWI techniques [23] together, both the microstructure and velocity variation fields can be obtained to better understand the mechanical behavior of natural rock samples [27].
Because of its great potential for structural health monitoring and nondestructive evaluation in complex structures, diffuse wave inspection has been investigated for fiber reinforced composites as well. Zhu et al. [28] have used coda waves to determine the internal stress in a polymer composite. Livings et al. [29] have explored the sensitivity of diffuse wave correlation coefficients, amplitude spectrum, and phase spectrum under different fatigue cycles for unidirectional carbon fiber reinforced polymer composites ([90/45/-45/906]S). Waveform variation is not only caused by the fatigue cycle number, but also by the gain change, couplant type, excitation source type, frequency, etc. Although diffuse wave analysis can detect fatigue induced micro-cracks theoretically, precautions should be taken for all these experimental factors. Patra et al. [30] have applied a modified stretching technique to evaluate the progressive damage state of woven carbon fiber composites online under high-cycle-low-load fatigue loading. The precursor damage index (PDI), which is defined as the cumulative sum of the stretch parameters, can indicate the local formation of micro-scale defects. The sudden slope change of the PDI represents the stress state change from concentration to relaxation during defect generation. Recently, Pascal et al. [31] applied coda wave interferometry to monitor micro crack propagation in a polypropylene sulfide based carbon fiber composite with a layering sequence of [0°/90°, -45°/45°, 0°/90°, -45°/45°]s during a four point bending test. The relative velocity evolution can be derived from waveform correlations, which indicates the damage state.
To date, few attempts have been made to investigate defect localization in fiber reinforced composites with diffuse wave inspection. The present work aims to understand this procedure experimentally for a single defect localization in a cross-ply fiber reinforced structure. We will first review the Locadiff technique based on diffuse wave field. Then, the experiment results will be presented and analyzed.
2. Theoretical background
During diffuse wave propagation in a non-homogeneous material, the energy of a diffuse wave in a defined frequency for a source can be described by the diffusion equation [32]:
where D is the wave diffusivity, k is the dissipation parameter, t is the time, is the energy propagated from a source S to a receiver R. Equation (1) describes the spatio-temporal variation of the diffuse wave field. A more accurate description can be obtained from the radiative transfer equation [33].
Supposing the waveforms and can be obtained before and after a defect appearance during experiments, they are related with the energy through Equation (2) [24,34]:
in which c is the wave velocity, is the scattering cross-section, and x is the defect location. It can be normalized into Equation (3):
in which is the correlation coefficient and is the decorrelation coefficient. They all depend on the time and the positions of the source, the receiver, and the defect location. = 0 when no defect presents () and = 1 when the two waveforms are absolutely different (e.g., with large cracks). The decorrelation coefficient is related to the defect sensitivity kernel function using Equations (4) and (5) [35]:
in which
Equation (5) does not have an analytical form in general and should be calculated numerically [33].
Once and are obtained, the defect location can be predicted from different inversion algorithms, e.g., the linear least square inversion method [35] and the Monte Carlo Markov chain method [36]. Here a classical grid search method is used to find the most likely defect position using the cost function below:
The probability density of the defect appearance at x is defined in Equation (7):
where ε is a fluctuation parameter for the measured decorrelations and C is a normalization constant.
3. Experiments
A [0°/90°]12 carbon fiber reinforced epoxy composite laminate made using a hot press process with unidirectional prepregs (Toray) is studied here; the experimental set-up is shown in Figure 1a. The plate is 510 mm × 510 mm × 3 mm in dimension. Since the thickness is small compared to the length and width dimensions, we will treat the plate as a two-dimensional model based on Equation (1). Due to the high attenuation of ultrasonic waves in the composite plate (4.3 dB/cm at 5 MHz [37]), the pitch-catch configuration is chosen and the gain is 17 dB. The high-pass filter is 1 MHz, while the low-pass filter is 10 MHz. The longitudinal transducer (A551S 5 MHz, Olympus, Inc., Tokyo, Japan) is excited using a pulsed source from a signal generator (Shantou Goworld Display Co., Ltd., Shantou, China). The waveform is recorded using a same type longitudinal transducer through an oscilloscope (TBS1202B, Tektronix, Inc., Beaverton, OR, USA) connected to a personal computer. The ultrasonic sensors are fixed to the plate by 3D printed fixtures with springs inside to apply constant forces on the sensors. A high viscosity couplant can provide good wave transmission and a traditional honey is applied. The defect is simulated using a circular piezoelectric medium attached to the composite plate surface [38]. Signals are amplified and averaged over 10 acquisitions for each source-receiver pair to minimize noises such as the rapid changes of capacitances between conductors due to flexing, twisting, or transient impacts on cables. Furthermore, since an important signal variation has been observed with a minor sensor movement, the defect is attached and detached repeatedly while keeping each source (S)-receiver (Rn, n = 1–4) pair fixed during signal recording (Figure 1b).
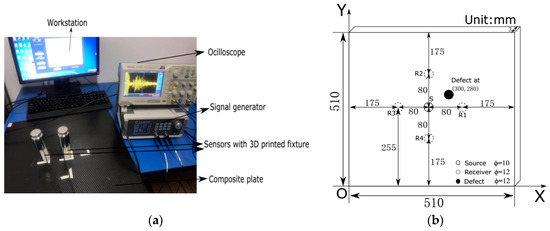
Figure 1.
(a) Experimental set-upand (b) measurement scheme.
A typical waveform from S-R1 is presented in Figure 2. No first arrival time variation can be observed using an amplitude threshold picker [39]. The wave diffusivity and the dissipation parameter can be decided from the waveform envelope through the Hilbert transform based on Equation (1) that D = 100 m2/s and k = 3 × 10⁵ /s. The dissipation parameter k is an indication of viscoelasticity, which describes the exponential decay at late times. It is much larger than that of concrete with 5500/s [26]. These values fit well with waveforms in 0° and 90° directions. In contrast, the waveforms from off-axis directions (30° and 60°) have poor signal-to-noise ratios, as shown in Figure 3. It can be difficult for the diffusion property to be decided in those directions, which makes measurement with an arbitrary sensor location unreliable. Only the measurements along the X and Y axes are chosen here, and a constant diffusion property is assumed during the defect sensitivity kernel calculation under the measurement scheme in Figure 1b. The first arrival time is about 10 μs and gives a group velocity of 8000 m/s along the X and Y axes. In fact, the directivity of the group velocity [40] does not interfere with the defect localization procedure according to Equation (6). The transport mean free path L* = 2D/c ≈ 0.025 m is less than the transmitter-receiver pair distance 0.08 m, which ensures the ultrasonic wave is multiple scattered. The wave diffusivity is a characteristic of the microstructure which relates to the arrival time of the maximum energy density and decreases with frequency. A large variation of D has been found for concrete, from 10 m2/s [32] to 70 m2/s [26], because of its internal structure variation and frequency sensitivity to the diffuse wave. This can be expected as well for fiber reinforced composites. Quiviger et al. found that D varies from 17 to 10 m2/s, while the crack size increases from 1cm to 5.5 cm [32]. However, the defect generated here is weak enough that D remains unchanged. This mimics an early stage surface crack initiation.
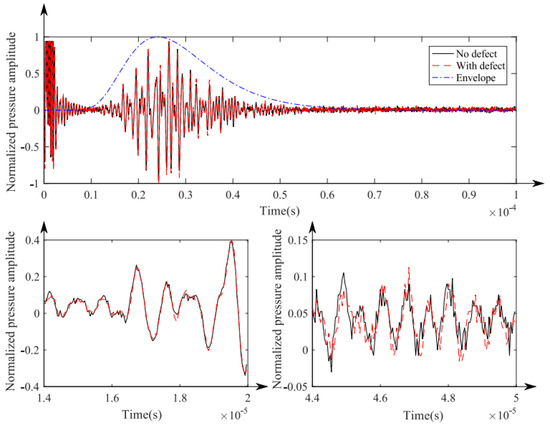
Figure 2.
Representative waveforms from the S-R1 pair.
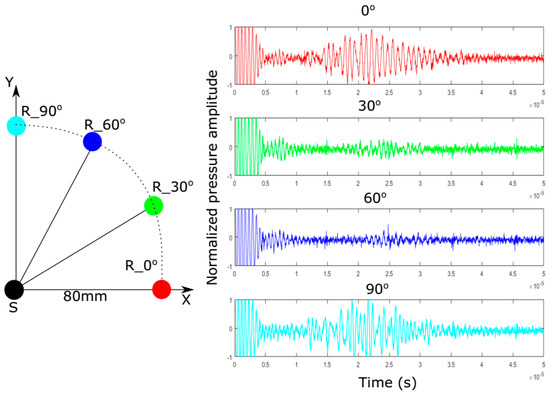
Figure 3.
Waveforms from different directions at 0°, 30°, 60°, and 90°.
4. Results and Discussion
4.1. Decorrelation Coefficient and Defect Sensitive Window
According to Equation (3), the correlation and decorrelation coefficients can be determined from the waveforms with and without a defect. The stretching method demonstrates great stability to external noise and is applied here [16]. The decorrelation coefficients can be calculated according to Equation (8):
in which the window length T = t2 − t1 is set to 10 μs and the beginning of the time window t1 is shifted sequentially with a time step of 5 μs each time. The stretching factor is chosen to vary from −0.015 to 0.015, from which the decorrelation coefficient is decided when reaching the minimum (Figure 4). The total results for all decorrelation coefficients varied with time are shown in Figure 5. They all increase with time as a growing interaction between the diffuse wave field and the defect takes place. The maximum coefficients are found when t1 = 45 μs, which is chosen for the defect localization study. S-R1 and S-R2 are more sensitive to the defect compared to that of S-R3 and S-R4 due to their different positions relative to the defect. After t1 = 45 μs, the decorrelation coefficients decrease because of the reflection part interference and signal attenuation.
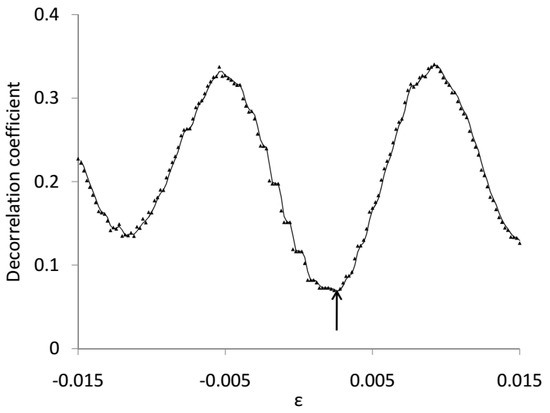
Figure 4.
Decorrelation coefficient calculation example for the waveforms presented in Figure 2 when t1 = 45 μs (decorrelation coefficient = 0.0679 when ε = 0.0026).
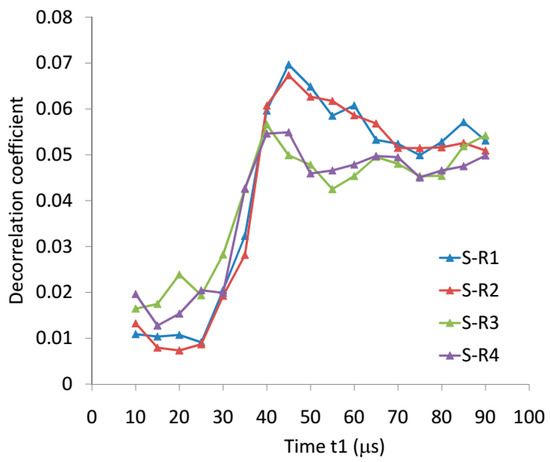
Figure 5.
Decorrelation coefficients varied according to time.
4.2. Kernel Function
The defect sensitivity kernel represents the probability of a wave sent from location S to pass at location x and then to arrive at location R after period of time t [11]. Considering the source images due to the four straight boundaries of the plate, the detection diameter Zdetection is 260 mm when t = 45 μs, as shown in Figure 6 based on Equation (5). The diffuse wave field is mostly sensitive to the defect in this range. In fact, the diffusion model simplifies the energy distribution and neglects the diffuse field-defect interaction after t = 65 μs, as previously shown in Figure 2. All the pressure amplitudes are equal to zero in that period. The whole space is then discretized into 300 × 300 elements for the possible location of the defect, and a further mesh refinement gives no more localization resolution improvement.
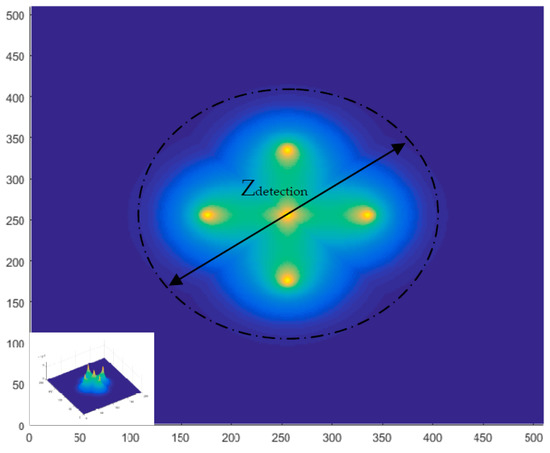
Figure 6.
Sensitivity kernels and detection zone.
4.3. Defect Localization and Error Discussion
Once the decorrelation coefficients and kernel function have been calculated in the defined time domain, the localization is found to be in [270 mm, 265 mm] based on Equations (4)–(7), as shown in Figure 7. A further comparison is made among different time windows in Figure 8. The localization error varies from 13.5% to 6.7%. It decreases initially due to the increasing interaction between the diffuse wave and the defect. The direct reflection wave is estimated to arrive at the defect position at . Subsequently, the localization error increases because of the lowering sensitivity of the waveform to the defect shown in Figure 5, which may be caused by the reflection and attenuation. Although they suffer a lot from attenuation, which limits the inspection domain, a meaningful signal can still be extracted.
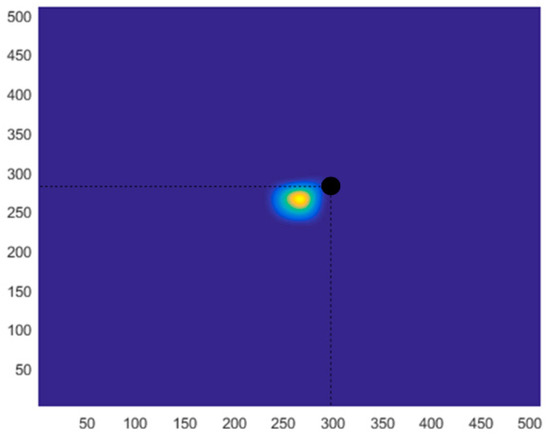
Figure 7.
Localization image when t = 45 us.
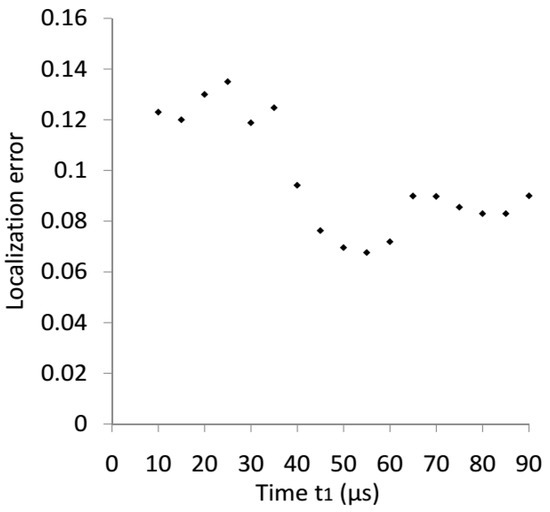
Figure 8.
Localization error varied with time window.
In addition to the severe signal-to-noise ratio degradation due to viscoelasticity, the moderate defect localization deviation mainly comes from two aspects. Theoretically, wave diffusivity and dissipation parameters are assumed constant in the kernel calculation model, which varies according to the directional angles. This approximation contributes to the error in the kernel calculation and grid search procedure in Equation (6). Experimentally, the signal obtained from each pair is the averaged information from the sensor’s field of view. Localization sensitivity may be lost to some extent so that error is introduced as well. The sensor diameter and distribution could be optimized in the future between the direction sensitivity and inspection efficiency in order to obtain high defect localization precision.
5. Conclusions
Fiber reinforced polymer composites can possess complex structures from macroscopic to microscopic scales, which makes their quality assurance difficult. Diffuse wave inspection relies on the multiple scattering process containing rich structure information. It gives a new insight into high frequency ultrasonic inspection for such viscoelastic, inhomogeneous, and anisotropic structures. The diffuse wave field is attenuated fast, while the decorrelation coefficient decreases first with increasing sensitivity to the defect and increases later because of signal-to-noise ratio degradation. Wave diffusivity is assumed constant under the measurement scheme only along the X and Y axes. The most defect sensitive time window is decided in the range of 45–55 μs. Limited by the sensor diameter and waveform attenuation, the defect is found to locate at [270 mm, 265 mm] compared to [300 mm, 280 mm] in the intact state in the given window. This method is promising for early crack detection in various advanced composites in three dimensions. Since the diffuse wave is the statistical summation of random walk ray-paths [23], more experimental studies are expected for different fiber structures. Further investigation of how to distinguish signals from noises in diffuse waves is expected in viscoelastic media, which could be critical for defect localization.
Author Contributions
Data curation, Y.D.; formal analysis, D.T.; investigation, H.Z.; writing—original draft, Q.Z.; writing—review and editing, Y.P.
Funding
The work in this paper is supported by the Shanghai Sailing Program [No.18YF1408400] and the National Natural Science Foundation of China (Grant Nos.116742124, 11874255, 61673252).
Conflicts of Interest
The authors declare no conflicts of interest.
References
- Llewellyn-Jones, T.M.; Drinkwater, B.W.; Trask, R.S. 3D printed composites with ultrasonically arranged complex microstructure. Smart Mater. Struct. 2016, 25, 02LT01. [Google Scholar] [CrossRef]
- Erb, R.M.; Libanori, R.; Rothfuchs, N.; Studart, A.R. Composites reinforced in three dimensions by using low magnetic fields. Science 2012, 335, 199–204. [Google Scholar] [CrossRef] [PubMed]
- Raney, J.R.; Compton, B.G.; Mueller, J.; Ober, T.J.; Shea, K.; Lewis, J.A. Rotational 3D printing of damage-tolerant composites with programmable mechanics. PNAS 2018, 115, 1198–1203. [Google Scholar] [CrossRef] [PubMed]
- Lascoup, B.; Perez, L.; Autrique, L. Defect localization based on modulated photothermal local approach. Compos. Part B Eng. 2014, 65, 109–116. [Google Scholar] [CrossRef]
- Yang, B.; Xuan, F.Z.; Chen, S.; Zhou, S.; Gao, Y.; Xiao, B. Damage localization and identification in WGF/epoxy composite laminates by using Lamb waves: Experiment and simulation. Compos. Struct. 2017, 165, 138–147. [Google Scholar] [CrossRef]
- Pearson, M.R.; Eaton, M.; Featherston, C.; Pullin, R.; Holford, K. Improved acoustic emission source location during fatigue and impact events in metallic and composite structures. Struct. Heal. Monit. 2017, 16, 382–399. [Google Scholar] [CrossRef]
- Kalteremidou, K.-A.; Murray, B.; Tsangouri, E.; Aggelis, D.; Van Hemelrijck, D.; Pyl, L. Multiaxial damage characterization of carbon/epoxy angle-ply laminates under static tension by combining in situ microscopy with acoustic emission. Appl. Sci. 2018, 8, 2021. [Google Scholar] [CrossRef]
- Niccolini, G.; Borla, O.; Accornero, F.; Lacidogna, G.; Carpinteri, A. Scaling in damage by electrical resistance measurements: An application to the terracotta statues of the Sacred Mountain of Varallo Renaissance Complex (Italy). Rend. Lincei 2015, 26, 203–209. [Google Scholar] [CrossRef]
- Chen, B.; Liu, J. Damage in carbon fiber-reinforced concrete, monitored by both electrical resistance measurement and acoustic emission analysis. Constr. Build. Mater. 2008, 22, 2196–2201. [Google Scholar] [CrossRef]
- Snieder, R. Time-reversal invariance and the relation between wave chaos and classical chaos. In Imaging of Complex Media with Acoustic and Seismic Waves; Flink, M., Kuperman, W.A., Montagner, J.-P., Tourin, A., Eds.; Springer: Berlin, Germany, 2002; pp. 1–16. [Google Scholar]
- Xie, F.; Larose, E.; Moreau, L.; Zhang, Y.; Planes, T. Characterizing extended changes in multiple scattering media using coda wave decorrelation: Numerical simulations scattering media. Waves Random Complex Media 2018, 5030, 1–14. [Google Scholar] [CrossRef]
- Larose, E.; Obermann, A.; Digulescu, A.; Planès, T.; Chaix, J.-F.; Mazerolle, F.; Moreau, G. Locating and characterizing a crack in concrete with diffuse ultrasound: A four-point bending test. J. Acoust. Soc. Am. 2015, 138, 232–241. [Google Scholar] [CrossRef] [PubMed]
- Biswal, P.; Reddy, B.N.; Srinivasa, M.B.P. Manufacturing aspects of fabrication of composite reference standard for NDT ultrasonic inspection. In Proceedings of the AeroNDT, Bangalore, India, 3–5 November 2016. [Google Scholar]
- Hennings, B.; Lammering, R. Material modeling for the simulation of quasi-continuous mode conversion during Lamb wave propagation in CFRP-layers. Compos. Struct. 2016, 151, 142–148. [Google Scholar] [CrossRef]
- Aki, K.; Chouet, B. Origin of coda waves:Source, attenuation, and scattering. J. Geophys. Res. 1975, 80, 3322–3342. [Google Scholar] [CrossRef]
- Hadziioannou, C.; Larose, E.; Coutant, O.; Roux, P.; Campillo, M. Stability of monitoring weak changes in multiply scattering media with ambient noise correlation: Laboratory experiments. J. Acoust. Soc. Am. 2009, 125, 3688–3695. [Google Scholar] [CrossRef] [PubMed]
- Lobkis, O.I.; Weaver, R.L. On the emergence of the Green’s function in the correlations of a diffuse field. Ultrasonics 2001, 110, 3011–3017. [Google Scholar] [CrossRef]
- Sens-Schonfelder, C.; Larose, E. Lunar noise correlation, imaging and monitoring. Earthq. Sci. 2010, 23, 519–530. [Google Scholar] [CrossRef]
- Potter, J.N.; Wilcox, P.D.; Croxford, A.J. Diffuse field full matrix capture for near surface ultrasonic imaging. Ultrasonics 2018, 82, 44–48. [Google Scholar] [CrossRef] [PubMed]
- Stahler, S.C.; Sens-Schonfelder, C.; Niederleithinger, E. Monitoring stress changes in a concrete bridge with coda wave interferometry. J. Acoust. Soc. Am. 2011, 129, 1945–1952. [Google Scholar] [CrossRef]
- Zhang, Y.; Abraham, O.; Tournat, V.; Le Duff, A.; Lascoup, B.; Loukili, A.; Grondin, F.; Durand, O. Validation of a thermal bias control technique for Coda Wave Interferometry (CWI). Ultrasonics 2013, 53, 658–664. [Google Scholar] [CrossRef]
- Shokouhi, P. Stress- and damage-induced changes in coda wave velocities in concrete. In Proceedings of the AIP Conference Proceedings, Denver, CO, USA, 15–20 July 2012. [Google Scholar]
- Snieder, R. The Theory of Coda Wave Interferometry. Pure Appl. Geophys. 2006, 163, 455–473. [Google Scholar] [CrossRef]
- Rossetto, V.; Margerin, L.; Plaǹs, T.; Larose, É. Locating a weak change using diffuse waves: Theoretical approach and inversion procedure. J. Appl. Phys. 2011, 109, 034903. [Google Scholar] [CrossRef]
- Kundu, T.; Yang, X.; Nakatani, H.; Takeda, N. A two-step hybrid technique for accurately localizing acoustic source in anisotropic structures without knowing their material properties. Ultrasonics 2015, 56, 271–278. [Google Scholar] [CrossRef] [PubMed]
- Zhang, Y.; Larose, E.; Moreau, L.; d’Ozouville, G. Three-dimensional in-situ imaging of cracks in concrete using diffuse ultrasound. Struct. Heal. Monit. 2018, 17, 279–284. [Google Scholar] [CrossRef]
- Xie, F.; Ren, Y.; Zhou, Y.; Larose, E.; Baillet, L. Monitoring local changes in granite rock under biaxial test: A spatiotemporal imaging application with diffuse waves. J. Geophys. Res. Solid Earth 2018, 123, 2214–2227. [Google Scholar] [CrossRef]
- Zhu, Q.; Binetruy, C.; Burtin, C. Internal stress determination in a polymer composite by Coda wave interferometry. In Proceedings of the IOP Conference Series: Materials Science and Engineering, Hangzhou, China, 20–23 May 2016. [Google Scholar]
- Livings, R.; Dayal, V.; Barnard, D. Feasibility of detecting fatigue damage in composites with Coda waves. In Proceedings of the AIP Conference Proceedings, Boise, ID, USA, 20–25 July 2014. [Google Scholar]
- Patra, S.; Banerjee, S. Material state awareness for composites part I: Precursor damage analysis using ultrasonic guided coda wave interferometry (CWI). Materials 2017, 10, 1436. [Google Scholar] [CrossRef] [PubMed]
- Pomarède, P.; Chehami, L.; Declercq, N.F.; Meraghni, F.; Dong, J.; Locquet, A.; Citrin, D.S. Application of ultrasonic Coda wave interferometry for micro-cracks monitoring in woven fabric composites. J. Nondestruct. Eval. 2019, 38, 26. [Google Scholar] [CrossRef]
- Quiviger, A.; Payan, C.; Chaix, J.; Garnier, V.; Salin, J. Characterizing extended changes in multiple scattering media using coda wave decorrelation. NDT E Int. 2012, 45, 128–132. [Google Scholar] [CrossRef]
- Kanu, C.; Snieder, R. Numerical computation of the sensitivity kernel for monitoring weak changes with multiply scattered acoustic waves. Geophys. J. Int. 2015, 203, 1923–1936. [Google Scholar] [CrossRef]
- Planeès, T.; Larose, E.; Rossetto, V.; Margerin, L. LOCADIFF: Locating a weak change with diffuse ultrasound. In Proceedings of the AIP Conference Proceedings, Denver, CO, USA, 15–20 July 2012. [Google Scholar]
- Planès, T.; Larose, E.; Rossetto, V.; Margerin, L. Imaging multiple local changes in heterogeneous media with diffuse waves. J. Acoust. Soc. Am. 2015, 137, 660–667. [Google Scholar] [CrossRef] [PubMed]
- Xie, F.; Moreau, L.; Zhang, Y.; Larose, E. A Bayesian approach for high resolution imaging of small changes in multiple scattering media. Ultrasonics 2016, 64, 106–114. [Google Scholar] [CrossRef] [PubMed]
- Williams, J.H.; Nayeb-Hashemi, H.; Lee, S.S. Ultrasonic attenuation and velocity in AS/3501-6 graphite fiber composite. J. Nondestruct. Eval. 1980, 1, 137–148. [Google Scholar] [CrossRef]
- Chehami, L.; Moulin, E.; De Rosny, J.; Prada, C.; Assaad, J.; Benmeddour, F. Experimental study of passive defect detection and localization in thin plates from noise correlation. Phys. Procedia 2015, 70, 322–325. [Google Scholar] [CrossRef][Green Version]
- Carpinteri, A.; Xu, J.; Lacidogna, G.; Manuello, A. Reliable onset time determination and source location of acoustic emissions in concrete structures. Cem. Concr. Compos. 2012, 34, 529–537. [Google Scholar] [CrossRef]
- Mei, H.; Haider, M.F.; Joseph, R.; Migot, A.; Giurgiutiu, V. Recent advances in piezoelectric wafer active sensors for structural health monitoring applications. Sensors 2019, 19, 383. [Google Scholar] [CrossRef] [PubMed]
© 2019 by the authors. Licensee MDPI, Basel, Switzerland. This article is an open access article distributed under the terms and conditions of the Creative Commons Attribution (CC BY) license (http://creativecommons.org/licenses/by/4.0/).