1. Introduction
We are very likely at a crossroads today with respect to the role that information analysis is given worldwide and in our everyday lives. Everyone is familiar with several terms which come from the so-called Data Science [
1], as they are continuously flooding the news, videos, courses, webs, and social media. We get the feeling that the awareness of organizations and companies is growing in terms of the relevance that they perceive from the large amounts of information sources currently available in and around them [
2]. We also suggest that successful understanding of the data exploitation keys can be equivalent to successful entrepreneurship, business, or management environments, as far as we were able to smartly apply it to our fields of expertise [
3]. There seems to be a singular jump from concepts already known in traditional Machine Learning (ML) and Statistics that are also blasting towards the real world in many directions. This situation is somehow similar to and resembles the jump from Multivariate Statistics towards ML and Data Mining. Like then, this could be a twofold story: first, there are not many unknowns present in the newly emerging knowledge areas, as many concepts were known well before; however, secondly, there is still more than enough novelty (technological and theoretical) present in the jump to allow us to go much further, if we are able to orientate ourselves in the dense information and events throughout different disciplines. Two of the terms that we are becoming more familiar with these days are Big Data (BD) [
4] and Deep Learning (DL) [
5]. The former refers to a technology field related in several ways with the application of statistical learning paradigms to large amounts of available data in organizations. The latter corresponds to a set of more specific techniques and learning machines, through costly build processes, which are capable of learning to solve problems in a very similar way as a human expert would. The second can probably be seen as a branch of the first, and both are branches of Data Science [
6,
7], but they are both interesting by themselves separately, and a really large number of reviews can be found today in scientific literature examining both topics separately. However, why another review on them, and why even jointly?
On the one hand, BD is one of the most discussed topics today, across very different industry sectors. It is not easy to recall a topic that has received so much hype and so broadly and quickly as BD has [
8]. The BD term itself is now so complex that it cannot be defined by a unique and well-defined theoretical description. BD aims to set itself apart from other terms (like Data Mining, which is also about analyzing data and advanced analytics) when data volumes are so big, so fast-changing, so complexly-formatted, and coming from so many sources that new and special technologies are required to extract the knowledge (i.e., patterns, trends, or behavior) from the data [
9]. The term BD was included in the Oxford English Dictionary in 2013 [
10]. We follow the path of virtually all of the BD reviews in the field when we recall that Gartner in 2012 [
11] had defined BD using the three H-Vs: “BD is high-volume, high-velocity, and high-variety information assets that demand cost-effective, innovative forms of information processing for enhanced insight and decision making”. This last one had certainly been derived from Laney’s definition in 2001 [
12]: “While enterprises struggle to consolidate systems and collapse redundant databases to enable greater operational, analytical, and collaborative consistencies, changing economic conditions have made this job more difficult. E-commerce, in particular, has exploded data management challenges along three dimensions: Volume, Velocity, and Variety.”
Although nowadays every industry (medicine, marketing, publishing, automobile, and so many others) tends to provide their own BD definition [
4], almost all of them are typically referring to some data and problems that share some of the following characteristics [
13] related to the first three V’s of Laney: (1) Big, as many observations or many features are to be handled or stored (in other words and terms, datasets with sizes from terabytes to zettabytes); (2) With different structured, semi-structured and/or unstructured information (from temporal to spatial, graph structure, and more); (3) Need for modeling non-traditional problems (including network evolution, collaborative filtering, learning, and beyond); (4) With data coming at an increasingly fast speed and with a very short time to act; (5) Need to maintain privacy and security of the data while sharing it and extracting information from it; (6) The difficulty to analyze and visualize the data correctly; In addition, (7) the final objective is usually the decision-making from valid statistical modeling problems. Whereas not all the applications need to share these characteristics in order to be considered BD problems, the potential utility of BD is still unclear and under research currently [
14], and the interest in the field is usually promising enough so as to put the possible inclusion or not into the BD scenarios as secondary, when faced with the expected revenue from data analysis in the organizations. In the end, there seems to be agreement in the fact that BD is a trinomial for storing an immense and rapidly growing stock of information, technologies able to work with a wide variety of heterogeneous data generated at ever increasing rates, and a real-time target analysis of the whole [
15]. However, maybe with a push from academia, the definition of BD has aimed to grow and to be included in the novelty of the BD fever. In 2014, two additional characteristics (two additional V’s) emerged, namely, Value and Veracity. According to [
16], value can be obtained through the integration of different data types to improve business and gain competitive advantages, and veracity draws our attention to possible imprecise data, since sometimes the analysis is based on datasets with several degrees of precision, authenticity, and trustworthiness. In 2015, two more characteristics (although with less attention in the literature) were introduced [
17], namely, variability and complexity. Variability is related to the different rates at which data flows, according to different peaks and inconsistent data velocity. Complexity highlights the challenge of dealing with multiple data sources, namely to connect, match, clean and transform them. Today, up to more than nine Vs are used in the BD definition [
18]. This shows the huge complexity that BD can involve from an academic point of view, but it is not an obstacle for organizations devoting interest and resources to the field.
On the other hand, DL is a ML branch which is also experiencing very fast growth lately due to renewed interest in these algorithms [
19], and mainly since Geoffrey Hinton and his team reduced the top-5 error rate by 10% in 2012 at the ImageNet Large Scale Visual Recognition Challenge [
20] when compared to all the other competing neural networks and learning schemes. Since then, easy-to-use software packages (like Pytorch, Keras, or TensorFlow), hardware improvements in Graphical Processing Units (GPUs) that allow for performing a number of tasks historically impossible to perform, large training datasets, and new techniques for fast training, have together enabled us to deliver DL towards a broad community of computational scientists and, of course, to the business world [
21]. All this has led to the massive application of DL to a wide range of fields, including automatic speech recognition, image recognition, natural language processing, drug discovery, or bioinformatics, to name just a few. However, the requirement of DL having a really huge amount of data in order to train correctly its millions of parameters is one of the main challenges in many of those fields, such as certain medical scopes, where collecting and annotating amounts of data is a highly expensive process. Some solutions like pre-trained networks from other fields and data augmentation try to solve that problem, they have demonstrated remarkable results [
22], and they are currently an open field for development and for research.
BD and DL can be said to be closely related in their intersection. BD technologies have to manage extremely large data sets that necessitate effective and efficient computational tools to analyze and interpret such data, and DL algorithms could cope with several of those challenging problems such as a learning paradigm, since it requires a large amount of data for proper functioning [
19]. In this double review, we outline the landscape on the current state of these two different and related branches of Data Science, in order to understand their current state and future evolution in the healthcare area. Our view is that a good number of success-cases exist in several application fields, like technological or financial companies and organizations, which have quickly evolved into revenue and generated interest in the society. Both academic literature and technology transfer contributions can be identified therein, and they can be illustrative on the characteristics required to use real-world success stories from their application. On the other hand, the interest in healthcare on BD and DL technologies has been driven on a different path, and, to the best of our knowledge, there seems to be an increasing number of academic contributions and efforts, but probably the saddle point has not yet been reached. As far as it is just a matter of time for this to happen, there is no doubt that healthcare will sooner or later become one of the vastest scenarios for exploiting large amounts of our own big amounts of data. Hence, we analyze different viewpoints to try to understand where the bottlenecks are today, the promise, and the scientific and non-scientific limitations.
In
Section 2 and
Section 3, we provide elementary ideas on the technical elements of BD and DL techniques, respectively, by following their usual description in scientific literature. Aiming to promote the critical comparison across application fields,
Section 4 summarizes some of the success stories from technological, financial, and other relevant areas. The academic effort that has been put in to bring these technologies to healthcare are then summarized and analyzed from a twofold view. First, in
Section 5, a set of current application examples is examined bearing in mind the differing nature of medical data, including data forms in electronic health records, medical time signals, and medical images. In addition, secondly, in
Section 6, a specific application field is paid special attention, namely, the electrocardiogram (ECG) signal analysis, where a somehow surprisingly large number of works has been published in the last three years. In
Section 7, we provide a toy DL application example with the aim of supporting the research areas by encouraging residents and newcomers to healthcare Data Science. These examples use publicly-available code and dataset (the MIMIC dataset), and they are not a substitution for courses and advanced PhD formation, but rather a fast start-out on these basic concepts before going ahead. Finally,
Section 8 conveys some open and critical discussion for current and forthcoming challenges on the use of both Data Science tools in tomorrow healthcare, with the only aim of trying to think where to go from here and which path will better suit our efforts in the coming years.
2. Big Data Fundamentals and Elements
During the past few years, BD technologies have been highlighted as a fundamental and strategic support for very different aspects such as productivity growth, innovation, or customer relation, to name a few. These in turn can strongly benefit large-scale business and sectors, like retailing, manufacturing, healthcare, the public sector, or entire cities [
23]. Probably the power of BD is not only in the current availability of extensive data volumes in the organizations, but also in the application of adequate and well-chosen analysis techniques. Working together, these two elements are expected to allow us to gain valuable insight in new applications and markets. According to Gartner’s definition [
24], BD analytics can actually provide us with three main benefits, namely, valuable insights can be extracted from data, better decisions can be made based on those insights, and decision-making can be automated and included in the management process itself.
Current definitions of BD are dependent on the techniques and technologies used to collect, store, process, and analyze available data [
15]. BD solutions have been established to usually share several principles [
25,
26,
27]. First, they often use high-level architectures, which are necessary to address the different and specific underlying data technologies and sources. Second, they usually include a variety of Data Science tasks, such as Data Mining, Statistical Analysis, ML, Real-Time Visualization, or In-Memory Analysis. Third, they combine the benefits of different tools for different tasks. Fourth, distributed processing and storage is often used across different nodes in a cluster. In addition, finally, coordination among data and processing nodes is ensured to improve scalability, efficiency, and fault-tolerance.
The following paragraphs outline the most relevant techniques and technologies which are used today to carry out the design and implementation of BD solutions [
15], as they can roughly be grouped into considerations about the BD life cycle, the infrastructural requirements, the frameworks and libraries, and the visualization tools.
(1) The BD Life Cycle. Dealing with BD implies gathering related knowledge in areas like ML, programming, and databases [
15]. Techniques such as sentiment analysis, time series analysis and forecasting, spatial analysis, optimization, visualization, or unstructured analytics (namely, audio and video) are necessities in the BD life cycle for extracting value from it [
15,
17], especially when performed in a distributed manner to achieve scalability [
26]. This BD life cycle is significantly different from traditional environments, in which data are first explored, then a model is designed, and finally a database structure is created. In BD environments, however, data are first collected and loaded to a certain storage system, then a metadata layer is applied, and finally a structure is created [
15]. Therefore, data are first transformed and then loaded in traditional approaches, whilst data are first loaded and then transformed in BD approaches [
18,
28].
(2) Infrastructure Requirements. An adequate infrastructure is fundamental for providing BD solutions. Among the most relevant are the cloud models, such as the increasingly widespread Infrastructure as a Service (IaaS). In these kinds of models, commodity hardware plays a relevant role, especially due to the lower costs in building shared-nothing architectures [
15]. Two BD architectures stand out among so many, namely, the Lambda Architecture [
25] and the National Institute of Standards and Technology (NIST) BD Reference Architecture [
29]. In order to satisfy particular needs, Lambda Architecture [
25] uses a system based on three main components, namely, a batch layer, a serving layer, and a speed layer (for real-time data). However, NIST BD Reference Architecture is rather an open tool (not tied to specific vendors, services, implementations, or any specific solutions) to facilitate the discussion of requirements, structure designs, and operations that are inherent in BD environments.
(3) BD Frameworks and Libraries. A growing number of frameworks and software libraries can be found to support BD development. MapReduce is an algorithm for processing parallelizable tasks across large datasets using a great number of nodes, which has been fundamental for the advent of the BD scenarios. The most commonly recognized open-source implementation of MapReduce is Apache Hadoop [
30,
31], which is capable of providing reliable and scalable distributed computing. In addition to being open source, Hadoop is less expensive, it has a more flexible storage (mainly in unstructured data), it is adequate for massive scans, and it has deep support for complex structures. Beyond the processing capabilities of MapReduce, another option for large scale number crunching is General Purpose GPU Programming (GPGPU), such as Nvidia CUDA and OpenCL framework [
32]. Another solution, based in Hadoop, is Mahout library [
33], which is an ML and Statistics library able to work in distributed application environments. However, the MapReduce key-value approach prevents the implementation of many ML algorithms, and it is too often only useful for an initial phase of data preprocessing rather than for an advanced ML-based data analysis. For this reason, Mahout is not very scalable in terms of most ML algorithms. Apache Spark [
34] is a unified analytics engine for large-scale data processing, which is certainly more flexible than MapReduce and Mahout, but it still has some limitations when typical ML operations, such as
-matrix inverse calculations or decompositions, are implemented. SciDB [
35] is a column-oriented database management system designed for multidimensional data management and analytics, which is an attempt to unify the relational databases in a multidimensional way, trying to overcome some of the limitations that the relational databases have with BD problems. Graph database libraries like Neo4j or Titan are also widely used in BD, since they make use of graph theory for high-density operations of traversing and querying data without expensive requirements nor index lookups [
36]. Moreover, graph databases store and access data by using the same abstraction are used to explain and to structure them. Pregel [
37], Apache Giraph [
38], and Apache Hama [
39] are implementations of the Bulk Synchronous Parallel (BSP) model, which is a bridging model [
40] for creating parallel algorithms [
41]. BSP works in a similar way to a communication network where each individual processor has its private, fast, and local memory. This makes BSP highly effective at processing large amounts of highly interrelated information. Other interesting libraries related to BD are: MLPACK [
42], a state-of-the-art, scalable, multiplatform C++ ML library that provides cutting e.g., algorithms whose benchmarks exhibit far better performance than other leading ML libraries; in addition, GraphLab, a Python ML [
43] library designed to operate on either a single machine or an existing distributed cluster.
The above solutions are only a fraction of what is available under the heading of BD. Each one has been created with a specific problem subset in mind, and hence with its advantages and disadvantages. After analyzing these solutions with respect to the four V’s of BD (Volume, Velocity, Variety, and Variability), it was concluded [
32] that the best solution depends: (1) On how our data are structured; (2) On the specific problem we are trying to solve; (3) On the hardware we have available; (4) On the experience, knowledge, and skills that are available; (5) On the amount of time we can have; (6) On the algorithm or algorithms that we need to utilize; (7) If we need to respond to immediate requests for results or scheduled batches; (8) If we have static or shifting data; (9) Or if we are utilizing existing storage or need a new system. Authors of BD State-of-the-Art in [
32] point out that “it is vital that you examine your own goals and ruthlessly parse the available options with an eye for what you are trying to achieve, but also what you might wish to achieve in the future”.
(4) Visualization. After analyzing data, the results need to be visualized through a good graphical tool. Regarding BD visualization, several tools can be highlighted, such as Datameer, FICO BD Analyzer (former Karmasphere), Tableau, or TIBCO Spotfire [
18]. Other solutions used to visualize the results include statistical tools (such as R or SAS), business intelligence tools (like Jaspersoft Business Intelligence Suite or Pentaho Business Analytics) [
44], programming languages (such as JavaScript or Python), and office tools (like Excel) [
45].
3. Deep Learning Fundamentals and Elements
Artificial Intelligence (AI) could be defined as the capacity of computers to exhibit or simulate intelligent behaviour when automating tasks that are normally performed by humans [
20,
46]. AI was born in the 1950s, when researchers in the field of computer science started asking whether computers could be made to think [
47]. In the beginning, researchers believed that AI could be achieved with handcrafted programs with a large set of explicit predefined coding rules specified by human operators [
20,
46]. This kind of AI is known as symbolic, and it was the dominant paradigm in AI from the 1950s until the late 1980s [
47]. Even though this paradigm is useful at solving well-defined logical problems like playing chess, it is incapable of solving complex problems where finding out explicit rules is very hard, for instance, image classification, object detection, speech recognition, or language translation. However, ML emerged as a new approach replacing symbolic AI [
46,
47] and it started to grow quickly in the 1990s, until becoming probably the most popular and most successful field of AI.
Broadly speaking, ML can be seen as the ability of computers to extract information from the input of raw data and to learn from experience, thus generating complex inferences based on the relationships within the data [
48]. Thereby, ML builds predictive models without using predefined coding rules [
20], and it is able to deal with large and complex datasets for which statistical analysis would be unfeasible. We can divide ML algorithms into three categories, namely, supervised, unsupervised, and reinforcement learning. In supervised learning, the goal is to learn a function that, from a sample of input–output pairs (labeled as training data), approximates the relationship among inputs and outputs well enough in the labeled training data, and then the inferred function can be used for mapping new data. By contrast, unsupervised learning seeks to identify hidden patterns present in datasets, without the requirement that they are labeled. Lastly, reinforcement learning aims to maximize the accuracy of algorithms learning actions that maximize some reward [
49].
ML algorithms strongly depend on
feature engineering, which is the process of using domain knowledge of the data to create features that make these algorithms work. The process requires lots of time and effort for feature selection, and features must extract relevant information from huge and diverse data in order to produce the best outcome [
48,
50]. These approaches have shown good results on structured data, such as sales predictions or recommendation systems; however, in unstructured domains, such as computer vision and natural language processing, feature engineering is a challenging task for ML algorithms [
47]. To handle these problems, a special branch of ML arose, so-called DL, which is based on the concept of Artificial Neural Networks (ANNs, also known simply as Neural Networks) [
51]. The major difference between DL and traditional ANNs are the number of hidden layers [
48]. ANNs are usually limited to three layers and they are known today as Shallow Neural Networks, whereas DL are NNs with many layers and they are referred to as Deep Neural Networks (DNNs) [
52]. DNNs use multiple layers to explore more complex nonlinear, patterns and learn meaningful relationships within the data [
51], and they learn and construct inherent features from each successive hidden layer of neurons, by minimizing or even removing the need for feature engineering. This last factor resulted in DL often outperforming ML techniques [
50], revolutionizing this field with outstanding results and robustness to input noise and variability in diverse tasks [
53]. Therefore, some authors point that DL could be seen as a specific case of BD solution, since the implementation of BD techniques, such as the parallelization in GPUs, has made this computationally demanding solution viable. This view is not shared by everyone, as the BD regime is often assumed to be fast changing and moving with time. Nevertheless, the previously discussed different and changing views of BD definitions are also shared by other authors. In any case, DL needs to overcome several challenges before becoming a widespread solution, including the requirement of large training sets and the demand for a tremendous computational power, both of them in order to be able to train the many hidden layers [
20,
21]. The previous causes can produce a lack of generalization in the solution with new data or overfitting. The lack of ability to explain or interpret the reasons for the obtained output (black box) is also an open issue. The advent of BD with very large datasets and GPUs with hardware improvements have enabled to reduce the computational problem. In addition, research efforts in recent years are opening new ways of addressing the problems of overfitting and interpretability [
54,
55]. There have been other major issues such as better easy-to-use software libraries (like Theano, TensorFlow, Keras, or Pytorch), better algorithms, and a large community of researchers and developers, which when put together have had an incredible impact on our world and reached a level of public attention and industry investment never seen before in the history of AI [
47].
Since DL is based on the concept of ANNs, we start with a brief history of the evolution of its algorithms. Artificial neurons were first proposed in 1943 as a model for how neurons process information in the biological brain [
21]. Early ANN algorithms tried to model the functionality of a biological brain with a structure that was made of three layers (input, hidden, and output). Each layer consisted of several artificial neurons based on activation functions which linked them to each other and linked to the next layer through weighted connections [
53,
56]. Thereby, the axon is played by the output, the dendrites are played by the inputs, the nucleus is played by the activation function, and the synapses are played by the weights [
50]. ANNs are especially useful in nonlinear, classification problems [
53]. After the 1960s, research in ANNs slowed down due to the low capability, their shallow structure, and the limited computational capacity of computers [
19]. Some papers in the 1980s significantly contributed to the comeback of ANN algorithms with the emergence of backpropagation [
56], an algorithm based on the chain rule that made training possible, so that weights were modified by evaluating the difference between the predicted and the true class labels. However, backpropagation seemed to work only for certain types of shadowed ANNs [
19], and training a mostly deep ANN (with more layers) was difficult in practice [
56], mainly due to high computational complexity and the limited size of the databases. Other ML algorithms, such as Support Vector Machines (SVMs), Random Forest, and k-Nearest Neighbors (kNN) algorithms, gradually surpassed ANNs in popularity [
19]. In 2006, there was a real impact milestone, when a paper entitled “A fast learning algorithm for deep belief nets” [
57] was published. The idea that this work proposed was that DNNs with many layers can be trained if the weights are initialized in the correct way. This point is considered the beginning of the DL movement. Since then, more important DL papers started to appear. The 2007 paper entitled “Greedy Layer-Wise Training of Deep Networks” [
58] concluded that DNNs are more efficient for difficult problems than other ML algorithms (included shadow NN). However, by 2010, DL was being almost completely ignored by the scientific community, except for some groups: Geoffrey Hinton at the University of Toronto, Yoshua Bengio at the University of Montreal, Yann LeCun at New York University, and IDSIA in Switzerland [
47]. An important breakthrough came about in 2012, when Hinton and his group were able to increase the top-5 accuracy from 74.3% to 83.6% at the ImageNet Large Scale Visual Recognition Challenge (ILSVRC). Since then, DL has become the reference algorithm for a large number of tasks, like computer vision and natural language processing, both in the scientific and in theindustrial world [
20].
DL, just like ML, can be used both in supervised applications as well as in unsupervised applications [
20]. Depending on this application, DNN architecture comes in many different forms [
21], which can be grouped into three general families.
(1) Feed-Forward Neural Networks (also known as Multi-Layer Perceptron, MLP). This architecture can be considered as the
par excellence DL model. It consists of artificial neurons grouped in an input layer, many hidden layers, and an output layer, in which each previous layer is weight connected via some activation function to the next layer. Thereby, information flows from the input layer to output layer without feedback connections [
5].
(2) Convolutional Neural Networks (CNN). Feed-Forward Neural Network architecture performance is affected by translation and shift deviation, which are pernicious for some tasks, like those that are related to images. CNN were created to eliminate these deficiencies while accounting for the properties of translation and shift invariance. This DL architecture is one of the most popular and the most influential innovations in the field of computer vision. Inspired by the neurobiological architecture of the visual cortex (cells in the visual cortex are sensitive to small regions of the visual field), it was first proposed and advocated for image analysis by Lecun et al. in 1989 [
51,
59]. It is a hierarchical model that consists of convolutional and subsampling layers. In the convolutional layer, artificial neurons compute a spatial convolution extracting features of small portions of input images during the training. A special CNN model (AlexNet) was used by Hinton’s group to win ILSVRC in 2012 [
19,
20].
(3) Recurrent Neural Networks (RNN). This architecture is a variation of Feed-Forward Neural Networks that exhibits dynamic behavior. Artificial neurons are connected to each other with a delay and are associated with time steps, in a way that parameters across this different time steps are shared. Basically, the RNN architecture receives the input, it updates its high-dimensional hidden state information that is dependent on the previous computation, and it makes a prediction at each time step. This approach has become the primary tool for handling sequential data because it outperforms other DL approaches in dealing with time-variant data. It has been applied successfully in natural language processing, speech recognition, and machine translation [
19,
21]. To overcome the vanishing gradient, Long Short-Term Memory (LSTM) and Gated Recurrent Units (GRU) RNN architectures are frequently used, since they incorporate memory blocks with gates that control the state and decide which information to add or to remove in each step [
22,
48,
50].
BD has not yet started to be widely used in some disciplines, and sometimes there are very limited databases in them. This lack of data to train DL architectures can produce a problem called
overfitting, which occurs when a learning model memorizes the training data and it does not generalize well when faced with new data [
52]. Even when large datasets are available, the complexity of DL models can make DNNs more prone to overfitting. A common way to avoid overfitting is to simplify the DNN architecture by forcing its weights to take only small values. This method is called weight regularization, and it can be said to have two main flavours, known as
and
regularization. Another plan is to use Dropout, which is one of the most effective and most commonly used regularization techniques for NN. It consists of randomly setting to zero a number of artificial neurons of the layer during training [
47]. Apart from regularization, data augmentation is another important way to avoid overfitting. It refers to increasing the number of data points applying transformation to the dataset. It is normally used with images, by rotating different angles or adding different levels of noise, cropping, and geometrically transforming (e.g., rotation, translation, and scaling) [
48,
52].
Special mention is deserved by the so-called
transfer learning, which involves transferring the knowledge gained by a DL architecture in one dataset onto another dataset with a different kind of data [
20]. It has been shown that DL models are highly reusable, especially convolutional architectures where inputs are very high dimensional, such as images, audio, or text data models. A model trained on a large-scale dataset can be reused on significantly different small-dataset problems. This kind of model used in transfer learning are called pretrained networks, and there are two ways to use them, namely, feature extraction and fine-tuning. The first one consists of using a pretrained network to extract features from samples of a new dataset. These features are then run through a new ML algorithm in the output layer, which is trained from scratch. The second one consists of slightly adjusting the pretrained network together with the new classifier in the top layers [
47]. Another type of transfer learning, mainly applied to categorical variables and especially in natural language processing, is the use of precomputed embeddings [
60,
61], which are network-yielded vectors used to represent discrete variables as low-dimensional vectors of continuous values. The use of embedding vectors from a precomputed embedding space, like Word2vec [
62] or GloVe [
63], is very widespread today.
Usually, large DL networks are needed to solve real problems. Training these networks is very challenging and computationally expensive, and the results are models with lots of parameters and operations. Weight pruning is used to decrease the size of the trained model and makes the inference phase more efficiency without compromising accuracy [
64]. A recent publication [
54] articulates the hypothesis that dense, randomly-initialized, feed-forward networks contain some subnetworks that get an accuracy similar to the original network in the same number of iterations when they are trained in isolation.
Most of the famous DL frameworks, like Tensorflow, Keras, or Pytorch, have primary support for Python. However, they are normally multilanguage supported. For example, Tensorflow can be used in C++, JavaScript, or Swift; Keras can be used in R; and Pytorch can be used in C++. Reasons why Python is popular and widely used in DL communities are: (1) Its simple and readability syntax that provides rapid testing of complex algorithms using less code and less time than with other programming languages; (2) The large numbers of libraries and frameworks for scientific computation, advanced computing, visualization, and ML, among others; and (3) the great amount of developers around the world that offer comprehensive support and assistance via forums and tutorials. This is because Python is today the language used in nearly all research and commercial applications of DL. Nevertheless, Python has some problems, namely, it is not designed to be fast and it has poor support for parallel processing. For these reasons, DL core frameworks are written in other languages (generally C/C++ libraries like CUDA), and provide Python (and other languages) wrappers. To avoid all of these problems of combining different languages to solve speed problems, a very promising programming language, called Julia, is emerging strongly due to its ease of use (similar to MATLAB and Python languages), and due to its speed (comparable in most solutions to C languages). Although Julia is still not yet as mature as Python is, it already proposes very interesting libraries for DL like Flux. The blast that DL has witnessed in recent years has generated an unmanageable amount of resources, including books, papers, courses, websites, or blogs. It can be hard work for the beginner to choose which resources to start with. In
Table 1, we list a series of resources available for free to begin with DL techniques.
4. Applications in Technological, Financial, and Other Successful Areas
Companies from all sectors and all over the world are using BD with DL extensively. This makes DL a valuable tool within BD ecosystem [
65] since one of the its greatest assets is to analyze a massive sum of data. Several applications and solutions of BD with DL in academia and industry fall into areas such as computer vision, natural language processing, finance, remote sensing, transportation, marketing and advertising, and education.
(1) Computer Vision. It is a field of computer science that deals with how computers can gain high-level of understanding from images and videos, and which has been drastically improved by DL. Google was one of the pioneers of with the creation of Google Brain in 2011 [
66]. The company uses DL for image recognition, image enhancement, language processing, and for providing better video recommendations, among many others. Face recognition is one of the hottest computer vision applications with great commercial interest [
67], like Google’s FaceNet [
68] and Facebook’s DeepFace [
69]. Human action and activity recognition [
70] and human pose estimation [
71] are other computer vision issues that have received a lot of attention. However, object detection has been one of the the most extended use of DL in the computer vision domains, ranging from defense (surveillance) to human computer interaction, robotics, transportation, and retrieval. Object detection refers to the capability of computers to locate objects in an image and identify each object by outputting a bounding box around the object. CNN architectures are extensively used for this task [
72]. However, due to the lack of interpretability of these DL solutions, these algorithms are easily deceiving [
73,
74]. Therefore, greater efforts are still needed to include techniques to achieve interpretability. An example of these techniques is Testing with Concept Activation Vectors (TCAV) [
55], which follows an approach from the exit to the beginning. This technique is reminiscent of the successful top-down object-based attention mechanism present in one of the most important and promising solutions for AI, known as Recursive Cortex Networks (RCNs) [
75], and it is responsible for the birth of Vicarious, a company currently focused on the creation of AI for robots.
(2) Natural Language Processing (NLP). DL is currently present in most of the natural language processing applications. Language modelling consists of predicting the next word in a text given the previous words. It is a simple language processing task with concrete practical applications such as intelligent keyboards and email response suggestion [
76]. Despite its simplicity, it is the core of many of the recent NLP applications [
77] that require use of language model, such as, machine translation, spelling correction and sentiment analysis. Large companies like Google [
78] or Microsoft with Skype Translator [
79] are actively using it. Lastly, speech recognition is another natural processing area that develops methodologies and technologies enabling the recognition of spoken language into text by computers. YouTube, with automatic captioning, and the rise of virtual voice assistants like Siri, Alexa, Cortana, or Google Assistant, have made it an expanding field in these days [
80]. DL is also helping Facebook to draw value from a larger portion of its unstructured datasets. Most of its DL technology is built on PyTorch platform and created by its Facebook AI Research [
81] division. Twitter processes lots of data through DNN to learn over time which are the user preferences, and the group working in DL technologies within the company is called Twitter Cortex [
82]. This type of approach still lacks the ability to learn the context of a conversation or the concepts that are being treated, which increases the number of misinterpretations of the text, and, subsequently, the user’s distrust. To avoid this effect, further research on learning the concepts themselves would be desirable. Some attempts have been initially applied in visual concepts, which mention the possibility of applying them to different applications, such as textual or auditory scenarios [
83].
(3) Finance. DL and BD play a main role in many phases and processes of the financial ecosystem, including the following ones: stock price prediction based on market sentiment, news, and old track record of the stock; fraud detection in credit cards and transactions; contextual search for research documents used by investment banks; customer segmentation to support sales, promotion, and marketing campaigns by collecting and analyzing all available data; or risk management, using a powerful risk prediction model and offering a global vision of different sectors and areas where financial risk may appear. For example, American Express relies heavily on data and DL to help detect fraud in near-real time, therefore saving millions in losses [
84]. In [
85], it is examined the behavior of borrowers to predict the mortgage risk, in [
86] the fraud in credit card transactions is detected, and in [
87] an algorithm for trading is proposed. The black-box characteristics (lack of interpretability) that these solutions present when taking decisions should be taken into account, since they can cause millionaire losses and subsequent demands.
(4) Remote Sensing. The power of DL has also been exploited by remote sensing scientists to tackle different challenges such as monitoring global changes or evaluating strategies for the reduction of resources consumption [
88]. In the agriculture sector, the goal is around improving profitability and efficiency by reducing the cost of an operation or by increasing product value. BD and DL solutions are implemented to help farmers to make better decisions and to develop efficient ways of crops management, livestock management, water management and soil management [
89]. Data sources like satellites, unmanned aerial vehicle (UAVs), mobile applications, and remote sensors are continuously monitoring farms, enabling the farmers to use prediction models. Disease recognition in plants based on leaf images captured by mobile devices [
90], identification of stage of fruit for automated harvesting [
91], and automated monitoring and management of the agricultural lands in large scales using remote sensing [
92] are additional examples of agricultural applications which are currently expanding. In the energy sector, gas and oil companies are driving new levels of performance and improving the use of resources by using DL. For example, BP’s oil and gas wells have sensors that generate data to train DL architectures [
93], with the aim of understanding the realities of conditions at each site, where optimizing the performance of the equipment and the monitoring maintenance are needed to prevent breakdowns. DL is also being applied to detect anomalies (that conventional methods would not detect it), to reduce carbon emissions, or to explore deep sea gas, to name just a few. Nevertheless, in these types of problems where solutions are required to respect the physical model of the problem, DL solutions can generate some problems since they do not apply the physical principles (such as the principles of conservation of mass or energy) [
94]. Hence, more research is needed to naturally include those physical constraints into the DL algorithms.
(5) Transportation. It is another area where DL and BD are becoming ubiquitous. This industry captures a tremendous amount of data which are able to help companies to improve the model capacity, demand, revenue, pricing, customer service, and cost through the use of predictive analytics. In particular, we can optimize freight movements and routing, determine the inventory on hand, improve the end-to-end customer experience, or reduce the environmental impact optimizing the fuel input [
95]. Today, autonomous driving cars represent a major innovation for the automotive industry, and autonomous vehicles (AVs) are expected to be a need for all the world. AVs and driver assistance systems need reliable services as prediction of traffic congestion evolution [
96] and traffic accidents [
97], traffic sign recognition systems [
98], or detection of pedestrians and obstacles [
99], among other characteristics.
(6) Marketing and Advertising. In advertising and marketing, one of the most frequent objectives is to communicate, educate, and convince consumers to buy a specific product or service. Many BD and DL applications have emerged to achieve better searches in e-commerce stores, which help you to find a product more effectively [
100], recommendation engines that suggest the most relevant items to users [
101,
102], or personalized advertising to target the most receptive audiences [
103]. In the media, DL is helping Netflix to predict what customers will enjoy watching, and this company also uses data and prediction to drive what new content it would better invest in creating [
104].
(7) Education. BD and DL are also contributing to improving the efficiency of education systems and the assimilation of contents by the students. In [
105], DL algorithms are used to predict and interpret the learners progress and achievements. In [
106], personalized recommendation systems are built to advocate more relevant content to the students. Moreover, other tools based on natural language translation and text summarization can also help the students to achieve a more sustainable and comprehensive education.
It should be noted that the success mentioned here is mainly due to high rates of accuracy in performance; however, its use in real applications depends not only on these benefits but also on the trust that needs to be earned from users or experts in each area of knowledge. This distrust comes partly from the ease of being fooled or their high level of confidence in their output for totally noisy inputs [
73], an area in which a lot of work is currently being done [
74,
107]. To this end, advances in these approaches have to pay special attention to several of its most notable shortcomings and that is being increasingly emphasized [
21,
94]. Among the improvements that are most required are: (1) the estimation or quantification of uncertainty; (2) the interpretability and plausibility of the solutions obtained; and (3) overcoming the limitations presented by a not very high size of the labeled data or a not very high quality in the data or labels.
5. Applications in Healthcare from Biomedical Information
The past decades have witnessed a massive growth in biomedical information, such as genomic sequences, electronic health records (EHRs), and biomedical signals and images [
19], which have led healthcare to a new era [
48,
51]. Given their demonstrated performance in different domains, BD and DL introduce exciting new opportunities for managing this large amount of medical data [
48] (
Figure 1). Although physicians will not be replaced by any algorithm in the foreseeable future, these technologies can definitely assist them to make better decisions in certain areas of healthcare [
51]. BD and DL have been gaining importance in recent years in the healthcare domain due to their capability to determine associations and relationships between risk factors and diseases. Although a large number of EHRs are generated worldwide each day, not all of them can be considered due to many methodological issues, such as data quality, data inconsistency and instability, multiple scales, incongruences and incompleteness, and legal issues. Moreover, it is a very complex and multi-disciplinary field involving physics, signals and systems, math, instrumentation, computer science, biology, physiology, and medicine.
The application of BD and DL in healthcare includes areas such as the individual disease diagnoses, disease prognoses, disease prevention and prediction, and also designing tailored health treatments based on lifestyle. One of the most famous example applications in medical care is the “Precision Medicine Initiative” project, which was promoted by the US President Obama in 2015 [
108]. It aimed to map the human genome of 1 million US citizens, find precise defects in the primary cause of a disease at the genetic level for a group of people, and ultimately guide the development of a new generation of drugs able to address precisely a subset of molecular problems shared by patient groups with a given disease [
109]. Another example is the IBM Watson for healthcare [
110,
111,
112], which is able to incorporate clinical, pathological and genetic characteristics and then to propose standardized clinical pathways and individualized treatment recommendations from those characteristics. The Enlitic company (San Francisco, CA, USA) [
113] was able to improve diagnostic accuracy in less time and at a reduced cost (when compared to traditional diagnostic methods), by means of DL networks to analyze medical images (such as X-rays and MRIs). Another exemplary use is Google Flu Trends [
114], which was able to predict more than double the proportion of doctor visits for influenza-like illness than the Centers for Disease Control and Prevention by using surveillance reports from laboratories across the United States.
The important role of these technologies in medical and clinical research has enabled major research institute centers and funding agencies to invest in this area. In addition to clinical information system, BD and DL technologies can also be applied to hospital management information systems to achieve: lower cost, fewer hospital stays and its length, control of insurance fraud, change detection in disease patterns, high quality healthcare and a better efficiency of medical resource allocation. In the following paragraphs, several application examples are presented according to the different nature of biomedical information: biomedical images, biomedical time signals and other biomedical data like those from laboratory results, genomics and wearable devices.
5.1. Biomedical Images
Medical imaging refers to the processes that provide visual information of the human body with the purpose of aiding physicians to make diagnostics and treatments more efficient [
115]. The most widespread applications of DL that used medical data are just the medical image processing applications, and it is due mainly to the success of this approach in computer vision [
48,
51] and the success of CNN architecture for image analysis. To this should be added that medical images are analyzed manually by physicians, who are limited by speed, fatigue, and experience. Incorrect diagnoses or delays can cause harm to the patient. Therefore, there is a necessity of automated, accurate and efficient medical image analysis to help physician research, and this is being widely developed in this field [
51,
116].
Some important medical image applications are classification of diseases, lesions, or abnormalities, and segmentation of regions of interest (ROIs) such as tissues and organs. Classification (also known as Computer-Aided Diagnosis [CADx] [
116]) is the major issue in medical image analysis, though segmentation of ROIs in medical imaging is fundamental for qualitative and quantitative assessment [
19]. Other important tasks are location, detection (also known as Computer-Aided Detection [CADe] [
116]), and registration. Localization focuses on drawing a bounding box around a single object in the image; meanwhile, detection concerns drawing bounding boxes around multiple objects (which can be from different classes) in the image, and classifying each object. Registration refers to fitting one image onto another [
116,
117,
118].
Each technology gives different properties imaged about the area of the body being studied and they vary depending on the imaging modality: ultrasound (US), X-ray, computed tomography (CT), magnetic resonance imaging (MRI), positron emission tomography (PET), retinal photography, histology slides, and dermoscopy images [
116,
119]. These, together with typically small datasets in some modalities and disciplines, annotations that can be scarce, and images which are often high-dimensional, multimodal and multi-channel [
20,
116] make the medical imaging a well-suited field to challenges.
DL solutions have been applied to medical image analysis [
120] in very different topics related to classification or detection, such as identifying lung nodules into benign or malignant [
121], alcoholism identification through brain MRI [
122,
123], multiple sclerosis detection [
124], categorizing chest X-rays into different diseases [
125], distinguishing patients with Alzheimer’s disease versus normal [
126], diagnosing diabetic retinopathy using digital photographs of the fundus of the eye [
127], discriminating kidney cancer histopathological images into tumor or non-tumor [
128], detecting cancerous lung nodules [
129] and lung cancer stage [
130] on CT scans, malignant skin cells on dermatological photographs [
131], mitotic figures in breast histology images [
132], or cell nuclei in colorectal adenocarcinoma histology image [
133]. Regarding image segmentation, DL covers a variety of organs such as liver, prostate, spine, and knee cartilage both in CT and MRI [
116,
134]. Many studies have focused on brain segmentation, including tumor segmentation [
135]. Currently, interesting niche areas [
116] are being explored in medical images registration, such as those that seek spatial relationships between two or more images (deformable image registration [DIR]) [
136].
5.2. Electrical Biomedical Signals
Modern biomedical instrumentation produces electrical signals which come from sensors placed on the body skin, and whose characteristics are determined by the sensors location. These signals are an invaluable data source to use in disease detection and diagnosis. DL is able to implement reliable applications by using physiological signals such as electromyogram (EMG), electroencephalogram (EEG), electrooculogram (EOG) and electrocardiogram (ECG). Architectures most used to process these physiological signals are RNN and one-dimensional CNN [
22,
50].
The EMG measures the electrical activity of skeletal muscles: muscle activation, force and muscle state. All these factors are overlapped in the EMG signal, so observing it directly makes it difficult to gain information about one particular issue. DL algorithms can help with this problem [
50]. For example, see limb movement estimation in [
137], neuroprosthesis control in [
138], movement intention decoding in [
139], hand movement classification in [
140], gesture recognition in [
141], robotics and guidance in [
142], and speech recognition with gestures in [
143].
The EEG evaluates the electrical activity of the brain. Brain Computer Interface (BCI) is the main application of EEG where DL is applied [
50]. The real-time nature of BCI signal makes human interpretation impossible, so that it requires automated decision-making [
144]. Other DL applications refer to sleep state identification [
145], epileptogenicity localization [
146], decoding excited movements [
147], and seizure detection [
148].
The EOG quantifies the corneo-retinal potential between the back and front of the human eye. The signal is generated through two electrodes placed above and below each eye, and is useful for ophthalmological diagnosis. However, noise and artifacts complicate the interpretation [
50]. Some examples of works seek to overcome these limitations by using DL algorithms to detect driving fatigue [
149] and drowsiness [
150], and other ones to classify momentary mental workload [
151] and sleep stage [
152]. The application on the ECG signals is dealt with in the next section.
5.3. Other Non-Electrical Biomedical Data
In addition to the electrical biomedical signals, a vast amount of medical information is achieved from many other non-electrical sources. In the field of signals, we have mechanical signals (e.g., the mechanomyogram), acoustic signals (e.g., phonocardiogram, breathing), chemical signals (e.g., pH, oxygenation) and optical signals (e.g., photoplethysmogram) [
153,
154,
155,
156]. Apart from electrical and non-electrical signals, other biomedical information is collected from a large variety of data sources, such as EHR, medical imaging, genomic sequences or laboratory results [
157]. The abundant and growing amount of medical data makes BD and DL become global players in healthcare and medicine by developing new applications to classify accurately diseases and disease subtypes, to recommend patient treatments or to guide the development of new therapies [
21]. In this context is also precision medicine, which involves the prevention and treatment strategies that consider individual variability, attempting to ensure that the right treatment is delivered to the right patient at the right time. In [
48,
117], several aspects of patients are considered by assessing large sets of data from several data sources. Thus, the integration of disparate data from different data sources [
21] is one of the major challenges to be met in this area.
Data originated from EHRs are becoming increasingly important in recent years. These data include substantial amounts of unstructured text, such as physical examination, clinical laboratory reports, operative notes and discharge, which remain challenging to approach [
21,
48]. Natural language processing based on DL is applied to extract useful information from the text to assist clinical decision-making [
51]. For example, an application to extract peripheral arterial disease-related keywords from narrative clinical notes to classify the normal and the patients with peripheral arterial disease is implemented in [
158]. A semantic similarity between medical concepts, a task that is central to a number of techniques in medical informatics and information retrieval, is measured in [
159]. More recently, in [
160], the problem of prevention and intervention of Acute Coronary Syndrome (ACS) has been considered from a BD framework. A multitask learning framework was proposed in this representative paper, which is based on adversarial learning strategies [
161], to predict major adverse cardiac events from EHR data of ACS patients. It was shown that, when shared information among the three subtypes of ACS is incorporated into prediction, their framework performs better than single-subtype oriented models in terms of average prediction. However, the value distributions of frequent features are similar between false-positive samples and true-positive samples, and between false-negative samples and true-negative samples, regardless of the subtypes. The authors considered that this is due to the small number of available patient samples (2863 ACS patients). This shows once again that the potential benefit of BD techniques lies not only in having a large volume of data that need to be extracted from heterogeneous EHR, but also in developing DL algorithms which are able to: (1) Deal with such heterogeneity (in the form of text, images, radiology reports, etc.); (2) Avoid over-fitting and improve the generalization ability; In addition, (3) handle the uncertainty given by the missing data (so common in EHR). These problems are not new and they still remain open issues in the ML world.
DL also applied to model continuous time data, such as laboratory results, toward the automatic identification of specific phenotypes [
48], for example, the prediction of disease onset from laboratory test measures alone [
162], or the modelization of longitudinal sequences of serum uric acid measurements to distinguish the uric-acid signatures of gout and acute leukemia [
163]. In genomics, DL is being applied widely to improve the detection of the relevant patterns [
164]. Examples of this is DeepBind, a deep architecture based on CNNs that predicts specificities of DNA- and RNA-binding proteins [
165], and the classification of cancer cases from gene expression profiles [
166].
Wearable devices are another promising data source. They could monitor a range of medical risk factors and give patients direct access to personal analytics, contributing to health monitoring, facilitating preventive care and aiding in the management of ongoing illness [
167]. However, an efficient DL architecture on a mobile device is still a challenging task due to hardware limitations [
168]. An example of wearable applications to predict the freezing of gait in Parkinson disease patients can be found in [
169]. In [
170], the authors try to predict energy expenditure (considered important in tracking personal activity and preventing chronic diseases such as obesity, diabetes and cardiovascular diseases) from triaxial accelerometers and heart rate sensor data.
5.4. The Present and Near Future in Large Data Healthcare
As it can be seen in the previous review of the literature, emerging data techniques are called on to play a key role in the healthcare scenario. However, several key issues remain open today, which represent a temporal obstacle to this technology to be definitely installed in our everyday life. On the one hand, an open problem in current healthcare systems is the interoperability; in short, the capability of healthcare systems of different entities, institutions, health centers, and regions, to communicate among themselves [
171]. A wide variety of standards for different aspects have been proposed, and some of them have been better accepted and used, whereas many others not [
172]. The current landscape throughout the world is still fragmentation in the healthcare systems with respect to formats. It is expected that in the forthcoming years this issue will be solved, but the truth is that currently there is no integration engine capable of accessing universally or widely health data. Approaches to interoperability from bottom to top, based on the clinical practice, seem like they will be highyl relevant in the near future, as they should emerge from the consensus among the healthcare responsibilities about their needs and the availability and suitability of the current technology to provide the society with a response to those needs [
173].
On the other hand, the emergence of large amounts of data in several other scenarios has raised the concern for the privacy of personal data, and much progress has been made in this setting based on the progressing of personal data protection laws throughout all the world [
174]. Whereas this represents a need, it turns out that health data represent an indubitably personal information, and so the need for aggregation in order to provide large-scale population solutions from a technical viewpoint needs to conciliate with the consent required from every individual to provide our personal healthcare data, while sometimes confronting interests from organizations, companies and patients, and many other hard-to-manage aspects [
175,
176]. Nevertheless, it seems inevitable that these two relevant issues should be solved in the near future, and very likely the data technologies and the strong and positive impact that their use could have in our lives will be a key argument to find this convergence.
6. Applications in ECG Processing
It has been proven that some medical conditions, like diabetes and hypertension, and some risk factors, like smoking, can affect the state of the heart [
177]. However, unhealthy or just disordered lifestyles nowadays certainly increase the risk of suffering heart diseases. The most important heart affliction, and the leading cause of death worldwide according World Health Organization [
178], is the ischemic heart disease, which occurs when one or several coronary arteries are blocked, which causes nutrition loss of myocardial cells and result in a myocardial infarction or heart attack. The consequences of this affliction can be as serious as death, hence diagnosing and treating it as quickly as possible gives a better scope for survival and quality of life. Another important set of heart diseases are the cardiac arrhythmias. These disorders produce a modification of the heart beat variation, either making it slower (bradicardia) or faster (tachycardia), which also can be a cause of patient condition deterioration and exitus in some circumstances. There are many other pathological heart disorders, like congenital heart diseases, valvular heart diseases, infections, inflammations, and many others [
177]. On the other hand, physiological signals are electrical signals which come from sensors placed on the body skin, and whose characteristics are determined by the sensor location. These signals are an invaluable data source which can be used to disease detection [
50]. One of these physiological signals is the ECG, which is generated from the contraction and the recovery of the heart [
53], and it is extensively used for diagnosing several heart diseases and conditions, like myocardial infarction, arrhythmias, hypertrophic cardiomyopathy, or dilated cardiomyopathy, among many others [
177].
With the purpose of helping with the diagnosis of cardiac diseases, relevant information must be extracted from the ECG by the interpretation of the physicians. This human interpretation demands years of training in order to acquire a specialized knowledge. However, even with expert knowledge, these human interpretations undergo some problems such as intra- and inter-operation variability, or errors by fatigue due to the tedious process of analyzing the ECG. With all this, it has been suggested to use computer-supported signal analysis systems, which can avoid intra- and inter-operation variability and errors by fatigue [
50]. One should keep in mind that the computer supported ECG signal analysis is not a new necessity, and it has been pursued for several decades. Until recently, the process was to apply some low-level signal processing for noise reduction, extract hand-crafted features and use a machine learning or a statistical classifiers. However, these kinds of solutions are not effective for high-dimensional, more complex, real-world noisy signals, and these systems can suffer from an unreliable accuracy [
22]. DL has been suggested to likely achieve a more effective analysis of ECG signals because its proven significant and remarkable improvements in robustness to noise and variability in several pattern recognition applications help real-time classification of very complex signals, though this scenario also raises new challenges, like regarding data availability [
53,
179]. Apart from health monitoring and medical diagnosis, the use of ECG as a biometric trait for identification or authentication has gained momentum [
180]. The ECG, compared with other biometric traits, has proven to be one of the most promising among them, and researchers have recently also started to use DL methodologies in this area, which is today a pioneering affair [
53].
6.1. ECG Fundamentals and Databases
ECG is a set of physiological signals that represent the changes of the electrical activity of the heart over time. It contains information that is used to analyze heart functions like the heart rate and the heart rhythm, and it is frequently used to identify abnormalities in the electrical system of the heart [
181]. Few electrodes are placed on certain standardized parts of the body skin in order to record ECG signals, which are basically an electric potential difference between two electrodes. The combination of two electrodes which the electric signal measures forms an imaginary line in the body called a lead (or channel) [
182], as shown in
Figure 2. From an electrophysiological point of view, the ECG consists of a set of characteristic deflections, so-called waves, which appear near-periodically in time, and each of them is related to one of the basic phases of the cardiac cycle. Accordingly, the P wave corresponds to the overall view of the depolarization of the atria. It is followed by the Q, R, and/or S waves (which jointly form the QRS complex), which represents the energetic depolarization of the ventricles. In addition, finally, the T wave can be observed and brings information about the ventricular repolarization phase and the myocardial tissue recovery. Very infrequently, a U wave can also be detected in the end [
182]. One cardiac cycle consists of a P, Q, R, S, T and U wave, corresponding to one ECG beat. From these waves, it is relevant to be able to take morphological and temporal indices, such as the existing peaks (P, Q, R, S, T, and U) and their associated times, the intervals between consecutive peaks (PR, RR, QRS, ST, and QT intervals) and characteristic segments (PR and ST), which are often called jointly the ECG features [
183].
There are a few standard configurations of electrodes for the measurement of ECG signals. One of the most used is the 12-lead configuration, in which ten electrodes are used, in such a way that six electrodes are placed on the chest, and four electrodes are placed on the limbs. This configuration allows the acquisition of an ECG signal in 12 leads, namely, three bipolar limb leads (I, II, and III), three monopolar limb leads (aVR, aVL, and aVF), and six monopolar precordial leads (V1, V2, V3, V4, V5 and V6) [
53]. The three bipolar leads are the electric potential difference between the right and left arm (I), the right arm and left foot (II), and the left arm and left foot (III). In the cases of the monopolar leads, electric potential differences are generated between the left arm (aVL), the right arm (aVR), or the left foot (aVF), and a mass electrode (usually an average given by a Weathston Central Terminal). The precordial leads are obtained as the difference between each of the six chest electrodes (V1–V6) and the reference mass point. The right foot is normally used for grounding purposes [
184].
As previously evoked, DL requires large datasets for its proper training. In addition to this, it is important to enable the comparisons and benchmarking among different DL algorithms, so that researchers are able to replicate algorithms and to evaluate them in a standard manner. To build these kinds of datasets, some authors have pointed out that a cultural change is needed, as it requires the collaboration between institutions and data-shared availabilities [
21,
49,
53]. Nevertheless, the field of electrocardiography is one in which a number of databases already exist and can be available for their use for testing some of the hypotheses that are currently being evaluated in the field. We summarize next the most relevant ones of the currently available ECG collections.
From the point of view of arrhythmias and patient condition evaluation based on ECG, several databases have been released to the community with different aims and orientations. The
AHA ECG Database is probably the one with the most widespread use. This database consists of arrhythmias and normal sinus rhythm, and it includes 154 ECG recordings from real patients of 3-h length each. The last 30 min of each recording have been labeled by experts as arrhythmia-free or belonging to one among seven types of arrhythmias or non-normal beats [
185]. The
Stress Detection for Automobile Drivers Database (DriveDB) was created with the purpose of investigating the feasibility of automated recognition of stress, and other physiological parameters apart from ECG were recorded on it and included (specifically, electromyogram and skin conductivity) from nine subjects in 18 driving sessions [
186,
187]. The
ECG-ID Database was specifically developed for its use in biometrics, and up to 310 recordings of 20-s ECG were obtained from 90 people for this purpose [
186,
188]. Especially relevant is also the
European ST-T Database, which is intended for the evaluation of algorithms for analysis of ST and T-wave changes, and it consists of 90 two-hour excerpts of recordings from 79 subjects. It contains several informative abnormalities, such as myocardial ischemia, hypertension, ventricular dyskinesia, and medication effects [
186,
189]. The
Long-Term ST Database includes 86 ECG recordings from 80 subjects, between 21 and 24 h in duration each one, with a variety of events of ST segment changes, including ischemic ST episodes, axis-related non-ischemic ST episodes, episodes of slow ST level drift, and episodes containing mixtures of these phenomena [
186,
190]. Also very widely used are the
MIT-BIH Arrhythmia Database and the
MIT-BIH Normal Sinus Rhythm Database, both in research or in equipment certification in the industry. The former is one of the most used as standard test material for evaluation of arrhythmia detectors, and it is composed of 48 half-hour excerpts of two-channel ambulatory ECG recordings obtained from 47 subjects [
186,
191]. The latter is composed by 18 long-term ECG recordings belonging to the former
MIT-BIH Arrhythmia Database from subjects without any arrhythmia or other abnormalities [
186,
192]. The
PTB Diagnostic ECG Database contains 549 recordings from 290 healthy and unhealthy subjects (in various cardiac conditions) with one to five recordings per subject [
186,
193], whereas the
QT Database is a collection of 105 15-min recording extracts from public databases, with the specific objective of aiding the development of automatic methods of measurement of QT waveforms [
186,
194]. Also relevant is the
UofT ECG Database (UofTDB), also specifically created for ECG-based biometrics, where the fingertips of1020 subjects were captured. A subset of these subjects were recorded for up to six sessions over a period of six months, with different postures (sit, stand, supine, and tripod) and exercise condition, each recording being between 2- and 5-min long [
195]. Finally, a special mention has to be given to the
MIMIC Database, which is a collection of multiparameter recordings of 72 Intensive Care Unit patients that includes signals and periodic measurements obtained from a bedside monitor, as well as clinical data obtained from the patient’s medical record. The recordings vary in length, although almost all of them are at least 20 h, and many of them reach 40 h and even more. There are also several annotation sets available, which are associated among them and correspond to ECG beat labels, annotations for alarms related to changes in the patient’s status, annotations related to changes in the functioning of the monitor, arterial blood pressure, pulmonary arterial pressure, central venous pressure, and fingertip plethysmograph annotations [
186,
196].
6.2. Recent Interest in Deep Learning for ECG
Considering the vast literature in the separate fields of DL and ECG processing, we have not found specific reviews jointly covering both topics. However, there are many works about DL and biosignals where applications in ECG are covered. The latest scientific research on DL methods for physiological signals was compiled in [
50], including Electromyogram (EMG), Electroencephalogram (EEG), Electrooculogram (EOG), and a part dedicated to ECG. A survey on DL techniques for 1-dimensional biosignal analysis [
22] paid attention to computer-aided diagnosis and ECG analysis among them. Finally, an excellent review and discussion were conducted [
53] regarding the use of the ECG in biometrics, where DL is already mentioned. What can be readily found today are ML reviews focusing on ECG applications, with some sections that briefly deal with DL. Several ML approaches (Neural Networks among them) were analyzed [
177] for diagnosing myocardial infarction, differentiating arrhythmias, and detecting hypertrophy by using ECG signals. The computational methods in use for ECG analysis have been described [
179], with focus on ML and three-dimensional computer simulations, as well as on their accuracy, clinical implications, and contributions to medical advances. The relevance of DL is scrutinized therein by reviewing a few related papers. A survey of ML algorithms for ECG classification into arrhythmia types was presented in [
183], and, among all the different classifiers, the ANNs are stressed because of their popularity. Lastly, the methods of ECG processing have been reviewed from a pattern recognition perspective [
197], with particular focus on ANNs and Support Vector Machines.
In contrast with the lack of specific and full reviews, the literature about applications of DL to EGC has recently become an immense ammount. We present next a summary of the state of the art about this topic. To do this, we used PubMed, IEEEXplore, Google Scholar, and ScienceDirect portals and search engines to search for publications related to DL applications in ECG. The searched keywords included “deep learning”, “neural network”, “electrocardiogram”, “ECG”, “convolutional neural network”, “CNN”, “recurrent neural network”, “RNN”, and “LSTM”. We only present here the most relevant papers in our view that were published between 2017 and 2018.
Arrhythmia detection and classification are some of the most popular topics in ECG, since the automatic recognition of abnormal heartbeats from a large amount of ECG data is an important and essential task. A huge number of methods have been proposed to address the problem of ECG beat classification. However, most solutions in the last two years turned to using CNN and RNN architectures. For instance, a relevant CNN-based system [
181] developed a 9-layer 1D CNN to automatically identify five different categories of heartbeats, namely, non-ectopic, supraventricular ectopic, ventricular ectopic, fusion, and unknown beats. The experiment was conducted in original and noise attenuated (filtered to remove high-frequency noise) sets of ECG signals derived from the MIT-BIH Arrhythmia Database. This set was artificially augmented to compensate the number of instances in the five classes of heartbeats, though the augmentation process was unclearly described. The CNN was trained using only thousands of beats belonging to augmented data set and it achieved 94.03% accuracy in the noisy dataset and 93.47% in the noise-free dataset. When the CNN was trained with highly imbalanced data (original dataset), the accuracy of the CNN reduced to 89.07% and 89.3% in noisy and noise-free sets, respectively. Another DL approach for cardiac arrhythmia detection was presented [
198] based on ECG signal analysis, using 1000 10-s ECG signal fragments again from the MIT-BIH Arrhythmia Database. A complete end-to-end 1D CNN model was designed instead of the hand-crafted feature extraction and selection used in traditional methods, and this model achieved an overall accuracy recognition of 91.33% for 17 cardiac arrhythmia disorders. Another method was proposed based on a 13-layer CNN with residual skip connection for the classification of heartbeats [
199], in order to accurately differentiate five different arrhythmias, and subsequently to transfer the knowledge acquired on this task (transfer learning) to the myocardial infarction classification task. The proposed method was evaluated on 10-s windows of signals from the MIT-BIH Arrhythmia and the PTB Diagnostic ECG Database. The suggested method was able to make predictions with accuracy of 93.4% and 95.9% on arrhythmia classification and myocardial infarction classification, respectively. Furthermore, authors presented visualizations of the high-dimensional vector created by the last convolutional layer in the 2D space using the t-Distributed Stochastic Neighbor Embedding (t-SNE) method.
There are also many solutions that use RNN architectures for cardiac arrhythmia detection. Normal and abnormal beats were classified by implementing LSTM and GRU architectures [
200], aiming to enable the automatic separation of regular and irregular beats on the MIT-BIH Arrhythmia Database, and comparing different RNN models in order to show their effectiveness, accuracy, and capabilities. Mixed architectures have also been proposed. An automated system that uses a CNN and RNN LSTM was proposed in [
201] for diagnosis of normal sinus rhythm, left bundle branch block, right bundle branch block, atrial premature beats, and premature ventricular contraction (PVC), all of them from the MIT-BIH Arrhythmia Database ECG signals. The novelty of this work is that ECG segments of variable length were used, achieving 98.10% accuracy, 97.50% sensitivity and 98.70% specificity for ten-fold cross validation strategy. A simpler solution was implemented [
182] in terms of a common Feed-Forward Neural Network approach for ECG beat classification, conducting the experiments on the MIT-BIH Arrhythmia Database, and, although a very simple architecture was used, good results were obtained in terms of efficiency, accuracy, sensitivity, and specificity. Diabetes detection has been also addressed as another task derived from ECG signals. The changes in the RR-interval signals, known as heart rate variability (HRV) signals, have been pointed to be potentially useful for this purpose [
202], in terms of a methodology for classification of diabetic and normal HRV signals using LSTM, CNN, and their combinations for extracting complex temporal dynamic features from the input HRV data. The obtained performance improvement was 0.03% and 0.06% in CNN and CNN-LSTM architectures, respectively, compared to 95.7% accuracy in their earlier work. Finally, QRS complex detection is very relevant to obtain additional useful clinical information from the ECG signals, including the subsequent wave delineation process also providing RR intervals, QT intervals, and PR intervals, so its detection is critical for ECG-based health evaluation. A 1D CNN was delivered for QRS complex detection [
203], consisting of levels (object-level and part-level) for extracting different grained ECG morphological features. All of the extracted morphological features were used by a Feed-Forward Neural Network for the final QRS complex detection. Based on the MIT-BIH Arrhythmia Database, the proposed detection method overall achieves 99.77% sensitivity, a 99.91% positive predictive rate, and a 0.32% detection error rate.
6.3. Open Issues in Deep Learning for ECG
Note that, in all of the previous works, publicly available databases, like the MIT-BIH Arrhythmia Database (often) or the PTB Diagnostic ECG Database (sometimes), although they are undoubtedly valuable, should still be noted as not being initially designed for training ML systems. Therefore, their use might be not enough for these types of applications. The small number of records of unique patients and the unbalanced classes are some examples of this. Some works apply techniques that are usually learned from the use of DL to image or audio databases to try to solve these challenges, which however they can not be straightforwardly applied to the ECG-based problems. For instance, data augmentation for low-represented arrhythmias can be very misleading, and it is not so straightforward as in image systems. In addition, the generalization of the system must be taken into account, as beats in the same patients are highly repetitive, so complete patients should be left separate to perform the validation and the test stages, which in too many cases is not reported, and very likely it is not done. This could be the cause for the high performance values obtained from recent DL systems, which in fact are similar to the performance obtained in the ML literature for ECG processing, sometimes due to the same bias in the machine training. Another problem that should be pointed is that most of these works are not addressed with the support of cardiologists in the research team, which leads to poor definitions of the clinical applications. In [
204], an algorithm was developed that is said to exceed the performance of cardiologists in detecting a wide range of heart arrhythmias from ECGs recorded with a single-lead wearable monitor. Authors trained a 34-layer CNN which mapped a sequence of ECG samples (30-s long raw signal) to a sequence of rhythm classes. A proprietary dataset of 91,232 single-lead ECGs from 53,549 unique patients (compared with 47 from MIT-BIH Arrhythmia Database) with 14 classes (12 heart arrhythmias, sinus rhythm, and noise) was used. The performance of the model exceeded the average cardiologist (average of six cardiologists) performance in both recall (sensitivity) and precision (positive predictive value). This study can be pointed as an excellent reference work in the field, as it does not exhibit any of the pointed problems, so the results can be considered as solid and a reference for comparison of subsequent works.
In any case, the previous compilation reveals that cardiac signal analysis has become in an extremely short time an application field for DL techniques. Whereas it is undoubtedly a probably mandatory scenario to take advantage from currently available large-data technologies, it is very likely that several words of caution should be observed. On the one hand, many (not all) the works rely on existing ECG databases, many of them available to the public thanks to the work made by the ECG signal processing community during the last several years [
181,
200,
203]. However, the apparent diversity and large amount of data in terms of available beats in these data could be not enough for driving the training of DL based systems, due to points like the number of patients in these databases (several thousands of beats per patient is not necessarily a sign of large training sets, due to the intra-patient redundancy), or the unbalance among the actually needed classes in the clinical setting. Second, the existing works rarely pay attention to the acquisition and especially to these preprocessing tuning on the final classification systems.
On the other hand, the presence of noise has often been dealt with from a quantitative approach mostly related to signal-to-noise measurements, but this problem statement has recently been questioned by some works [
205] which address the necessity of noise-severity classification subsystems related to the clinical impact of the noise on the ECG recordings, which seems to be statistically consistent yet hard to characterize in terms of heuristic rules and processing thresholds for characteristic times and amplitudes of the ECG waves. Finally, labelling quality could strongly benefit from efficient systems for incremental learning and semi-supervised schemes [
206,
207], a point that several works have already started to scrutinize. Working with static datasets is something that precludes the re-use of the intense labeling and knowledge used from clinicians in their everyday practice and re-use it to improve ECG processing systems with this kind of approach, which could represent a solid paradigm dependent on a number of technical and non-technical factors.
Overall, the analysis of the specific case of DL systems for ECG automatic recognition points out that certainly DL and BD techniques can be applied to the healthcare knowledge, but it is strongly advisable to work always in close cooperation with clinicians in the field, and to pay special attention to the inter-patient generalization, data structure, and repeated measurements.
7. Toy Examples
Some toy examples have been developed to help beginners start with some available introductory code while using one of the world’s most popular biomedical databases, the Multiparameter Intelligent Monitoring in Intensive Care (MIMIC) database [
186,
196], which is also available. [
208]. Some results were obtained by selecting 1546 files for training, 1328 for validation and 525 for test, from the MIMIC dataset. Each file has a length of 250 samples.
Examples are implemented in PyTorch [
209], a famous open-source DL library for Python. A DL architecture, which is based on the U-Net network [
210,
211] has been designed: (1) To predict the arterial blood pressure signal by using the plethysmogram signal (
PLETH to ABP example) as input; and (2) to predict the plethysmogram signal (
ABP to PLETH example) by using the arterial blood pressure signal as input that is the reverse problem. The architecture is a one-dimensional CNN, called a fully convolutional network, with a deeply-supervised encoder–decoder connected through a series of skip pathways, and in which the input and the output are the same size. In particular, the network learns how to transform a one-dimensional time signal with a size of 250 samples into another signal with the same size (arterial blood pressure signal to plethysmogram signal or vice versa). For that, it uses convolution kernels of size 3 with stride and padding of size 1, batch normalization, and regularization through dropout. The results shown in this section must be regarded as toy examples and an interesting pointer for future work.
The training process with 100 epochs and a batch size of 256 lasted around 18 min for both goals. By using the Mean Absolute Error (MAE) as loss function, the results were:
in training,
in validation and
in test, in the
PLETH to ABP example (
Figure 3); In addition,
in training,
in validation and
in test, in the reverse problem
ABP to PLETH (
Figure 4).
These results are intended to be a possible starting point to scrutinize the possibilities of DL techniques in a given problem. After starting with the DL architecture, the type of layers, and the training strategy, other topics should be scrutinized. On the one hand, it is crucial to gain insight about the interest and nature of the healthcare problem. For instance, in this case, it is well known that the blood pressure has different profiles as we go further into the heart in the arterial tree, and information is partially lost after the attenuation from the arm to the fingers. This means that estimating the ABP signals from PLETH signals is a very hard problem, but it would be also very valuable in clinical settings and in wellness devices. On the other hand, a view of the results can give us some ideas about the scope and limitations of the method. Both for the direct and for the reverse problems, the algorithm seems to be capturing to some extent the average value of the predicted signals from the predictor signals in these examples, which should be further checked in other examples. In this step, error analysis and systematic visualization of results could be very helpful. On the other hand, we can see that the profile of the predicted waveform is partially captured by the system, whereas some waveform distortion still cannot be avoided and should be the next target. The interested reader is encouraged to continue searching for further possibilities on this problem. Nevertheless, it is important to be able to start working on a new problem with a first prototype of enough quality and then iterating it with as specific as possible targets for improvement.
8. Discussion
Several generic directions have been pointed out to improve the capabilities of DL algorithm to work efficiently with unlabeled data, with algorithms capable of training with new incoming data, or in the healthcare scenarios, with personalized diagnostic systems and with the use of wearable-recorded information. It is even promising to think about quantum computation supporting future algorithms in this scenario. Nevertheless, before getting to all those long-term goals, it should be interesting to explore new networks capable of working naturally with structured and heterogeneous medical data. For instance, data from form-like recordings, such as the electric health recording or specialized follow-up from the patient, are expected to have different fields, with numerical and categorical data, with low correlation among close features, or with inter-feature correlations different from spacial or temporal correlations present in multimedia problems. This precludes the conventional architectures, such as convolutional or feed-forward networks, to be used in these settings, and the use of general architectures such as the deep MLP can be an option for prediction purposes, though the interpretability in this case becomes even harder than with the other ones. Thus, further effort could be devoted to new architectures more naturally bending with data from healthcare forms.
In a first instance, it may seem that the ultimate goal in the application of ML algorithms is to improve the accuracy of estimation, classification, or prediction (among others) of human experts. However, as is becoming increasingly evident in recent years [
21,
94,
107], in most areas of knowledge, it is a necessary and sufficient condition that these outputs are accompanied by additional information to explain and understand the reason for the solutions. In this way, a general knowledge is obtained making the desired advance in the area of applied knowledge possible, or at least, generating the necessary trust from the experts (or users) so that they can use it as a help tool in their daily work (or lives). This is why the black-box quality of DL algorithms prevents their widespread use in most areas of knowledge, especially in the field of health. In order to achieve this widespread and reliable use of these algorithms, the process of making this black box transparent must be urgently addressed. For this purpose, it is desirable that the output includes information that allows both to interpret and to explain the reasons for this output, providing a quantifiable estimate of uncertainty (using, for example, Bayesian models), and evaluating the plausibility of the solution to the physical constraints of the problem. It is here, in the latter point, where it is also necessary to include the possibility of introducing physical models of the problem in the design of the DL algorithms. In addition to these limitations coming from the black-box quality, the DL algorithms also present an important limitation that prevents their widespread use, which is the requirement of large-scale labeled datasets, which must also have high quality both in the input variables and in their labels. In this setting, the incorporation of structured probabilistic models together with belief propagation as inference algorithms [
75] is promising to solve these limitations, being able to obtain precise, robust, generalizable, high data efficiency, and even explainable algorithms.

 ,
, 


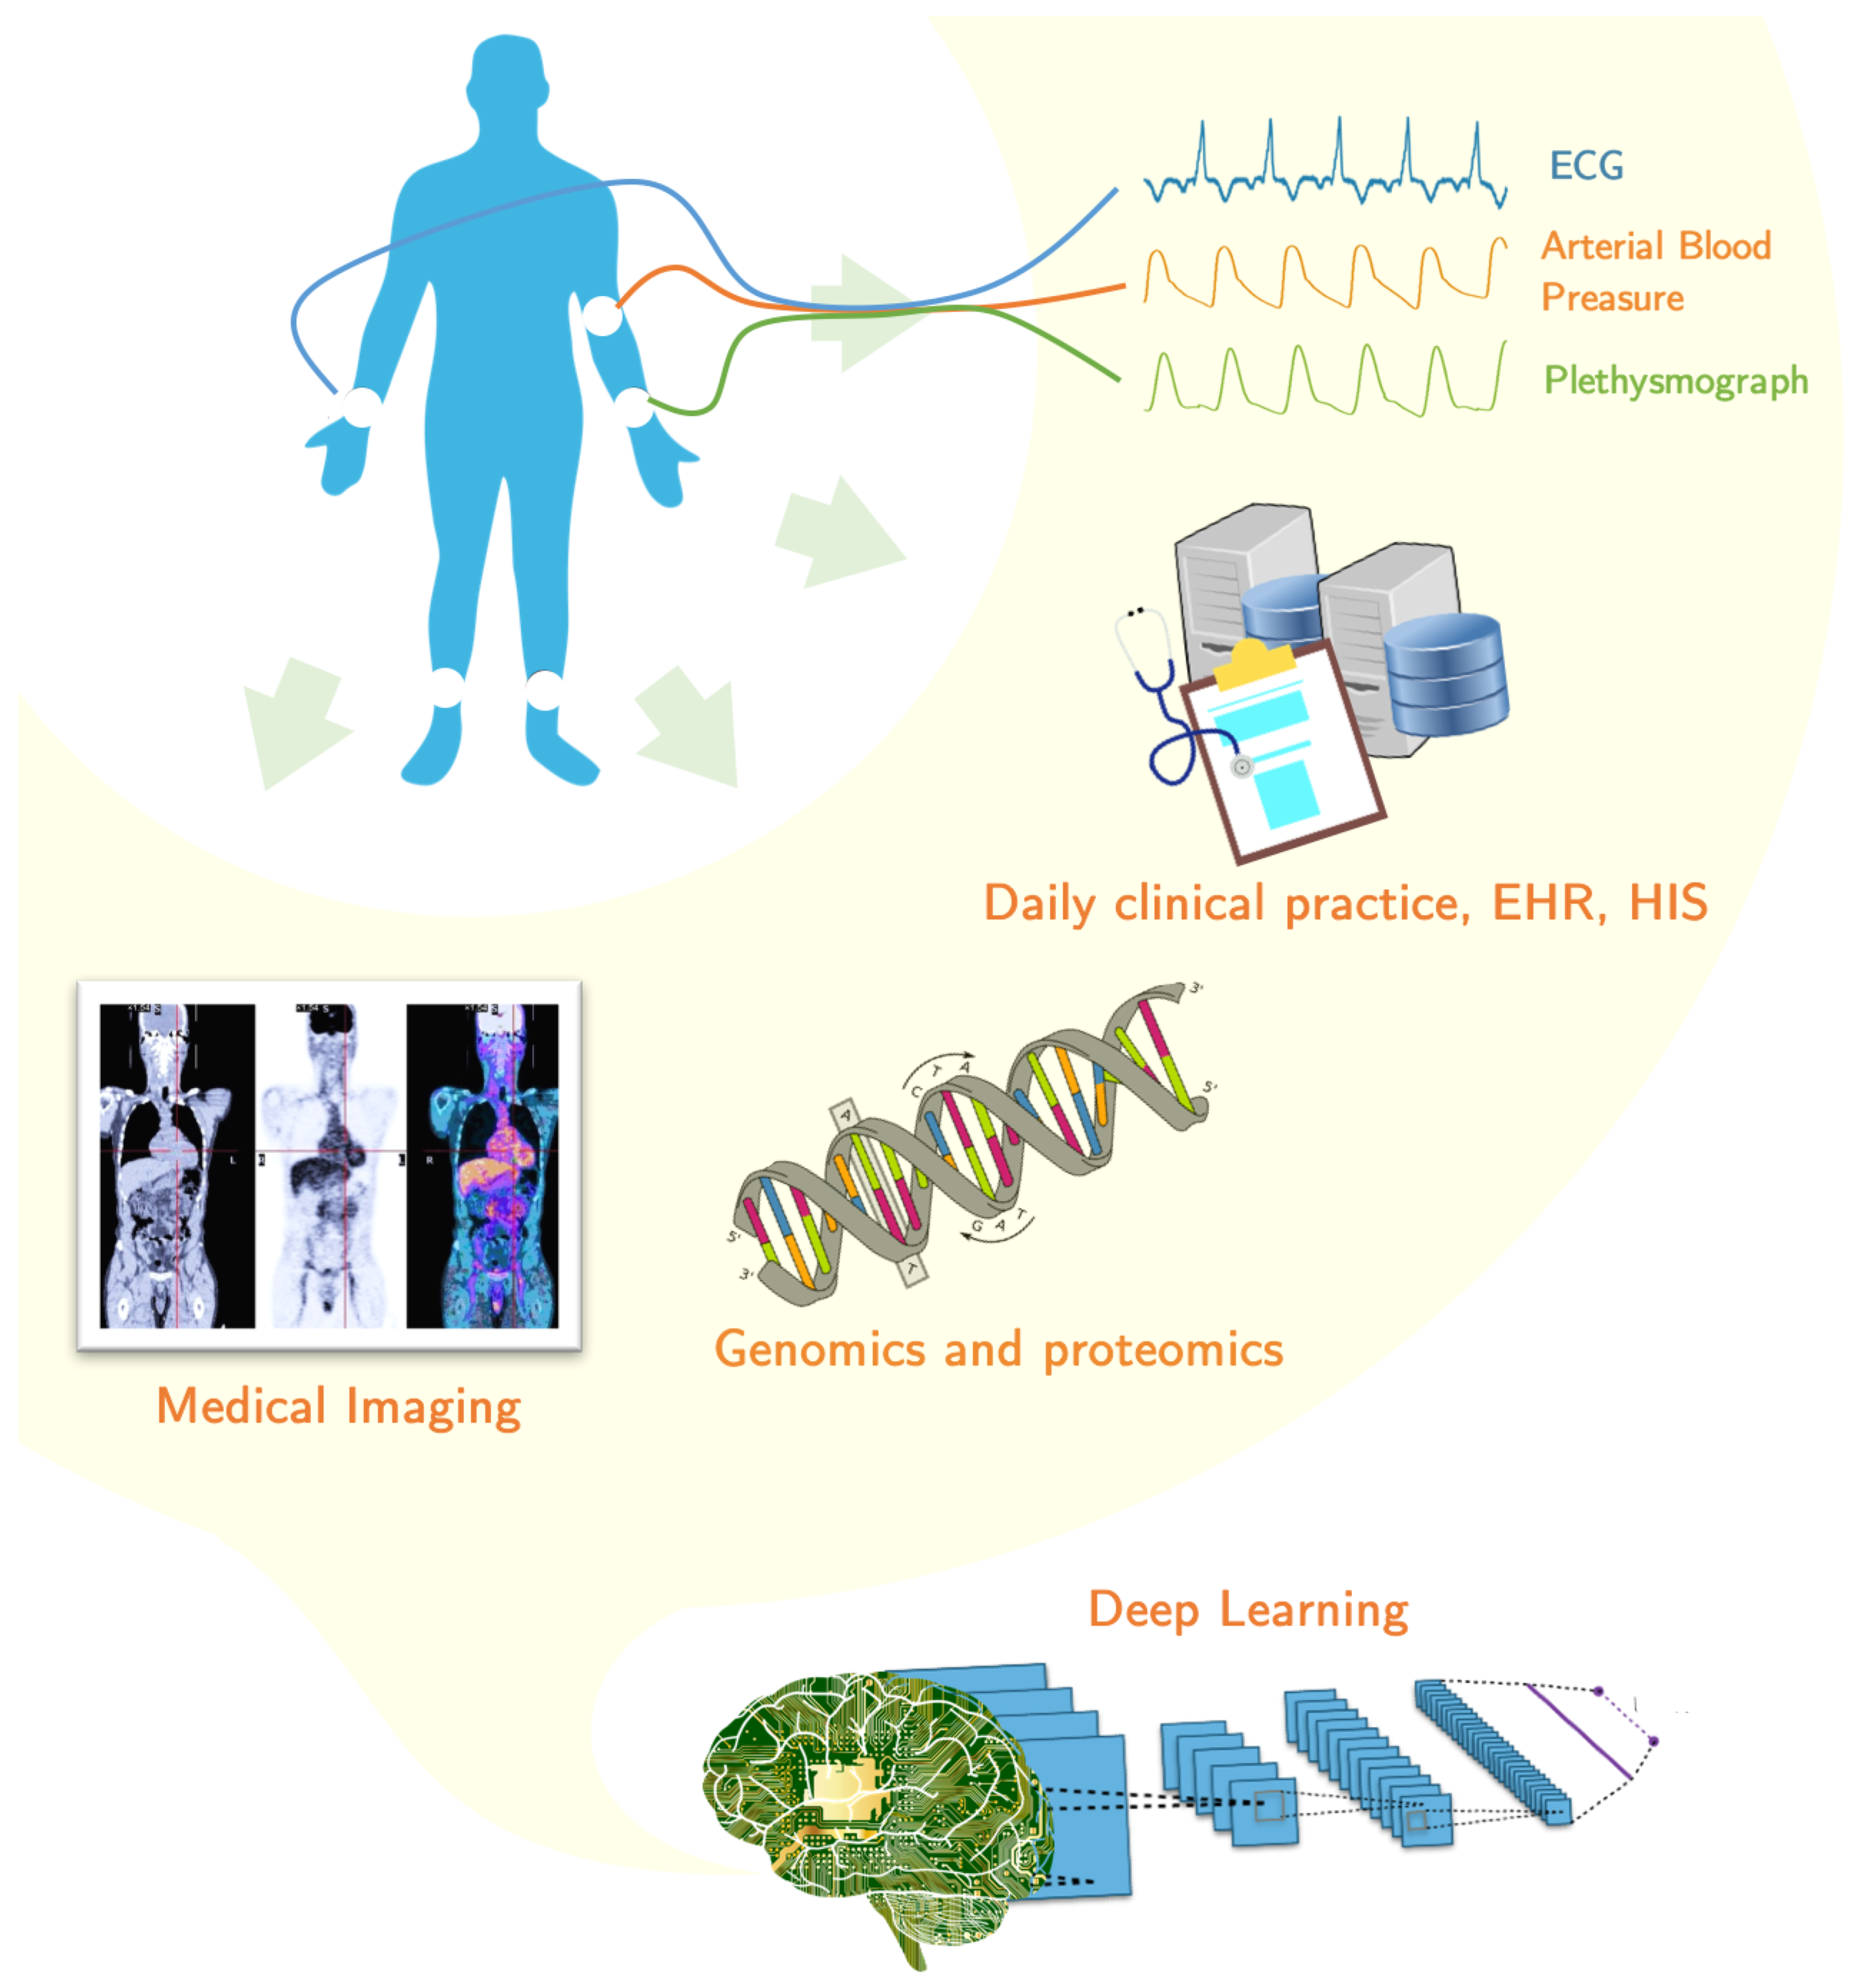
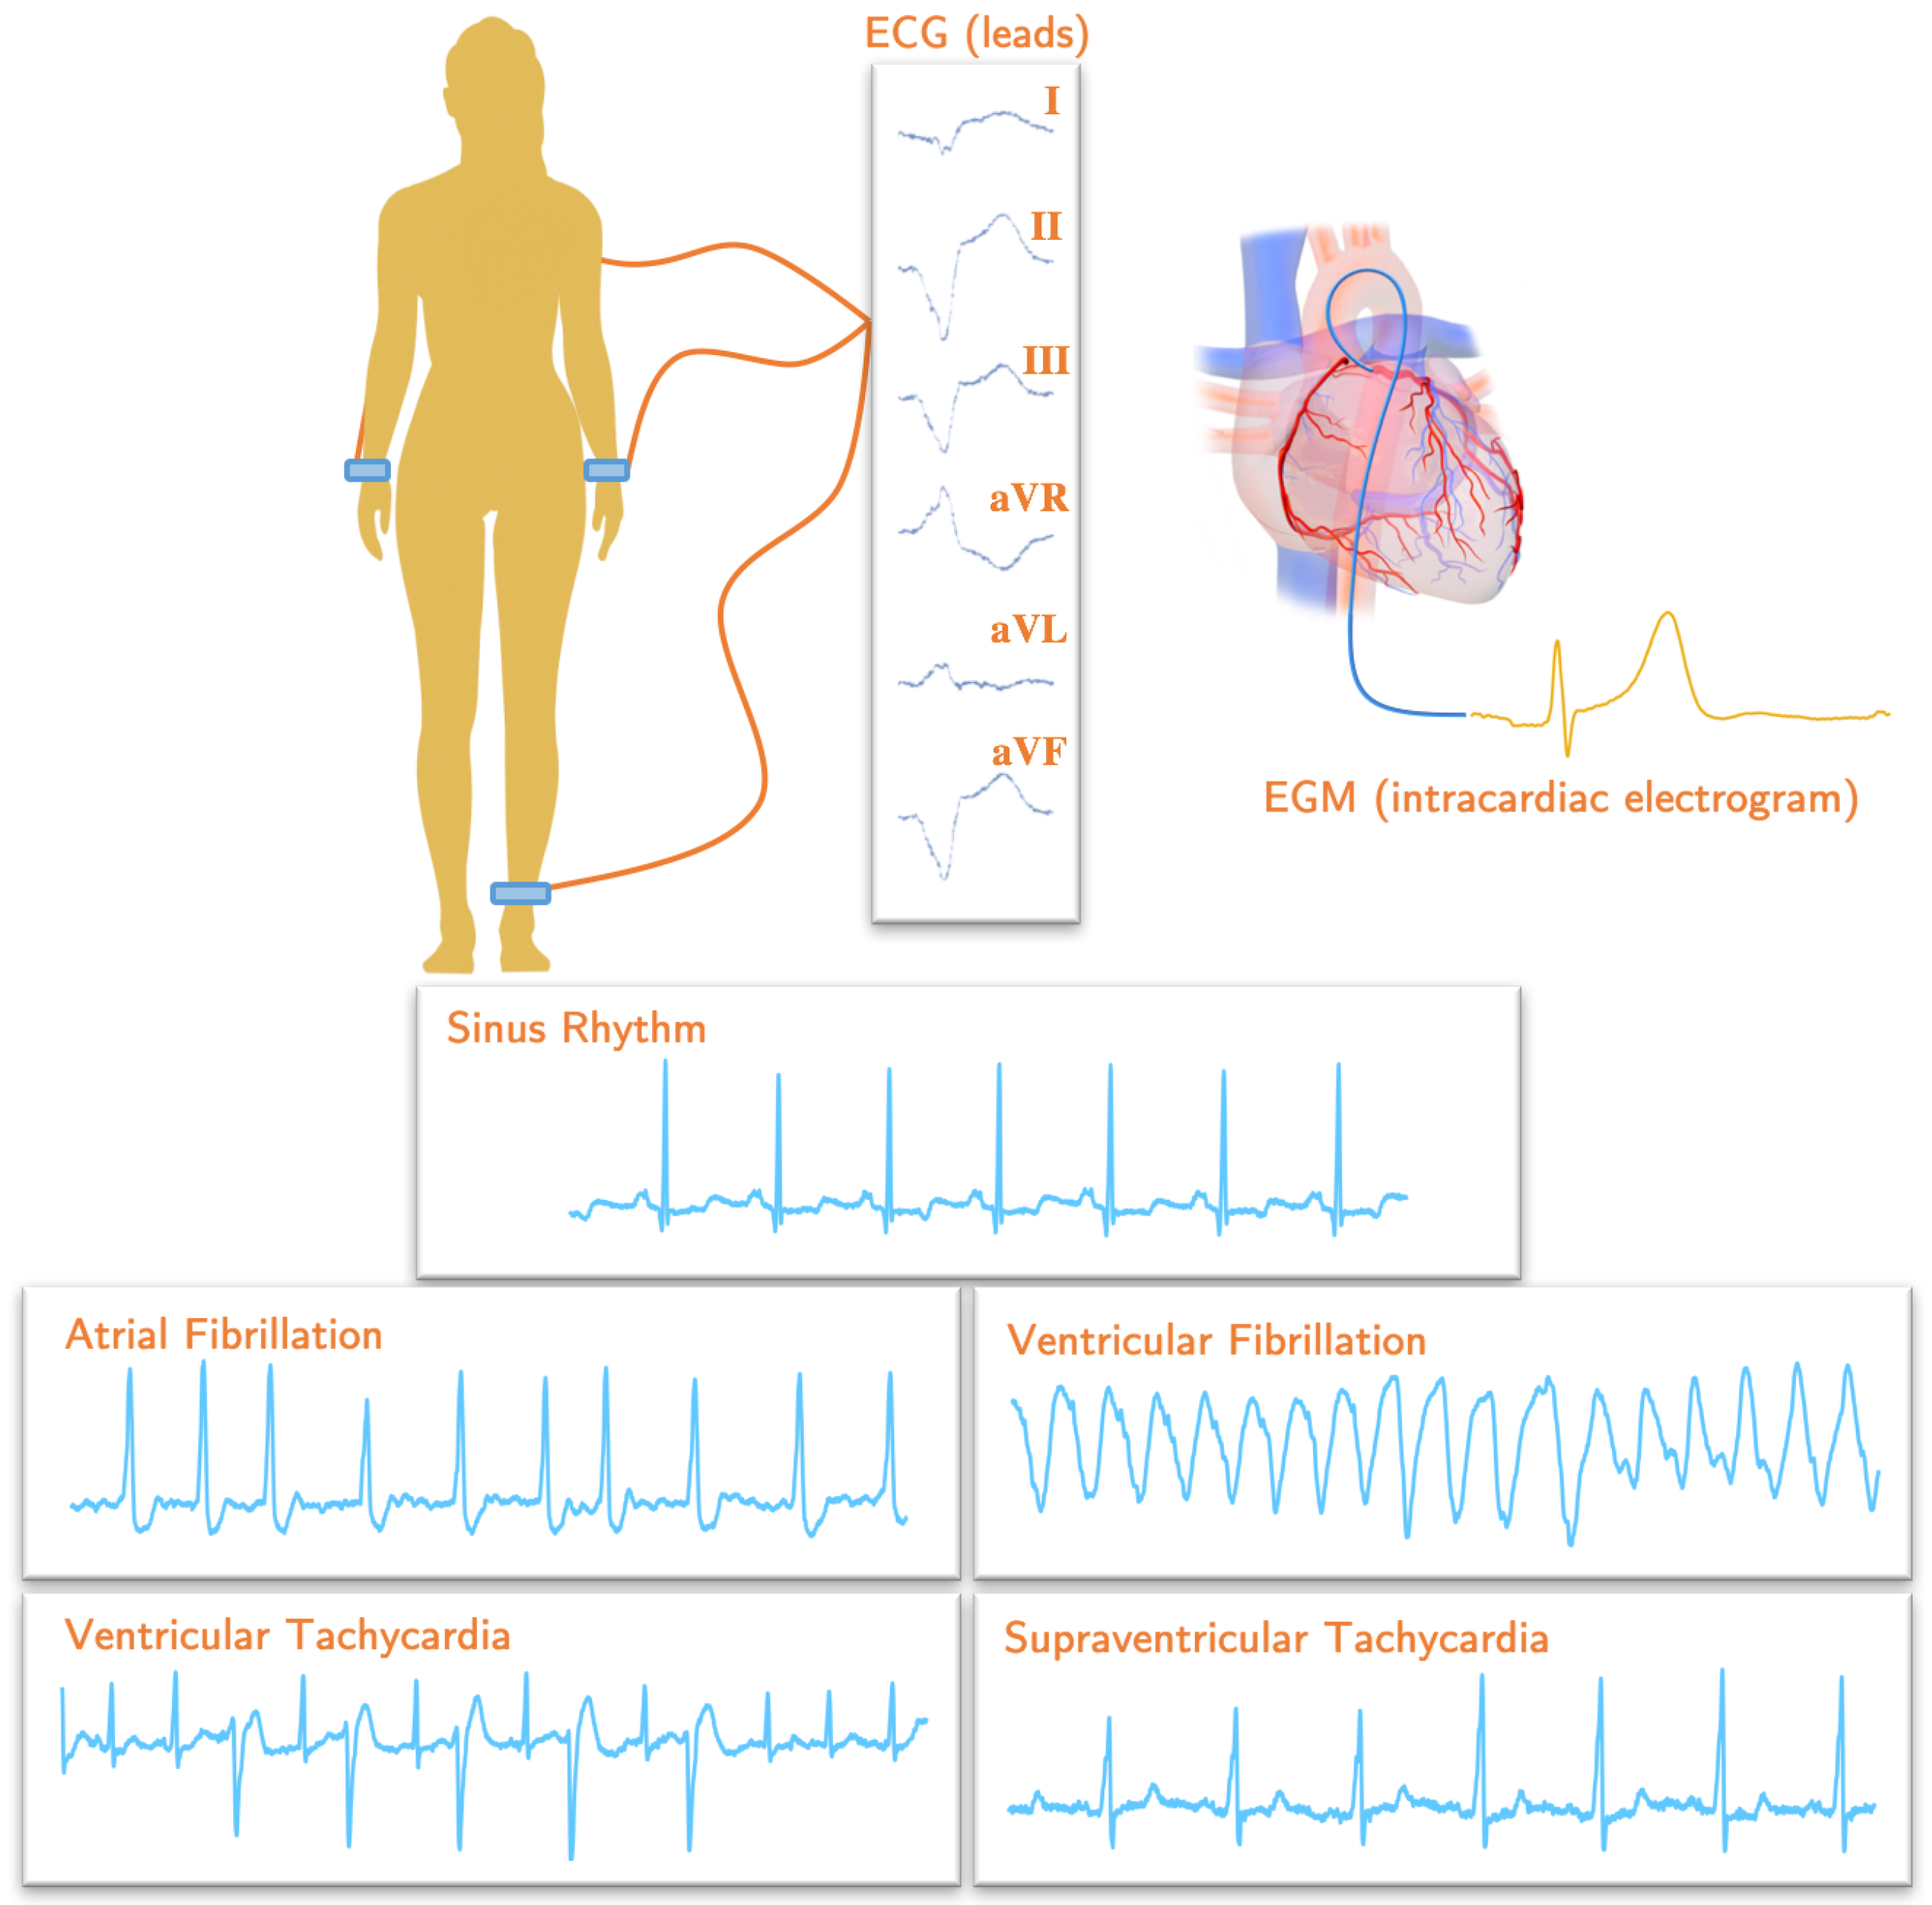
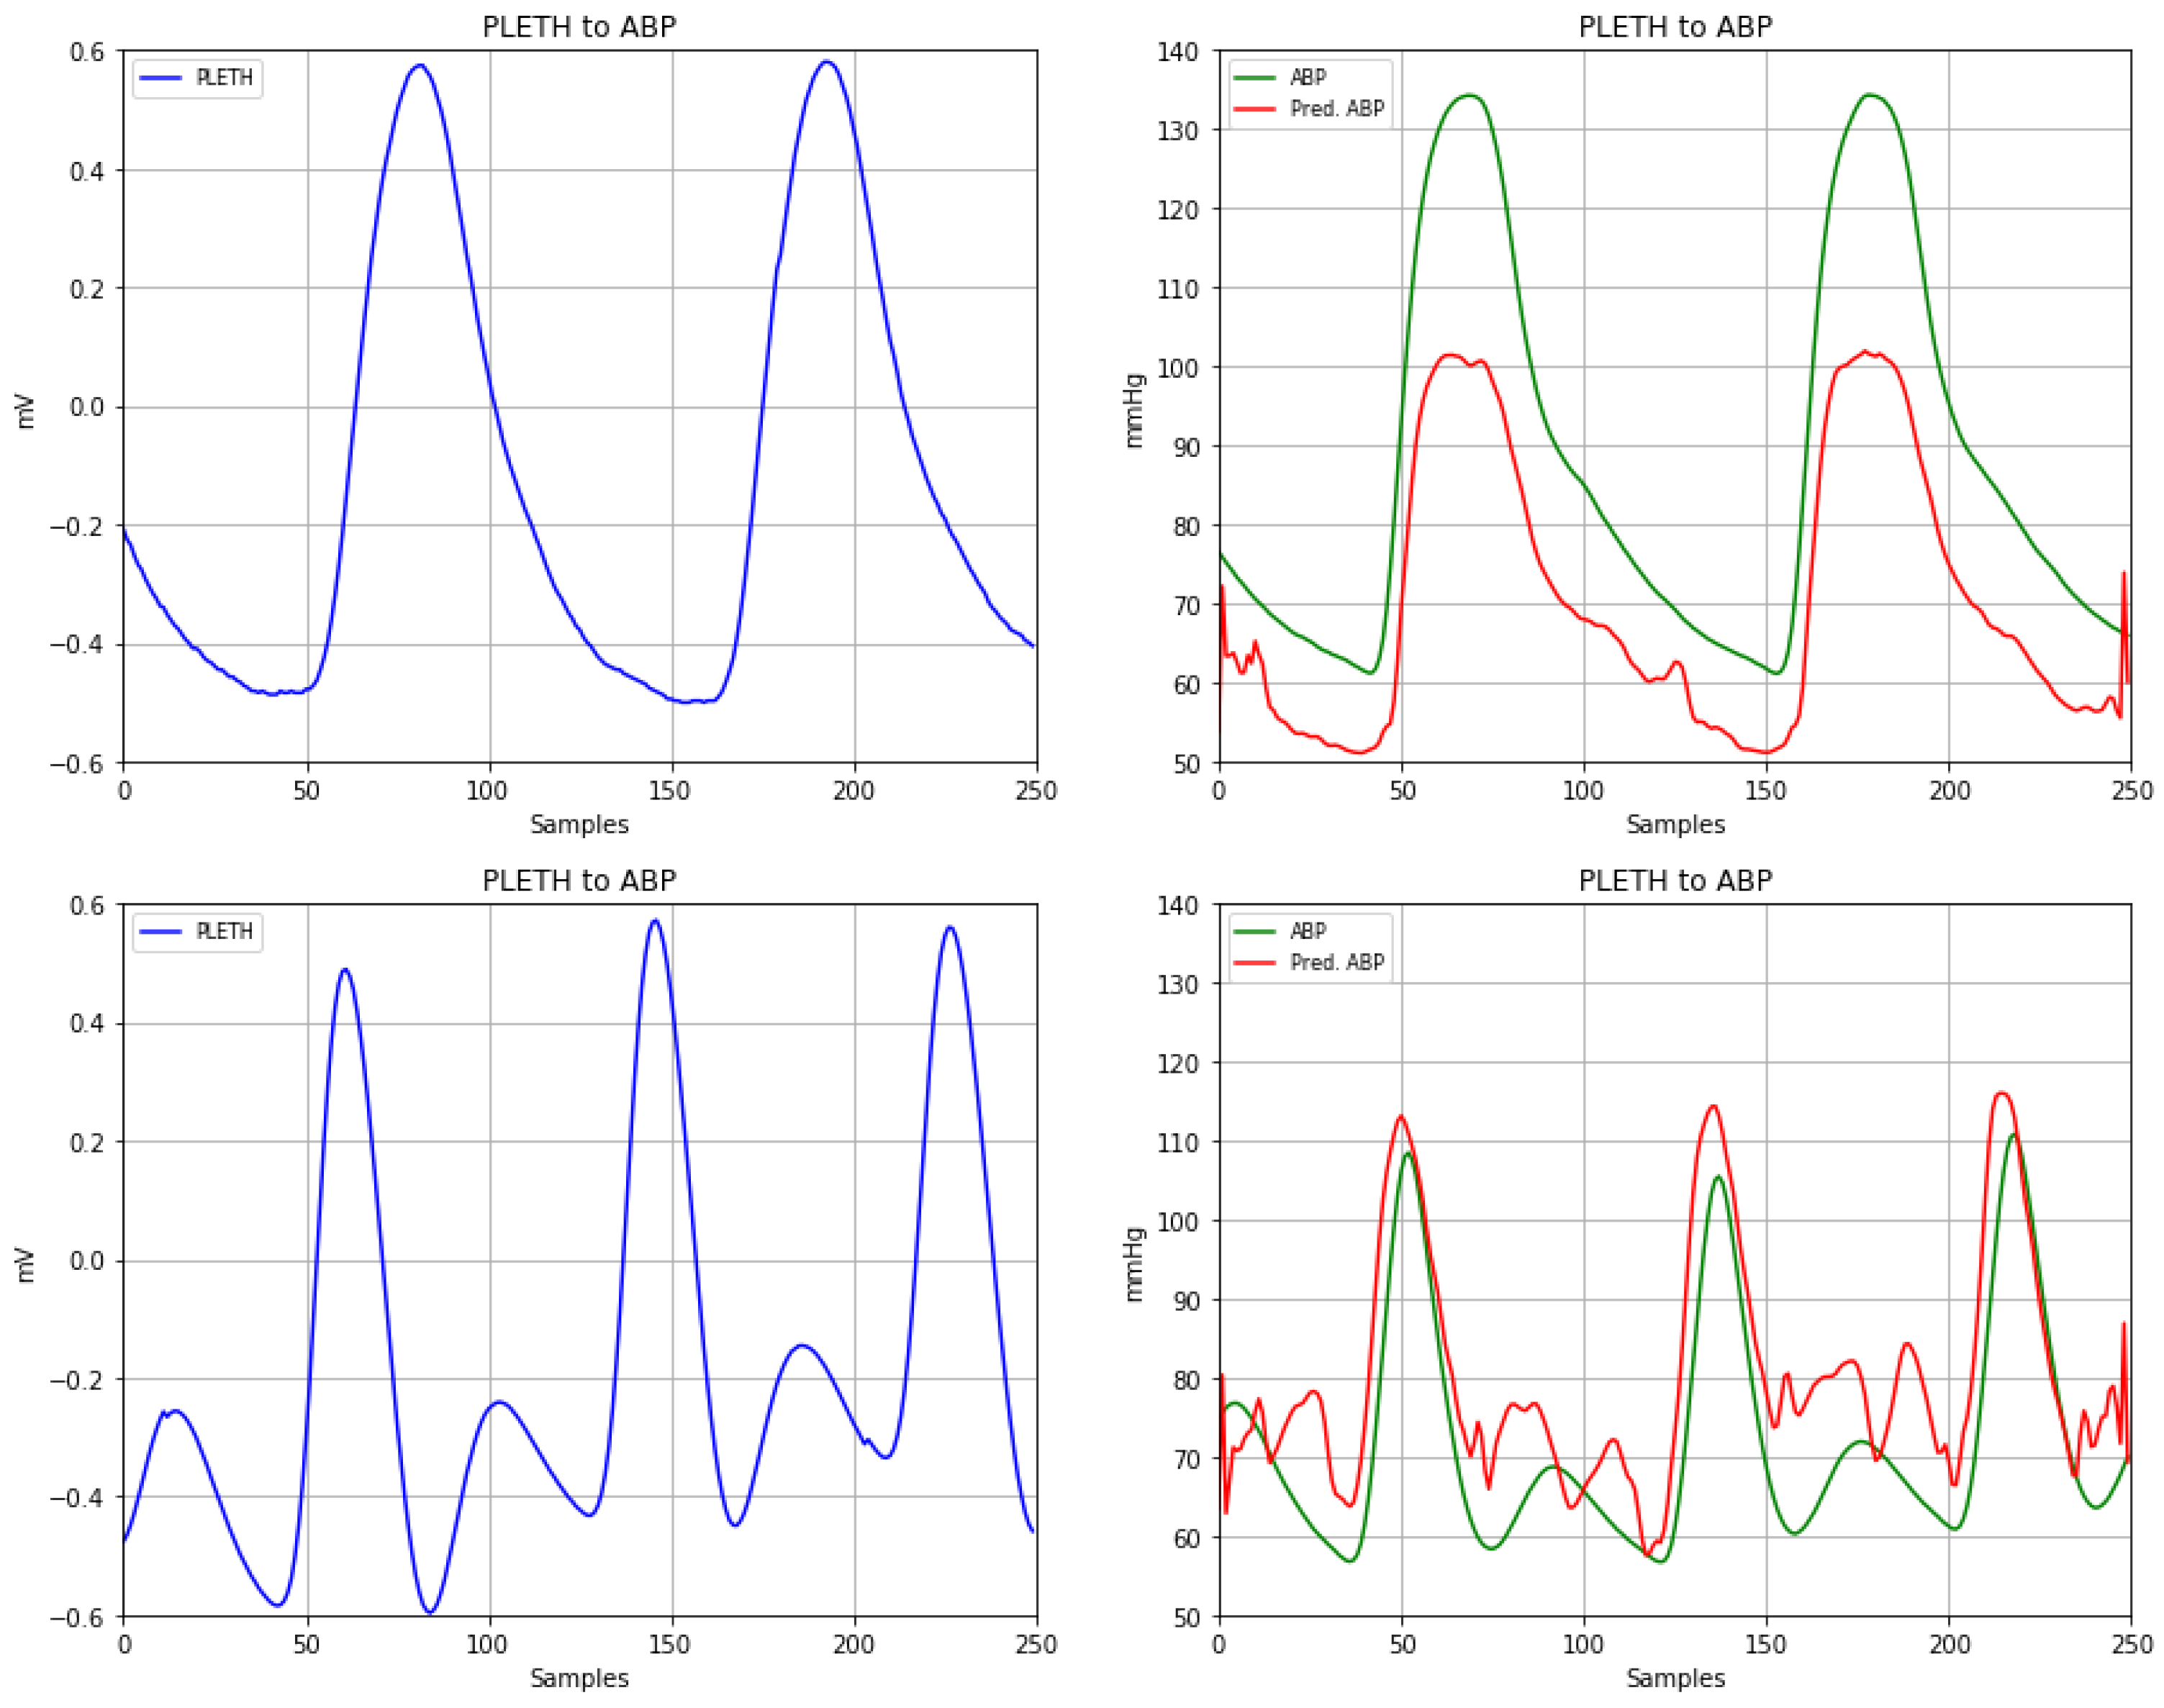
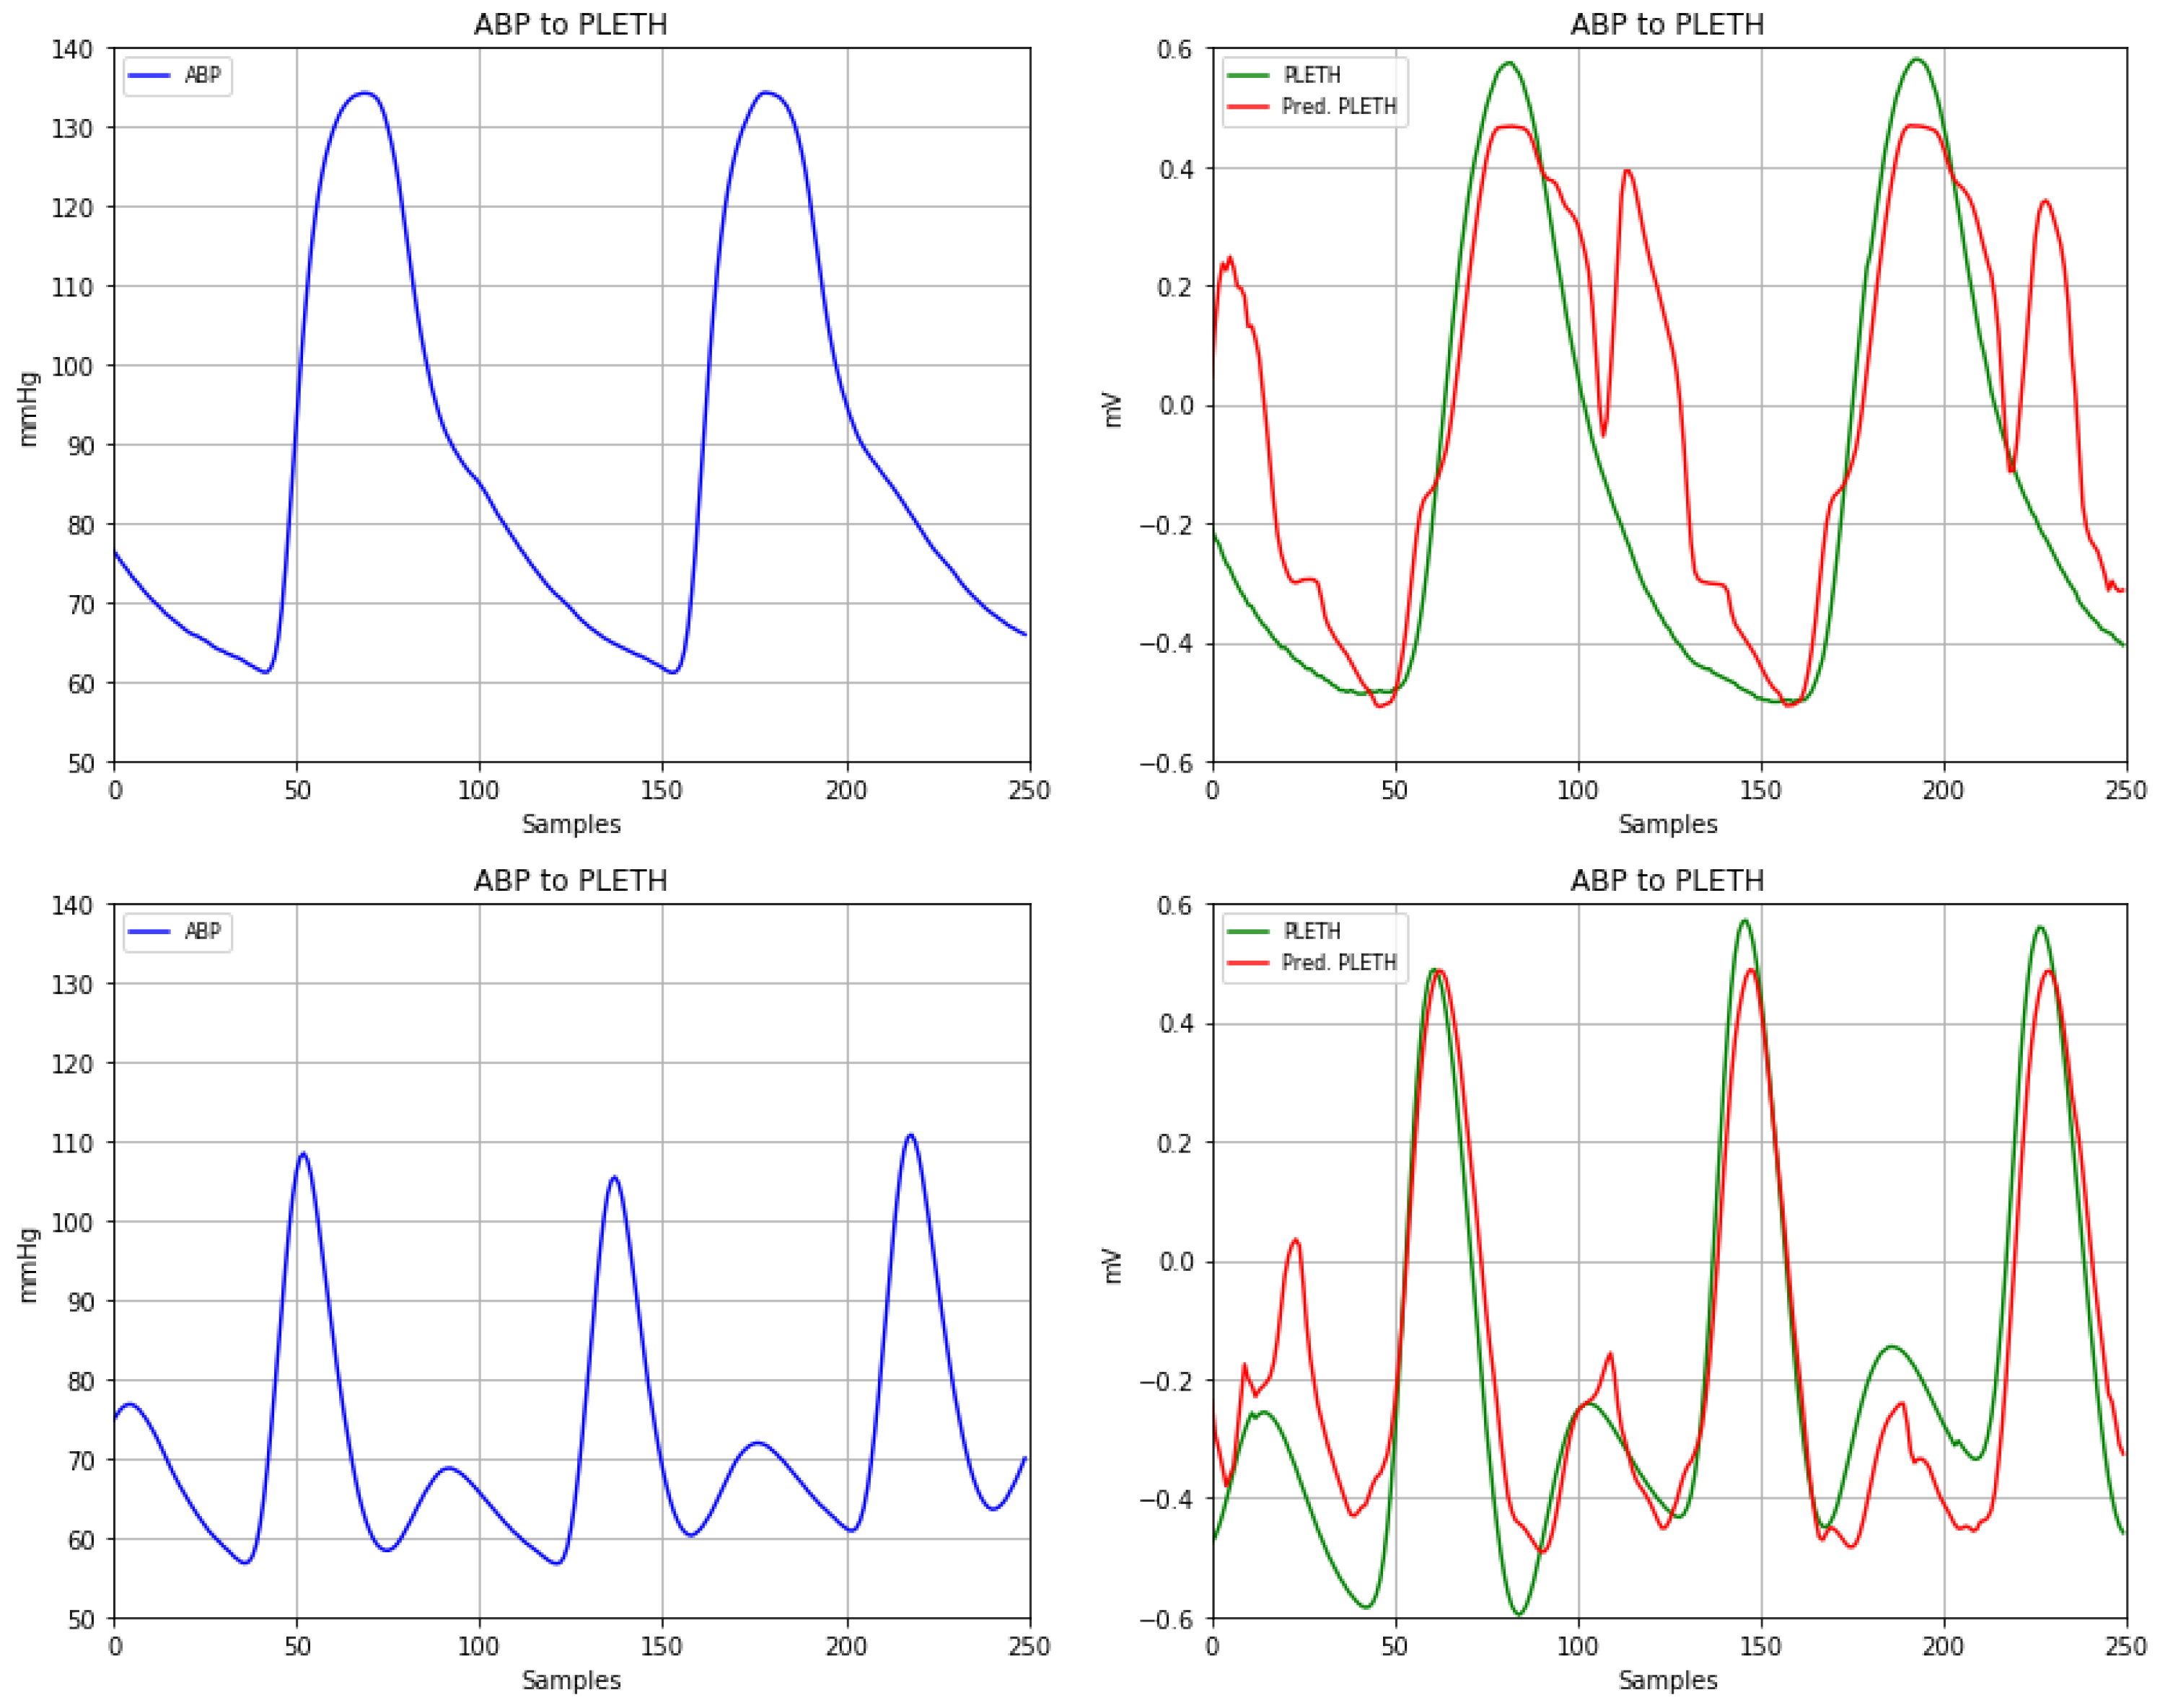