Article

Photoplethysmography-Based Continuous Systolic Blood Pressure Estimation Method for Low Processing Power Wearable Devices

by
Rolandas Gircys
1,
Agnius Liutkevicius
1,*,
Egidijus Kazanavicius
1,
Vita Lesauskaite
2,
Gyte Damuleviciene
2 and
Audrone Janaviciute
1
1
Centre of Real Time Computer Systems, Kaunas University of Technology, Barsausko str. 59-A316, LT-51423 Kaunas, Lithuania
2
Clinical Department of Geriatrics, Lithuanian University of Health Sciences, Josvainiu str. 2, LT-47144 Kaunas, Lithuania
*
Author to whom correspondence should be addressed.
Appl. Sci. 2019, 9(11), 2236; https://doi.org/10.3390/app9112236
Submission received: 13 April 2019 / Revised: 26 May 2019 / Accepted: 28 May 2019 / Published: 30 May 2019
(This article belongs to the Special Issue Human Health Engineering)

Abstract

:
Regardless of age, it is always important to detect deviations in long-term blood pressure from normal levels. Continuous monitoring of blood pressure throughout the day is even more important for elderly people with cardiovascular diseases or a high risk of stroke. The traditional cuff-based method for blood pressure measurements is not suitable for continuous real-time applications and is very uncomfortable. To address this problem, continuous blood pressure measurement methods based on photoplethysmogram (PPG) have been developed. However, these methods use specialized high-performance hardware and sensors, which are not available for common users. This paper proposes the continuous systolic blood pressure (SBP) estimation method based on PPG pulse wave steepness for low processing power wearable devices and evaluates its suitability using the commercially available CMS50FW Pulse Oximeter. The SBP estimation is done based on the PPG pulse wave steepness (rising edge angle) because it is highly correlated with systolic blood pressure. The SBP estimation based on this single feature allows us to significantly reduce the amount of data processed and avoid errors, due to PPG pulse wave amplitude changes resulting from physiological or external factors. The experimental evaluation shows that the proposed SBP estimation method allows the use of off-the-shelf wearable PPG measurement devices with a low sampling rate (up to 60 Hz) and low resolution (up to 8-bit) for precise SBP measurements (mean difference MD = −0.043 and standard deviation SD = 6.79). In contrast, the known methods for continuous SBP estimation are based on equipment with a much higher sampling rate and better resolution characteristics.

1. Introduction

It is very important to be able to determine the moment when physiological parameters deviate from normal levels in order to prevent chronic diseases. The dynamics of observed physiological parameters are more important over the long-run than accurate instant values, which are used in an emergency or cases of critical health disorders. It is important to detect the degree of a physiological parameter’s deviation from normal during a day, week, month or even a year, as well as the length of such a deviation. If deviation persists for a long time, this can suggest the risk of irreversible changes. Timely detection of such dangerous deviations from normal and an immediate start of treatment can help to avoid negative and irreversible health changes.
Therefore, the long-term constant observation of physiological parameters, such as blood pressure allows us to reduce the healthcare costs, as discussed in Reference [1], minimizes the risk of visiting secondary healthcare institutions, and ensures a better quality of life for a longer period. Blood pressure measurements made at home indicate the state of the cardiovascular system better than those obtained during regular visits to a doctor, as discussed in Reference [2]. A very significant proportion of chronic diseases are cardiovascular diseases. Atherosclerosis and endothelial function changes are accompanied by a rise in blood pressure. As suggested in Reference [3], increasing blood pressure values, measured at home, can be considered as a prognostic sign of atherosclerosis or endothelial dysfunction. Long-term blood pressure variability, obtained during daily home blood pressure measurement (HBP), can show internal organ damage or risk of cardiovascular events, as reported in Reference [4]. The authors of [5] show that increased blood pressure is a potential dementia illness risk factor; thus, registering the dynamics of blood pressure for elderly people can serve as a preventive mental health disorder measure. Hence, the continuous monitoring of blood pressure is critical for the prevention and diagnosis of hypertension and cardiovascular diseases.
Both SBP and diastolic blood pressure (DBP) are important to assess the state of the cardiovascular system, but according to References [6,7,8], systolic hypertension is much more common than diastolic hypertension, and systolic blood pressure contributes more to the huge global disease burden attributable to hypertension than diastolic pressure. Systolic blood pressure is much more important for elderly people and their health state evaluation, as discussed in References [9,10,11,12]. Since elderly people are the major group of geriatrics patients, which are subjects of this study, the estimation of systolic blood pressure is the main focus of this paper.
The traditional auscultatory blood pressure measurement method is not continuous and is quite uncomfortable, because it uses a cuff wrapped around the arm which is inflated repeatedly. To address this problem, continuous blood pressure measurement methods have been developed recently. The most popular methods for continuous and cuffless blood pressure monitoring are based on pulse transit time (PTT) [13,14,15,16,17,18]. However, PTT is calculated using two signals (usually electrocardiogram and pulse wave), which is quite difficult to implement in wearable devices for daily use.
Blood pressure estimation methods which are based on one-channel pulse wave measurements are less complex and allow us to create wearable devices which are more comfortable for the end users. A pulse wave is often obtained using the photoplethysmogram (PPG) optical measurement method. Blood pressure measurement methods based on one-channel PPG are implemented using stationary medical devices [10,19,20,21,22], original PPG measurement devices, such as those in References [23,24,25], or even smartphones [26,27]. The smartphone approach is not truly continuous, since the user does not wear a PPG sensor. Meanwhile, stationary medical devices or devices created in laboratories are hardly wearable or are available only for a very small group of potential users.
Therefore, this research investigates the possibility of using commercial-off-the-shelf wrist pulse oximeters for continuous cuffless blood pressure measurement, since they are certified, quite cheap, and, most importantly, accessible to everyone (see Figure 1).
If a pulse oximeter is capable of PPG signal transmission over Bluetooth or Wi-Fi, then it is possible to send PPG values to a mobile phone or another device for further SBP estimation and SBP value recording. This allows us to implement a 24/7 system for SBP monitoring.
Other authors usually obtain PPG signal values using a 125–1000 Hz sampling rate and 8–12-bit resolution analog digital converter (ADC) [10,13,15,19,20,21,22,23,24,25]. However, energy consumption is the key feature of wearable devices, and a lower sampling rate and resolution allow us to significantly reduce ADC energy consumption, as discussed in Reference [28]. Moreover, the energy used for the data transmission is lower as well, because of the lower number of bytes per sample and the samples per second rate.
This paper proposes a novel approach for the estimation of SBP, using a much lower PPG sampling rate and resolution than other authors and analyzing not all of the PPG pulse wave, but its rising edge only, thereby reducing the number of calculations (and energy consumption) to obtain a result. Experimental evaluation is done using a CMS50FW wrist pulse oximeter with a 60 Hz sampling frequency and 8-bit resolution, which is widely available, quite cheap and is capable of transmitting PPG values over Bluetooth.

2. Materials and Methods

The methodology proposed in this paper is depicted in Figure 2.
The PPG signal preprocessing is performed, including normalization and filtering, pulse wave peak and valley point detection, as well as base line correction and peak line correction, as described in the following sections. The systolic blood pressure values are estimated from PPG according to the mathematical model proposed in our previous work [29].

2.1. Systolic Blood Pressure Estimation Model

The mathematical–physical model for SBP estimation proposed in Reference [29] is based on Hook’s law as defined in Equation (1):
σ = E · ε · h / ( 1 θ 2 ) ,
where d is the diameter of the artery, d0 is the initial diameter of the artery, h is the thickness of the artery wall, ε = d/d0 is strain, σ is stress, E is the Young’s modulus, and θ is Poisson’s ratio.
Although pressure (p), stress and Young’s modulus are different physical quantities, they have the same dimensions dim(p) = dim(σ) = dim(E) − L−1MT−2, where L is length, M is mass, and T is time; hence, an equals sign can be written between them: pEσ. Hence, Young’s modulus in Equation (1) can be changed with pressure without losing physical meaning. Changing one physical quantity to another when their dimensions are equal is quite common practice, which can be seen by comparing the Bramwell–Hill and Moens–Korteweg equations describing pulse wave velocity. The Moens–Korteweg equation uses Young’s modulus, while Bramwell–Hill uses pressure.
Let us change stress in Equation (1) to pressure as defined in Equation (2):
p = E · ε · h / ( 1 θ 2 ) .
When blood pressure p(t) changes during the cardiac cycle, the diameter of artery d(t) changes as well; therefore, Equation (2) can be re-written as a time function as given by Equation (3):
p ( t ) = E · d ( t ) d 0 · h ( 1 θ 2 ) ,
where p(t) is the blood pressure change function during the cardiac cycle (blood pressure pulse wave). Function p(t) is called the pressure pulse wave (PPW) in the remainder of this paper, while relative deformation variation d(t)/d0 is the deformation pulse wave (DPW), where d0 is the artery diameter at the beginning of the cardiac cycle. Let us denote DPW as D(t) = d(t)/d0, and the remainder of Equation (3) as a constant K = E ( h / ( 1 θ 2 ) ) , leading to the following Equation (4):
p ( t ) = K · D ( t ) .
If the stress–strain characteristic is linear, i.e., E = const., then, if K is known, p(t) values can be calculated for the whole cardiac cycle interval. Usually, we are interested in finding the maximum PPW value, systolic blood pressure value pi = max(p(t)), which is achieved during time period ts at the i-th cardiac cycle.
If K = const. in Equation (4), then the DPW steepness tan(γ)i = DPW(t)/t during i-th cardiac cycle is tan(γ)i = const., while the systolic blood pressure value pi = max(p(t)), when 0 ≤ tts, can be obtained as following Equation (5):
p i = K · tan ( γ ) · t s ,
where pi and tan(γ)i change equally during each cardiac cycle.
The DPW form depends on the stress–strain characteristic, which is not linear in the case of blood vessels. Because of this, pressure and deformation pulse waveforms are different, while K ≠ const. The authors of [30,31,32] show that in the part where PPW and DPW are changing most rapidly, their trajectories concur (see Figure 3).
Hence, tan(γ)max_i correlates with the systolic blood pressure value of the i-th cardiac cycle, and this SBP value can be calculated using Equation (5) and taking the steepest part of the DPW rising edge: tan(γ)max_i = max(tan(γj)), 1 ≤ jM − 1, where M is the number of sampled points of DPW rising edge, γj is the angle between the base line and the line drawn through the j-th and (j + 1)-th points of rising edge, and i is the pulse wave number.

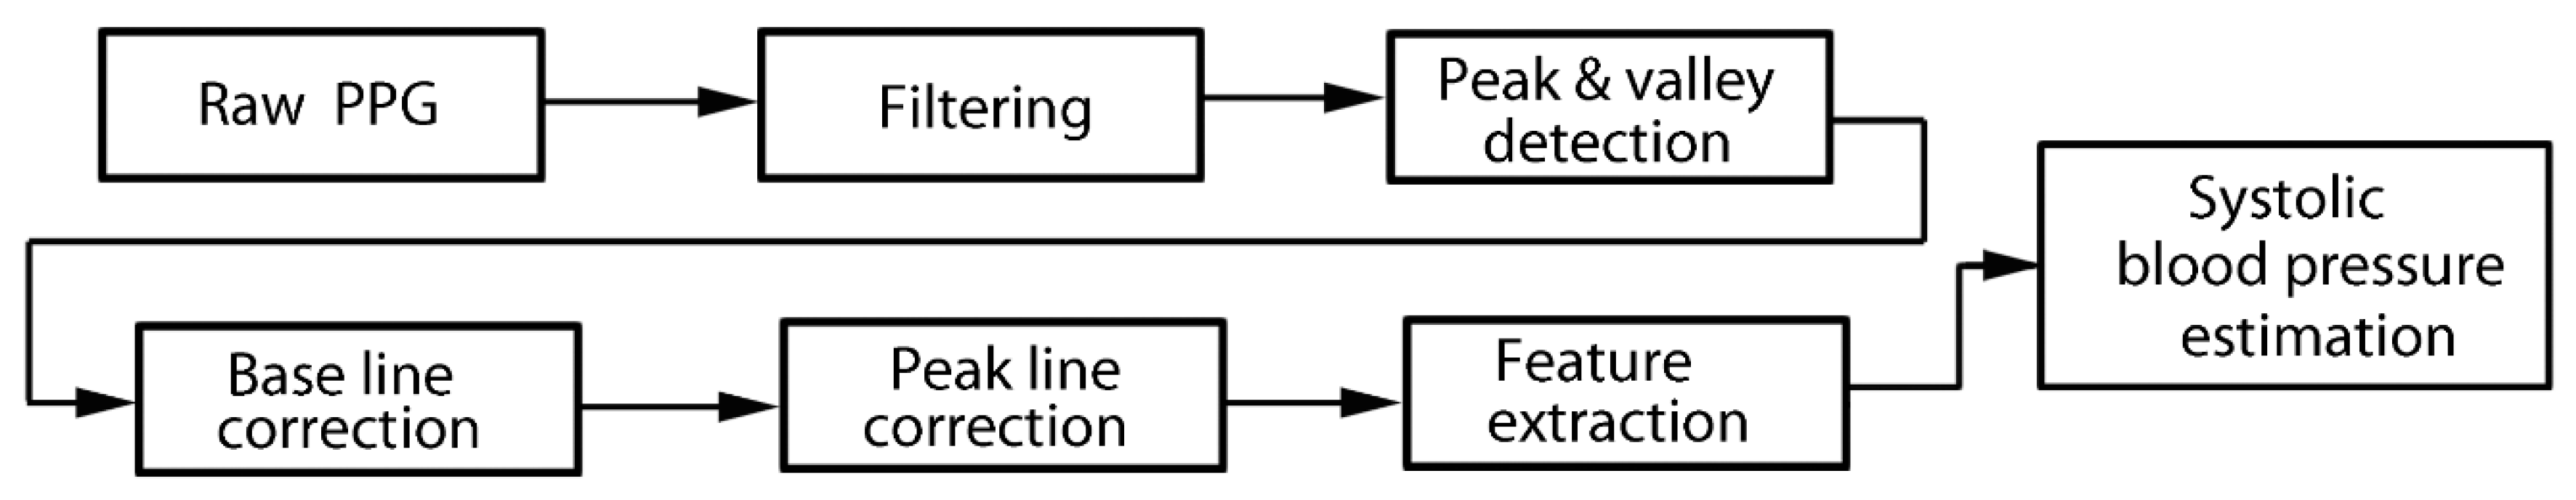
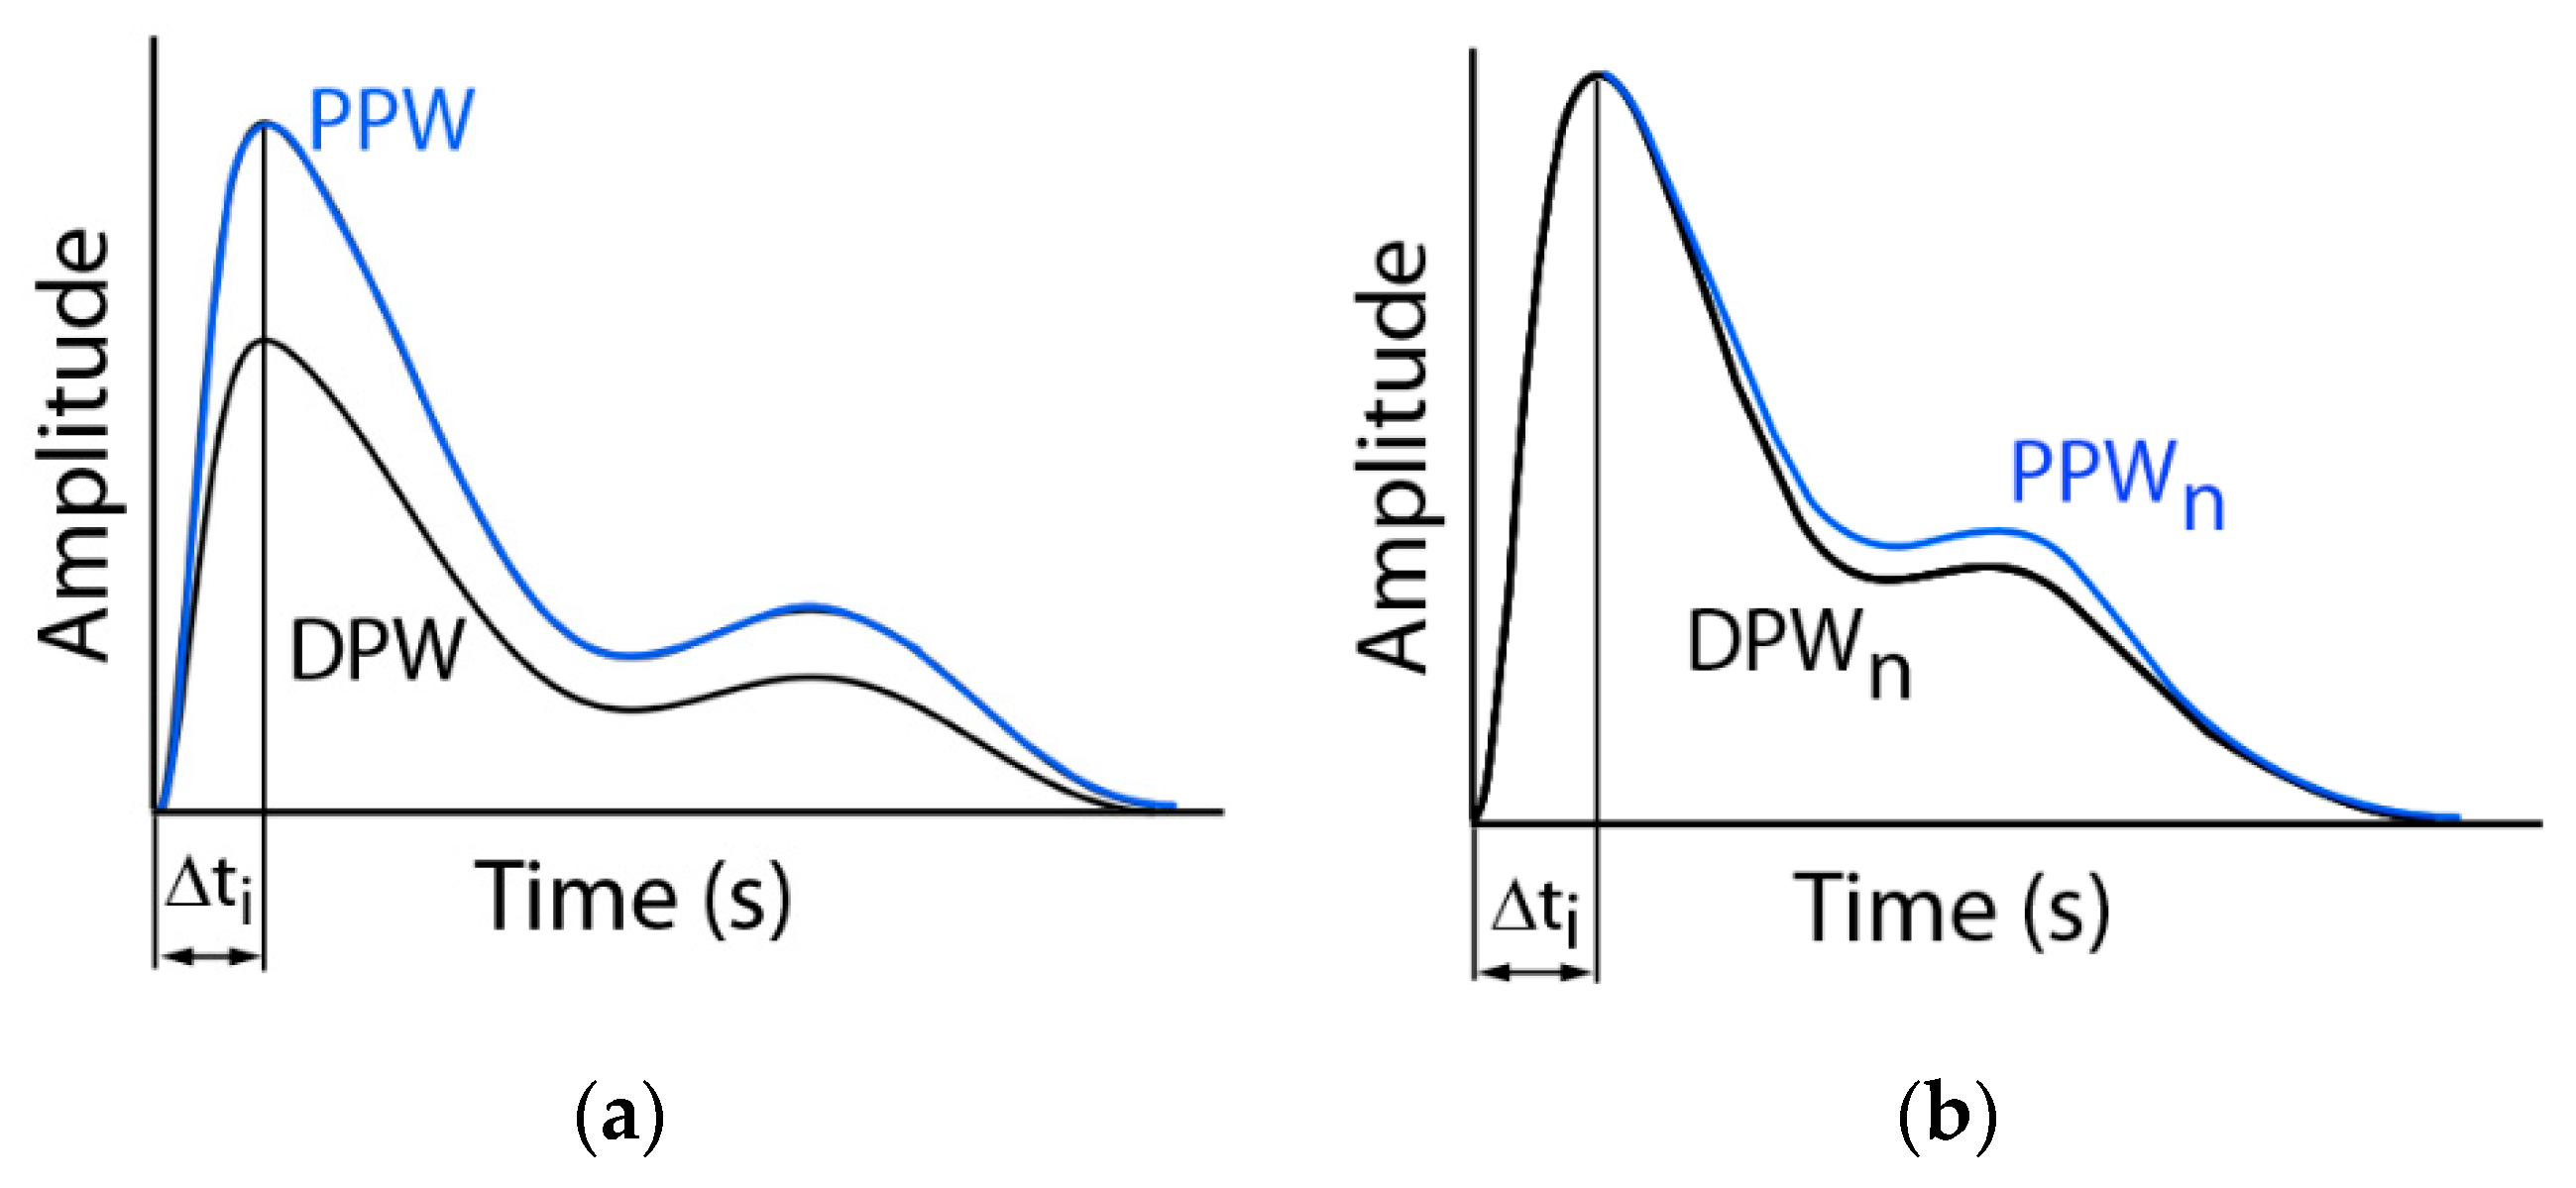
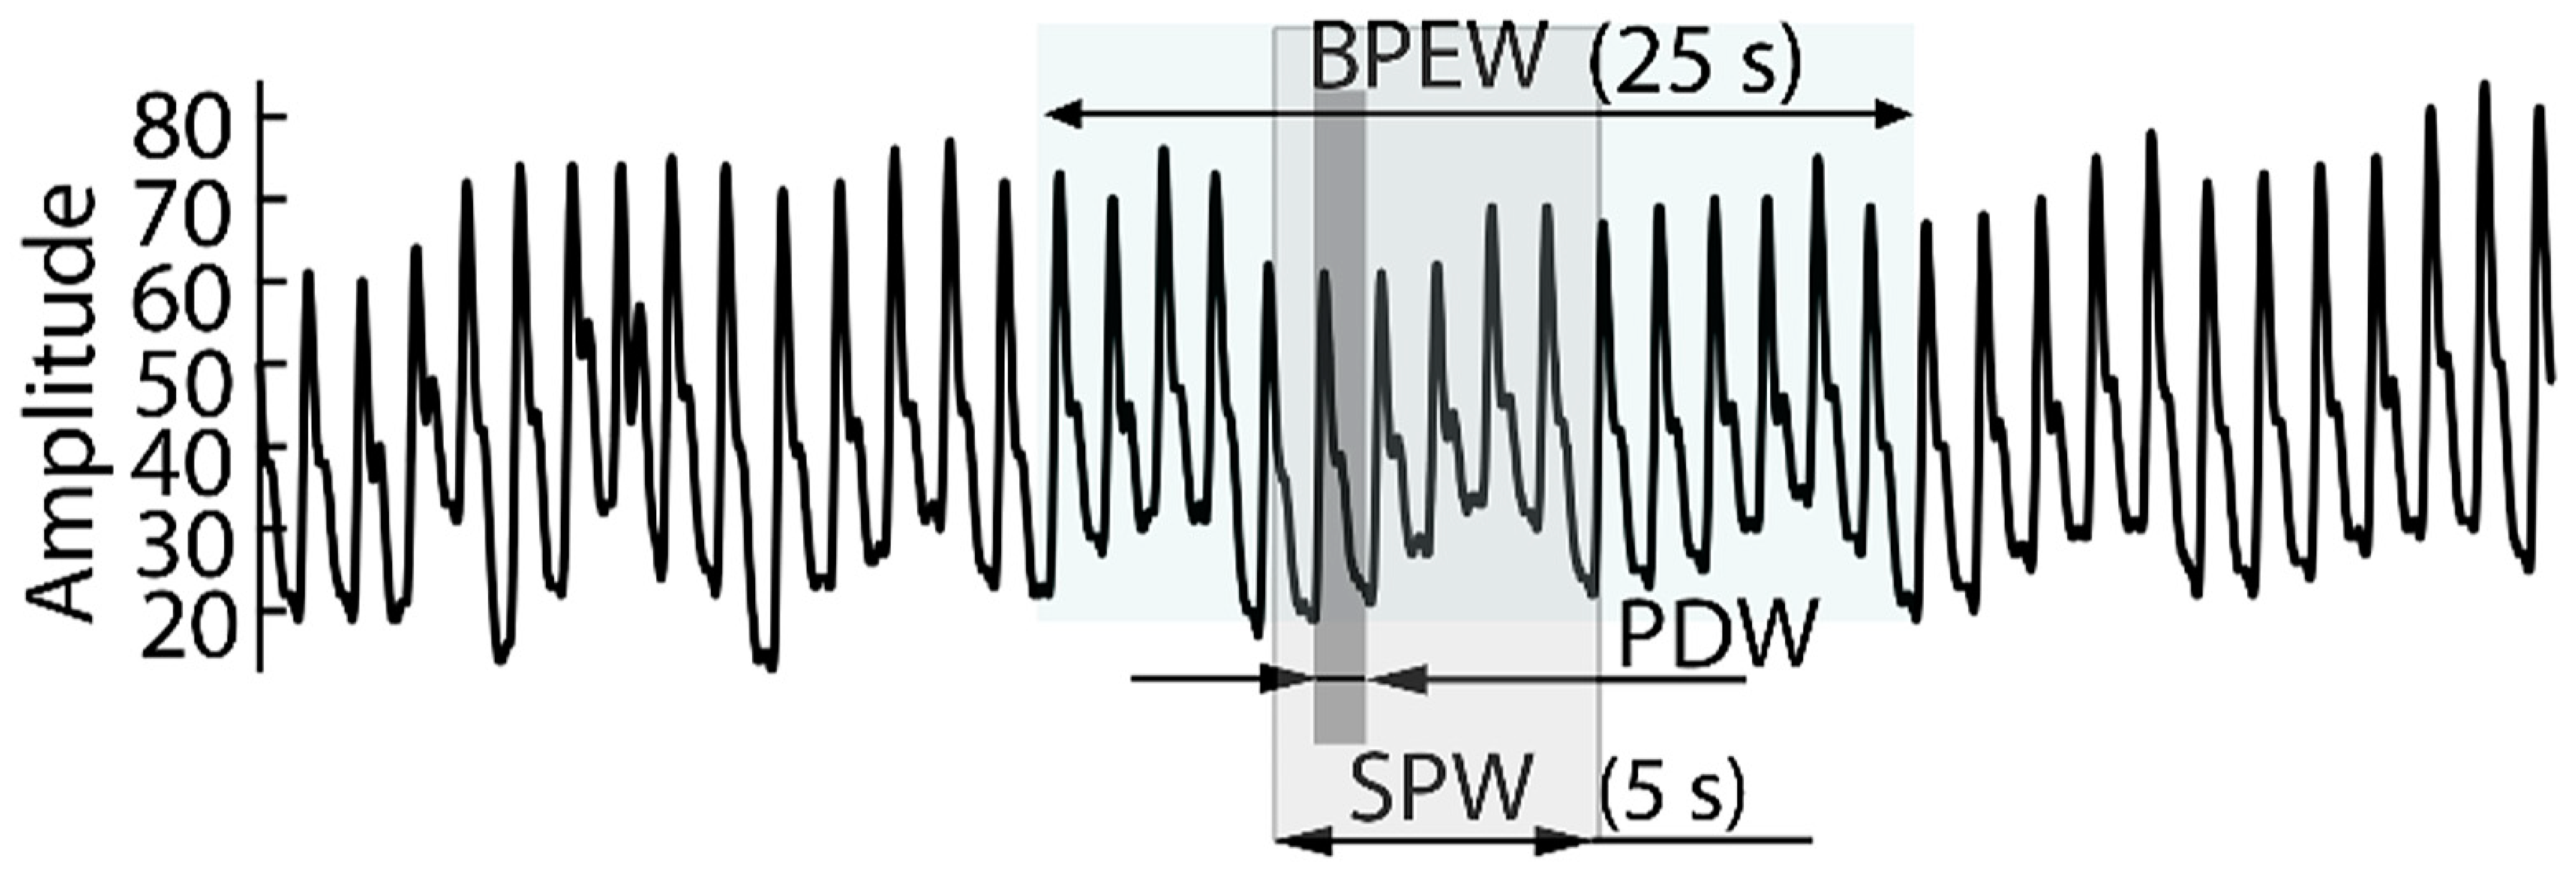
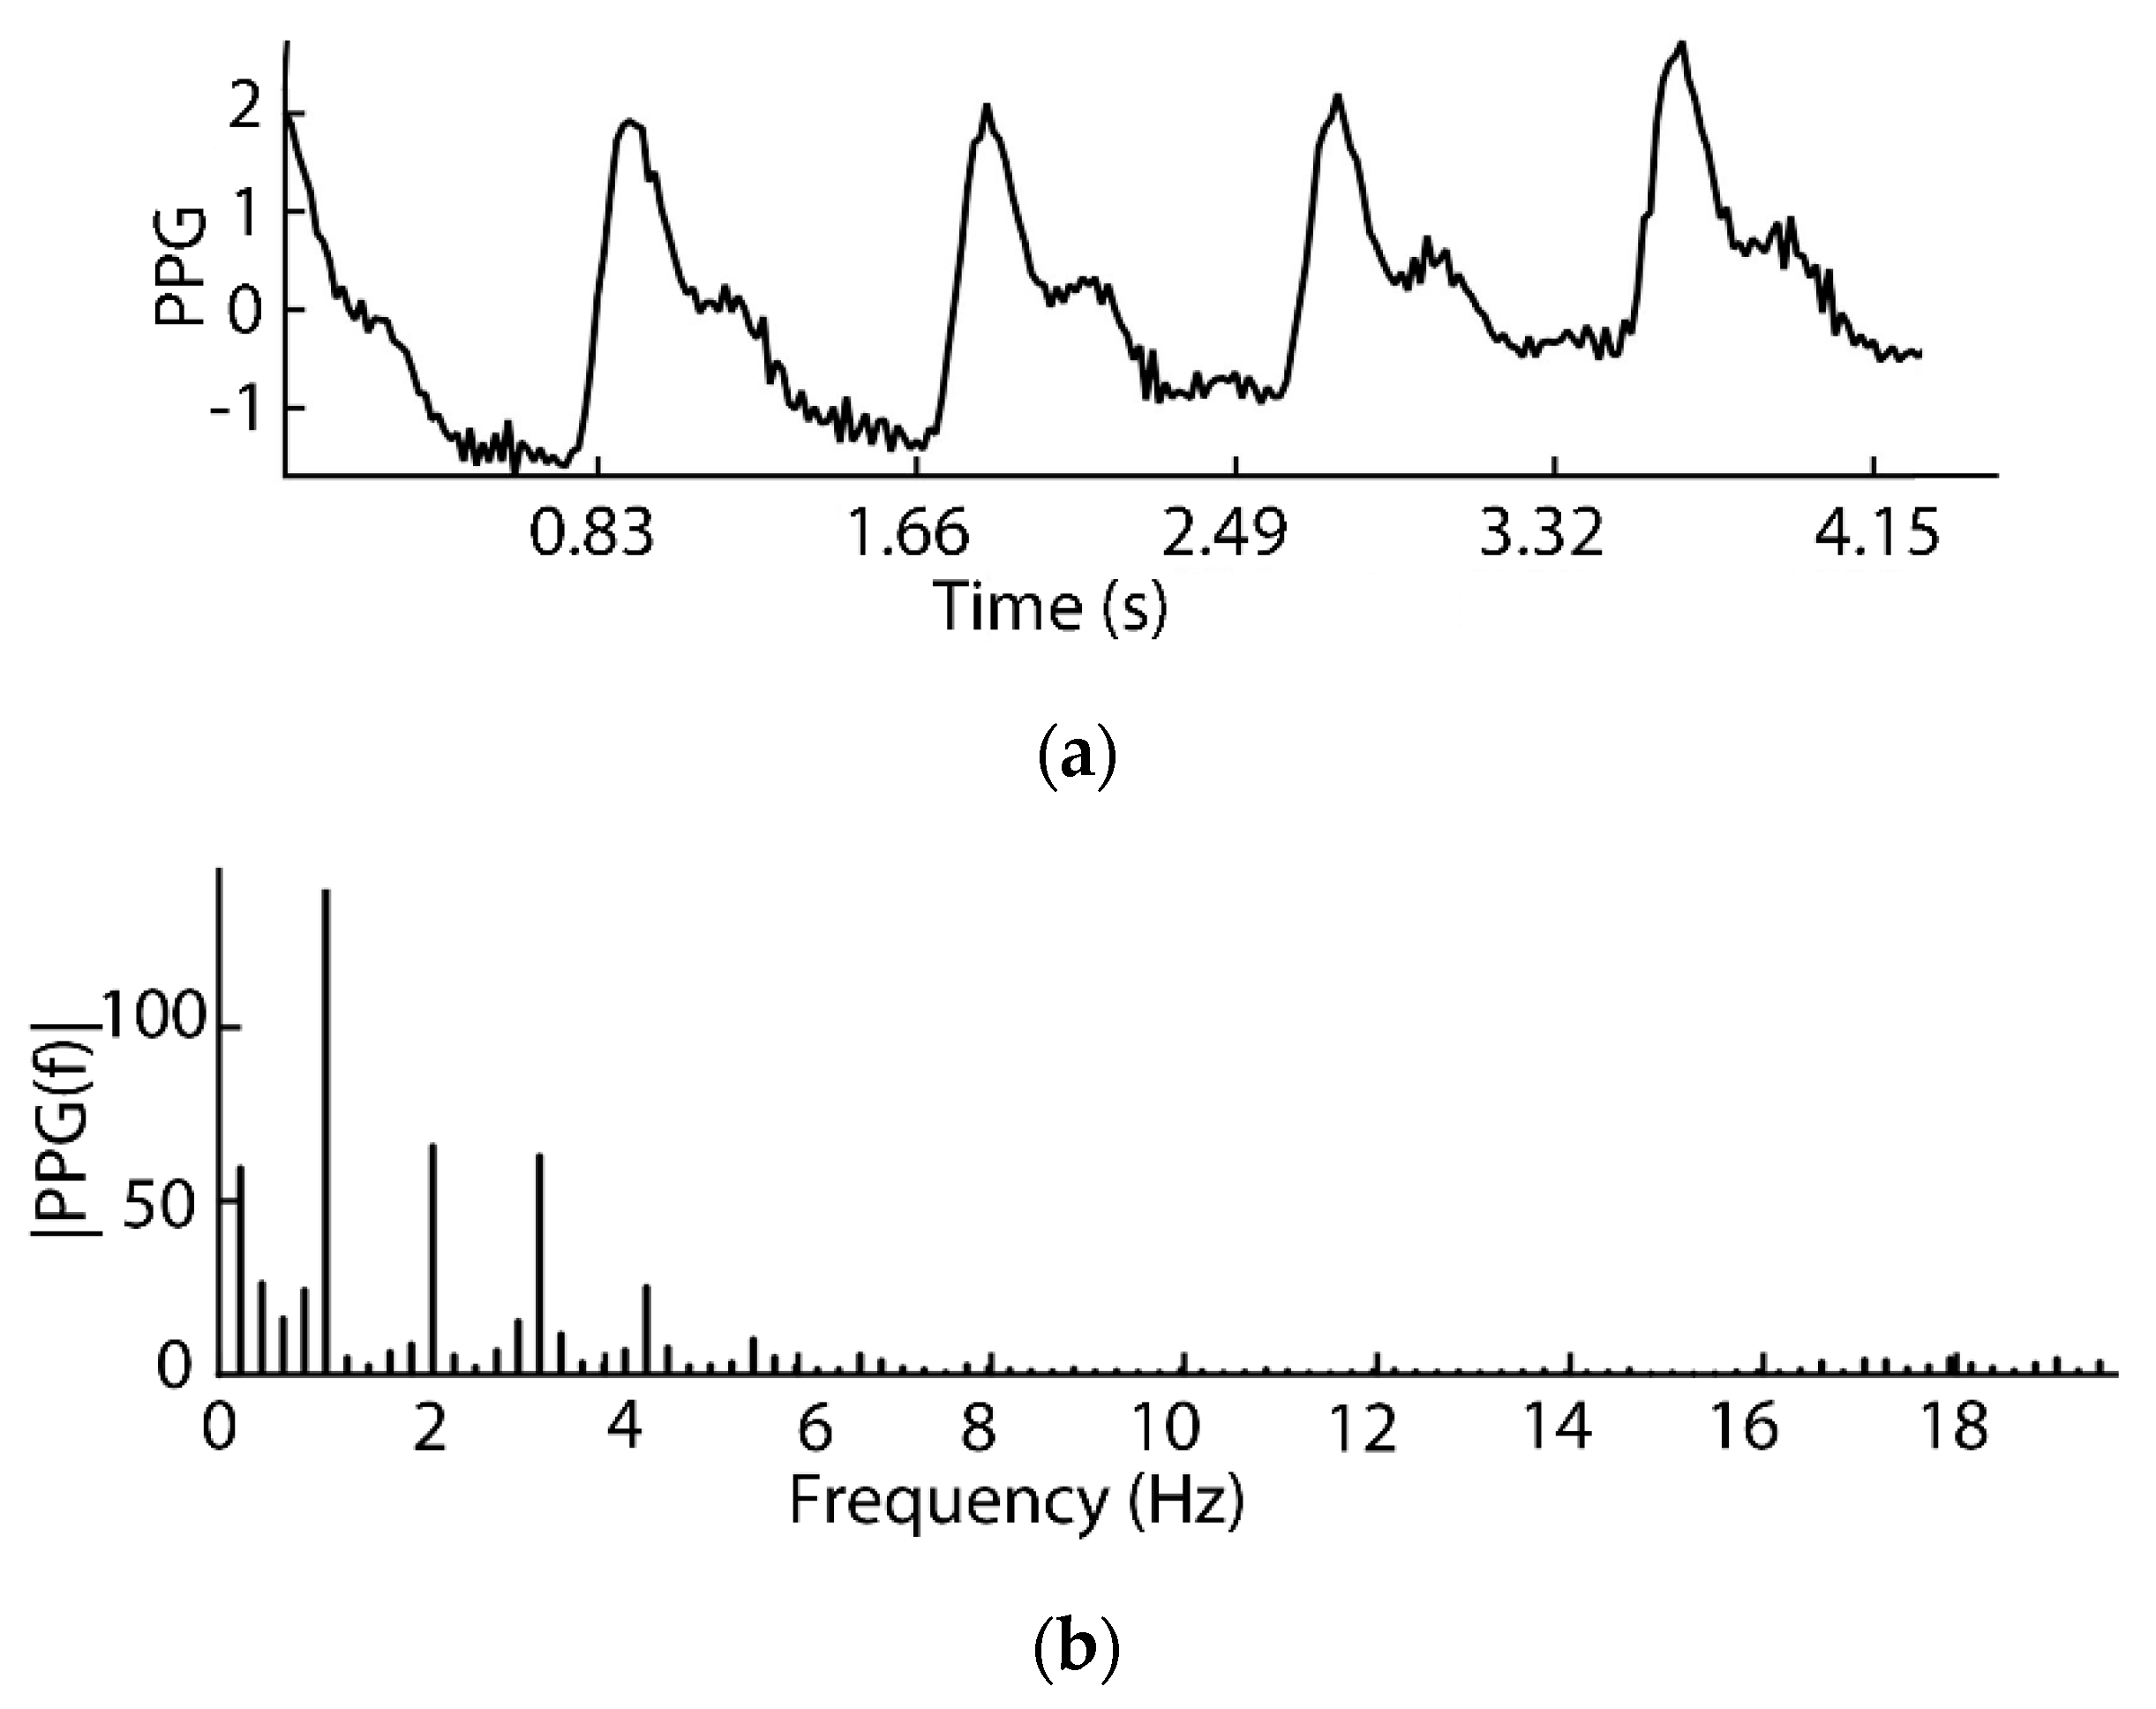
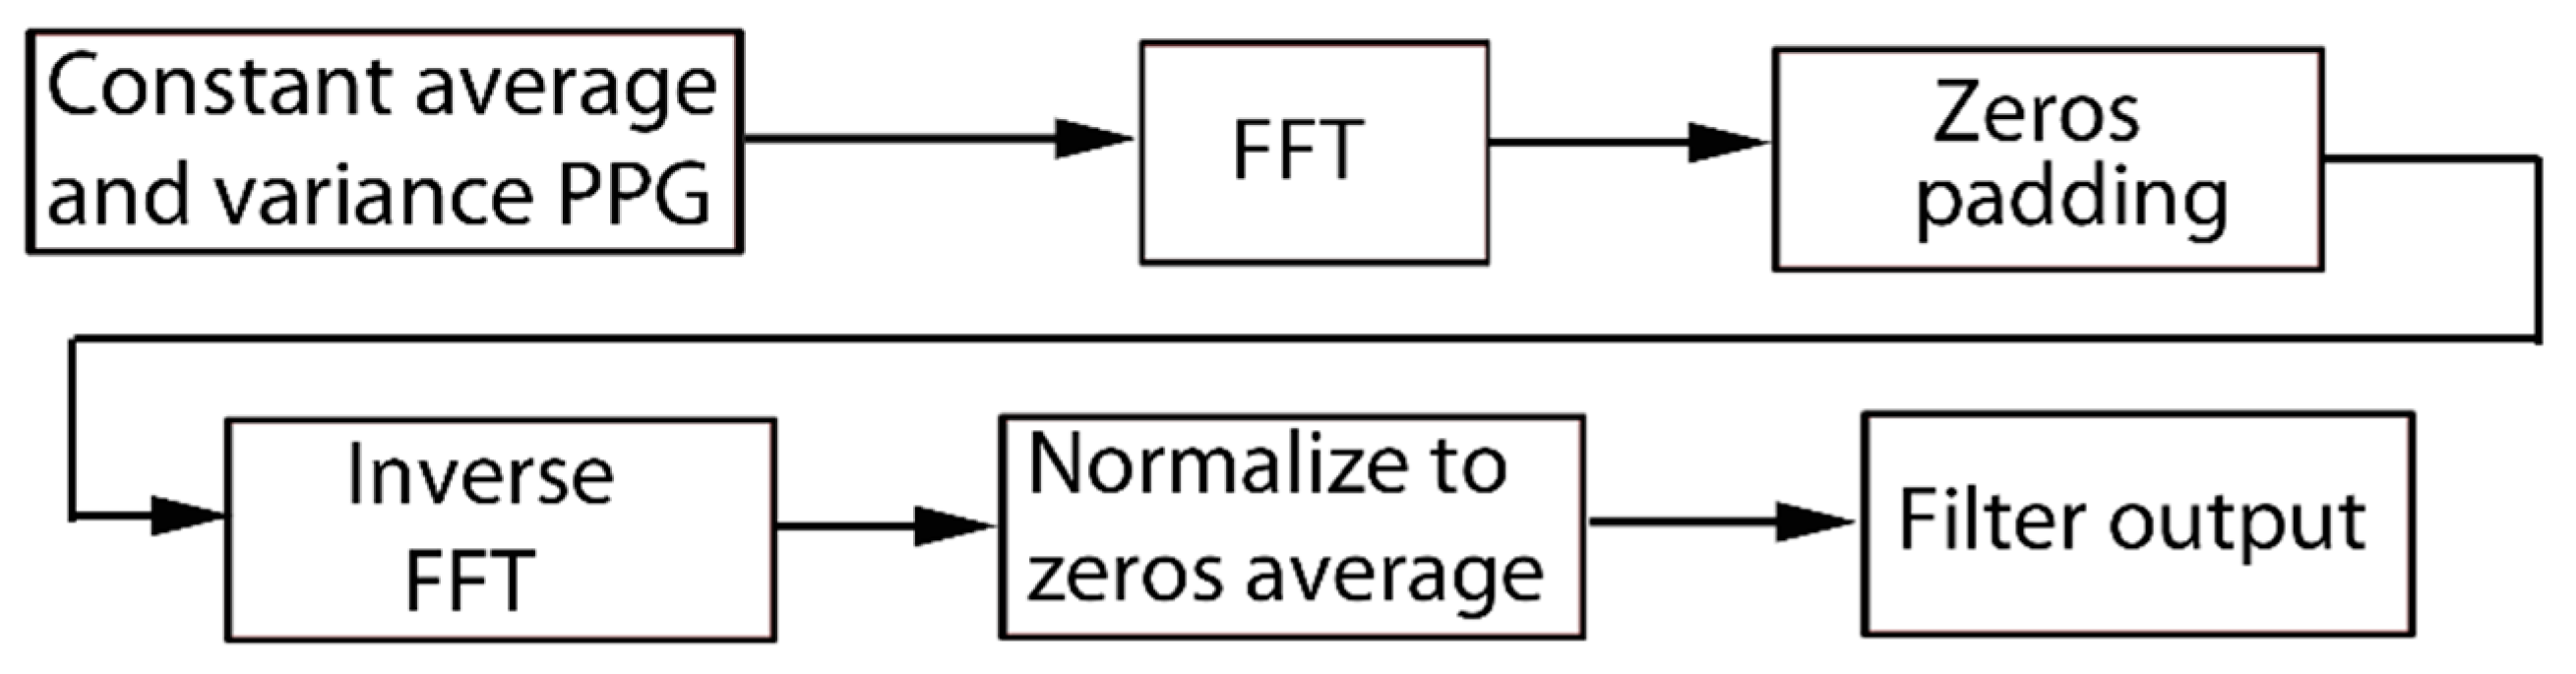
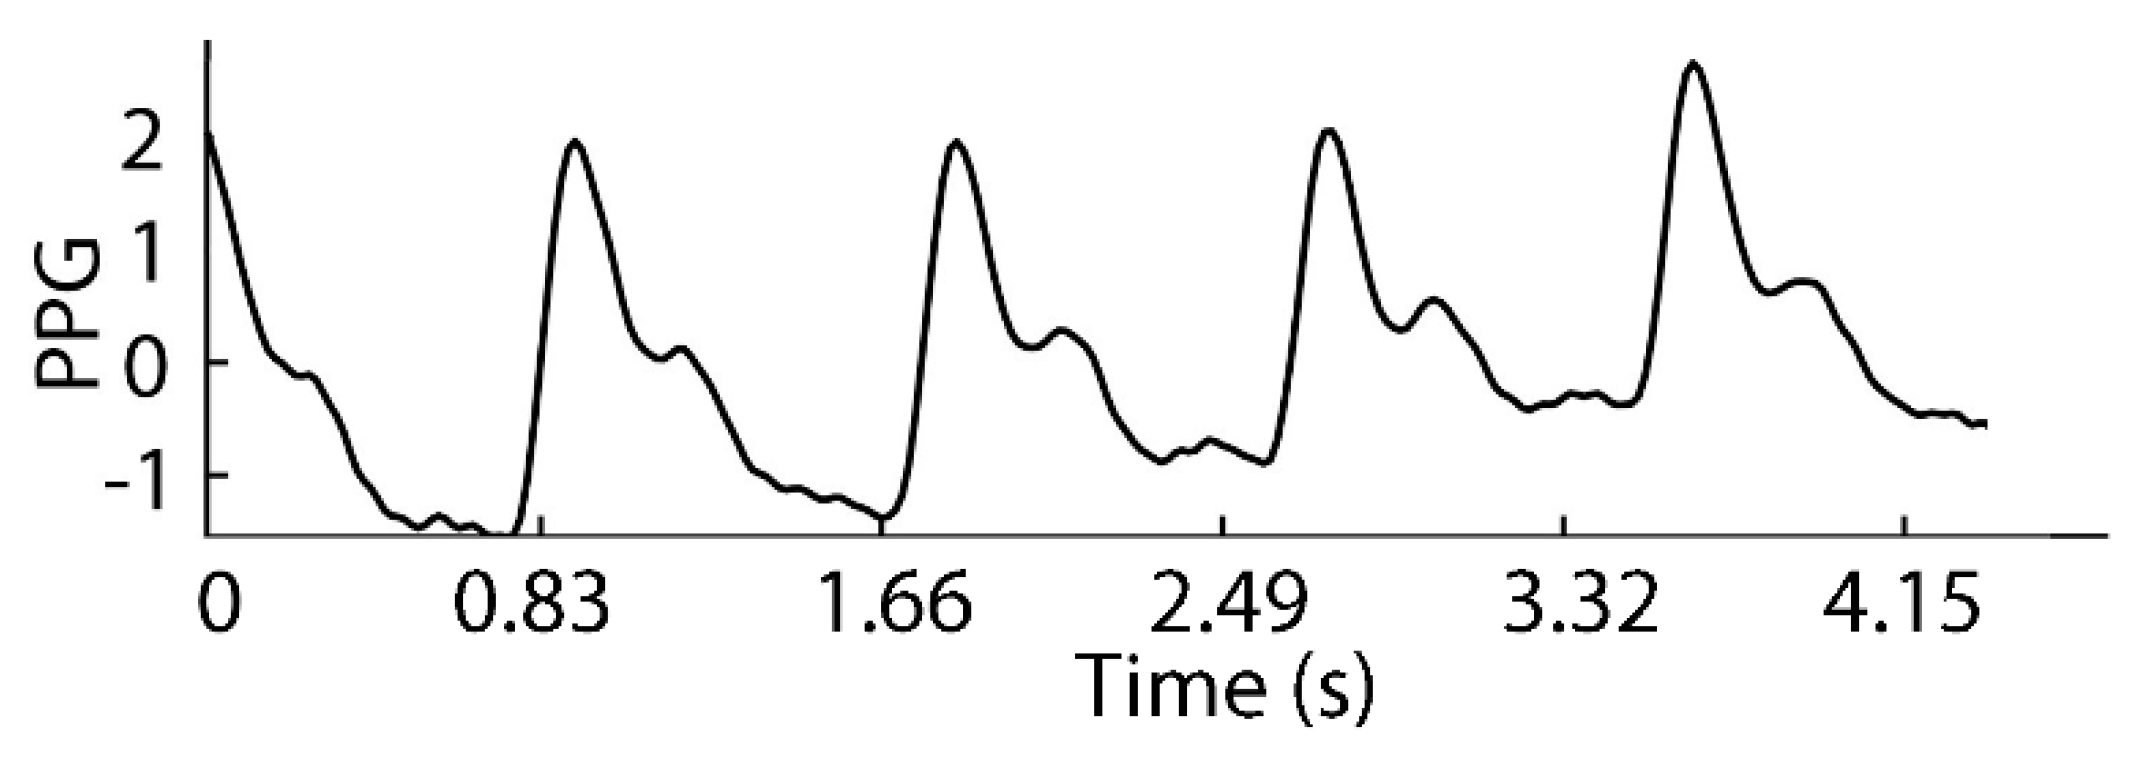
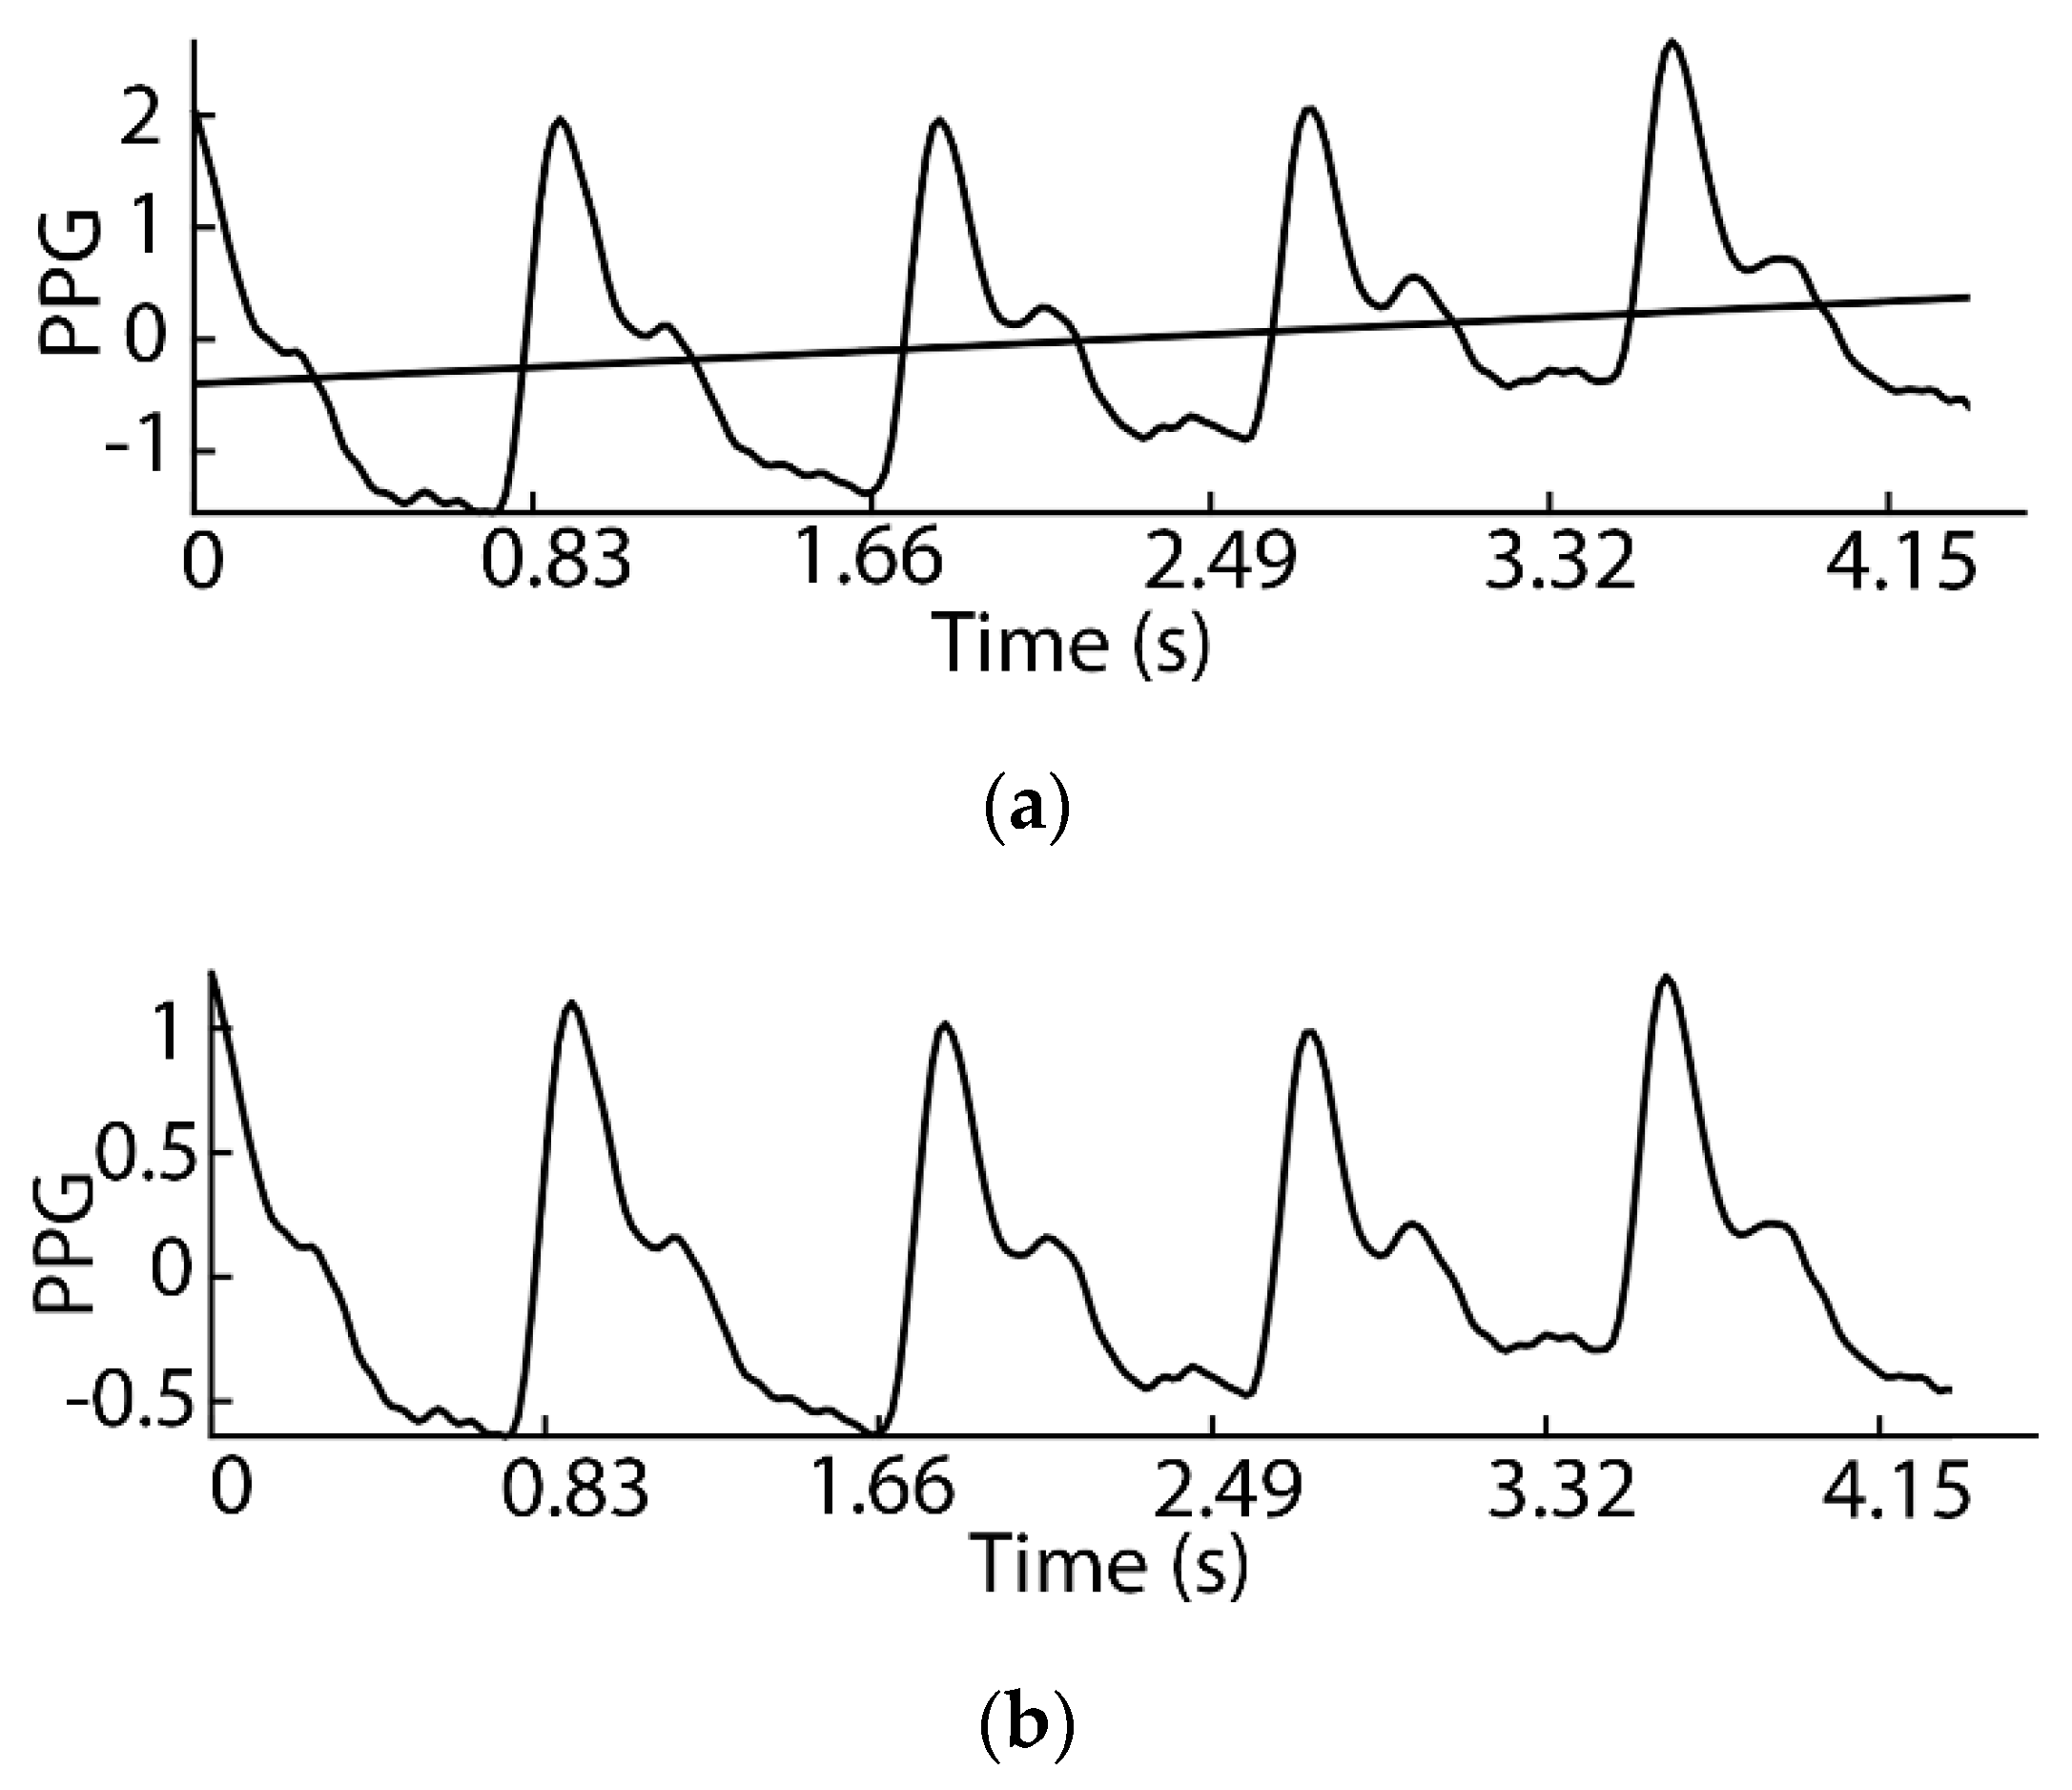
2.2. Signal Preprocessing

SBP is estimated in two steps. The initial step includes the calculation of systolic blood pressure values as an average value obtained from 15 pulse waves. Later medians of these values are averaged once more (see the “Systolic blood pressure estimation algorithm” subsection and Equation (6) for details) to get the final result. Averaging is common practice to reduce variability. In order to get a mean value, which reflects the real value with a probability higher than p = 0.5, more than 10 values should be taken for averaging. The time period of the PPG record, which contains at least 15 pulse waves, is called the blood pressure estimation window (BPEW) (see Figure 4). The time span for BPEW is based on the minimum possible heart rate of elderly patients with bradycardia, which can fall to 40 bpm. In such a case, one pulse wave fits in 60/40 = 1.5 s (the time interval between two heartbeats). Therefore, BPEW should not be less than 15 × 1.5 ≈ 23 s (we used a 25 s BPEW for better results). The BPEW duration remains constant during the whole PPG recording time.
The signal being recorded is influenced by various noise sources: Breath, PPG sensor motion noise, high voltage lines’ inducted noise, low amplitude PPG signal, and premature ventricular contraction, as reported in Reference [33]. This can lead to a situation where BPEW does not contain 15 pulse waves suitable for processing. In such a case, BPEW is dropped, and the next 25 s BPEW is taken for further calculations (non-overlapping moving window principle). This is completely acceptable for soft real-time self-measured blood pressure (SMBP) monitoring, since the final SBP value is estimated from several BPEW (in our case, one SBP value is obtained in a 5-min period, as explained later). Additionally, to reduce such cases, PPG sensor motion noise is eliminated using common signal processing methods.
The width of the signal preprocessing window (SPW) is chosen according to the breath period, because it is the lowest-frequency noise in the signal. The inhalation phase in the PPG signal gives a rising/falling trend. Normally, in a calm state, a person performs around 10–20 breath cycles per minute, while inspiration takes approximately 5 s, as discussed in References [34,35,36,37]. Therefore, SPW = 5 s is chosen for signal preprocessing in BPEW (see Figure 4).
The following steps are performed for PPG signal preprocessing:
(1) Normalization: The PPG signal in SPW is replaced by a signal with a zero mean and variability equal to one.
(2) Filtering: Although the power of the high-frequency harmonics is small compared to the harmonics in low and mid-frequency bands (see Figure 5b), their influence on the form of the signal in the time domain is still obvious (see Figure 5a).
Various algorithms are proposed for noise filtering: Empirical mode decomposition [38], discrete wavelet transform [39,40,41], infinite impulse response (IIR) [10] and fast Fourier transform [26]. The FFT technique is chosen in this work, the output of which is shown in Figure 6.
The largest part of the energy of the PPG signal is accumulated in the frequency band up to 16 Hz. In this frequency band, the average frequencies describe the pulse wave structure, while the high frequencies define the details of the pulse waveform, as discussed in Reference [42]. The FFT filter is implemented by zeroing the frequency band above 16 Hz according to Reference [43]. The filtered signal (see Figure 7) is obtained by reverse FFT; then, the signal is normalized, making its average equal zero.
(3) Eliminating the rising/falling trend of the signal: As mentioned before, the inspiration phase takes approximately 5 s, and therefore SPW contains PPG, which is influenced by breathing (see Figure 4), resulting in a rising/falling signal trend. To eliminate this linear trend in SPW, the least squares method is used to find the straight line (see Figure 8a) of this trend. Then, each PPG signal value is decreased by the corresponding value of this straight line, resulting in a detrended PPG signal, as depicted in Figure 8b.
(4) Pulse wave peak point detection is performed using the adaptive peak detection window (PDW) method [44], which starts by setting PDW as the minimum heart contraction period. Then, PDW is divided into three parts, and according to the proposed algorithm, the heart rate is calculated. PDW is increased, divided into three parts and the heart rate is calculated again. This process is repeated until the PDW width reaches its maximum possible period. The histogram is constructed from the obtained heart rates, and the period corresponding to the most commonly found heart rate is used as optimal PDW.
Such an algorithm sometimes gives incorrect results when more than two pulse waves fall into PDW; for example, if a heart rate is 200 bpm and PDW width reaches 1.5 s (40 bpm), then 5 pulse waves will fall into the PDW. Besides, if the heart rate is low, this algorithm is not efficient in terms of calculation time.
We modified this method by changing the PDW definition rules. These rules are applied for each SPW separately, as defined in Algorithm 1.
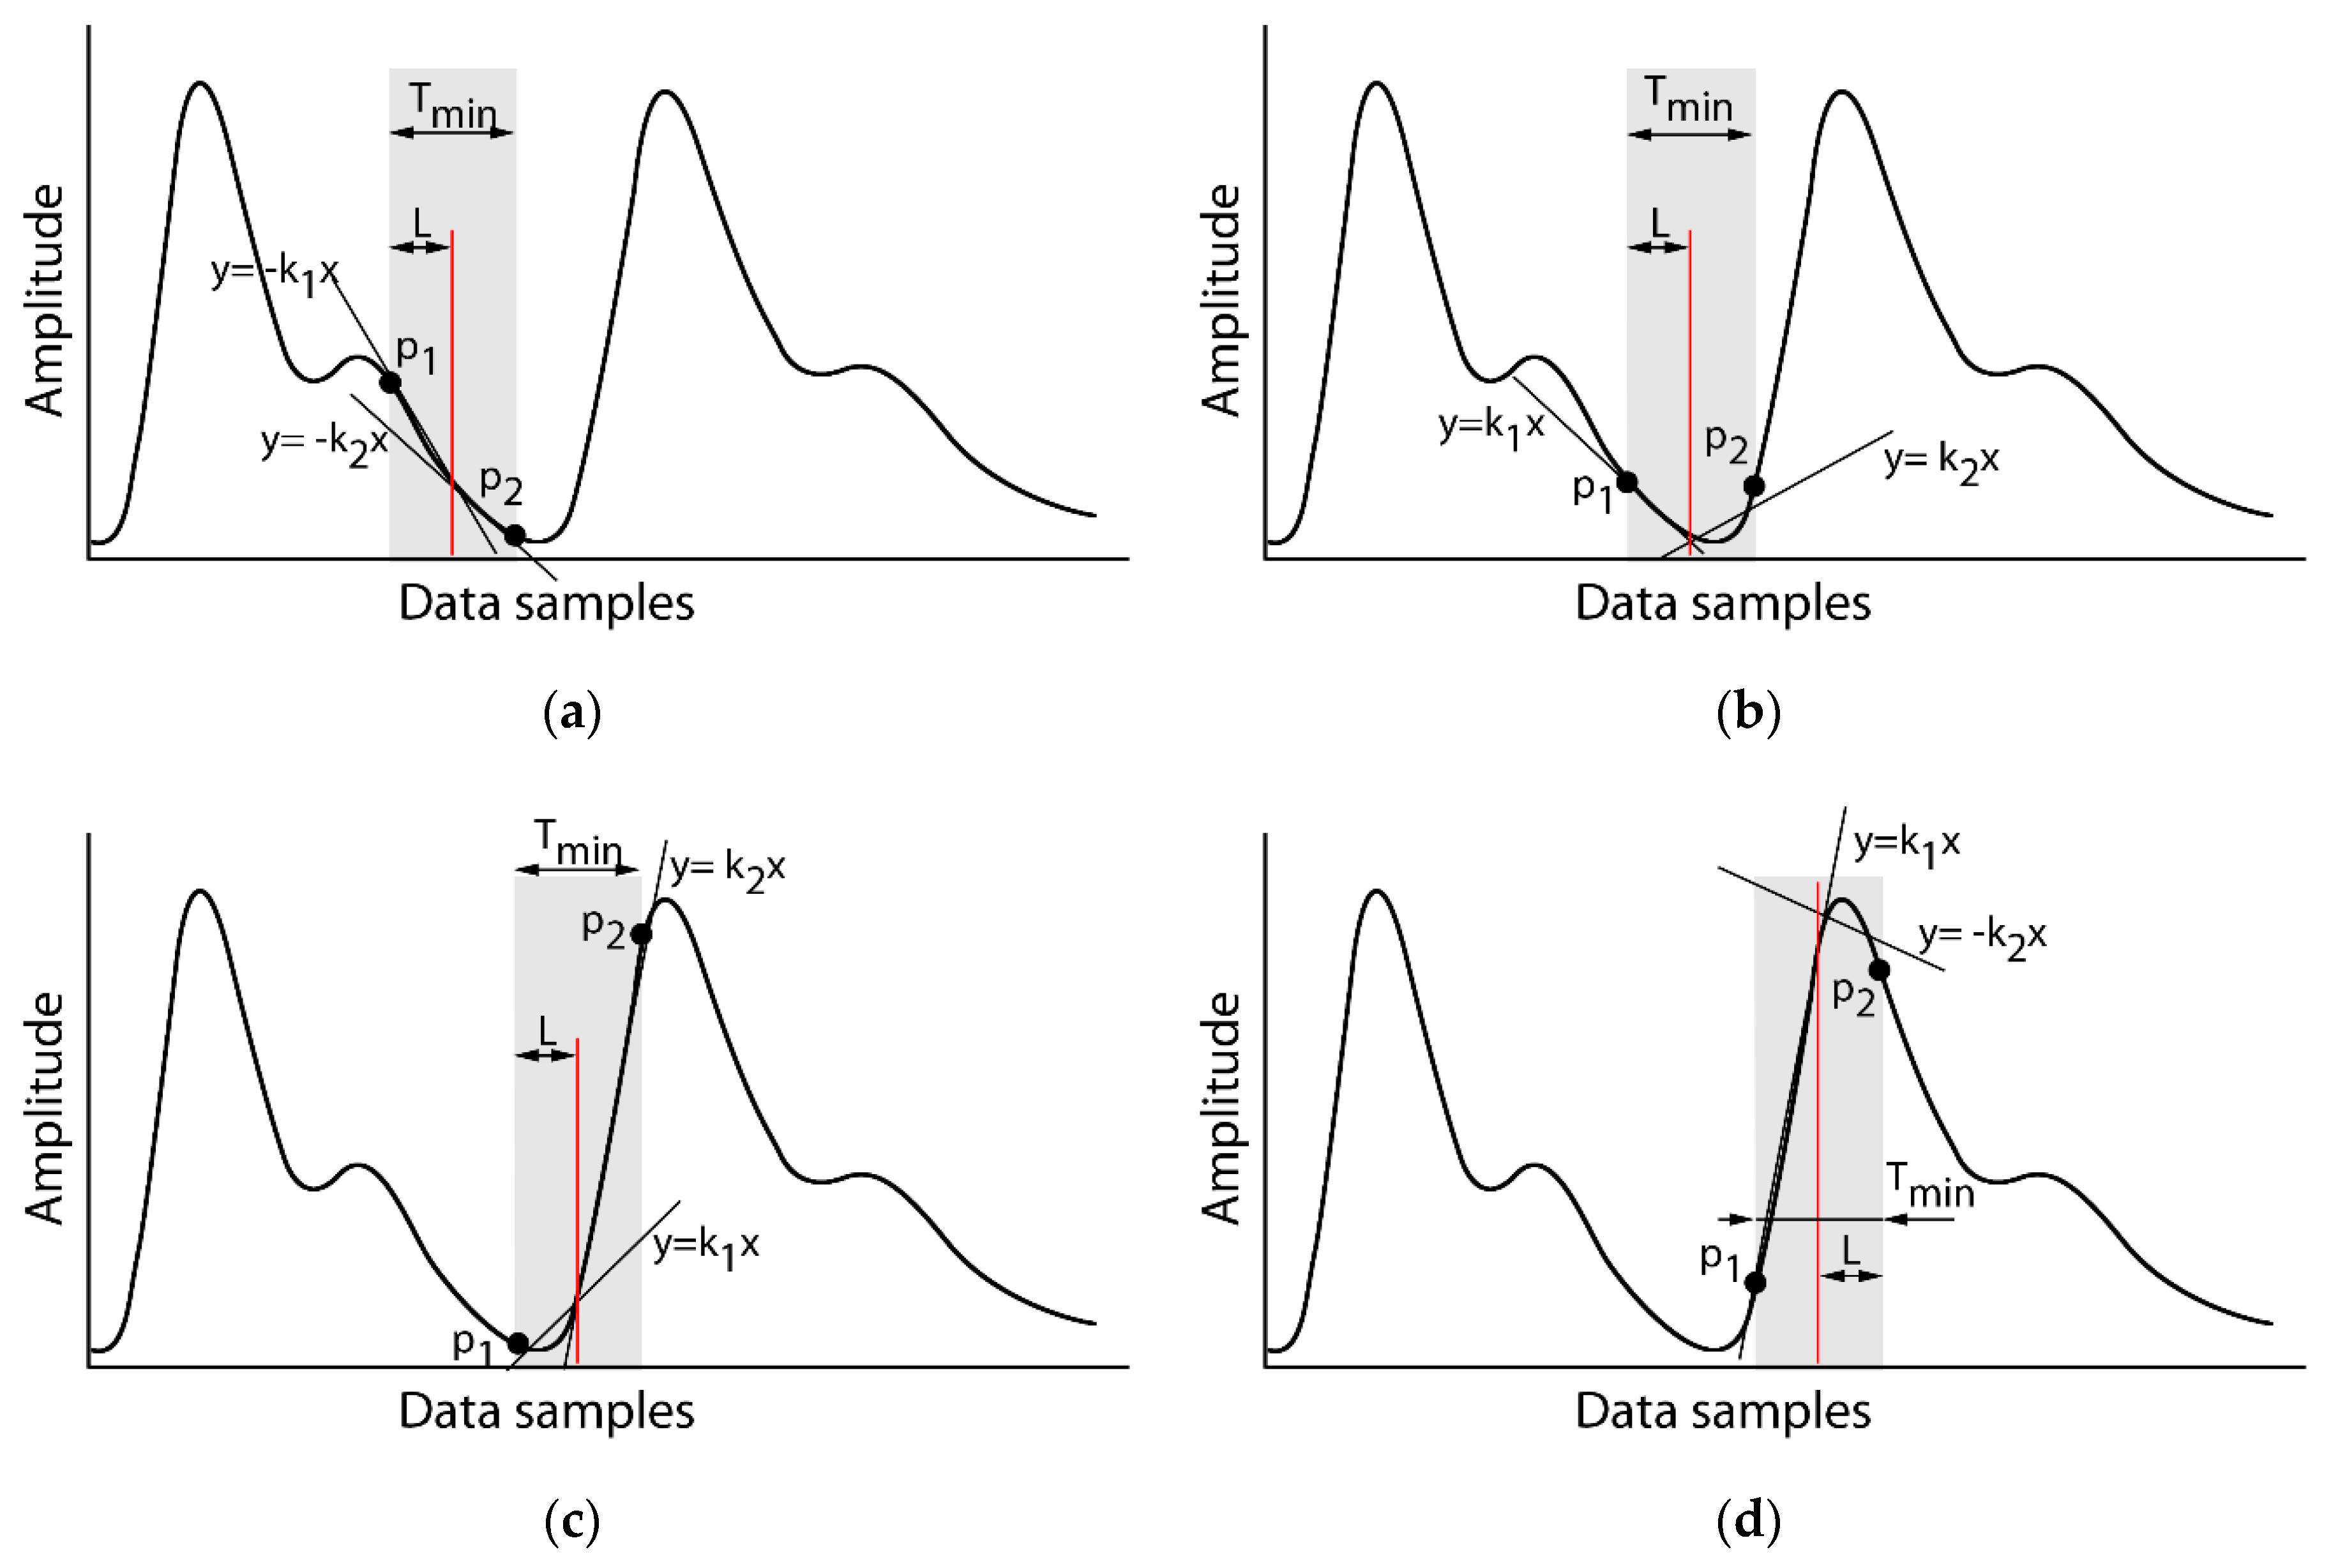
Algorithm 1. PDW size calculation
1procedurepdw (p1, p2) ∇A: Input Signal
          ∇ mHR: min Heart Rate
2Tmin = (1/mHR)*1/2; L = round(Tmin/Fs);
3i = 1; N = length(A)/L;
4while (i+1)*L <= N do
5[k1, c] = linaprox(A(i*L-L+1: i*L))
6[k2, c] = linaprox(A(i*L:(i+1)*L))
7  if k1 > 0 and k2 < 0
8   then p1 =i*L-L+1; p2 = (i+1)*L;
9    goto 16 line
10  end
11  if (k1 < 0 and k2 < 0) or (k1 < 0 and k2 > 0)
12   then i = i + 1; goto 15 line
13  if (k1 > 0 and k2 > 0)
14   then  L = L + 0.1*L;
15end /*While*/
16end
The first part of PDW can contain a pulse wave falling edge (or part of it), while the rising edge of the wave appears at the end of PDW. In such a case, the pulse wave peak will not fall into PDW. To detect the beginning of PDW (p1) and its end (p2), PDW = 2L signal values are taken from SPW, where L is number of values fitting in half of the minimum period Tmin.
The least squares method is used to derive straight lines through A(p1:L) and A(L:p2). If the slopes of these lines are negative (k1 < 0, k2 < 0), then the values belong to the falling edge of the pulse wave (see Figure 9a), and PDW is shifted to the right by the L values. If the slope coefficients are positive (k1 > 0, k2 > 0), then the values belong mostly to the rising edge, but they do not contain peak values (see Figure 9c). In this case, L is increased by 1/10 and new slope coefficients are found.
When k1 < 0 and k2 > 0 values belong to the rising and falling edges of the pulse wave, but do not contain a peak (see Figure 9b), the PDW is shifted to the right by the L values. Only when k1 > 0 and k2 < 0 does the PDW contain a peak value (see Figure 9d).
(5) Pulse wave valley point detection is performed using the algorithm proposed in Reference [45].
(6) Base line correction: This step is performed when the starting points of pulse waves in BPEW are found. When a PPG signal is filtered, the unwanted harmonics are eliminated, while base line corrections give a signal whose values vary about a constant value. However, the line connecting the starting points of each pulse waveform a piecewise linear curve. This means that the amplitude values of the pulse wave’s starting and ending points are different. For this reason, incorrect start points, peak points, and rising edge slopes of the pulse wave can be found; thus, base line correction is implemented as explained in Reference [46] (see Figure 10a).
(7) Peak line correction: This correction is performed when pulse wave peaks are found in BPEW. The form of the DPW rising edge trajectory (not the amplitude) carries information about systolic blood pressure as explained in Reference [29]. Therefore, it is important to ensure uniform time-amplitude proportions of all DPW rising edges. When the DPW sampling rate is 60 Hz, the variability of duration of the rising edge is low, as reported in Reference [47], which results in a constant value of abscissa (time) and does not affect the time–amplitude proportions. The motion of the arms or body of the patient (with sensors put on them) results in an uneven amplitude fluctuation during PPG registration and distorts the rising edge trajectory time–amplitude proportions. Therefore, the peak line (connecting pulse wave peak points) correction helps to eliminate random amplitude changes (see Figure 10b), without influencing the form of the pulse wave.
This correction is done for each pulse wave (when base line correction is performed, and all pulse wave starting point values become zero) by dividing its values by maximum value, as explained in Reference [48].

2.3. Systolic Blood Pressure Estimation Algorithm

Systolic blood pressure is estimated using Equation (5). Coefficient K is found for each subject experimentally from one 5 min duration training period and later is used for all testing periods. Coefficient K is determined using Equation (5) in such a way that the difference between estimated (from PPG record) and measured (using a conventional cuff-based meter) blood pressure values would be minimal. SBPei (0 ≤ i ≤ length (BPEW), i—value number) is estimated for each pulse wave rising edge in BPEW as described in Figure 11.
Since estimated values are very scattered—i.e., standard deviation SDSBPei = ±10.6—SBPei values in BPEW are replaced by their median values SBPmdj (see Figure 12).
When blood pressure is measured a few times per day at home or in the hospital, it is assumed that it remains constant between measurements.
S B P e = 1 M j = 1 M S B P m d j .
Therefore, in this work, for a 5-min PPG period, we calculate one SBPe value using Equation (6), which is equal to the mean of the medians (see Figure 13):

2.4. Experiment Setup
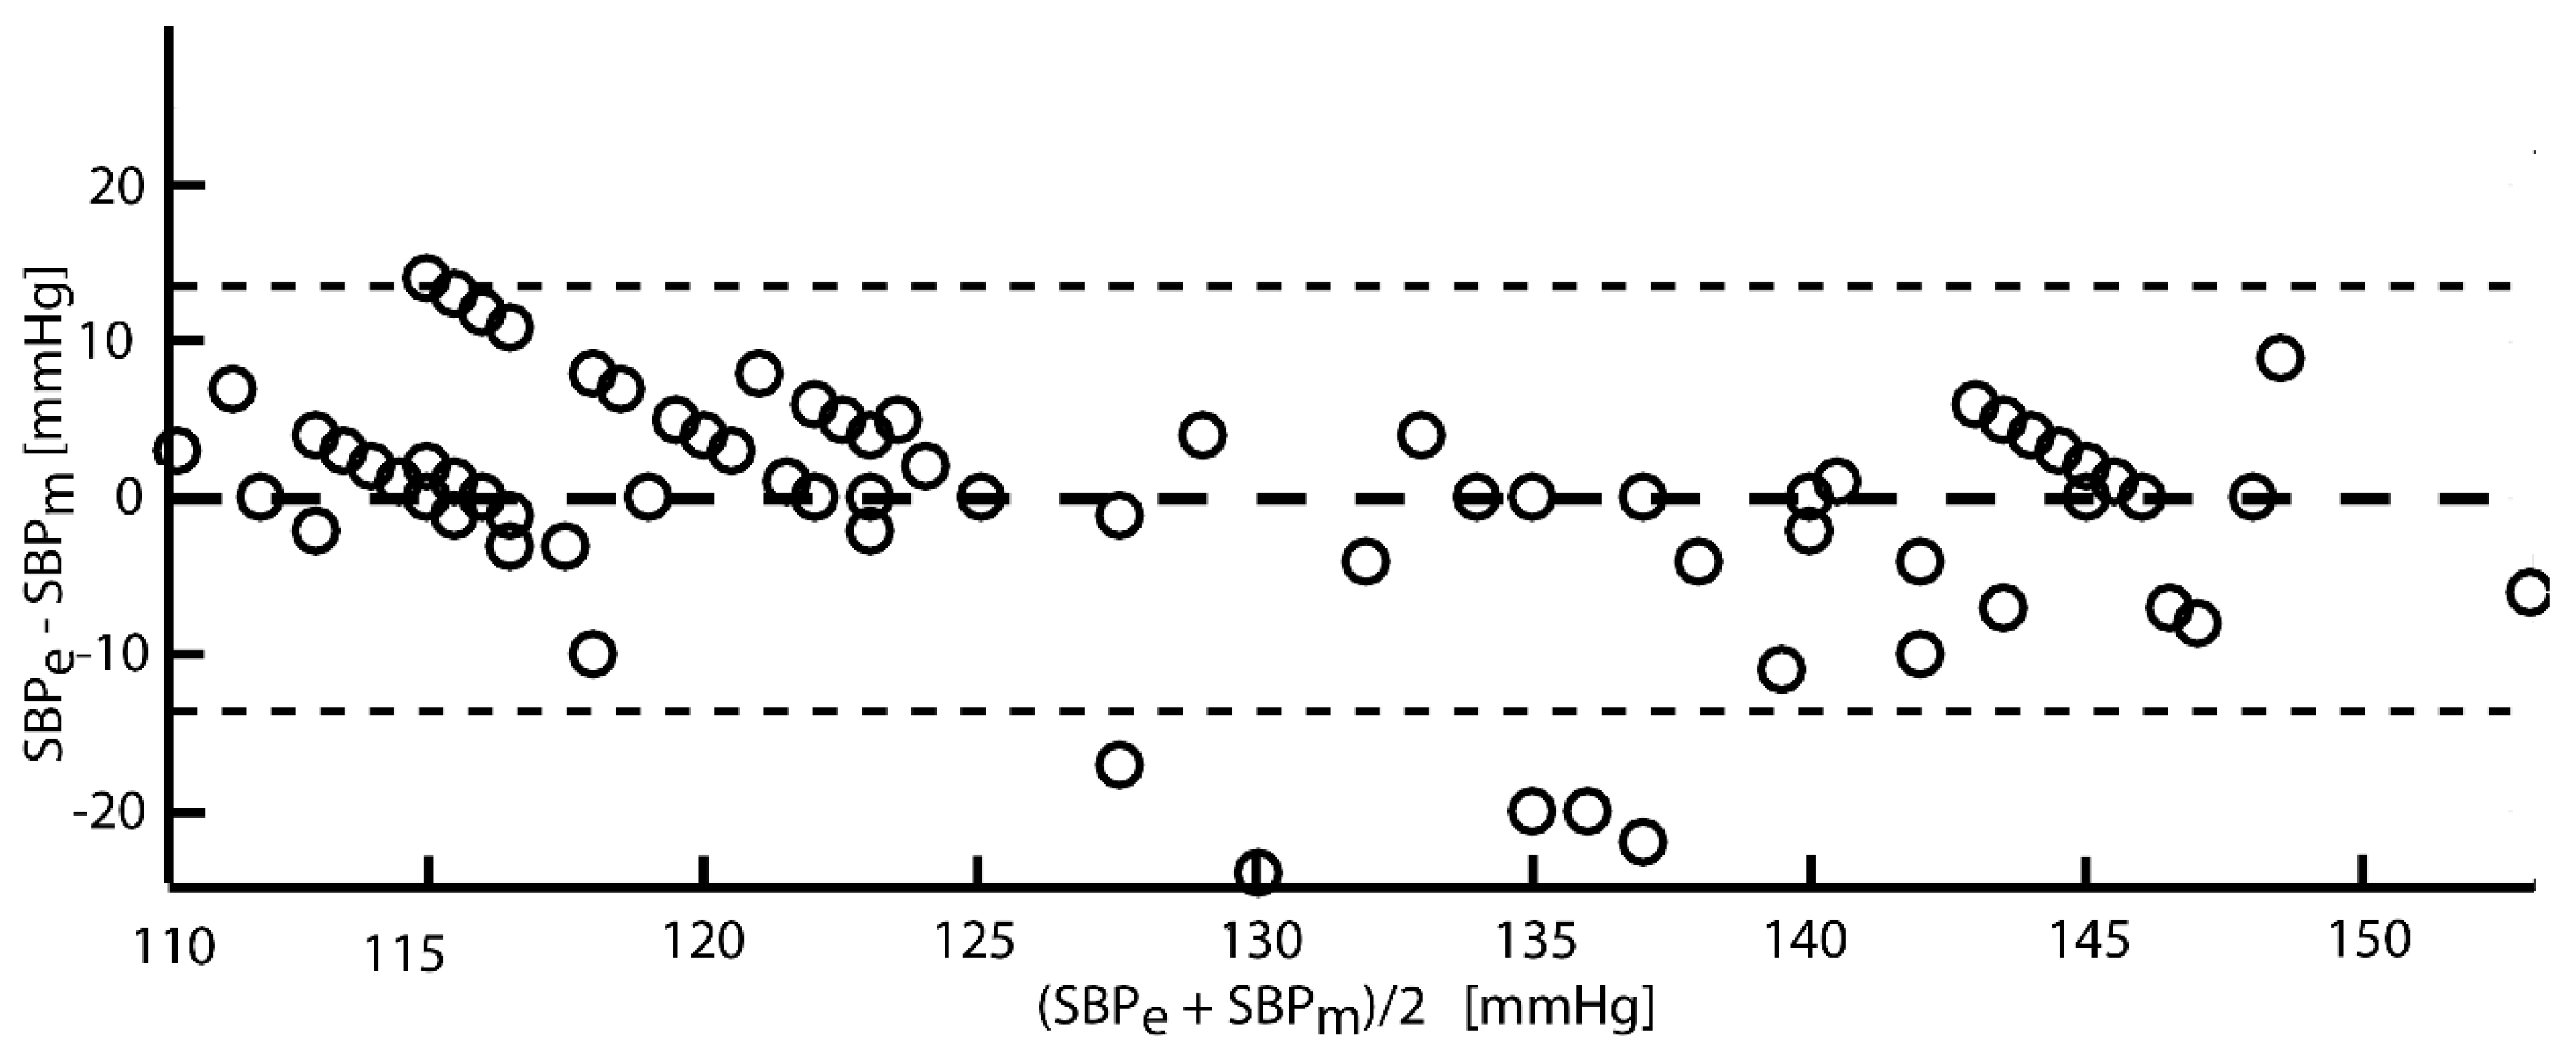
A commercial blood pressure meter with a cuff (OMRON M1) was used as the gold standard in this work to measure SBP on the left brachial artery. The PPG signal was collected using the CMS50FW Pulse Oximeter without automatic gain control (AGC) function. The PPG signal sampling rate was 60 Hz and the quantization resolution was 8 bits. The optical sensor with both red (wavelength 660 nm) and infrared (wavelength 880 nm) light sources were used. The collected signal was sent via Bluetooth to a PC, where SBP estimations were performed.
This study was performed at the Clinical Department of Geriatrics of the Lithuanian University of Health Sciences. Nineteen subjects took part in the research (12 women and 7 men), including 6 persons aged 70–77, 11 persons aged 82–85, and 2 persons aged 88 years old with body mass index BMI = 22.4 ± 1.3. All subjects, but two, used blood pressure-regulating drugs. Five subjects had ischemic heart disease.
SBP measurements and PPG records were done for each subject 5 days in a row (one per day), at any convenient time for the subject. The subjects sat with their left hand placed on a support and a PPG sensor placed on their left-hand finger, as shown in Figure 14a. The PPG signal recording was always done first using the pulse oximeter. This procedure took 5 min. The SBP measurements were done immediately after that, using the blood pressure meter, as shown in Figure 14b. Standard cuff type for an arm circumference ranging from 220 to 320 mm was used. Since measurements were performed in a calm state, the records are without movement artefacts.
The experimental protocol of the study was approved by the Kaunas Regional Biomedical Research Ethics Committee (permission No. BE-2-53), allowing the use of a pulse oximeter CMS50FW at the Clinical Department of Geriatrics. According to the Association for the Advancement of Medical Instrumentation (AAMI) protocol [49], the blood pressure values were measured by experienced medical staff.
All subjects were informed about the performed research and their written consent was obtained.

3. Results

Nineteen subjects took part in the research. For each of them, 5 SBP values were measured using the oscillometric technique, and 5 SBP values were estimated using the proposed method. Therefore, the measured values vector x and estimated values vector y contains N = 95 values.
The difference between measured and estimated SBP was calculated for each examination, including the mean difference (MD), the standard deviation (SD), and the relative error (er), in order to evaluate the performance of the proposed method (Table 1):
A Pearson’s correlation value shows that the estimated and measured SBP values correlated well (r = 0.86, p < 0.001). This statistically significant tight correlation shows that the proposed method is suitable for continuous systolic blood pressure estimation using PPG recording devices with a low sampling rate (up to 60 Hz) and low resolution (up to 8 bits).
The measured MD and SD values are within the requirements of the AAMI standard (MD = ±5 mmHg and SD = ±8 mmHg) [49], since the mean difference MD = −0.043 and standard deviation SD = 6.79, though the study does not comply with the AAMI protocol, which requires more subjects with different blood pressures and auscultatory technique as a reference method to evaluate the accuracy of the proposed method.
The Bland–Altman plot, as discussed in Reference [50], is commonly used for the comparison of clinical results obtained by using different methods. In Figure 15, we present the agreements of the measured and estimated blood pressure values. The horizontal part of the plot corresponds to the mean values of the measured and estimated SBP, while the vertical axis shows the difference between these values. The mean difference of all the subjects is calculated and represented as a horizontal line, and this horizontal line means better results if it is closer to zero.
The comparison of estimated and measured values in Figure 15 shows that the error bias, −0.043 mmHg between the gold standard and measured SBP values, is close to zero, while the values of the SD of bias 6.79 mmHg for SBP are very similar to the results of other authors. The systematic trends in Figure 15 show, that there are some errors caused by the method itself, most likely due to rounding procedures.
Table 2 shows the comparison of the proposed SBP estimation method with other authors’ results:
As can be seen in Table 2, the proposed SBP estimation method gives similar or better results even when the sampling rate is almost two times lower.

4. Discussion

4.1. Advantage

The original PPG based method for the continuous estimation of systolic blood pressure using ADC with a 60 Hz sampling rate and 8-bit resolution is proposed in this paper. The main advantage of the method is its high accuracy, which is achieved using lower sampling rates and less capable hardware than other methods.
Since the resolution of SBP estimation is not linear (because the dependency between DPW and SBP is not linear, as explained in “Systolic Blood Pressure Estimation Model” section), the mean difference MD and standard deviation SD is used to evaluate the accuracy of the proposed method. The mean difference MD = −0.043 and standard deviation SD = 6.79 matches, or even improve, the results of the known methods (see Table 2). Though the proposed method does not meet the accuracy requirements of the AAMI standard (due to protocol violations), the MD and SD values are within the requirements of this standard (MD = ±5 mmHg and SD = ±8 mmHg). This shows the great potential of the method and additional experiments are planned in the future work to evaluate full compliance with the AAMI standard.
There are many authors performing state-of-the-art research activities in the field of continuous and cuffless blood pressure monitoring. They admit that continuous blood pressure monitoring is a very important activity and propose various non-invasive PPG based methods to solve this problem. However, the main attention is given to the verification of the accuracy of the proposed methods and comparison with related works, while very little or no attention is paid to the possibilities to implement these methods in wearable systems [10,13,15,19,20,22,25]. There are known wearable (portable) blood pressure measurement systems based on smartphones [26,27], allowing to make measurements at any selected moment. But it is not continuous monitoring, since the idea of the continuous monitoring of physiological parameters (including blood pressure) is that the user does not need to pay any attention to registering those parameters.
Therefore, the main distinction of the proposed method in comparison with other state-of-the-art approaches is that this method can be successfully applied for the implementation of a real life wearable continuous SBP monitoring systems. The method is successfully tested using a prototype system based on the widely available and quite cheap CMS50FW Pulse Oximeter, which is capable of transferring PPG values via Bluetooth to a mobile phone or any other remote device. In order to reduce the number and complexity of calculations (and energy consumption), the proposed method analyzes the rising edge of the PPG pulse wave only. The rising edge is less than 1/3 of the duration of the PPG pulse wave; therefore, this significantly reduces the calculations compared to the methods which process the entire PPG pulse wave. This is relevant for the development of wearable monitoring systems which have very limited processing and energy resources.

4.2. Limitation

The proposed method allows us to estimate systolic blood pressure only, and this can be done when subjects are in a calm state. Ideally, wearable devices should allow us to record systolic and diastolic blood pressure in different situations (sitting, walking, driving, etc.) without distracting from daily activities. In order to make such systems, the proposed method should be upgraded by adding an additional processing stage, which would allow us to eliminate movement-induced noise, as well as noise caused by a raised or lowered arm.

5. Conclusions

The possibility of estimating systolic blood pressure using a PPG collecting device with a low sampling rate and resolution was investigated in this paper. We believe that such a wearable estimation system will enable the on-demand home monitoring of systolic blood pressure as an important vital sign, resulting in an overall reduction in cardiovascular morbidity and mortality.
Our results show that PPG recording devices with a low sampling rate (60 Hz) and low resolution (8-bit) ADC can be successfully applied for systolic blood pressure estimation using the proposed systolic blood pressure estimation method based on the pulse wave rising edge steepness.

Author Contributions

Conceptualization, R.G.; Formal analysis, R.G.; Investigation, R.G., V.L. and G.D.; Methodology, R.G. and A.L.; Project administration, E.K. and A.J.; Resources, G.D. and A.J.; Supervision, E.K. and V.L.; Validation, A.L.; Writing—original draft, A.L. and A.J.

Funding

This research was funded by the Research Council of Lithuania, grant number SEN-06/2016.

Conflicts of Interest

The authors declare no conflict of interest.

References

  1. Jacob, V.; Chattopadhyay, S.K.; Proia, K.K.; Hopkins, D.P.; Reynolds, J.; Thota, A.B.; Jones, C.D.; Lackland, D.T.; Rask, K.J.; Pronk, N.P.; et al. Economics of self-measured blood pressure monitoring: A community guide systematic review. Am. J. Prev. Med. 2017, 53, e105–e113. [Google Scholar] [CrossRef] [PubMed]
  2. Sankar, J.; Mahesh, N.; Sharma, P.; Sankar, L.; Balasubramanian, A. Role of ambulatory blood pressure monitoring in chronic hypertensive patients on antihypertensive therapy-a cross-sectional study. J. Clin. Diagn. Res. 2018, 12, OC01–OC04. [Google Scholar] [CrossRef]
  3. Liu, Z.; Zhao, Y.; Lu, F.; Zhang, H.; Diao, Y. Day-by-day variability in self-measured blood pressure at home: Effects on carotid artery atherosclerosis, brachial flow-mediated dilation, and endothelin-1 in normotensive and mild–moderate hypertensive individuals. Blood Press. Monit. 2013, 18, 316–325. [Google Scholar] [CrossRef]
  4. Toriumi, S.; Hoshide, S.; Nagai, M.; Kario, K. Day-to-day blood pressure variability as a phenotype in a high-risk patient: Letters to the Editor. Geriatr. Gerontol. Int. 2014, 14, 1005–1006. [Google Scholar] [CrossRef]
  5. Pan, J.; Zhang, Y. Improved blood pressure estimation using photoplethysmography based on ensemble method. In Proceedings of the 2017 14th International Symposium on Pervasive Systems, Algorithms and Networks & 2017 11th International Conference on Frontier of Computer Science and Technology & 2017 Third International Symposium of Creative Computing (ISPAN-FCST-ISCC), Exeter, UK, 21–23 June 2017; pp. 105–111. [Google Scholar]
  6. Lewington, S.L.; Clarke, R.; Qizilbash, N.; Peto, R.; Collins, R. Age-specific relevance of usual blood pressure to vascular mortality: A meta-analysis of individual data for one million adults in 61 prospective studies. Lancet 2002, 360, 1903–1913. [Google Scholar] [PubMed]
  7. Asia Pacific Cohort Studies Collaboration. Blood pressure indices and cardiovascular disease in the asia pacific region: A pooled analysis. Hypertension 2003, 42, 69–75. [Google Scholar] [CrossRef]
  8. Lawes, C.M.; Hoorn, S.V.; Rodgers, A. Global burden of blood-pressure-related disease, 2001. Lancet 2008, 371, 1513–1518. [Google Scholar] [CrossRef]
  9. Bose, S.S.N.; Kandaswamy, A. Sparse representation of photoplethysmogram using K-SVD for cuffless estimation of arterial blood pressure. In Proceedings of the 2017 4th International Conference on Advanced Computing and Communication Systems (ICACCS), Coimbatore, India, 6–7 January 2017; pp. 1–5. [Google Scholar]
  10. Mousavi, S.S.; Firouzmand, M.; Charmi, M.; Hemmati, M.; Moghadam, M.; Ghorbani, Y. Blood pressure estimation from appropriate and inappropriate PPG signals using A whole-based method. Biomed. Signal Process. Control 2019, 47, 196–206. [Google Scholar] [CrossRef]
  11. Taylor, B.C.; Wilt, T.J.; Welch, H.G. Impact of diastolic and systolic blood pressure on mortality: Implications for the definition of “normal”. J. Gen. Intern. Med. 2011, 26, 685–690. [Google Scholar] [CrossRef] [PubMed]
  12. Rothwell, P.M.; Howard, S.C.; Dolan, E.; O’Brien, E.; Dobson, J.E.; Dahlöf, B.; Sever, P.S.; Poulter, N.R. Prognostic significance of visit-to-visit variability, maximum systolic blood pressure, and episodic hypertension. Lancet 2010, 375, 895–905. [Google Scholar] [CrossRef]
  13. Lin, W.-H.; Wang, H.; Samuel, O.W.; Li, G. Using a new PPG indicator to increase the accuracy of PTT-based continuous cuffless blood pressure estimation. In Proceedings of the 2017 39th Annual International Conference of the IEEE Engineering in Medicine and Biology Society (EMBC), Seogwipo, Korea, 11–15 July 2017; pp. 738–741. [Google Scholar]
  14. Khan, N.; Mikael Eklund, J. A Highly integrated computing platform for continuous, non-invasive bp estimation. In Proceedings of the 2018 IEEE Canadian Conference on Electrical & Computer Engineering (CCECE), Quebec City, QC, Canada, 13–16 May 2018; pp. 1–5. [Google Scholar]
  15. Ding, X.-R.; Zhang, Y.-T.; Liu, J.; Dai, W.-X.; Tsang, H.K. Continuous cuffless blood pressure estimation using pulse transit time and photoplethysmogram intensity ratio. IEEE Trans. Biomed. Eng. 2016, 63, 964–972. [Google Scholar] [CrossRef]
  16. Zhang, J.M.; Wei, P.F.; Li, Y. A LabVIEW based measure system for pulse wave transit time. In Proceedings of the 2008 International Conference on Technology and Applications in Biomedicine, Shenzhen, China, 18 July 2008; pp. 477–480. [Google Scholar]
  17. Liu, S.-H.; Cheng, D.-C.; Su, C.-H. A cuffless blood pressure measurement based on the impedance plethysmography technique. Sensors 2017, 17, 1176. [Google Scholar] [CrossRef]
  18. Liu, H.; Ivanov, K.; Wang, Y.; Wang, L. Toward a smartphone application for estimation of pulse transit time. Sensors 2015, 15, 27303–27321. [Google Scholar] [CrossRef]
  19. Khalid, S.G.; Zhang, J.; Chen, F.; Zheng, D. Blood pressure estimation using photoplethysmography only: comparison between different machine learning approaches. J. Healthc. Eng. 2018, 2018, 1–13. [Google Scholar] [CrossRef]
  20. Choudhury, A.D.; Banerjee, R.; Sinha, A.; Kundu, S. Estimating blood pressure using Windkessel model on photoplethysmogram. In Proceedings of the 2014 36th Annual International Conference of the IEEE Engineering in Medicine and Biology Society, Chicago, IL, USA, 26–30 August 2014; pp. 4567–4570. [Google Scholar]
  21. Xing, X.; Sun, M. Optical blood pressure estimation with photoplethysmography and FFT-based neural networks. Biomed. Opt. Express 2016, 7, 3007–3020. [Google Scholar] [CrossRef] [Green Version]
  22. Kurylyak, Y.; Barbe, K.; Lamonaca, F.; Grimaldi, D.; Van Moer, W. Photoplethysmogram-based Blood pressure evaluation using Kalman filtering and Neural Networks. In Proceedings of the 2013 IEEE International Symposium on Medical Measurements and Applications (MeMeA), Gatineau, QC, Canada, 4–5 May 2013; pp. 170–174. [Google Scholar]
  23. Kao, Y.-H.; Chao, P.C.-P.; Tu, T.-Y.; Chiang, K.-Y.; Wey, C.-L. A new cuffless optical sensor for blood pressure measuring with self-adaptive signal processing. In Proceedings of the 2016 IEEE SENSORS, Orlando, FL, USA, 30 October–3 November 2016; pp. 1–3. [Google Scholar]
  24. Cohen, Z.; Haxha, S. Optical-based sensor prototype for continuous monitoring of the blood pressure. IEEE Sens. J. 2017, 17, 4258–4268. [Google Scholar] [CrossRef]
  25. Yan, Y.S.; Zhang, Y.T. Noninvasive estimation of blood pressure using photoplethysmographic signals in the period domain. In Proceedings of the 2005 IEEE Engineering in Medicine and Biology 27th Annual Conference, Shanghai, China, 17–18 January 2006; pp. 3583–3584. [Google Scholar]
  26. Gaurav, A.; Maheedhar, M.; Tiwari, V.N.; Narayanan, R. Cuff-less PPG based continuous blood pressure monitoring—A smartphone based approach. In Proceedings of the 2016 38th Annual International Conference of the IEEE Engineering in Medicine and Biology Society (EMBC), Orlando, FL, USA, 16–20 August 2016; pp. 607–610. [Google Scholar]
  27. Matsumura, K.; Rolfe, P.; Toda, S.; Yamakoshi, T. Cuffless blood pressure estimation using only a smartphone. Sci. Rep. 2018, 8, 7298. [Google Scholar] [CrossRef]
  28. Tobola, A.; Streit, F.J.; Espig, C.; Korpok, O.; Sauter, C.; Lang, N.; Schmitz, B.; Hofmann, C.; Struck, M.; Weigand, C.; et al. Sampling rate impact on energy consumption of biomedical signal processing systems. In Proceedings of the 2015 IEEE 12th International Conference on Wearable and Implantable Body Sensor Networks (BSN), Cambridge, MA, USA, 9–12 June 2015; pp. 1–6. [Google Scholar]
  29. Gircys, R.; Liutkevicius, A.; Vrubliauskas, A.; Kazanavicius, E. Blood pressure estimation accoording to photoplethysmographic signal steepness. Inf. Technol. Control 2015, 44, 443–450. [Google Scholar] [CrossRef]
  30. Harada, A.; Okada, T.; Niki, K.; Chang, D.; Sugawara, M. On-line noninvasive one-point measurements of pulse wave velocity. Heart Vessel. 2002, 17, 61–68. [Google Scholar] [CrossRef] [PubMed]
  31. Diourté, B.; Siché, J.-P.; Comparat, V.; Baguet, J.-P.; Mallion, J.-M. Study of arterial blood pressure by a Windkessel-type model: Influence of arterial functional properties. Comput. Methods Programs Biomed. 1999, 60, 11–22. [Google Scholar] [CrossRef]
  32. Sugawara, M.; Niki, K.; Furuhata, H.; Ohnishi, S.; Suzuki, S. Relationship between the pressure and diameter of the carotid artery in humans. Heart Vessel. 2000, 15, 49–51. [Google Scholar] [CrossRef]
  33. Elgendi, M. Detection of c, d, and e waves in the acceleration photoplethysmogram. Comput. Methods Programs Biomed. 2014, 117, 125–136. [Google Scholar] [CrossRef] [PubMed]
  34. Song, H.-S.; Lehrer, P.M. The effects of specific respiratory rates on heart rate and heart rate variability. Appl. Psychophysiol. Biofeedback 2003, 28, 13–23. [Google Scholar] [CrossRef] [PubMed]
  35. AL-Khalidi, F.Q.; Saatchi, R.; Burke, D.; Elphick, H.; Tan, S. Respiration rate monitoring methods: A review. Pediatric Pulmonol. 2011, 46, 523–529. [Google Scholar] [CrossRef] [PubMed] [Green Version]
  36. Charlton, P.H.; Villarroel, M.; Salguiero, F. Waveform analysis to estimate respiratory rate. In Secondary Analysis of Electronic Health Records; Springer International Publishing: Cham, Switzerland, 2016; pp. 377–390. ISBN 978-3-319-43740-8. [Google Scholar]
  37. Jennings, J.R.; McKnight, J.D.; Molen, M. Phase-sensitive interaction of cardiac and respiratory timing in humans. Psychophysiology 1996, 33, 514–521. [Google Scholar] [CrossRef]
  38. Sadrawi, M.; Shieh, J.-S.; Fan, S.Z.; Lin, C.H.; Haraikawa, K.; Chien, J.C.; Abbod, M.F. Intermittent blood pressure prediction via multiscale entropy and ensemble artificial neural networks. In Proceedings of the 2016 IEEE EMBS Conference on Biomedical Engineering and Sciences (IECBES), Kuala Lumpur, Malaysia, 4–8 December 2016; pp. 356–359. [Google Scholar]
  39. Bhoi, A.K.; Sarkar, S.; Mishra, P.; Savita, G. Pre-processing of PPG signal with performance based methods. Int. J. Comput. Appl. 2012, 4, 251–256. [Google Scholar]
  40. Lee, C.M.; Zhang, Y.T. Reduction of motion artifacts from photoplethysmographic recordings using a wavelet denoising approach. In Proceedings of the IEEE EMBS Asian-Pacific Conference on Biomedical Engineering, Kyoto, Japan, 20–22 October 2003; pp. 194–195. [Google Scholar]
  41. Boloursaz Mashhadi, M.; Asadi, E.; Eskandari, M.; Kiani, S.; Marvasti, F. Heart rate tracking using wrist-type photoplethysmographic (PPG) signals during physical exercise with simultaneous accelerometry. IEEE Signal Process. Lett. 2016, 23, 227–231. [Google Scholar] [CrossRef]
  42. Wang, D.; Zhang, D.; Lu, G. A robust signal preprocessing framework for wrist pulse analysis. Biomed. Signal Process. Control 2016, 23, 62–75. [Google Scholar] [CrossRef]
  43. Alian, A.A.; Shelley, K.H. Photoplethysmography: Analysis of the pulse oximeter waveform. In Monitoring Technologies in Acute Care Environments; Ehrenfeld, J.M., Cannesson, M., Eds.; Springer: New York, NY, USA, 2014; pp. 165–178. ISBN 978-1-4614-8556-8. [Google Scholar]
  44. Kavsaoğlu, A.R.; Polat, K.; Bozkurt, M.R. An innovative peak detection algorithm for photoplethysmography signals: An adaptive segmentation method. Turk. J. Electr. Eng. Comput. Sci. 2016, 24, 1782–1796. [Google Scholar] [CrossRef]
  45. Kazanavicius, E.; Gircys, R.; Vrubliauskas, A.; Lugin, S. Mathematical methods for determining the foot point of the arterial pulse wave and evaluation of proposed methods. Inf. Technol. Control 2005, 34, 29–36. [Google Scholar]
  46. Banerjee, R.; Ghose, A.; Dutta Choudhury, A.; Sinha, A.; Pal, A. Noise cleaning and Gaussian modeling of smart phone photoplethysmogram to improve blood pressure estimation. In Proceedings of the 2015 IEEE International Conference on Acoustics, Speech and Signal Processing (ICASSP), South Brisbane, Queensland, Australia, 19–24 April 2015; pp. 967–971. [Google Scholar]
  47. Akl, T.J.; Wilson, M.A.; Ericson, M.N.; Coté, G.L. Quantifying tissue mechanical properties using photoplethysmography. Biomed. Opt. Express 2014, 5, 2362–2375. [Google Scholar] [CrossRef] [PubMed] [Green Version]
  48. Datta, S.; Banerjee, R.; Choudhury, A.D.; Sinha, A.; Pal, A. Blood pressure estimation from photoplethysmogram using latent parameters. In Proceedings of the 2016 IEEE International Conference on Communications (ICC), Kuala Lumpur, Malaysia, 22–27 May 2016; pp. 1–7. [Google Scholar]
  49. White, W.B.; Berson, A.S.; Robbins, C.; Jamieson, M.J.; Prisant, L.M.; Roccella, E.; Sheps, S.G. National standard for measurement of resting and ambulatory blood pressures with automated sphygmomanometers. Hypertension 1993, 21, 504–509. [Google Scholar] [CrossRef] [PubMed]
  50. Bland, J.M.; Altman, D.G. Statistical methods for assessing agreement between two methods of clinical measurement. Int. J. Nurs. Stud. 2010, 47, 931–936. [Google Scholar] [CrossRef]
Figure 1. The CMS50FW wearable oxygen saturation (SpO2) and pulse rate device with wireless communication for real-time vital-sign monitoring.
Applsci 09 02236 g001
Figure 2. The block diagram of the proposed methodology. PPG: Photoplethysmogram.
Applsci 09 02236 g002
Figure 3. (a) PPW and DPW trajectories; (b) normalized PPWn = PPW/max(PPW) and DPWn = DPW/max(DPW) trajectories coincide.
Applsci 09 02236 g003
Figure 4. PPG with signal preprocessing window (SPW), blood pressure estimation window (BPEW) and peak detection window (PDW).
Applsci 09 02236 g004
Figure 5. (a) Normalized PPG signal in SPW and (b) its spectrum.
Applsci 09 02236 g005
Figure 6. The block diagram of signal fast Fourier transform (FFT) filtering algorithm.
Applsci 09 02236 g006
Figure 7. Filtered signal in SPW.
Applsci 09 02236 g007
Figure 8. (a) PPG signal in SPW with the linear trend; (b) detrended PPG signal.
Applsci 09 02236 g008
Figure 9. (a) PPG signal’s falling edge in PDW; (b, c) PPG signal’s falling and rising edge without a peak point in PDW; (d) PPG signal with a peak point in PDW. PDW: Peak detection window.
Applsci 09 02236 g009
Figure 10. (a) PPG signal after base line correction; (b) PPG signal after peak line correction.
Applsci 09 02236 g010
Figure 11. Estimation of SBPei = K·tan(gmax_its, where ts is the duration of the rising edge, Ts is the sampling period, gmax_i is the maximum steepness of the rising edge, K = SBPm/tan(gmax_its, and SBPm is the systolic blood pressure which is measured using a conventional cuff-based meter during the initial training session.
Applsci 09 02236 g011
Figure 12. Estimated SBPei blood pressure values (curved line) and SBPmdj median values (stepwise line), calculated from SBPei in BPEW.
Applsci 09 02236 g012
Figure 13. Estimated SBPe blood pressure value (dot line) and SBPmdj in BPEW (stepwise line).
Applsci 09 02236 g013
Figure 14. (a) PPG signal recording posture; (b) SBP measurements posture.
Applsci 09 02236 g014
Figure 15. Bland–Altman plot presenting the values of the difference (SBPe–SBPm) as a function of the mean of SBPm and SBPe.
Applsci 09 02236 g015
Table 1. Performance of the proposed method.
r (p < 0.001)MDSDer, %
0.86−0.0436.790.025 ± 5.44
Table 2. Evaluation of the performance of the systolic blood pressure estimation methods (MD—mean difference, SD—standard deviation, SPS—samples per second).
MethodsSystolic Blood Pressure Method Performance
MDSDSPS
Proposed method−0.0436.7960 Hz
Ding [15]0.375.211 KHz
Lin [13]3.228.021 KHz
Yan [25]−0.374.3200 Hz
Kurylyak [22]3.243.47125 Hz
Choudhury [20]0.7813.1100 Hz
Khalid [19]−1.15.7100 Hz
Xing [21]−1.672.46100 Hz
Mousavi [10] Method 10.256.7125 Hz
      Method 20.667.5125 Hz
      Method 30.194.17125 Hz
      Method 40.24.73125 Hz

