Data Analytics and Its Advantages for Addressing the Complexity of Healthcare: A Simulated Zika Case Study Example


Abstract
:1. Introduction
2. Background
2.1. Complexity of Healthcare and Data Management
2.2. Ecology of Medical Care Framework
2.3. Patient-Centered Healthcare Analytics
2.4. Data Mining and Knowledge Discovery in Databases
2.5. Business Intelligence Systems
2.6. Case Study—Netherlands
3. Materials and Methods
3.1. Advantages of Simulation Modeling
3.2. Case Study
3.3. Research Approach (Discrete Event Simulation)
3.4. Discrete Event Simulation (DES)
| x1,1 | x1,2 | x1,3 | ⋯ | x1,k+1 | ⋯ | x1,m | X1 | ← | Run 1 |
| x2,1 | x2,2 | x2,3 | ⋯ | x2,k+1 | ⋯ | x2,m | X2 | ← | Run 2 |
| ⋮ | ⋮ | ⋮ | ⋮ | ⋮ | ⋮ | ⋮ | ⋮ | ||
| xn,1 | xn,2 | xn,3 | ⋯ | xn,k+1 | ⋯ | xn,m | Xn | ← | Run n |
| ↑ | |||||||||
| Average Across Single Run |
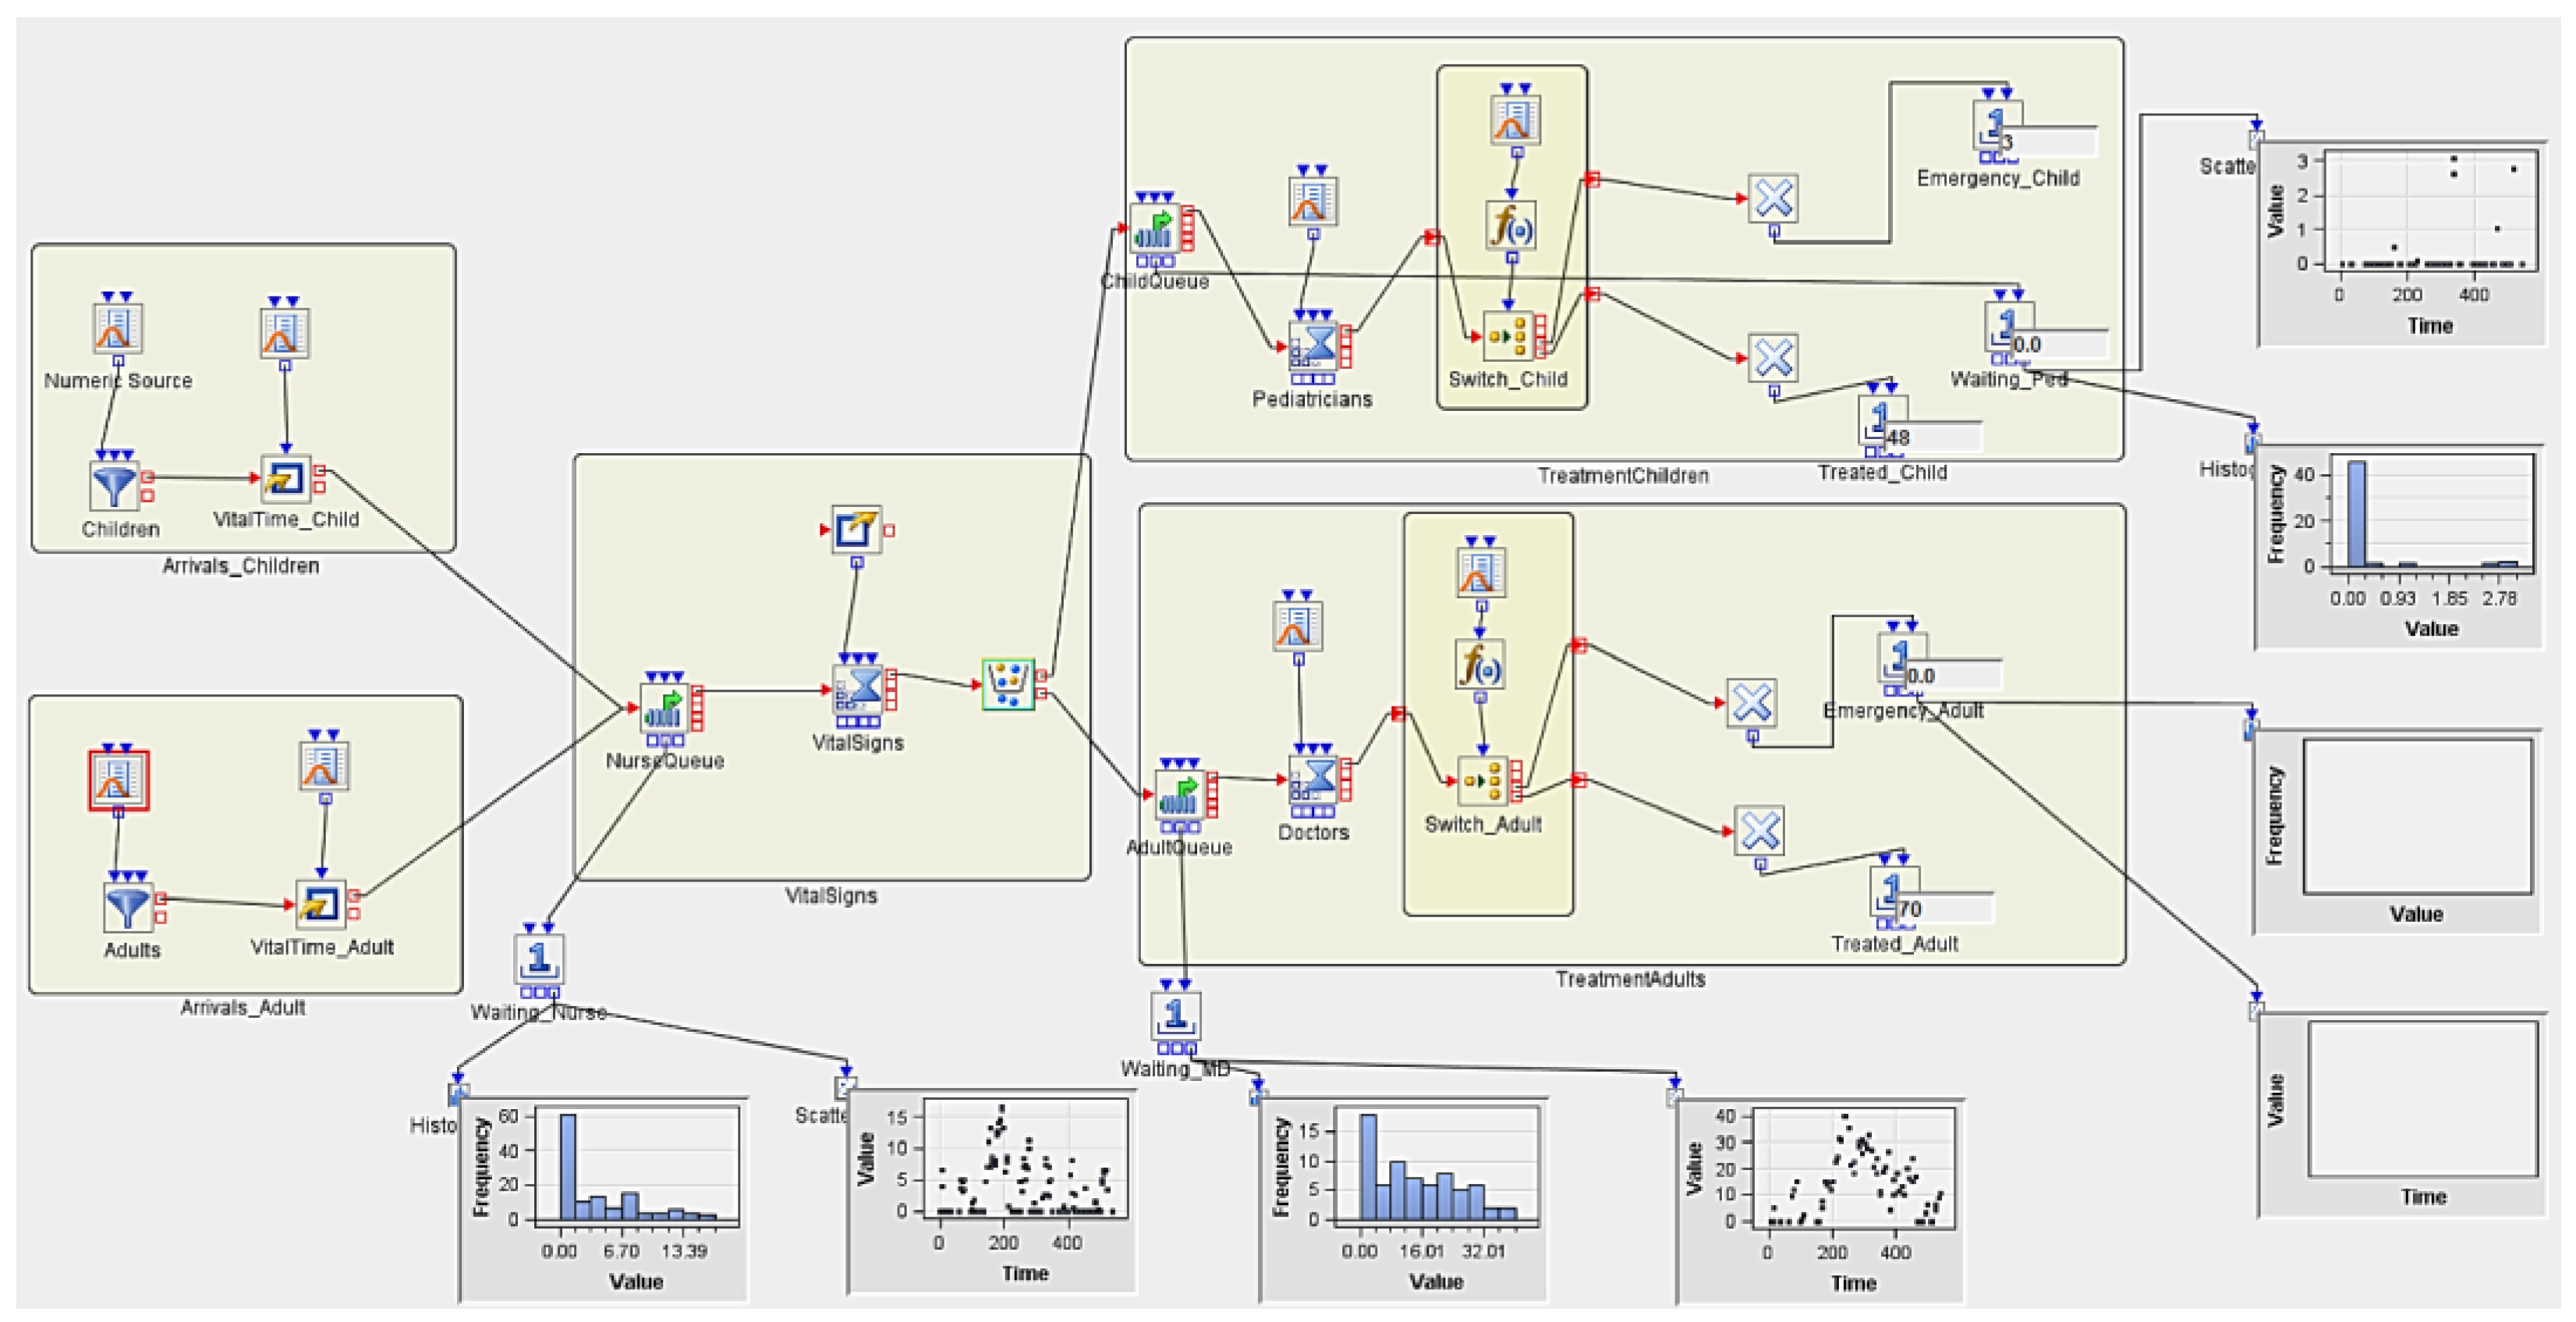
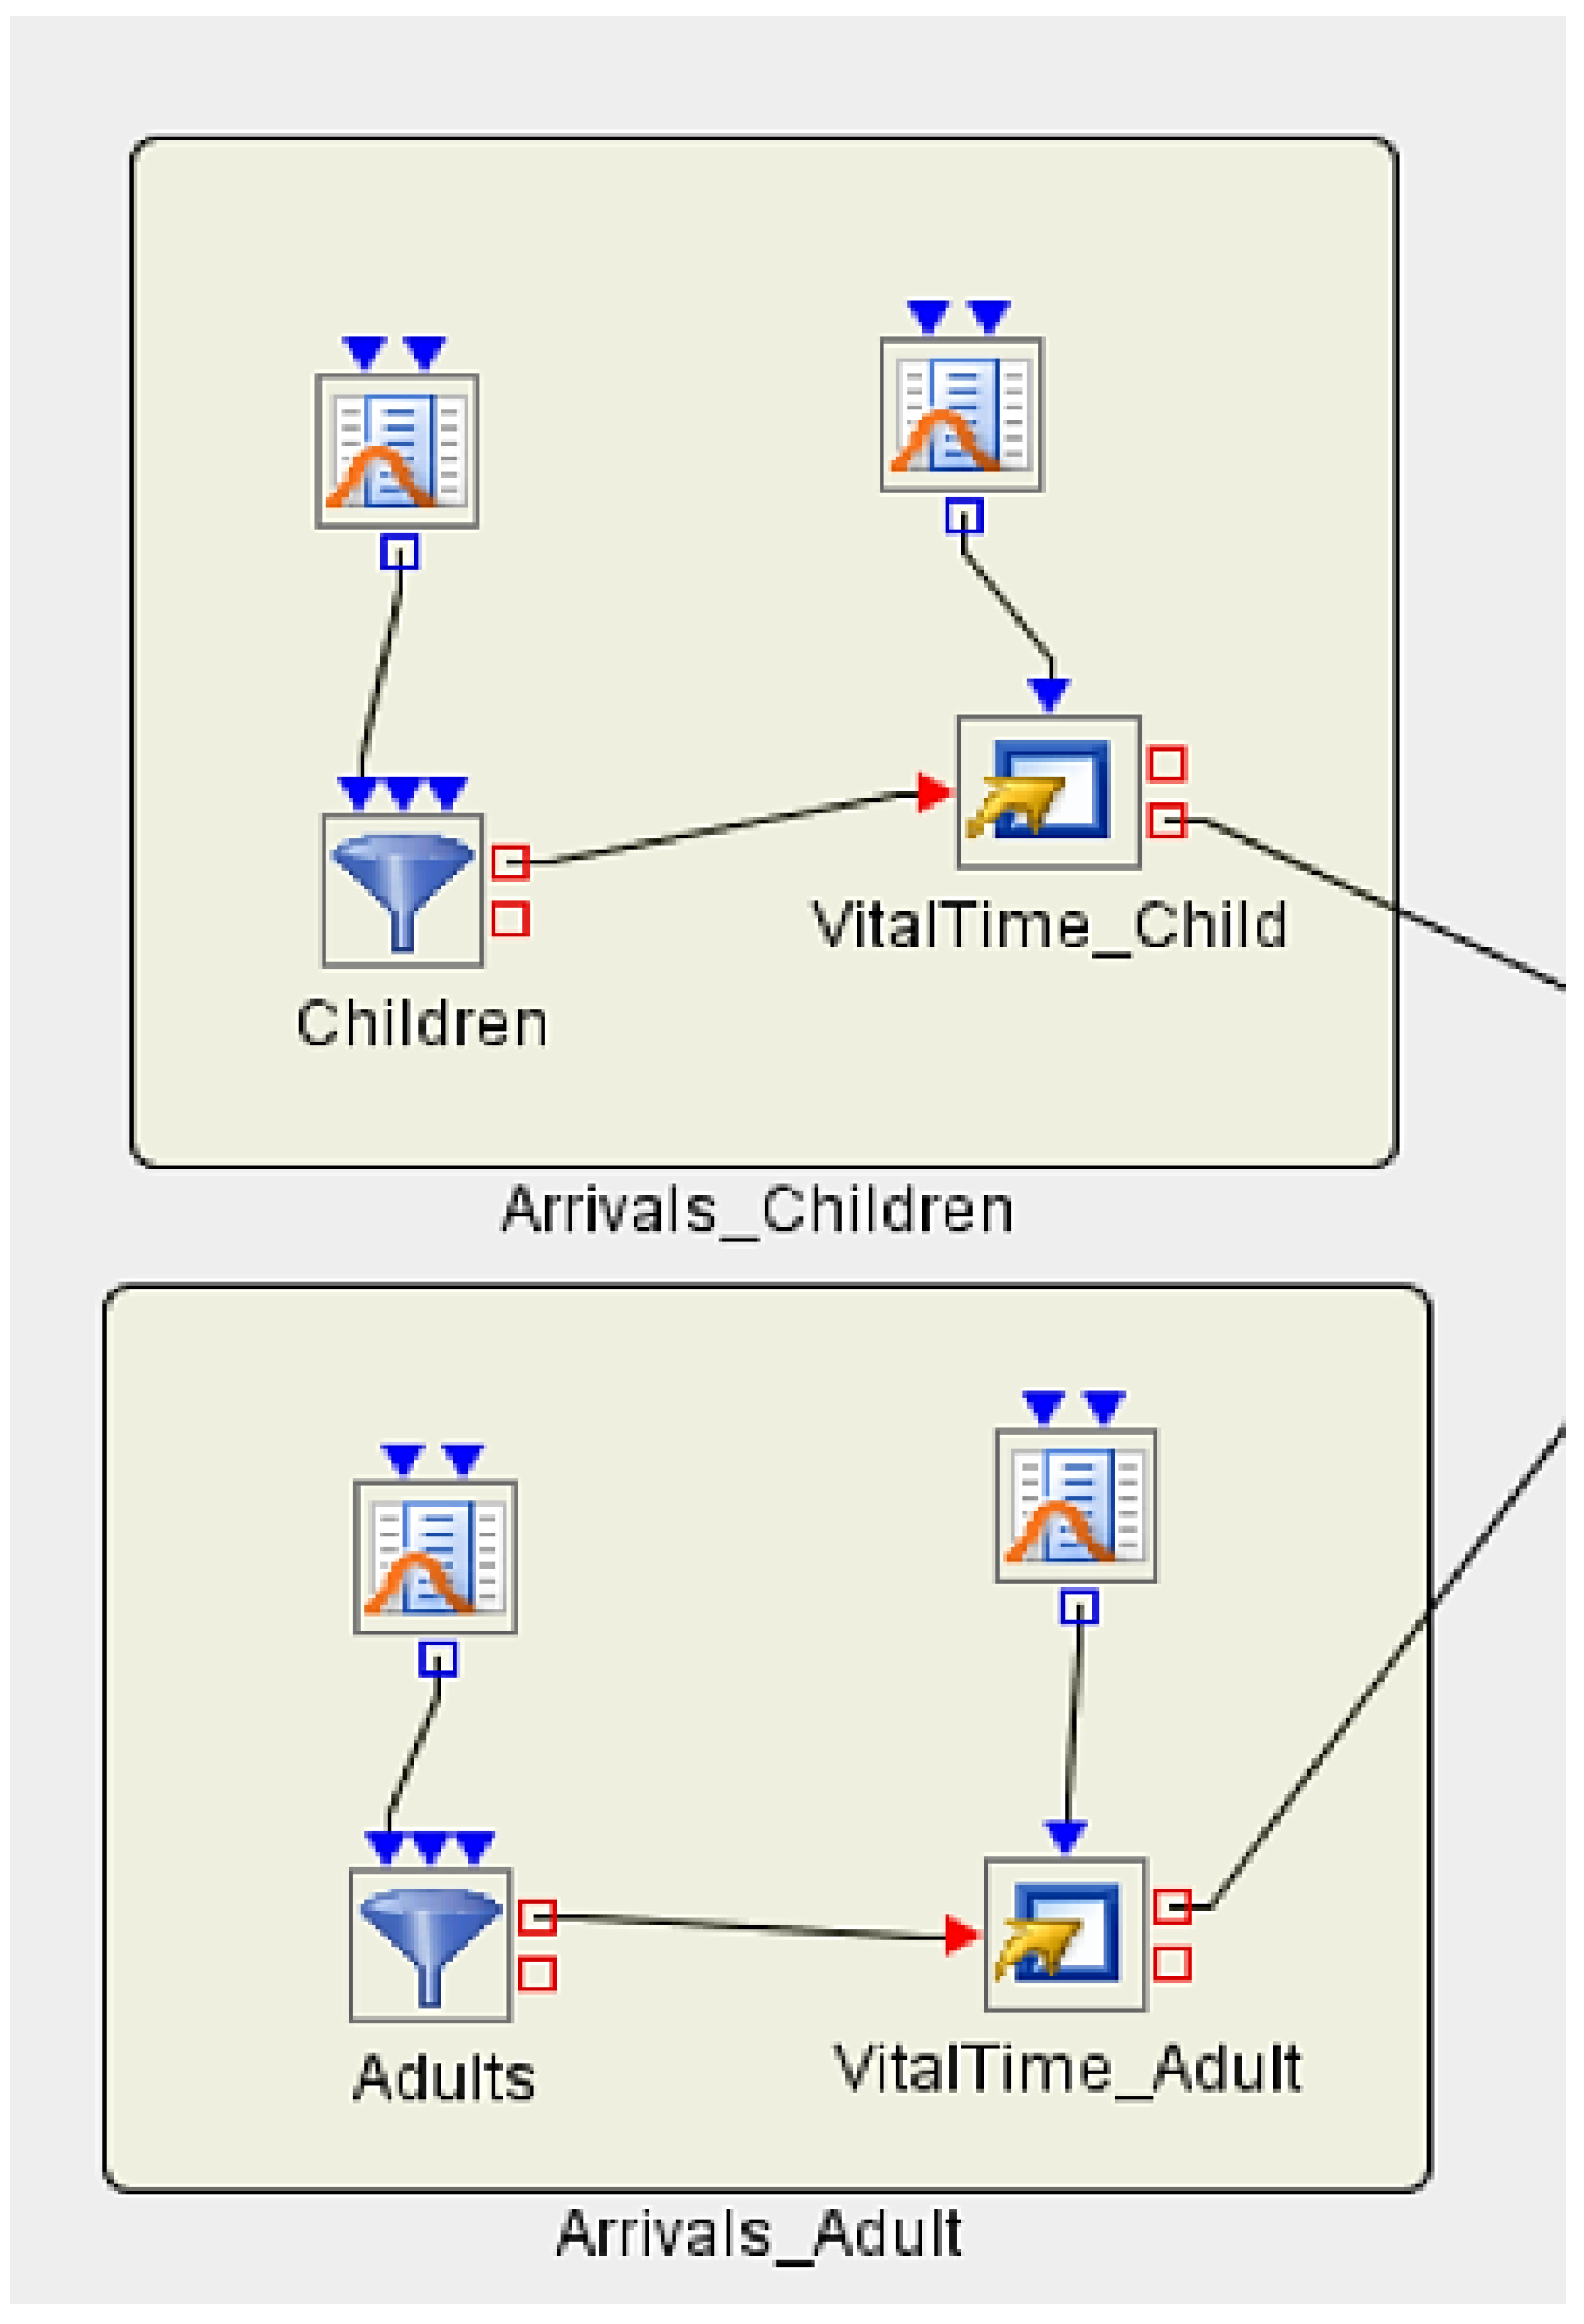
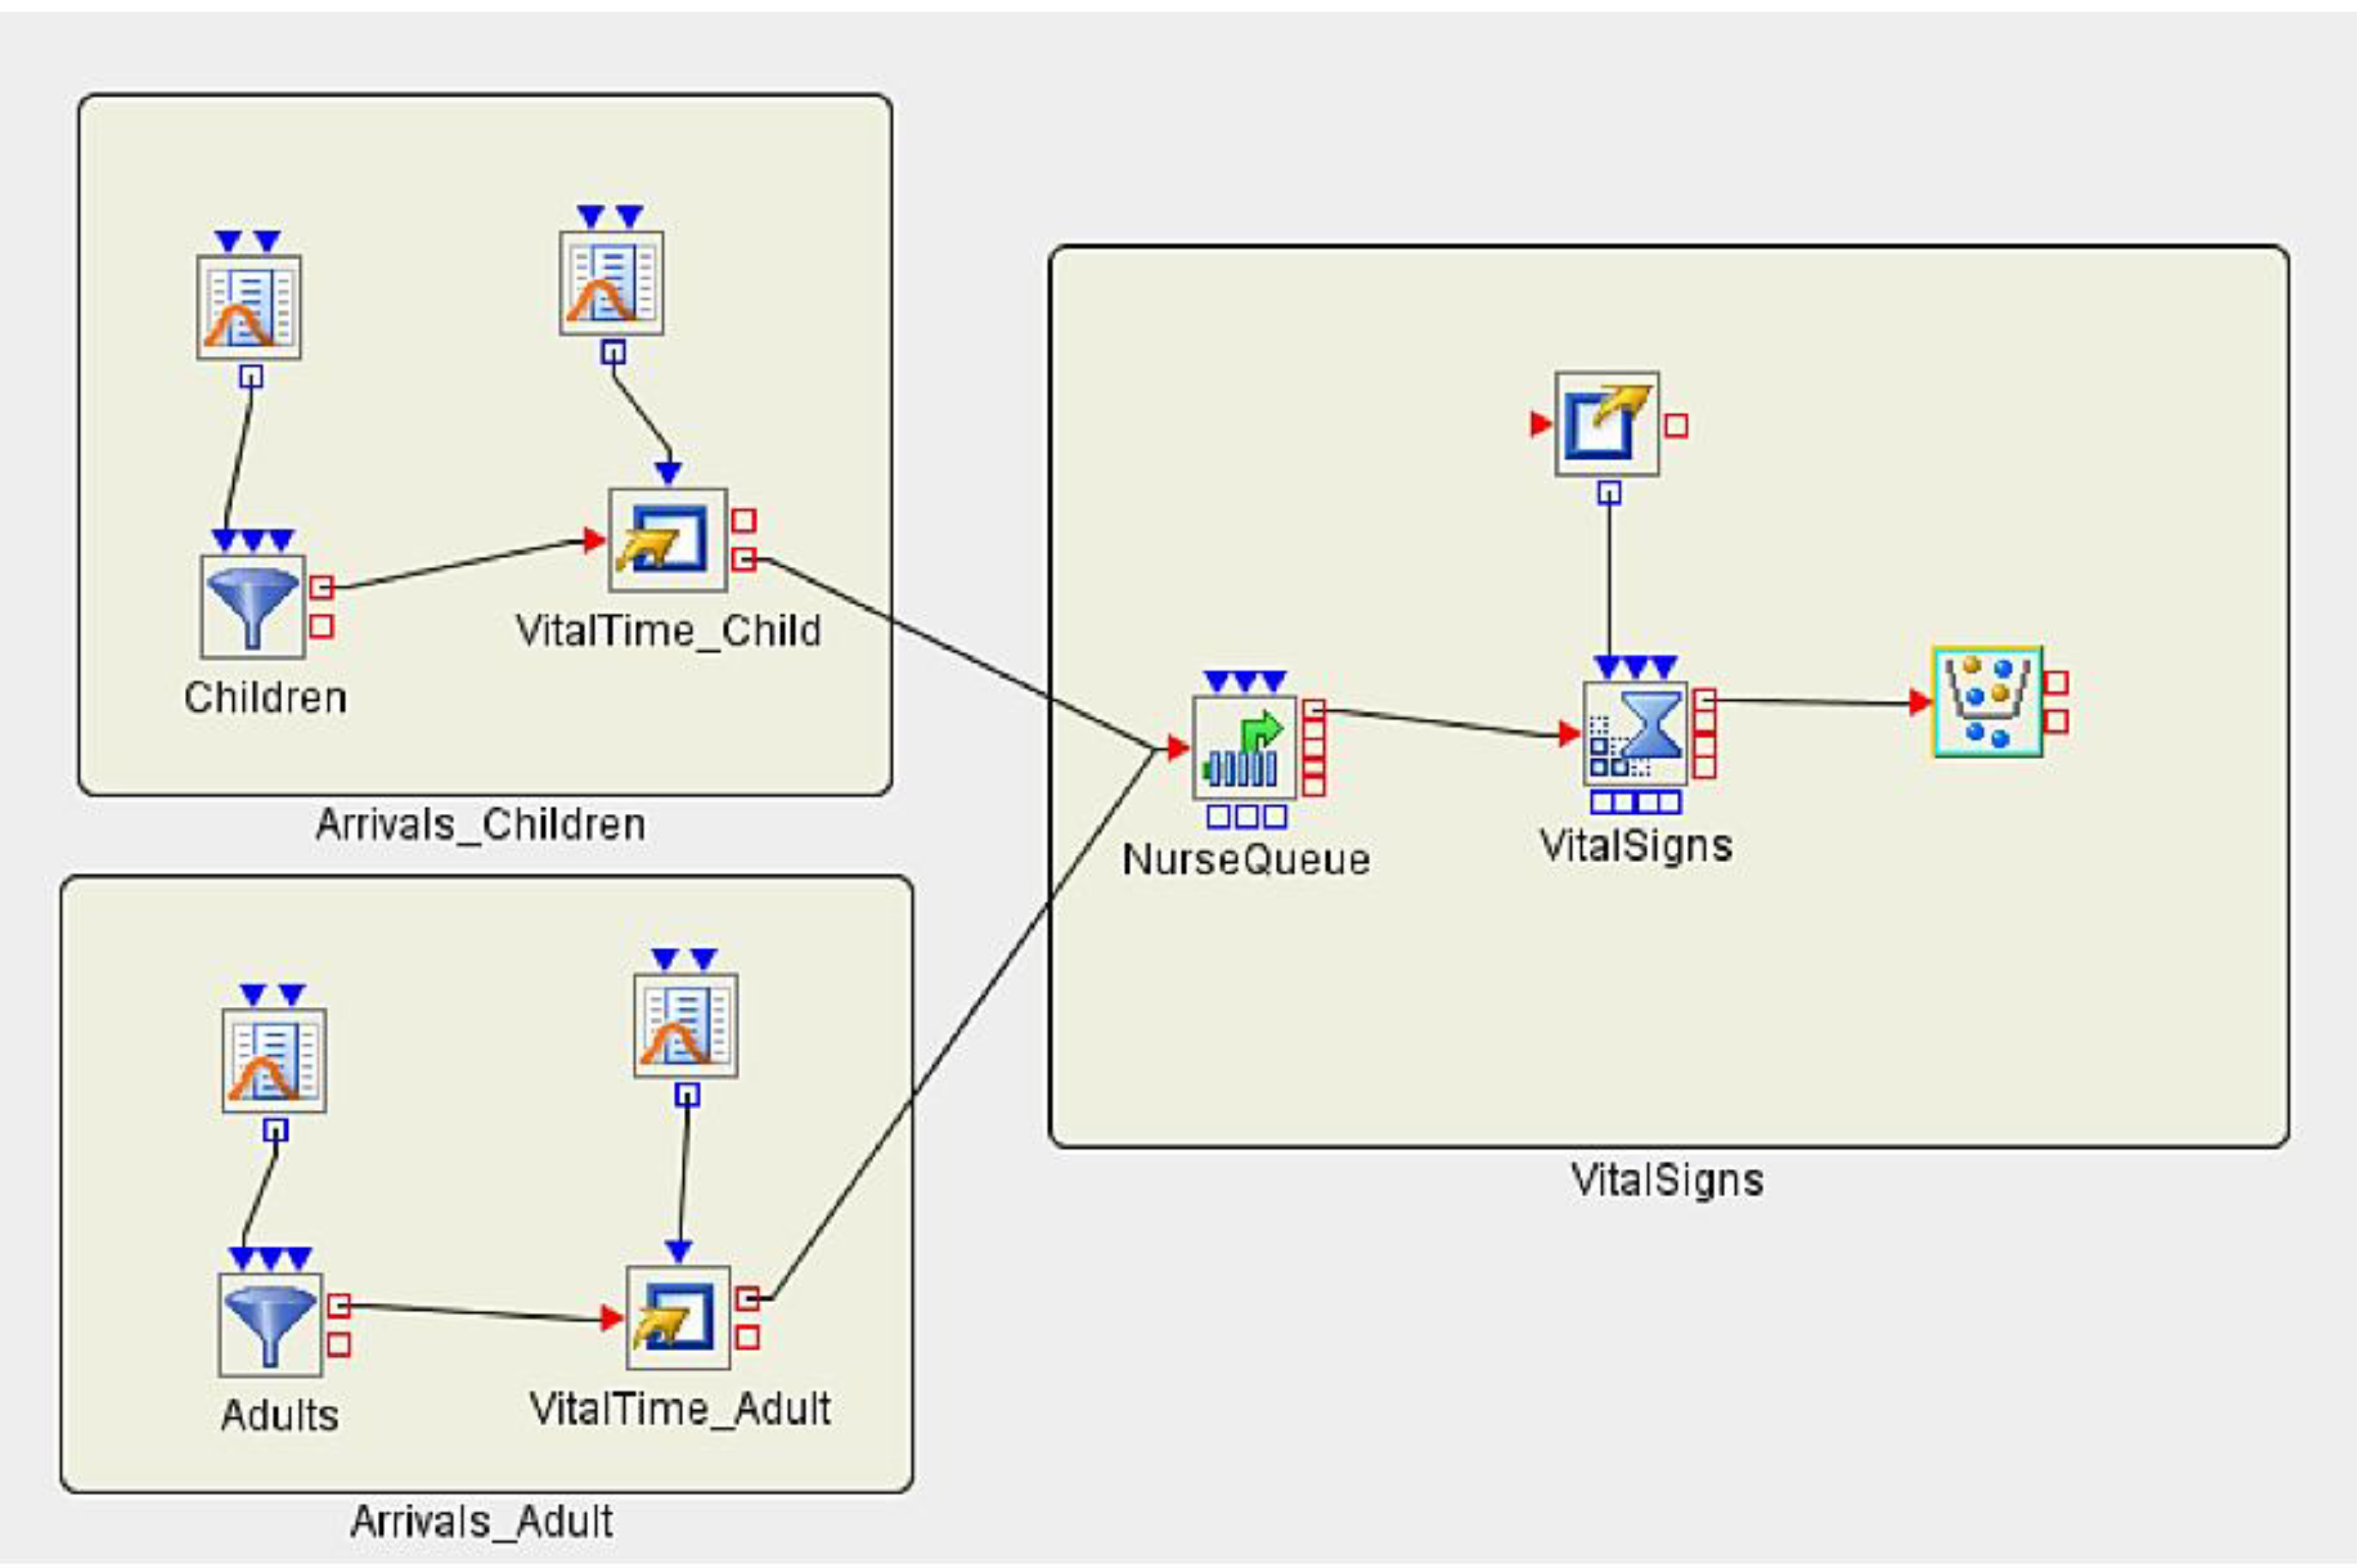
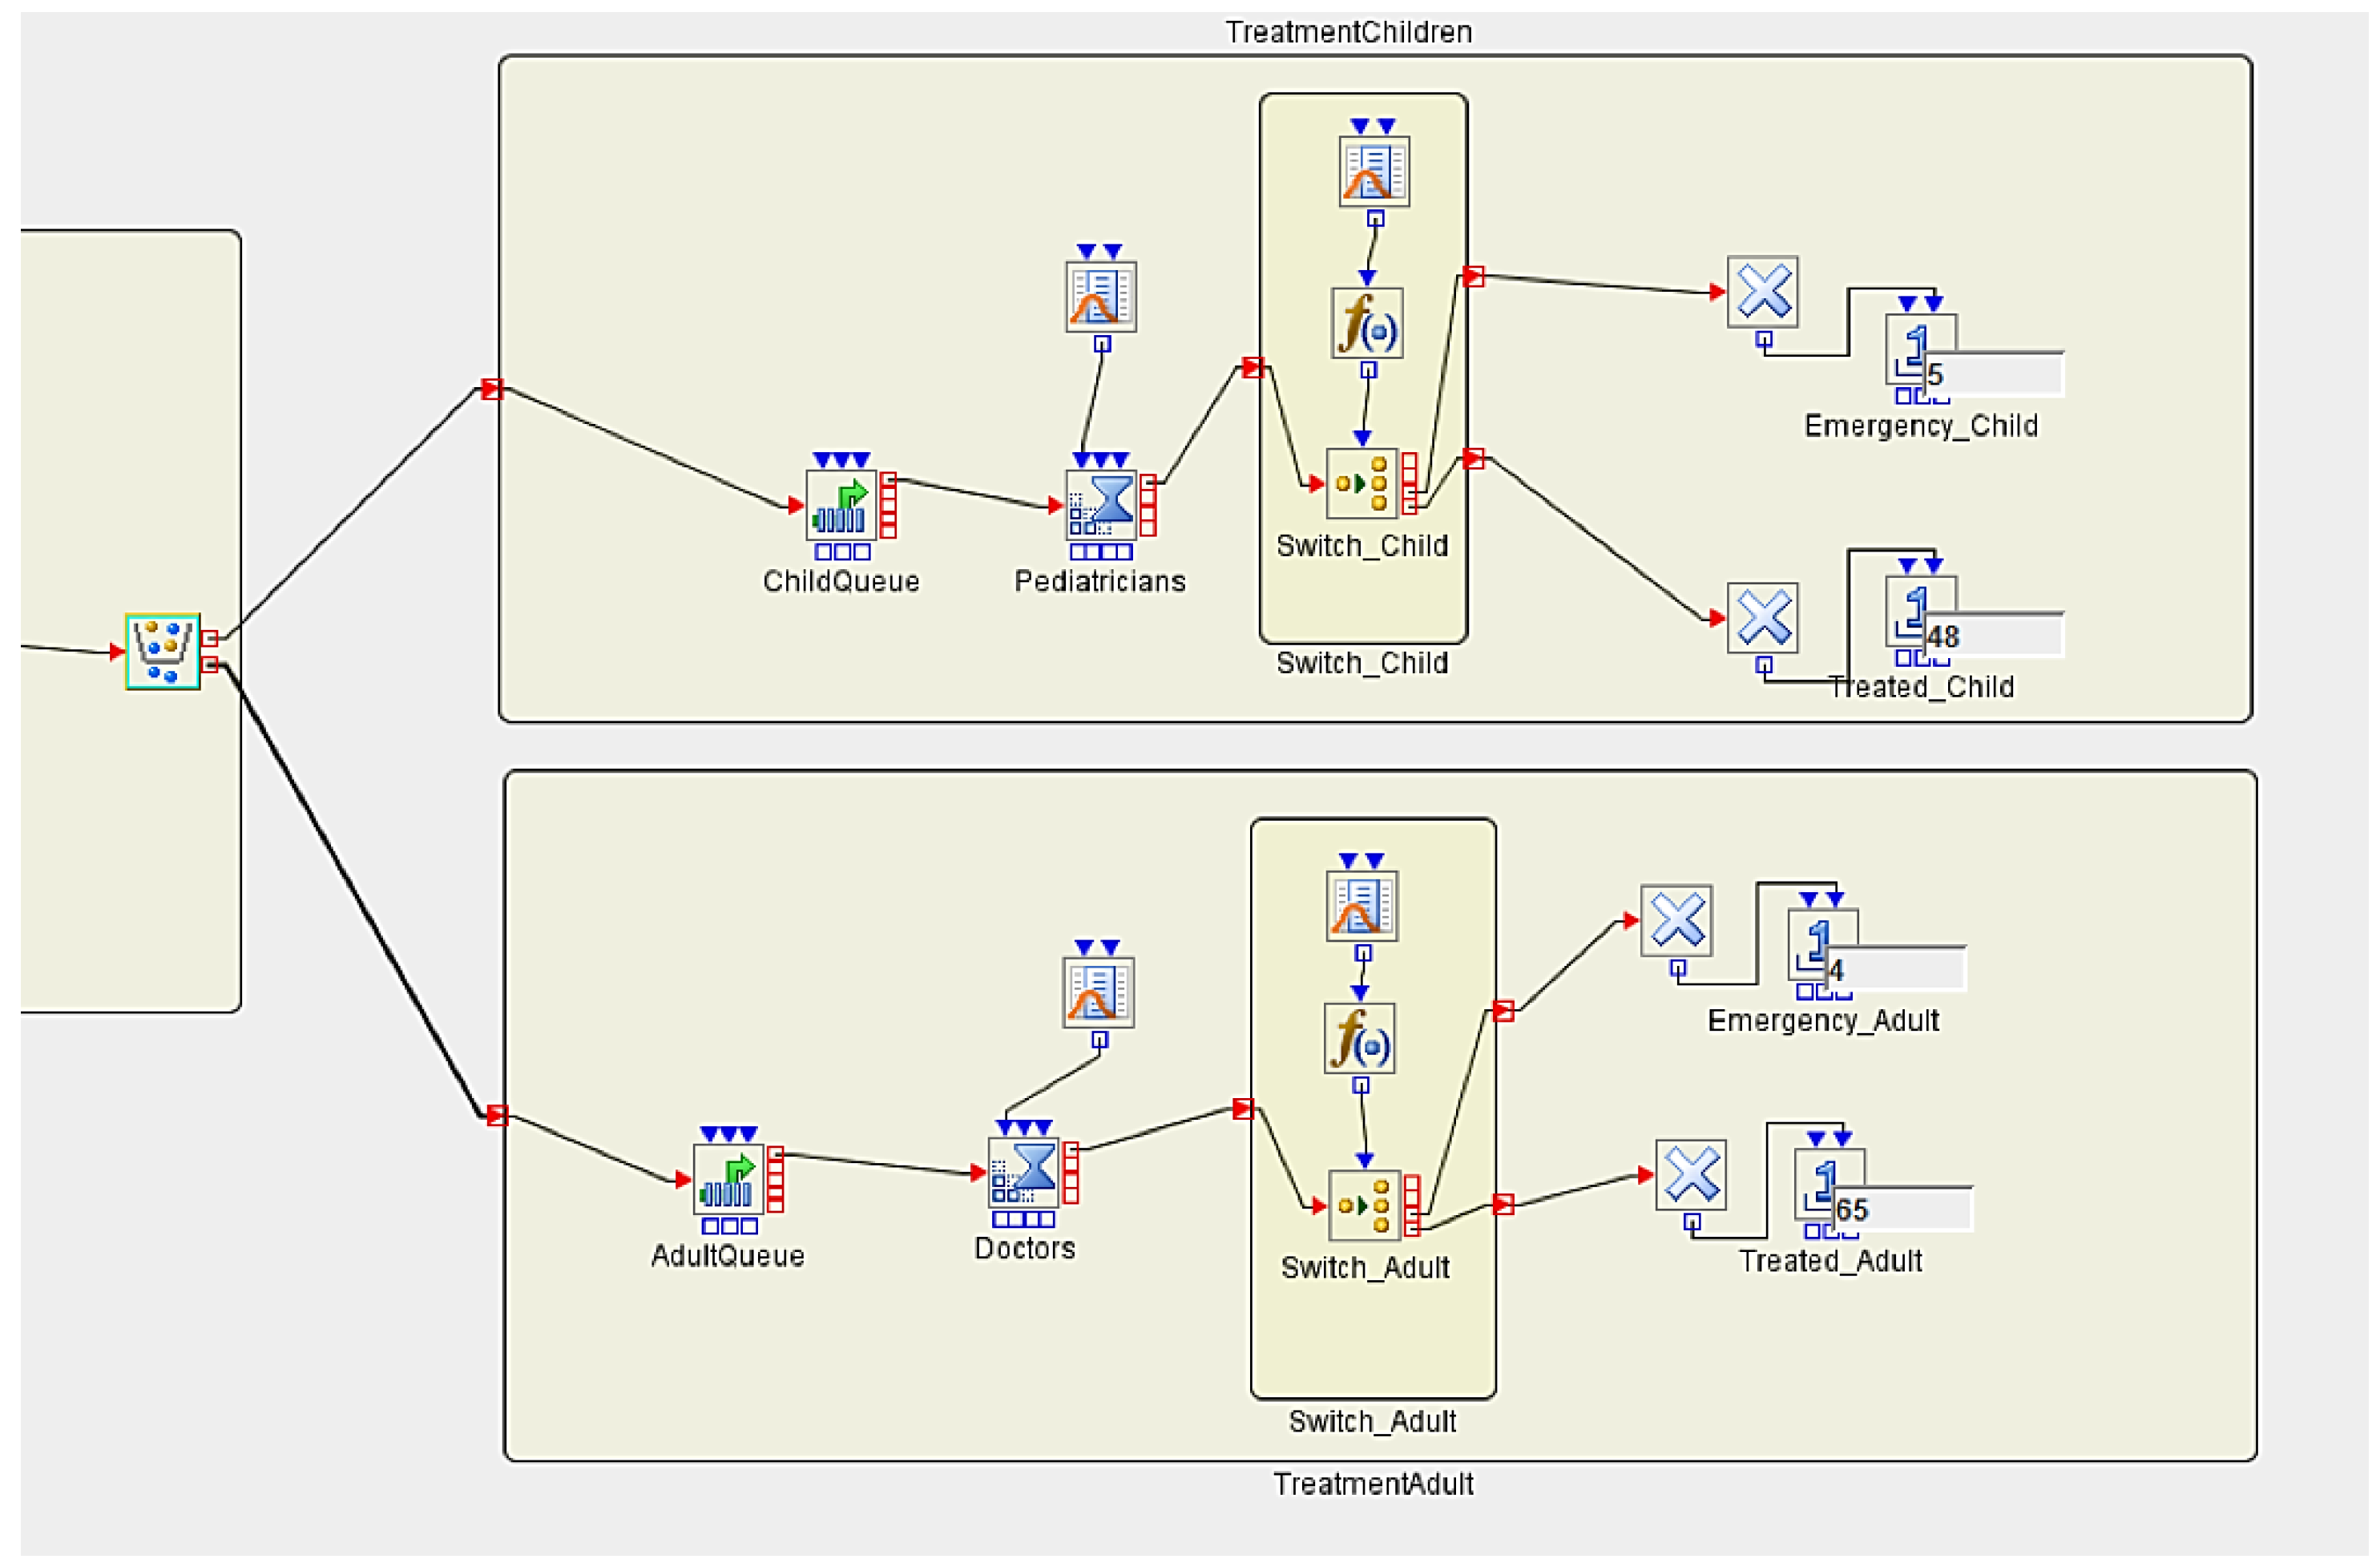
3.5. Implementing Discrete Event Simulation Models
- -
- ; the probability for going to an Emergency Room is 8% for a child.
- -
- ; the probability for going to an Emergency Room is 5% for an adult.
3.5.1. Experiment 1
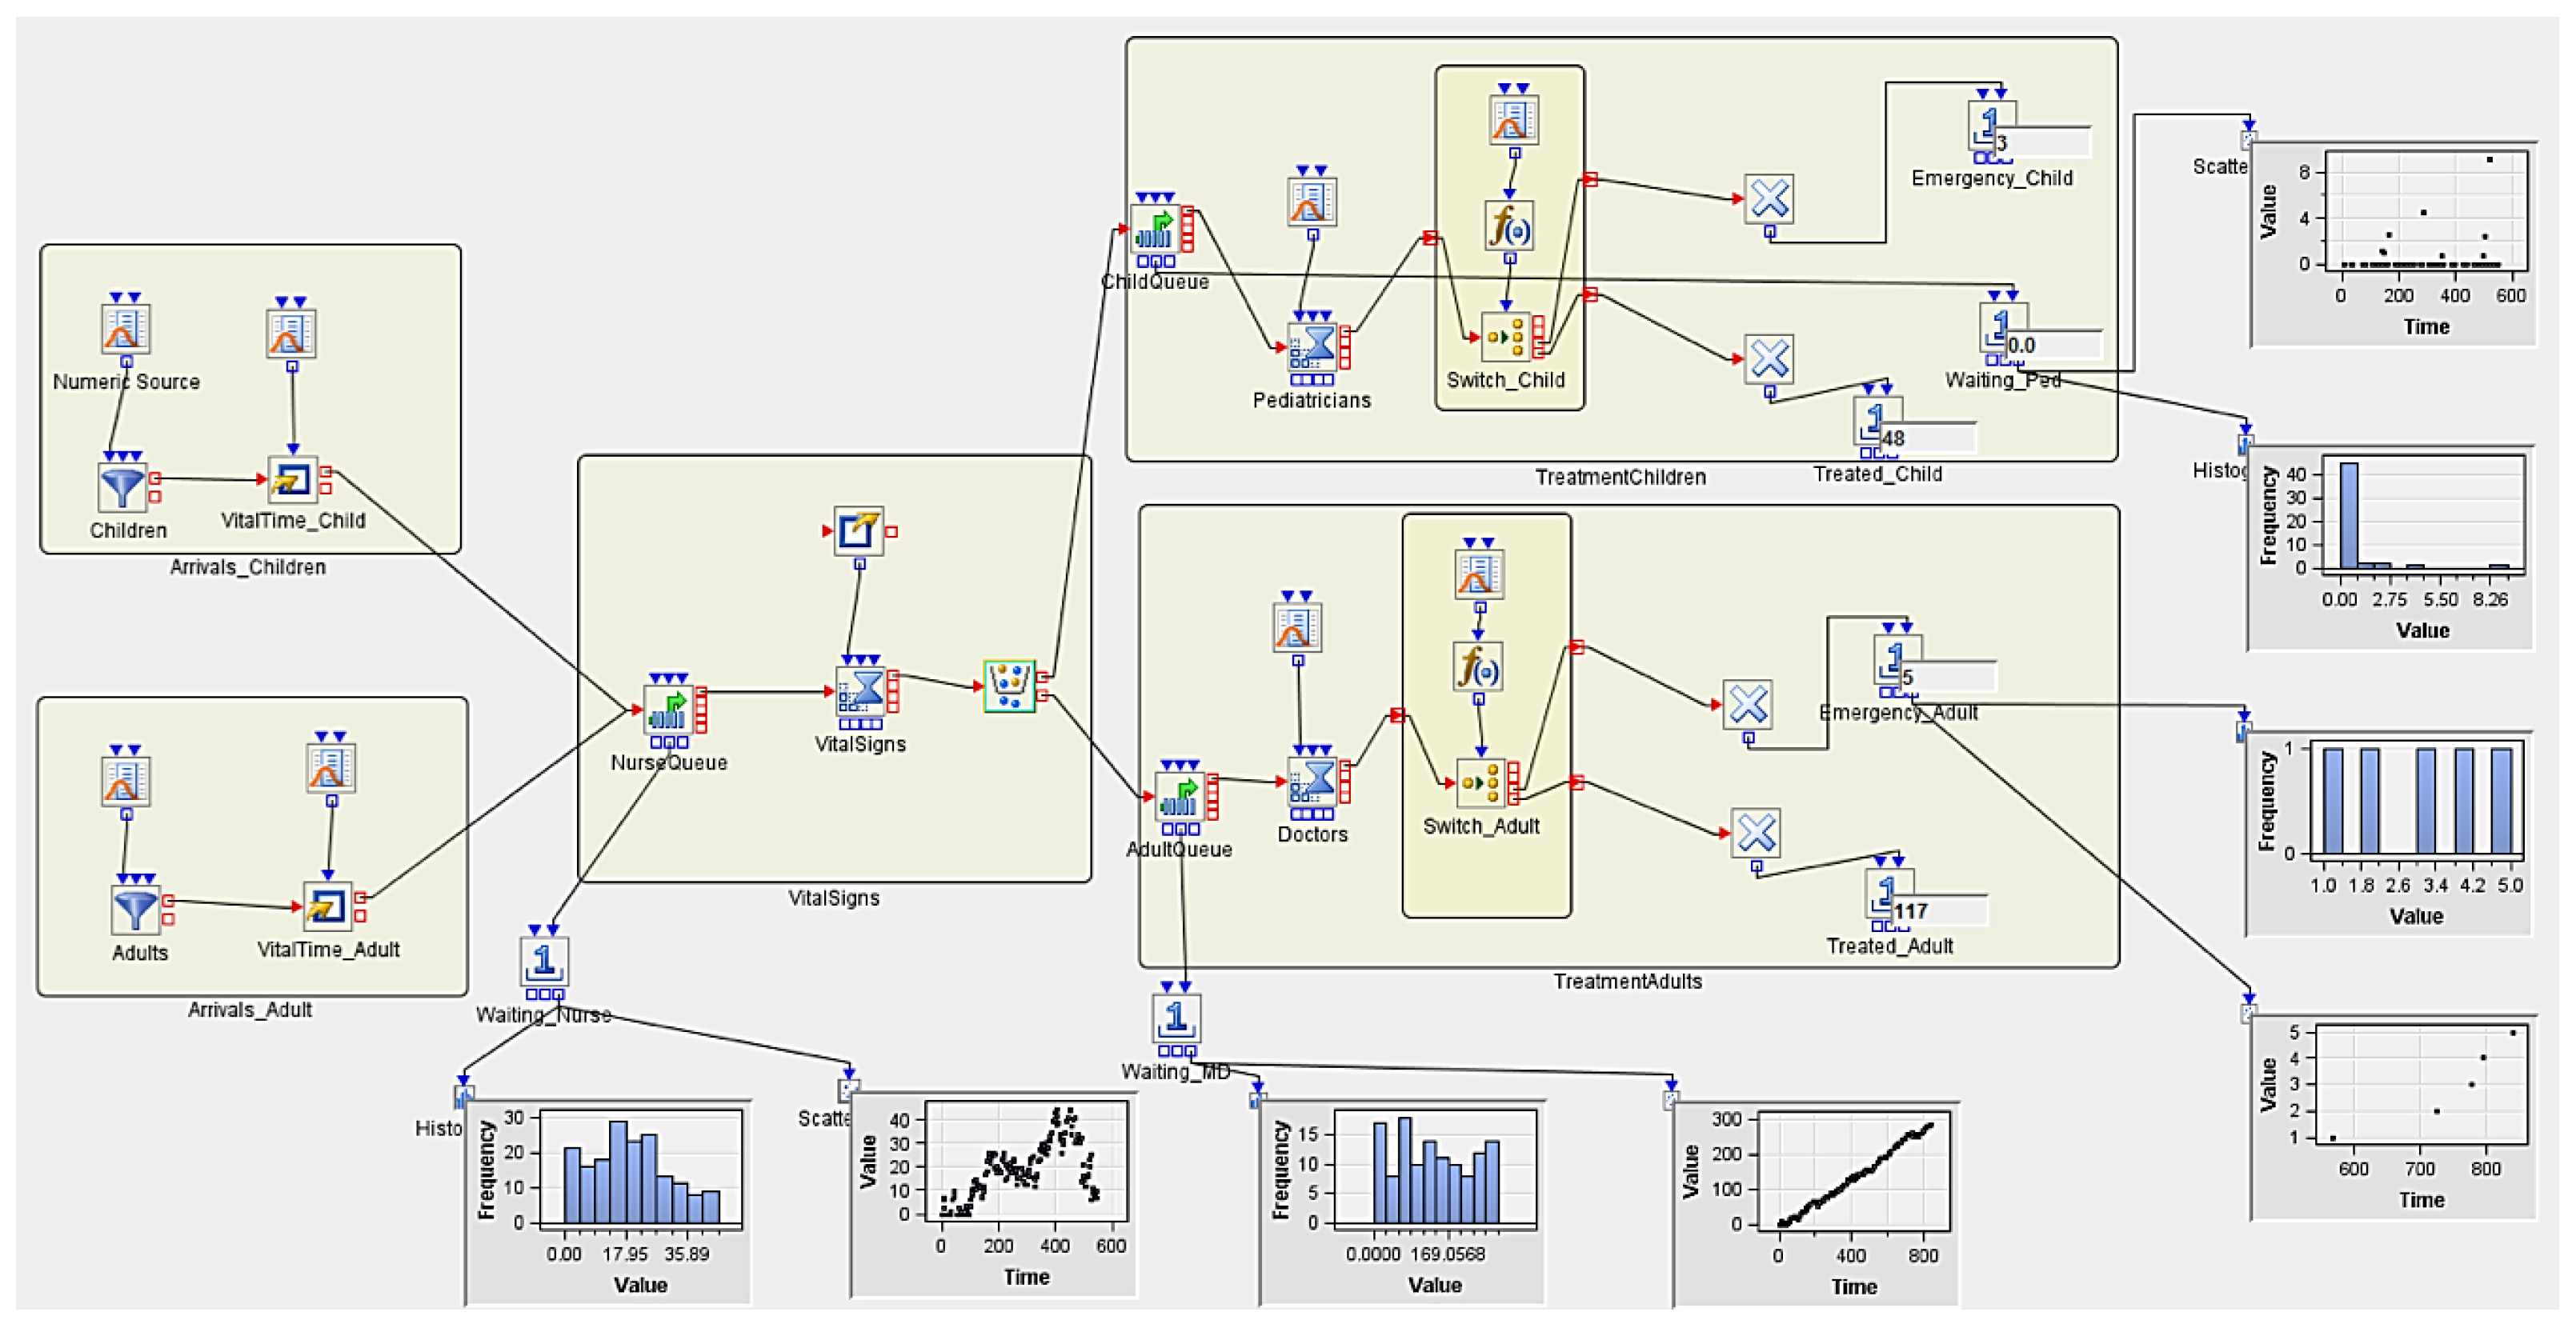
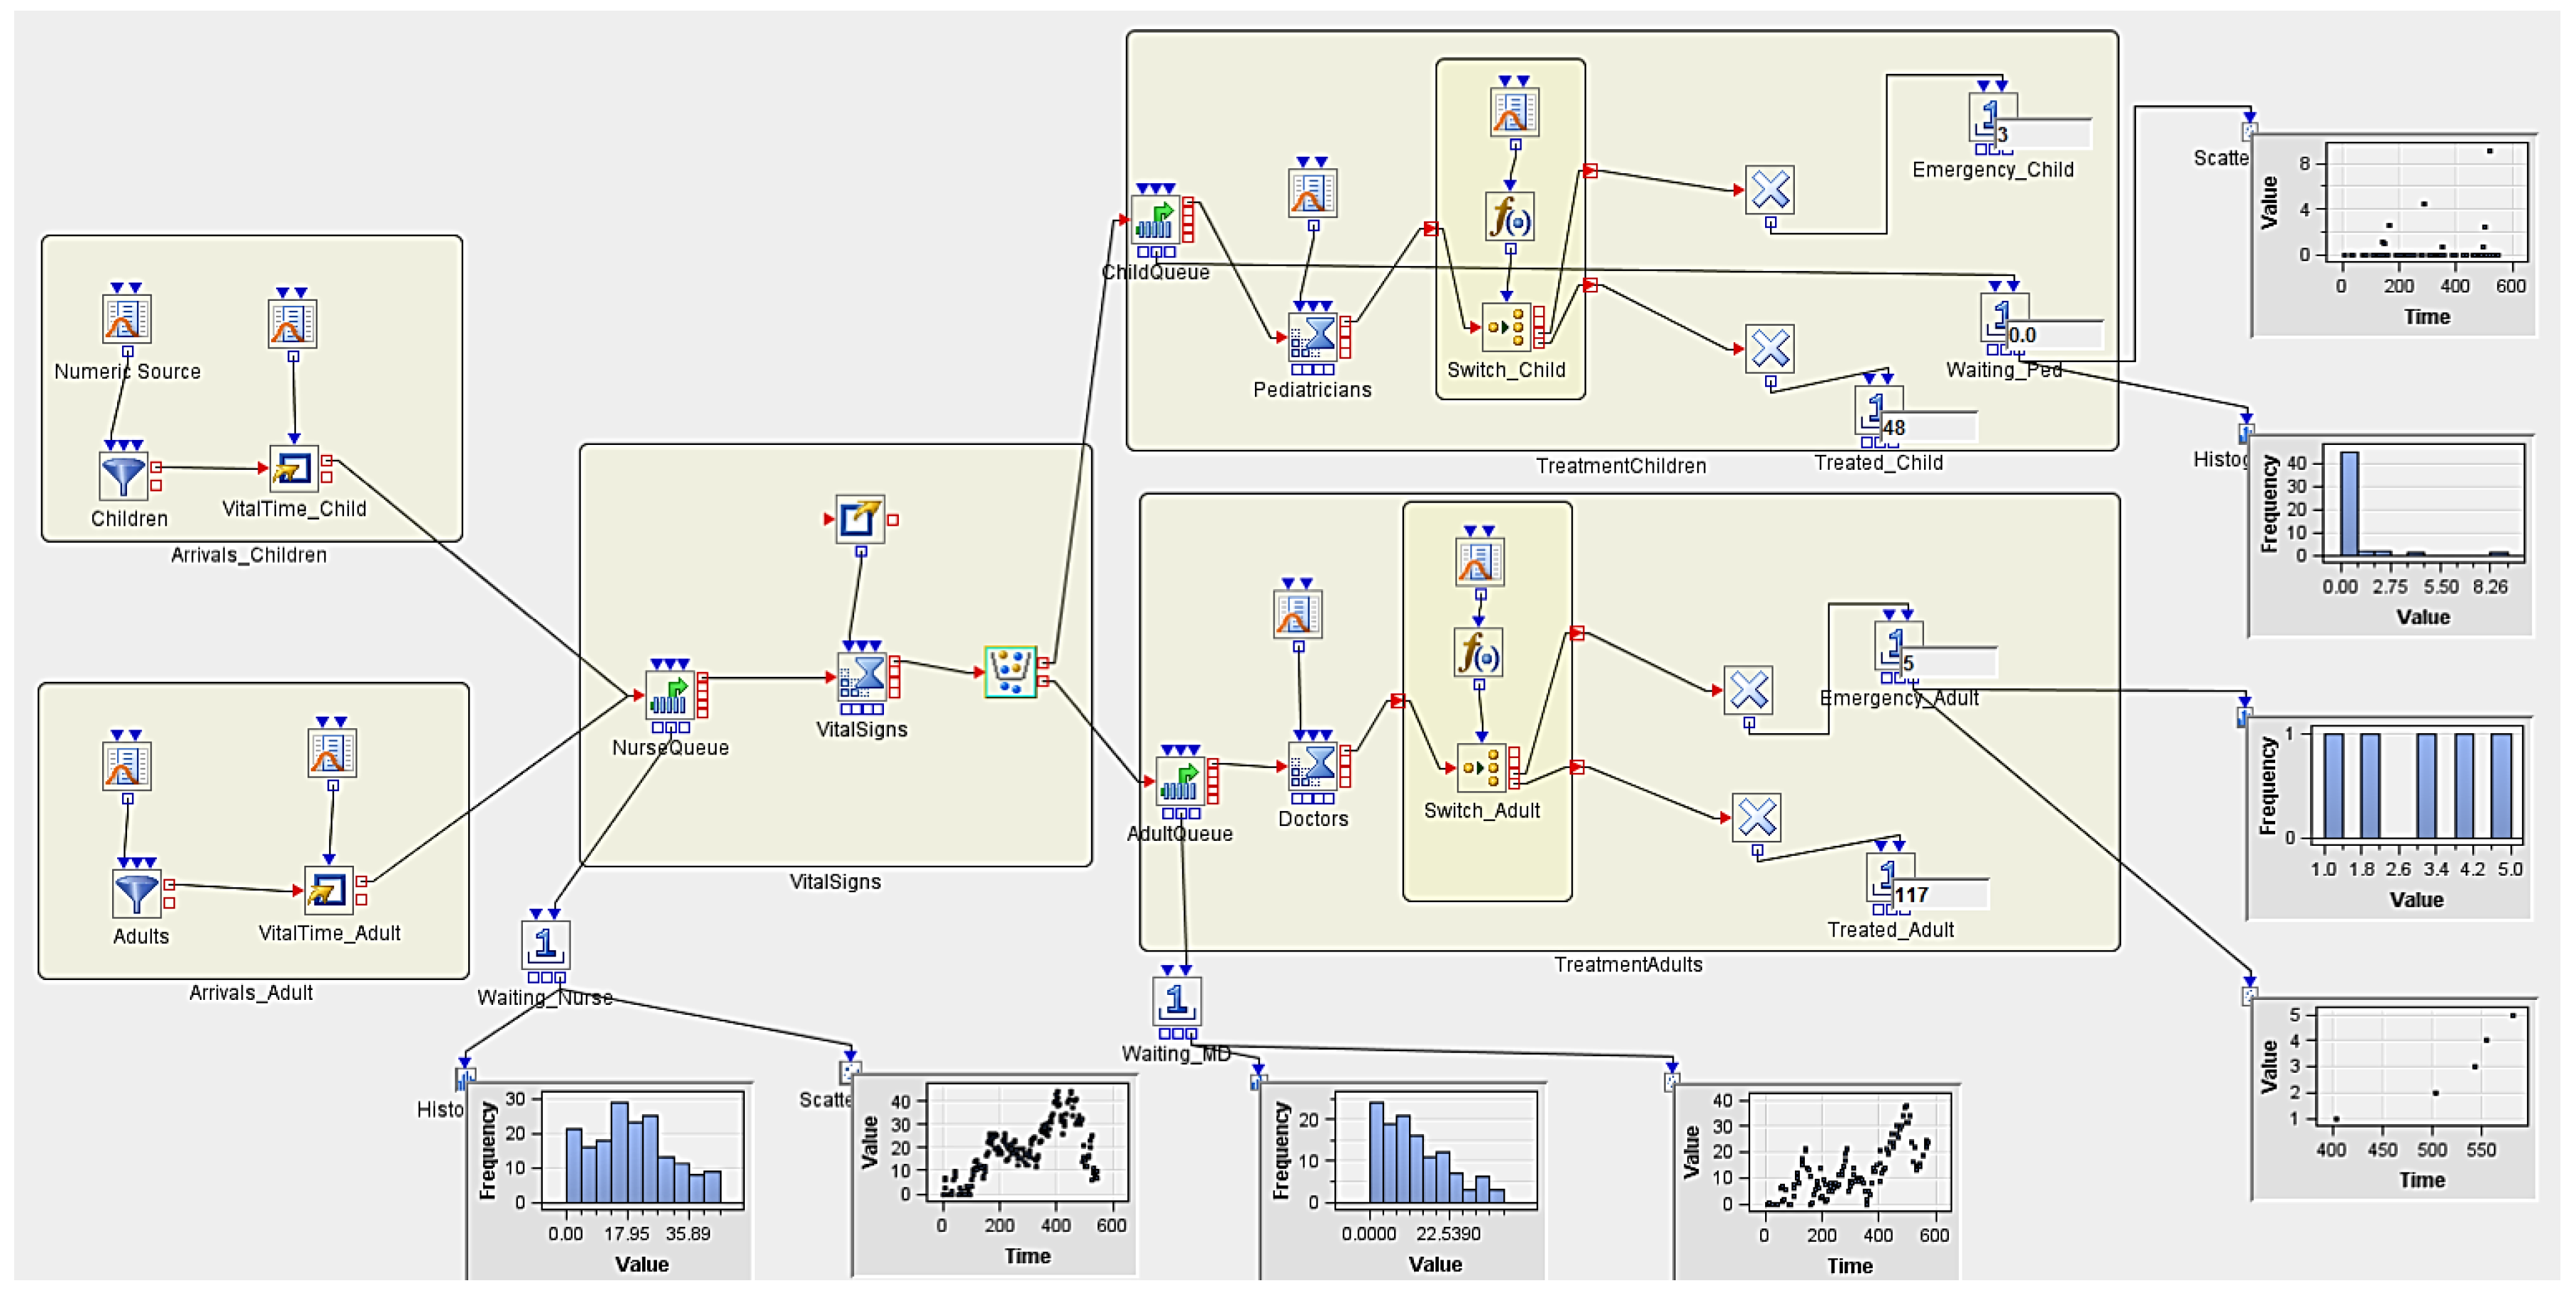
3.5.2. Experiment 2 (Hypothetical Case Scenario)
4. Conclusions and Future Work
Author Contributions
Funding
Conflicts of Interest
References
- Lipsitz, L.A. Understanding health care as a complex system: The foundation for unintended consequences. JAMA 2012, 308, 243–244. [Google Scholar] [CrossRef] [PubMed]
- Yazdanparast, R.; Hamid, M.; Azadeh, A.; Keramati, A. An intelligent algorithm for optimization of resource allocation problem by considering human error in an emergency department. J. Ind. Syst. Eng. 2018, 11, 287–309. [Google Scholar]
- Spruit, M.; Lytris, M. Applied data science in patient-centric healthcare: Adaptive analytic systems for empowering physicians and patients. Telemat. Inform. 2018, 35, 643–653. [Google Scholar] [CrossRef]
- Alkhaldi, F.; Alouani, A. Systemic design approach to a real-time healthcare monitoring system: Reducing unplanned hospital readmissions. Sensors 2018, 18, 2531. [Google Scholar] [CrossRef] [PubMed]
- Islam, S.; Hasan, M.; Wang, X.; Germack, H.D.; Noor-E-Alam, M. A systematic review on healthcare analytics: Application and theoretical perspective of data mining. Healthcare 2018, 6, 54. [Google Scholar] [CrossRef] [PubMed]
- Mahmud, R.; Koch, F.L.; Buyya, R. Cloud-fog interoperability in lot-enabled healthcare solutions. In Proceedings of the 19th International Conference on Distributed Computing and Networking, Varanasi, India, 4–7 January 2018. [Google Scholar]
- Standfield, L.B.; Comans, T.; Scuffham, P. A simulation of dementia epidemiology and resource use in australia. Aust. N. Z. J. Public Health 2018, 42, 291–295. [Google Scholar] [CrossRef] [PubMed]
- Croll, J. The Impact of Usability on Clinician Acceptance of a Health Information System. Ph.D. Thesis, Queensland University of Technology, Brisbane, Australia, 2009. [Google Scholar]
- Lærum, H.; Ellingsen, G.; Faxvaag, A. Doctors’ use of electronic medical records systems in hospitals: Cross sectional survey. BMJ 2001, 323, 1344–1348. [Google Scholar]
- Green, L.A.; Fryer, G.E.; Yawn, B.P.; Lanier, D.; Dovey, S.M. Ecology of medical care revisited. N. Engl. J. Med. 2001, 344, 2021–2025. [Google Scholar] [CrossRef] [PubMed]
- Mead, N.; Bower, P. Patient-centredness: A conceptual framework and review of the empirical literature. Soc. Sci. Med. 2000, 51, 1087–1110. [Google Scholar] [CrossRef]
- Fayyad, U.; Piatetsky-Shapiro, G.; Smyth, P. From data mining to knowledge discovery in databases. AI Mag. 1996, 17, 37–54. [Google Scholar]
- Hernández, M.A.; Stolfo, S.J. Real-world data is dirty: Data cleansing and the merge/purge problem. Data Min. Knowl. Discov. 1998, 2, 9–37. [Google Scholar] [CrossRef]
- Negash, S. Business intelligence. In Handbook on Decision Support Systems 2; Springer: Berlin/Heidelberg, Germany, 2004; Volume 13, pp. 177–195. [Google Scholar]
- Bonney, W. Applicability of business intelligence in electronic health record. Procedia Soc. Behav. Sci. 2013, 73, 257–262. [Google Scholar] [CrossRef]
- Spruit, M.; Vroon, R.; Batenburg, R. Towards healthcare business intelligence in long-term care: An explorative case study in the Netherlands. Comput. Hum. Behav. 2014, 30, 698–707. [Google Scholar] [CrossRef]
- Pérez, E.; Uyan, B.; Rohde, R.E.; Wehbe-Janek, H.; Hochhalter, A.K.; Fenton, S.H. Assessing catheter associated urinary tract infections prevention interventions in intensive care units: A discrete event simulation study. IISE Trans. Healthc. Syst. Eng. 2016, 7, 43–52. [Google Scholar] [CrossRef]
- Allison, P.D. Discrete-time methods for the analysis of event histories. Sociol. Methodol. 1982, 13, 61–98. [Google Scholar] [CrossRef]
- Fishman, G.S. Principles of Discrete Event Simulation, 1st ed.; Wiley: Hoboken, NJ, USA, 1978. [Google Scholar]


| Num Nurses | Num MDs | Num Peds | Replicates | AvgWait_Nurse | AvgWait_Ped | AvgWait_MD | Treated_Child | Treated_Adult |
|---|---|---|---|---|---|---|---|---|
| 2 | 2 | 3 | 5 | 4.5940061805 | 0.486359693 | 11.41747727 | 51.4 | 66.2 |
| 1 | 5.0021294076 | 0.956373939 | 4.320797381 | 53 | 59 | |||
| 2 | 4.7728509958 | 0.120336954 | 31.04372502 | 56 | 77 | |||
| 3 | 3.7125053454 | 0.259935083 | 7.304390717 | 42 | 57 | |||
| 4 | 6.2493173786 | 0.748680849 | 6.824577068 | 58 | 72 | |||
| 5 | 3.2332277751 | 0.346471642 | 7.593896164 | 48 | 66 |
| Avg_Arrival | AvgWait_Nurse | AvgWait_Ped | AvgWait_MD | Treated_Child | Treated_Adult |
|---|---|---|---|---|---|
| 8/hour | 4.594 | 0.486 | 11.417 | 51.4 | 55.2 |
| 10/hour | 8.070 | 0.403 | 35.167 | 51.4 | 84.2 |
| 12/hour | 14.961 | 0.277 | 71.328 | 51.4 | 101 |
| 15/hour | 36.630 | 0.246 | 126.101 | 51.4 | 122.8 |
| Num Nurses | Num MDs | Num Peds | Replicates | AvgWait_Nurse | AvgWait_Ped | AvgWait_MD | Treated_Child | Treated_Adult |
|---|---|---|---|---|---|---|---|---|
| 2 | 2 | 3 | 5 | 36.630793431 | 0.246454666 | 126.1016082 | 51.4 | 122.8 |
| 1 | 35.065351482 | 0.132051062 | 87.58132401 | 53 | 115 | |||
| 2 | 54.166290379 | 0.143129240 | 165.5447846 | 56 | 138 | |||
| 3 | 11.778215357 | 0.287797270 | 101.0748635 | 42 | 113 | |||
| 4 | 62.881467827 | 0.240439458 | 141.4930868 | 58 | 131 | |||
| 5 | 19.262642110 | 0.428856304 | 134.8139818 | 48 | 117 | |||
| 2 | 3 | 3 | 5 | 36.630793431 | 0.246454666 | 11.43105992 | 51.4 | 122.8 |
| 1 | 35.065351482 | 0.132051062 | 5.496669125 | 53 | 115 | |||
| 2 | 54.166290379 | 0.143129240 | 23.03052886 | 56 | 138 | |||
| 3 | 11.778215356 | 0.287797270 | 10.15426507 | 42 | 113 | |||
| 4 | 62.881467827 | 0.240439455 | 6.088315225 | 58 | 131 |
| Experiment #1 No Emergency |  1-1 (for a Nurse) |  1-2 (for a Ped) | 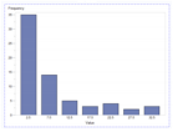 1-3 (for a MD) |
| Experiment #2 (Scenario 1): Zika Virus outbreak with no additional staffing | 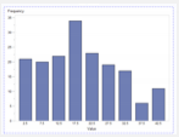 2-1 (for a Nurse) | 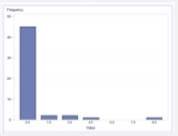 2-2 (for a Ped) | 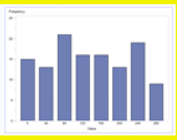 2-3 (for a MD) |
| Experiment #2 (Scenario 2): Zika Virus outbreak with additional staffing |  3-1 (for a Nurse) |  3-2 (for a Ped) |  3-3 (for a MD) |
© 2019 by the authors. Licensee MDPI, Basel, Switzerland. This article is an open access article distributed under the terms and conditions of the Creative Commons Attribution (CC BY) license (http://creativecommons.org/licenses/by/4.0/).
Share and Cite
Popova Zhuhadar, L.; Thrasher, E. Data Analytics and Its Advantages for Addressing the Complexity of Healthcare: A Simulated Zika Case Study Example. Appl. Sci. 2019, 9, 2208. https://doi.org/10.3390/app9112208
Popova Zhuhadar L, Thrasher E. Data Analytics and Its Advantages for Addressing the Complexity of Healthcare: A Simulated Zika Case Study Example. Applied Sciences. 2019; 9(11):2208. https://doi.org/10.3390/app9112208
Chicago/Turabian StylePopova Zhuhadar, Lily, and Evelyn Thrasher. 2019. "Data Analytics and Its Advantages for Addressing the Complexity of Healthcare: A Simulated Zika Case Study Example" Applied Sciences 9, no. 11: 2208. https://doi.org/10.3390/app9112208
APA StylePopova Zhuhadar, L., & Thrasher, E. (2019). Data Analytics and Its Advantages for Addressing the Complexity of Healthcare: A Simulated Zika Case Study Example. Applied Sciences, 9(11), 2208. https://doi.org/10.3390/app9112208