Article

A Full Coupled Thermal–Hydraulic–Chemical Model for Heterogeneity Rock Damage and Its Application in Predicting Water Inrush

1
State Key Laboratory of Mining Disaster Prevention and Control Co-founded by Shandong Province and the Ministry of Science and Technology, Shandong University of Science and Technology, Qingdao 266590, China
2
College of Mining and Safety Engineering, Shandong University of Science and Technology, Qingdao 266590, China
3
National Engineering Research Center of Coal Mine Water Hazard Control, China University of Mining and Technology, Beijing 100083, China
*
Author to whom correspondence should be addressed.
Appl. Sci. 2019, 9(11), 2195; https://doi.org/10.3390/app9112195
Submission received: 4 May 2019 / Revised: 17 May 2019 / Accepted: 22 May 2019 / Published: 29 May 2019
(This article belongs to the Section Chemical and Molecular Sciences)

Abstract

:
A coupled thermal–hydraulic–chemical (THC) model was carried out in this paper to study the influence of rock heterogeneity and the coupling effect of temperature, groundwater, and hydrochemistry on rock damage. Firstly, the hydrochemical and hydraulic erosion equations were established. The equations of the coupled THC model were established by combining the hydrochemical and hydraulic erosion equations, the flow equations, and the heat transfer equations. Weibull distribution was adopted to govern the heterogeneity of initial rock porosity distribution. Secondly, the influence of the hydrochemistry, the temperature and the initial porosity heterogeneity on porosity and fluid velocity change was studied. Then the rock damage rule changed with time at different pH values and temperature was studied. Finally, an actual deep coal mine model was established to apply the THC model to predict water inrush. Results indicate that: (1) The average porosity and average fluid velocity approximately show linear growth and exponential growth with time, respectively, and their growth rates increase with decreasing pH value and increasing temperature in a certain acidity and temperature range. (2) The increase of initial porosity heterogeneity has little influence on porosity change, but it can increase the fluid velocity growth rate. The porosity heterogeneity and fluid velocity heterogeneity approximately show exponential growth with increasing time, and the rock heterogeneity growth contributes to form cracks. The increase of temperature and decrease of pH value have little influence on the porosity heterogeneity, but they can increase the growth rate of the fluid velocity heterogeneity. (3) The rock damage shows linear growth with time, and its growth rate increases with decreasing pH value and increasing temperature in a certain acidity range and temperature range. (4) The increase of rock heterogeneity can increase the possibility of water inrush.

1. Introduction

As the shallow coal resource is increasingly exhausted in China, more and more coal resources will be mined in deep mines. The depth of deep mines is generally over 600 m. Mine water inrush means that groundwater in the aquifer flows into roadways or working face through the water flowing channels. Mine water inrush is a major threat to mine production safety. Predicting water inrush is an important measure to guarantee mine workers’ security. Water inrush is more likely to occur under the interaction of high ground temperature, high ground water pressure, high ground stress, and a complex hydrochemical environment in deep mines. The impact of a single factor of high temperature [1], water pressure [2], or hydrochemistry [3] has great influence on rock properties, and their coupled processes will have a greater and more complex influence on rock properties. Therefore, it is necessary to study the coupled thermal–hydraulic–chemical (THC) effect on rock damage to predict water inrush. The framework of international projects like DEvelopment of COupled models and their VALidation against EXperiment (DECOVALEX) have dramatically promoted the study of the thermal–hydraulic–mechanical (THM) coupling process [4,5]. Based on the mass, energy and momentum conservation, and number of experiments, these researches have made great progress in the combined effect of fluid flow and heat transfer on rock or soil properties [6,7,8,9]. For instance, Xiao et al. [8] developed a THM coupling model to simulate the combined effect of fracture fluid flow and heat transfer on matrix stability and shearing dilation behaviors. Based on these models and experiments, the rock damage rule was applied to deep mining and predicting water inrush [10,11]. In recent years, considering the hydrochemical erosion, the research on coupled hydraulic–mechanical (HC) [12], THC [13], mechanical–hydraulic–mechanical (MHC) [14,15] and thermal–hydraulic–mechanical–chemical (THMC) [16,17,18,19] effect on rock damage has made great progress. For instance, Bond et al. [19] presented a study that included 2D and 3D high-resolution coupled thermo–hydro–mechanical–chemical models to study the impact of complex physical and chemical processes on the geological formation surrounding the nuclear waste disposal facility. However, the rock properties were generally homogeneous in previous multi-physics coupling works especially in coupled THC numerical simulation models. A series of research results have indicated that rock heterogeneity has a great influence on rock damage. In an inhomogeneous vesicle size, the microcracks grow from the largest vesicles [20]. The heterogeneity has a great influence on rock failure mode, and the complexity of crack propagation increases with increasing rock heterogeneity [21]. Therefore, it is necessary to establish a multi-physics coupling model for heterogeneity rock. Before this, a kind of method should be found to govern the rock heterogeneity. In recent years, Weibull distribution is usually adopted to govern the rock heterogeneity [22,23,24,25]: Zhu et al. [23] used Weibull distribution to describe rock heterogeneity and discerned that the homogeneity index was the most important factor to simulate material failure; Wang et al. [24] assumed that rock parameters follow Weibull distribution and proposed a time-dependent creep model to study time-dependent creep behavior of heterogeneous brittle rocks; Zheng et al. [25] adopted Weibull statistical distribution to assign rock heterogeneity to find an effective method to increase gas drainage efficiency. Therefore, in the process of establishing a multi-physics coupling model for heterogeneity rock, Weibull distribution can be adopted to govern the rock heterogeneity.
In summary, rock heterogeneity has a great influence on rock damage, but the rock properties were generally homogeneous in previous multi-physics coupling works especially in multi-physics coupling numerical simulation models. Meanwhile, the rock of aquifuge was also generally simulated by homogeneous material in previous models for predicting water inrush, which could make mining engineers underestimate the rock damage degree and the danger degree of water inrush. The aquifuge is a kind of rock matrix which neither transmits nor stores water, and is located between the coal seam and aquifer, which prevents groundwater from the aquifer from flowing into the coal seam. In view of this, a coupled thermal–hydraulic–chemical (THC) model is carried out in this paper to study the influence of rock heterogeneity and the coupling effect of temperature, groundwater, and hydrochemistry on rock damage. Weibull distribution is adopted to govern the heterogeneity of initial rock porosity distribution. Considering the chemical reaction between the solid skeleton and the fluid, the porous rock is viewed as a four-phase medium consisting of solid skeleton, fluid, the fluidized solids from hydraulic erosion and the fluidized solids from chemical erosion. The equations of the coupled THC model consist of the hydrochemical and hydraulic erosion equations, the flow equations, and the heat transfer equations. Two kinds of numerical models are established. One is a cylinder model, with a size of φ50 × 100 mm, the standard specimens size that rock uniaxial and triaxial compression tests usually adopt. The other one is an actual deep coal mine model. The cylinder model is established to study the basic behavior of coupled THC processes for heterogeneity rock damage. The actual deep coal mine model is established based on the results of the basic behavior to predict water inrush of coal seam 15 of the Huatai coal mine, a deep coal mine in China. These models show the change rule of rock heterogeneity, which indicates the influence of hydrochemistry, temperature, and the initial porosity heterogeneity on porosity and fluid velocity change, and reveals that heterogeneity has an important influence on rock damage. These findings could provide a new understanding of the impact of rock heterogeneity on rock damage for related researchers and make mining engineers heighten their vigilance to the dangers of water inrush induced by rock heterogeneity in an aquifuge.

2. The Equations of Coupled THC Model

Considering the chemical reaction between the solid skeleton and the fluid, the porous rock is viewed as a four-phase medium, and the hydrochemical and hydraulic erosion equations are established based on this four-phase medium. The equations of the coupled THC model consist of the hydrochemical and hydraulic erosion equations, the flow equations, and the heat transfer equations.

2.1. The Hydrochemical and Hydraulic Erosion Equation

According to the previous research [26], the porous rock was viewed as a three-phase medium consisting of solid skeleton, fluid, and fluidized solids. The fluidized solids came from the solid skeleton and generated due to the hydraulic erosion. However, the contribution of hydrochemical erosion to the fluidized solids was not considered and the chemical reaction between the solid skeleton and the fluid should be considered. Therefore, the fluidized solids are divided into two parts including the fluidized solids from hydraulic erosion and the fluidized solids from chemical erosion. Based on this four-phase medium, the establishment process of the hydrochemical and hydraulic erosion equation is as follows.

2.1.1. Basic Equations

The porosity and the volume fraction of the fluidized solids are defined as
ϕ = V p V = V f + V h s + V c s V
c h = V h s V p = V h s V f + V h s + V c s
c c = V c s V p = V c s V f + V h s + V c s
where ϕ is the porosity of the porous rock; V , V p , V f , V h s and V c s are the volume of the porous rock, pore, fluid, the fluidized solids from hydraulic erosion, and the fluidized solids from chemical erosion, respectively, m3, in which the volume of the fluidized solids from hydraulic erosion and chemical erosion are actually the reduced volume of the solid skeleton due to hydraulic erosion and chemical erosion; c h and c c are the volume fraction of the fluidized solids from hydraulic erosion and the fluidized solids from chemical erosion, respectively.
Therefore, the equivalent densities of the four phases are defined as
ρ 1 = m s V = ρ s V s V = ρ s V V p V = ( 1 ϕ ) ρ s
ρ 2 = m f V = ρ f V f V = ρ f ϕ V V h s V c s V = ( 1 c h c c ) ϕ ρ f
ρ 3 = m h s V = ρ s V h s V = c h ϕ ρ s
ρ 4 = m c s V = ρ s V c s V = c c ϕ ρ s
where ρ 1 , ρ 2 , ρ 3 and ρ 4 are the equivalent density of the solid skeleton, fluid, the fluidized solids from hydraulic erosion, and the fluidized solids from chemical erosion, respectively, kg/m3; m s , m f , m h s and m c s are the mass of the solid skeleton, fluid, the fluidized solids from hydraulic erosion, and the fluidized solids from chemical erosion, respectively, kg; ρ s and ρ f are the solid density and fluid density, respectively, kg/m3; V s is the volume of the solid skeleton, m3.
The mass balance for the solid skeleton can be expressed as
ρ 1 t + ( ρ 1 v s k ) = I h r R
where v s k is the fluid velocity of the solid skeleton, m/s; I h r and R are the mass sources and sinks, kg/(m3·s), I h r represents the removed mass due to the hydraulic erosion here, and R represents the removed mass due to the chemical erosion here. R also represents the chemical reaction rate.
The mass balance for the fluidized solids from hydraulic erosion can be expressed as
ρ 3 t + ( ρ 3 v f s ) = I h p
where v f s is the fluid velocity of the fluidized solids from hydraulic erosion, m/s; I h p is the mass sources and sinks, kg/(m3·s), which represent the produced mass from the solid skeleton. Therefore,
I h r = I h p
According to the previous research [26],
v s k 0
c h ϕ v f s = λ ϕ , i
c h 1
where λ is the porosity diffusivity coefficient, m2/s.

2.1.2. Governing Equations

Substituting Equations (4) and (11) into Equation (8) can obtain
ϕ t = I h r ρ s + R ρ s
Substituting Equation (6) into Equation (9) can obtain
c h ϕ t + ( c h ϕ v f s ) = I h p ρ s
With Equations (10) and (12–14), Equation (15) becomes
ϕ t λ ϕ , i i = R ρ s
Equation (16) is the governing equation of the hydrochemical and hydraulic erosion.

2.2. The Flow Equation

The continuity equation for flow in porous medium is
t ( ϕ ρ f ) + ( ρ f v ) = Q s
The Darcy’s law is
v D = k μ ( p + ρ f g z )
where ρ f is the fluid density, kg/m3; v is the Darcy fluid velocity, m/s; k is the permeability, m2; μ is the fluid dynamic viscosity, N·s/m2; p is the fluid pressure, Pa; z is a unit vector in the vertical direction; g is the gravitational acceleration, m/s2; and Q s is the volumetric flow rate per unit volume of reservoir for a fluid source, 1/s.

2.3. The Heat Transfer Equation

According to the previous research [27], the thermal conductivity and thermal conductivity of porous medium are defined by an averaging model to account for both solid matrix and fluid properties, which are
k e f f = ( 1 ϕ ) k s + ϕ k f + k d
( ρ f c f ) e f f = ( 1 ϕ ) ρ s c s + ϕ ρ f c f
where k e f f is the effective thermal conductivity, W/(m·K); k s and k f are the thermal conductivity of solid matrix and fluid, respectively, W/(m·K); k d is the dispersion thermal conductivity, W/(m·K); ( ρ f c f ) e f f is the effective volumetric heat capacity, J/(m3·K); c s is the specific heat capacity of solid material in porous media, J/(kg·K); c f is the specific heat capacity of fluid, J/(kg·K).
If the dispersion thermal conductivity is not considered, Equation (19) becomes
k e f f = ( 1 ϕ ) k s + ϕ k f + k d
The governing equations of heat transfer for porous media are
( ρ f c f ) e f f T t + ρ f c f v T + q = Q
q = k e f f T
where T is the absolute temperature, K; q is the conductive heat flux, J/(s·m2), Q is the heat source or sink, W/K3.
In summary, the governing equation of hydrochemical and hydraulic erosion is Equation (16), the governing equations of fluid flow are Equations (17) and (18), and the governing equation of heat transfer is Equation (22).
Compared with the full coupled THMC processes reported by Othman [28], some of the coupled THMC processes and some new coupled processes are studied using the equations of the coupled THC model, as shown in Figure 1.

3. Numerical Model Setup

The coupled THC numerical model is established by using COMSOL Multiphysics 5.1 (COMSOL Co., Ltd., Shanghai, China). Porous rock is assumed to be a continuous medium. The fluid properties are assumed to be constant. The dispersion thermal conductivity is not considered. The porosity heterogeneity is adopted to describe the rock heterogeneity, and assumed to follow the Weibull distribution. The geometric model is a cylinder, with a size of φ50 × 100 mm, the standard specimens size that rock uniaxial and triaxial compression tests usually adopt. The bottom of the cylinder is applied fixed constraint, the side surface and top of the cylinder are applied boundary pressure to simulate the confining pressure and axial pressure, respectively. The bottom and top of the cylinder are applied to the inlet and outlet water pressure, respectively.
The probability density function of the Weibull distribution for initial porosity distribution is
ϕ i n = k w λ w ( ϕ i n λ ) k w 1 exp ( ( ϕ i n λ w ) k w )
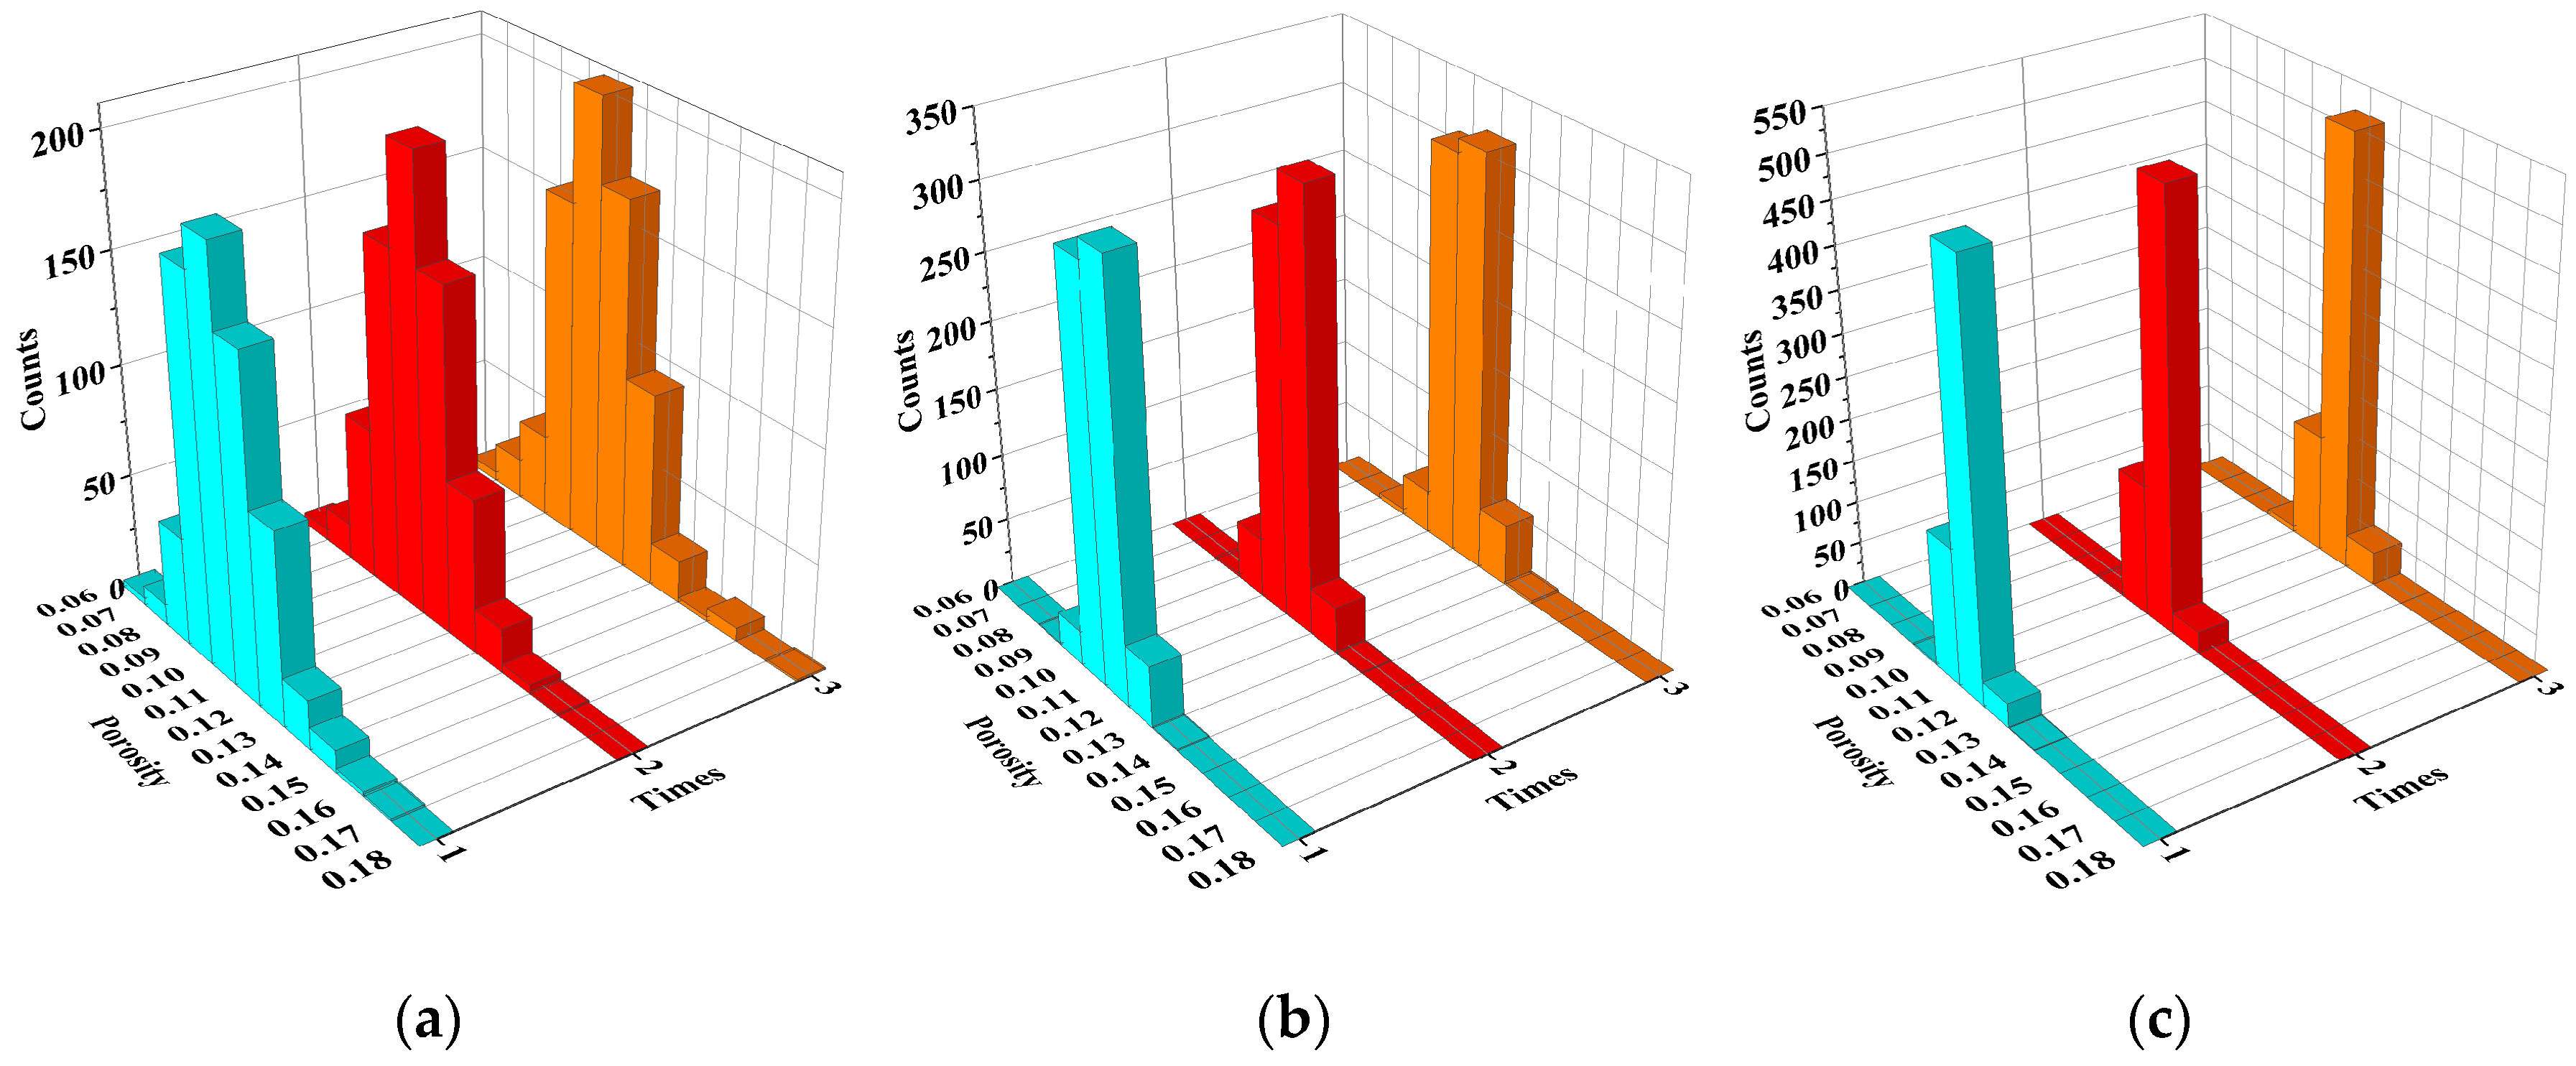
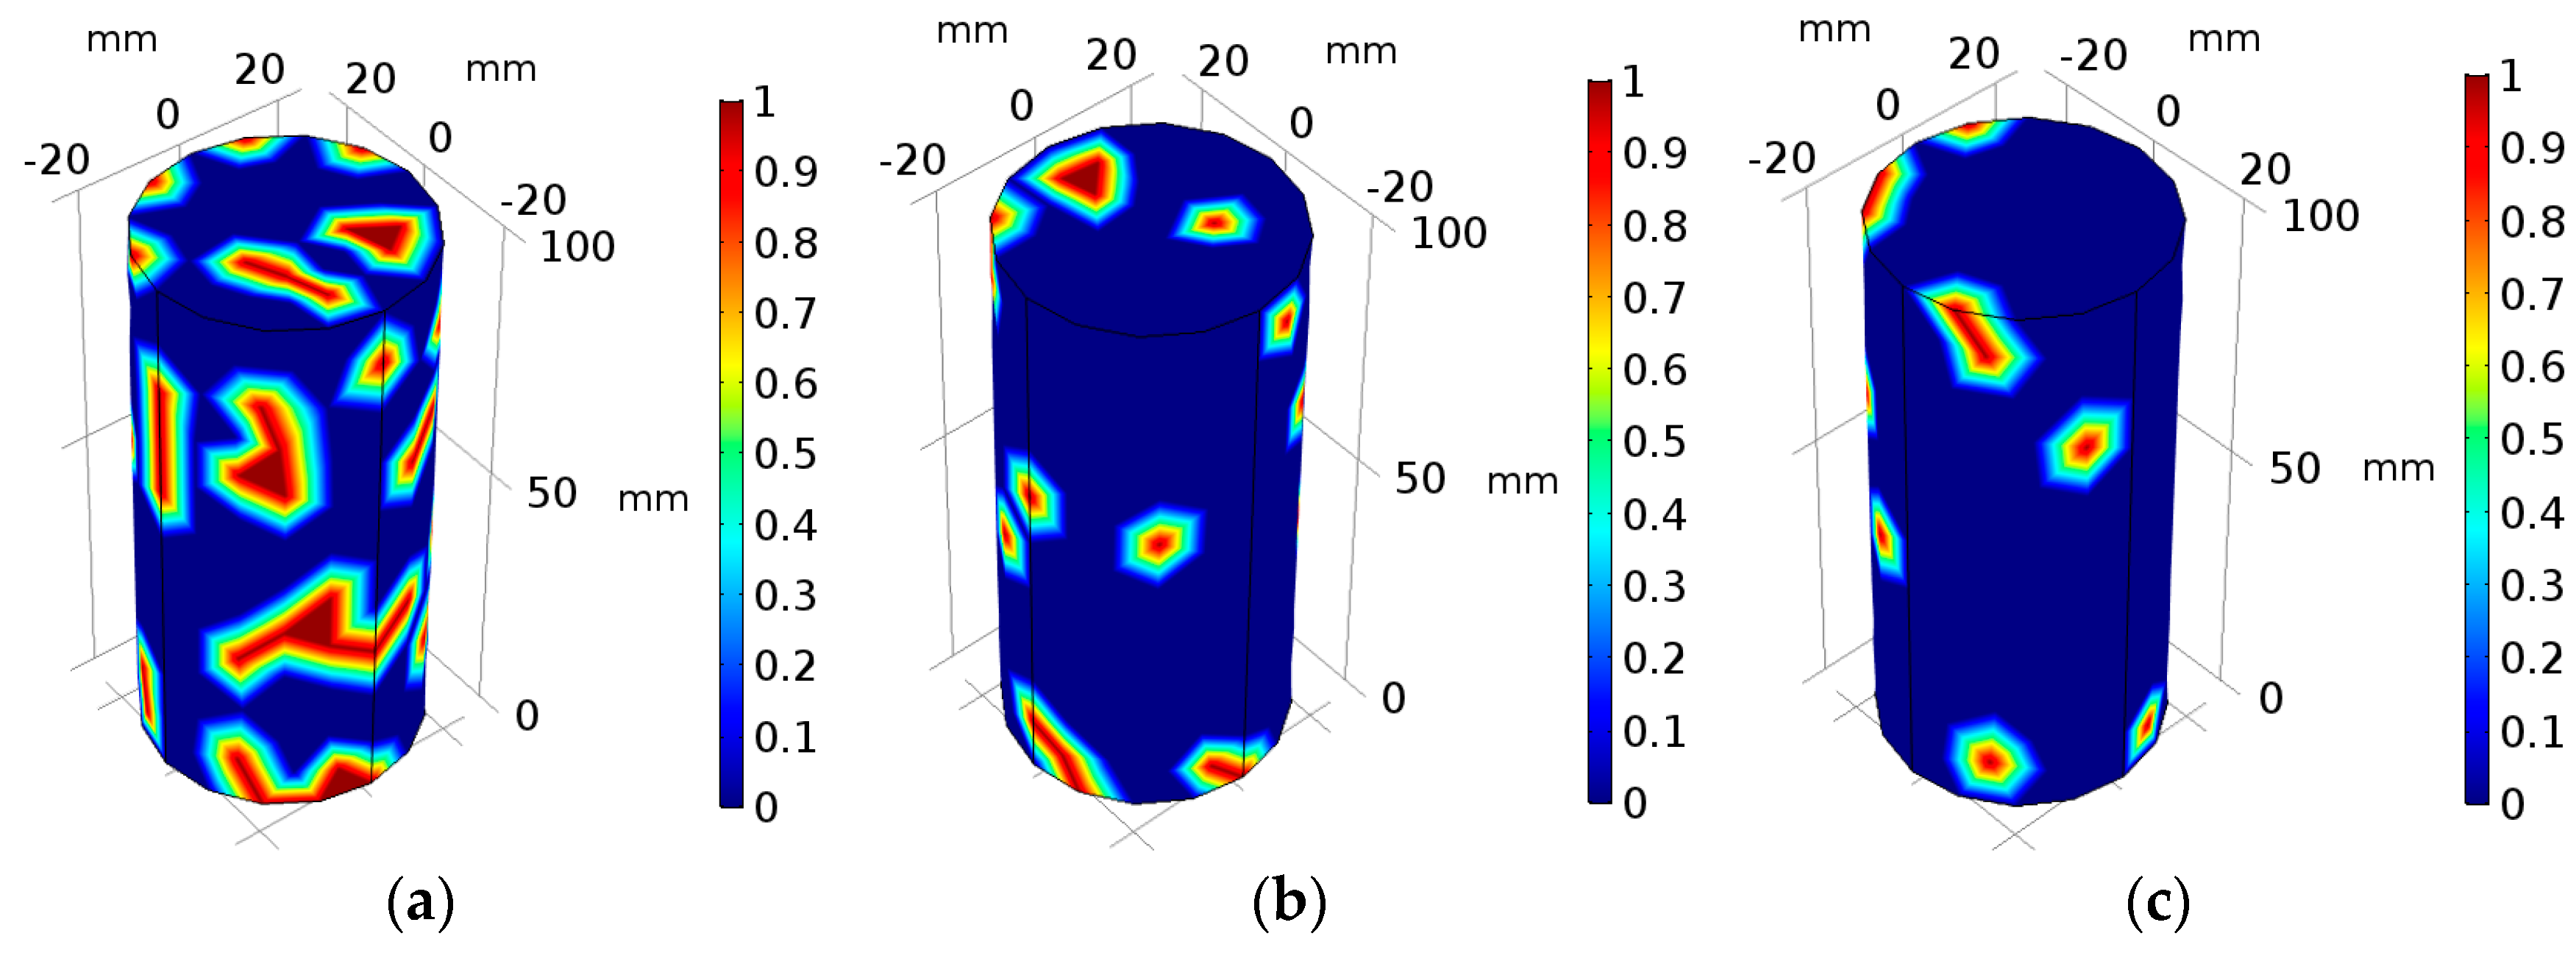
where λ w is the scale parameter, which governs the average porosity; k w is the shape parameter, which governs the porosity heterogeneity. The random numbers for Weibull distribution are generated by the external functions of COMSOL, then they are used to define the porosity in the material setting function of COMSOL. When λ w is 0.12, Figure 2 shows the initial porosity distribution at different shape parameters. Apparently, the porosity heterogeneity decreases with increasing the shape parameter. In addition, the computer time is the random number seeds, therefore, the calculation results of the random numbers for the Weibull distribution are different each time. Nevertheless, the number of points in a porosity range is approximately same at different times, as shown in Figure 3. More and more points concentrate around 0.11 with an increasing shape parameter, and all the average initial porosity values at different shape parameters and times are 0.11, which indicates that the scale parameter has no influence on the average porosity. Therefore, when the scale parameter is constant, setting different shape parameters can simulate the rocks that have the same average porosity but different heterogeneity.
The permeability is generally a function of porosity [26], which is
k = k c ϕ i n 3 ( 1 ϕ i n ) 2
where k c is a permeability parameter independent of the porosity of the rock, m2; ϕ i n is the initial porosity.
The model parameters are listed in Table 1. According to the previous research, the pH value of fluid and temperature have influence on the chemical reaction rate between the fluid and rock. However, there are various qualitative and quantitative analyses and different conclusions about the chemical reaction rate. In general, the chemical reaction rate increases with the decrease of the pH value of groundwater [29], and with the increase of the temperature, the chemical reaction rate increases at first and then decreases [3,30]. In this paper, according to [29,31], the chemical reaction rate increased by 3.06 × 10⁻⁶ kg/m3/s when the temperature increased by 1 °C, and increased 4.62 × 10⁻⁵ kg/m3/s when the pH value decreased by 1, and the chemical reaction rate was 6.97 × 10⁻⁵ kg/m3/s when the pH value was 6.6 and the temperature was 75 °C.

4. Results

Based on the above analysis, setting different temperatures, pH values, and shape parameters are used to study the impact of temperature, hydrochemistry, and rock heterogeneity on rock porosity, fluid velocity, rock cracks, and rock damage. Then the above model is computed using COMSOL, and the following results are obtained.

4.1. The Porosity

The influence of the hydrochemistry, the temperature and the initial porosity heterogeneity on porosity change is obtained in this section.

4.1.1. The Influence of Hydrochemistry

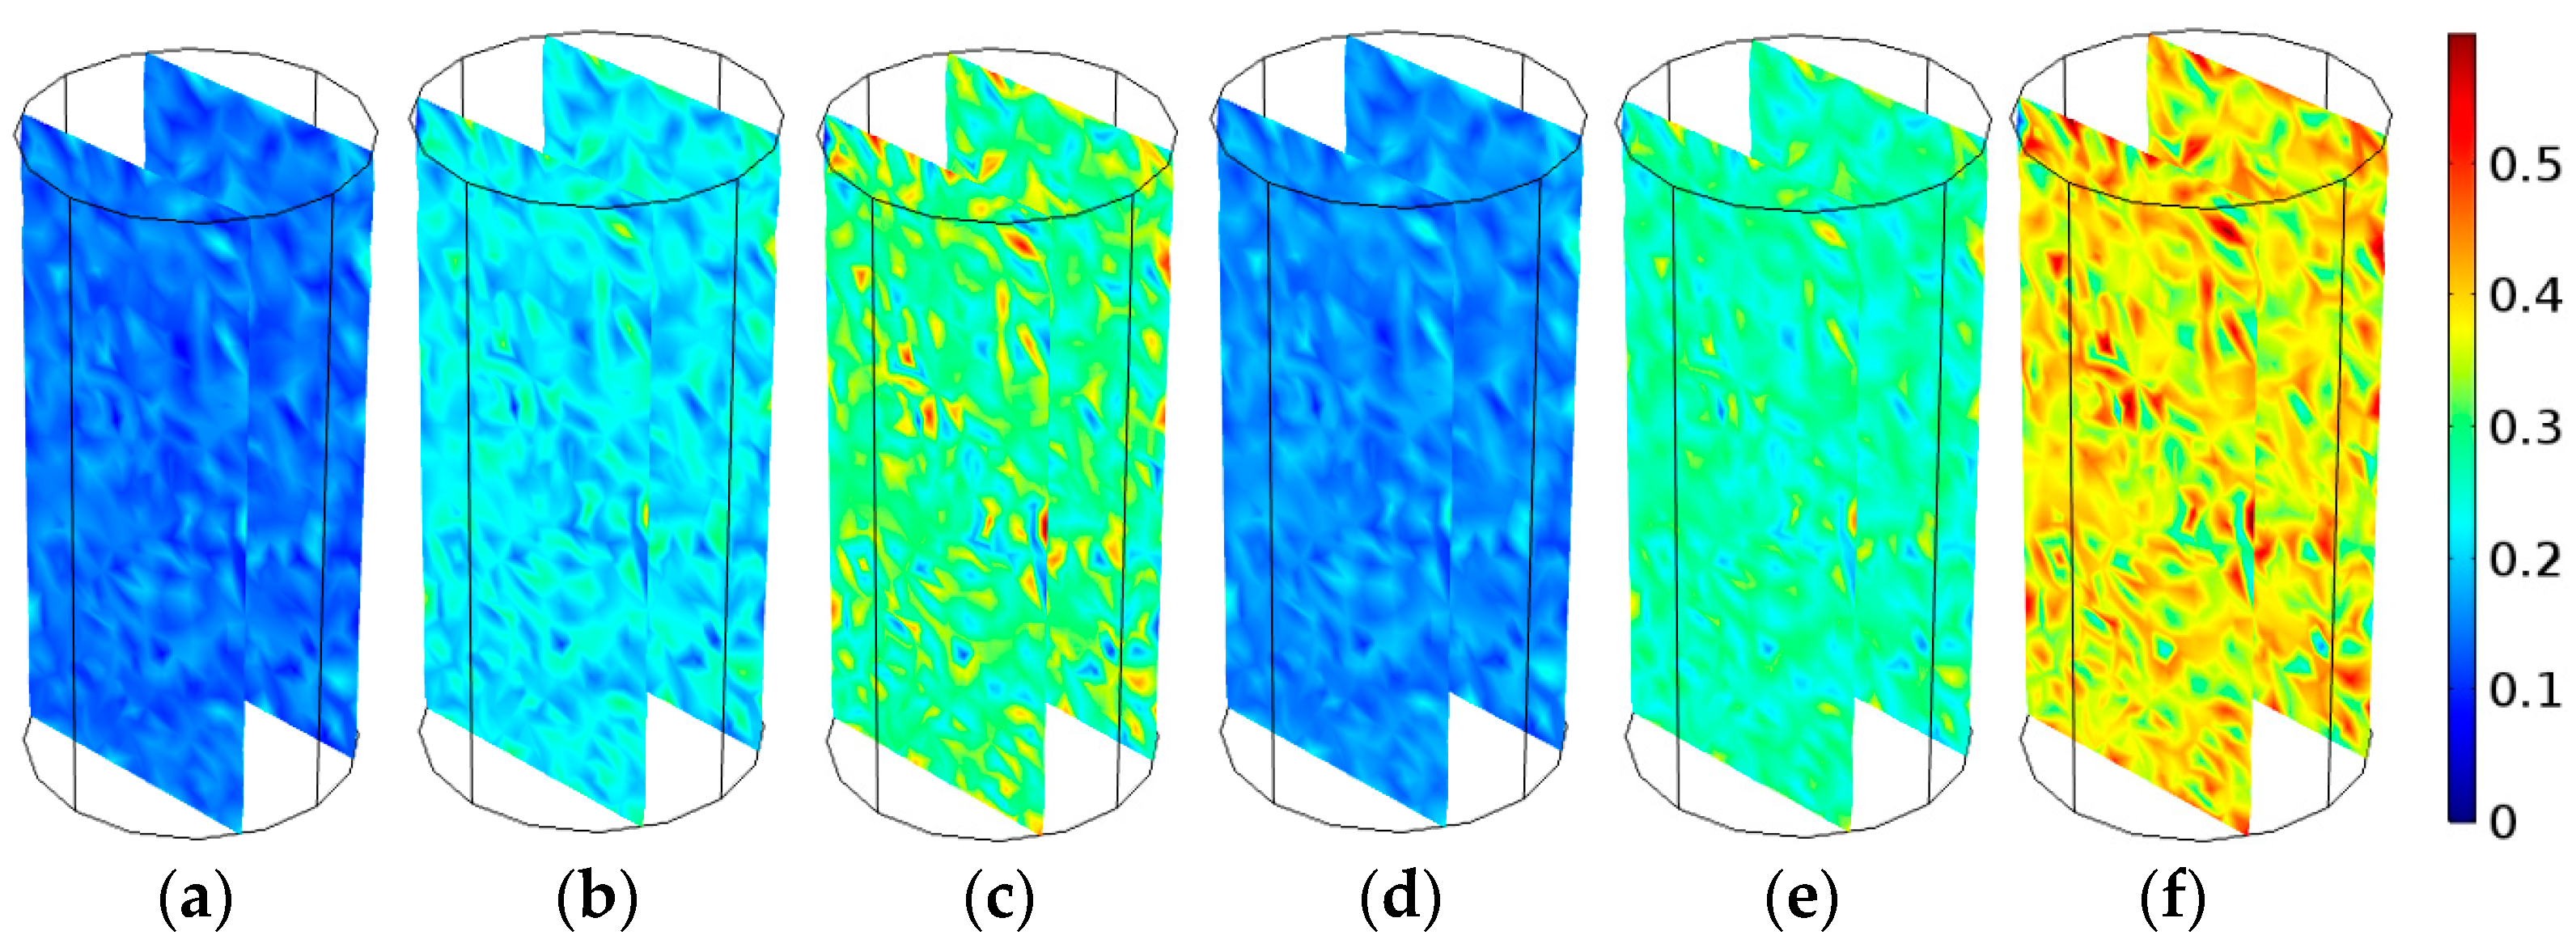
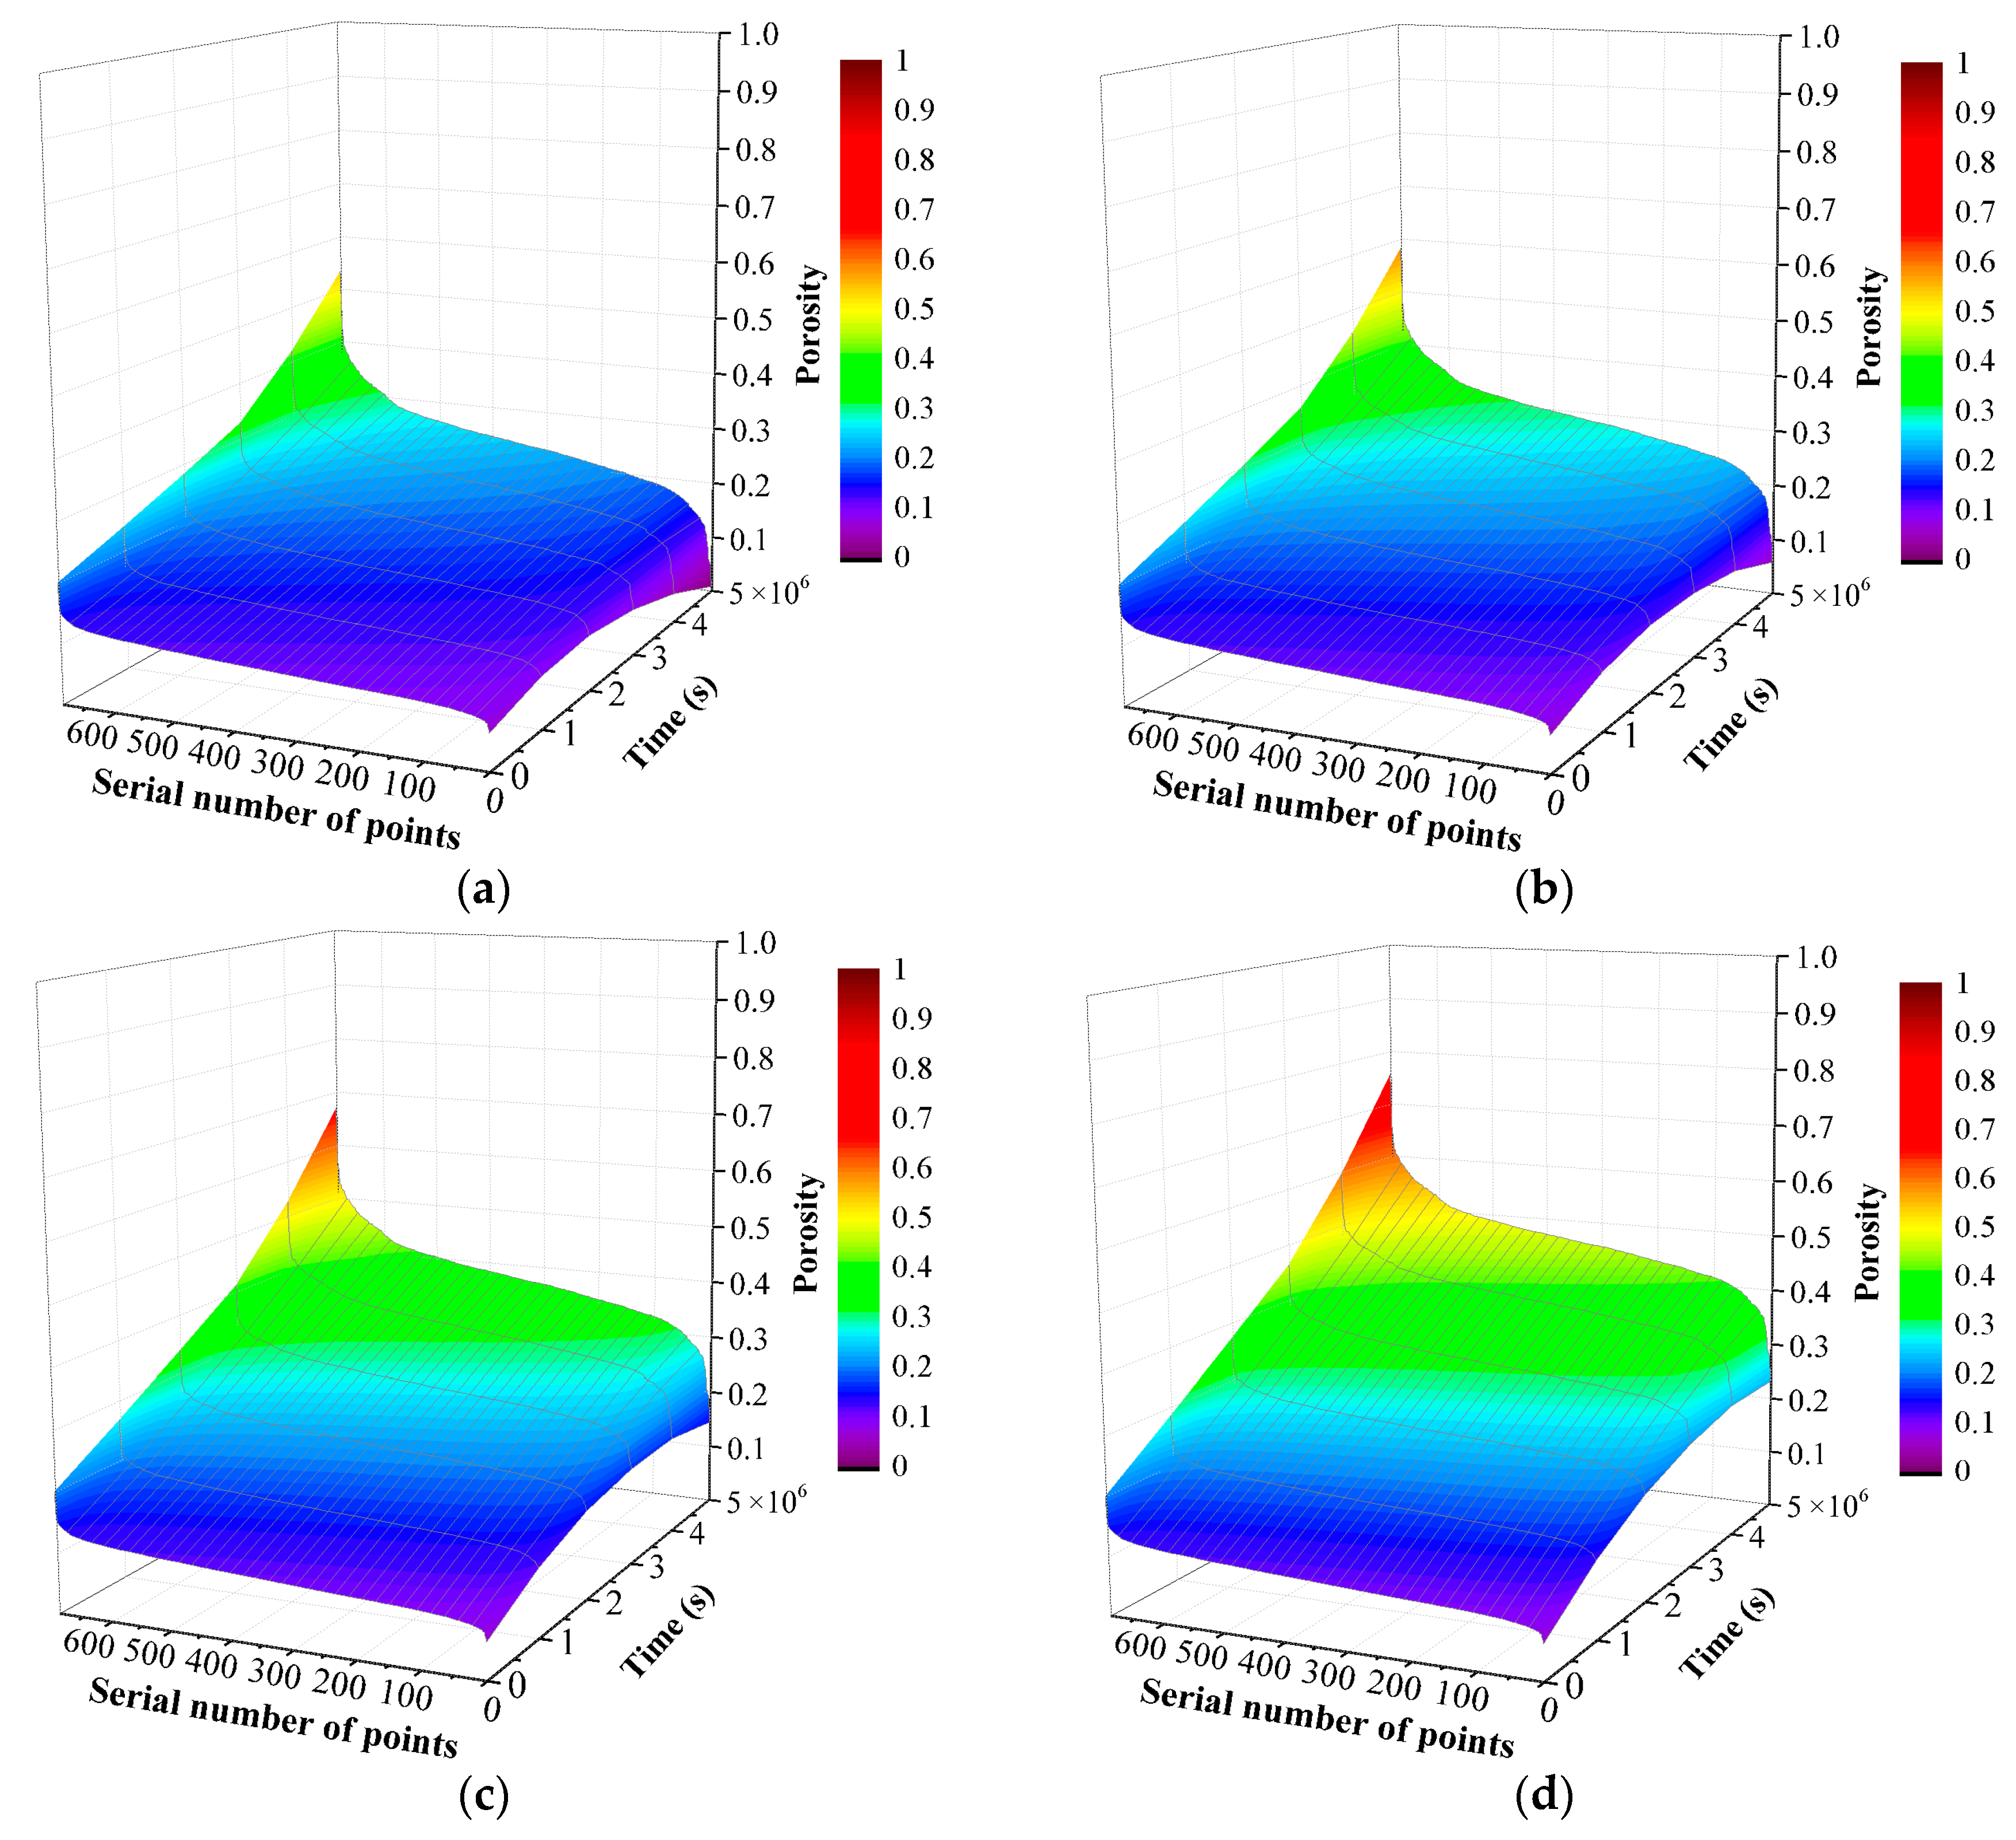
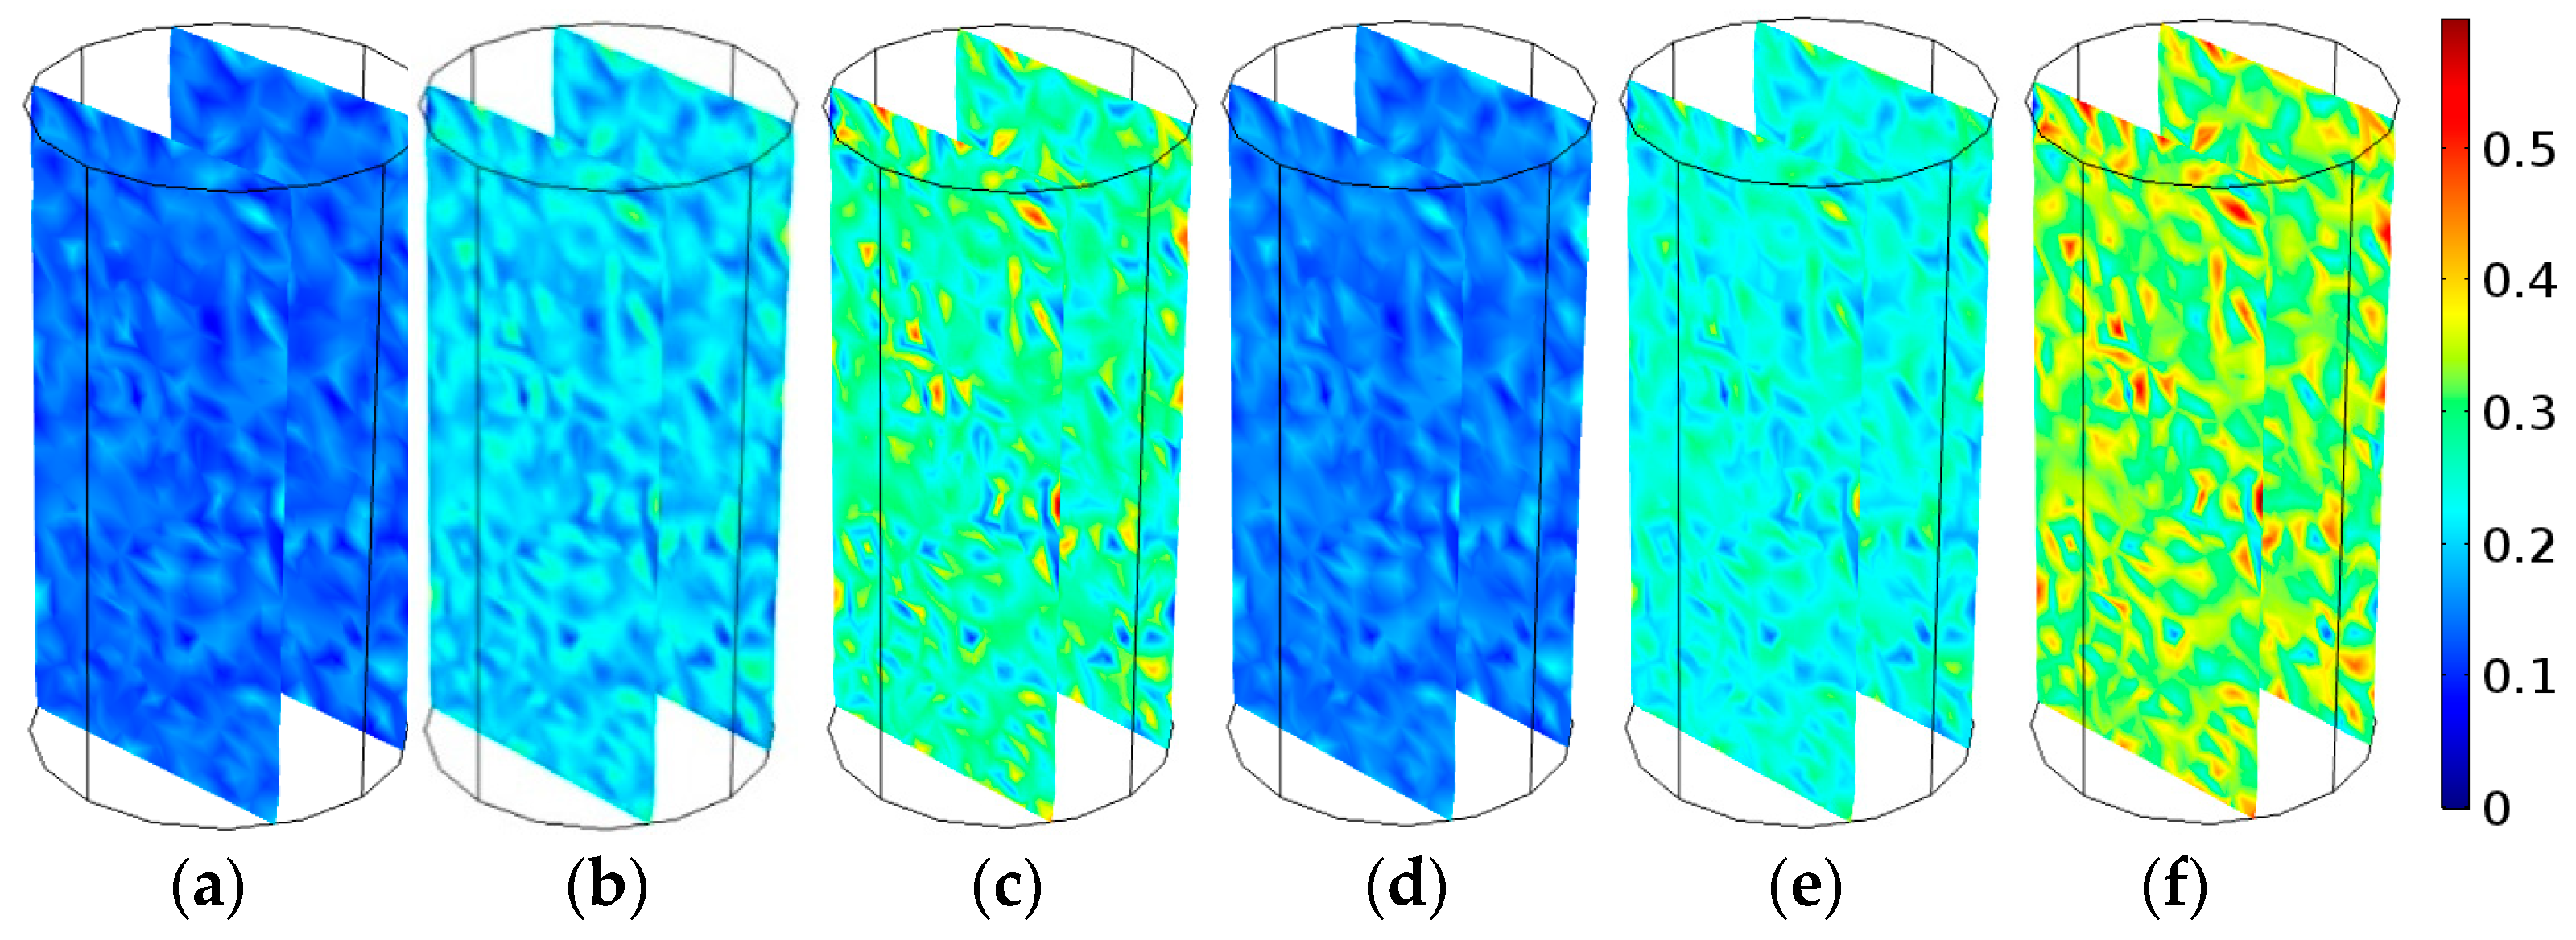
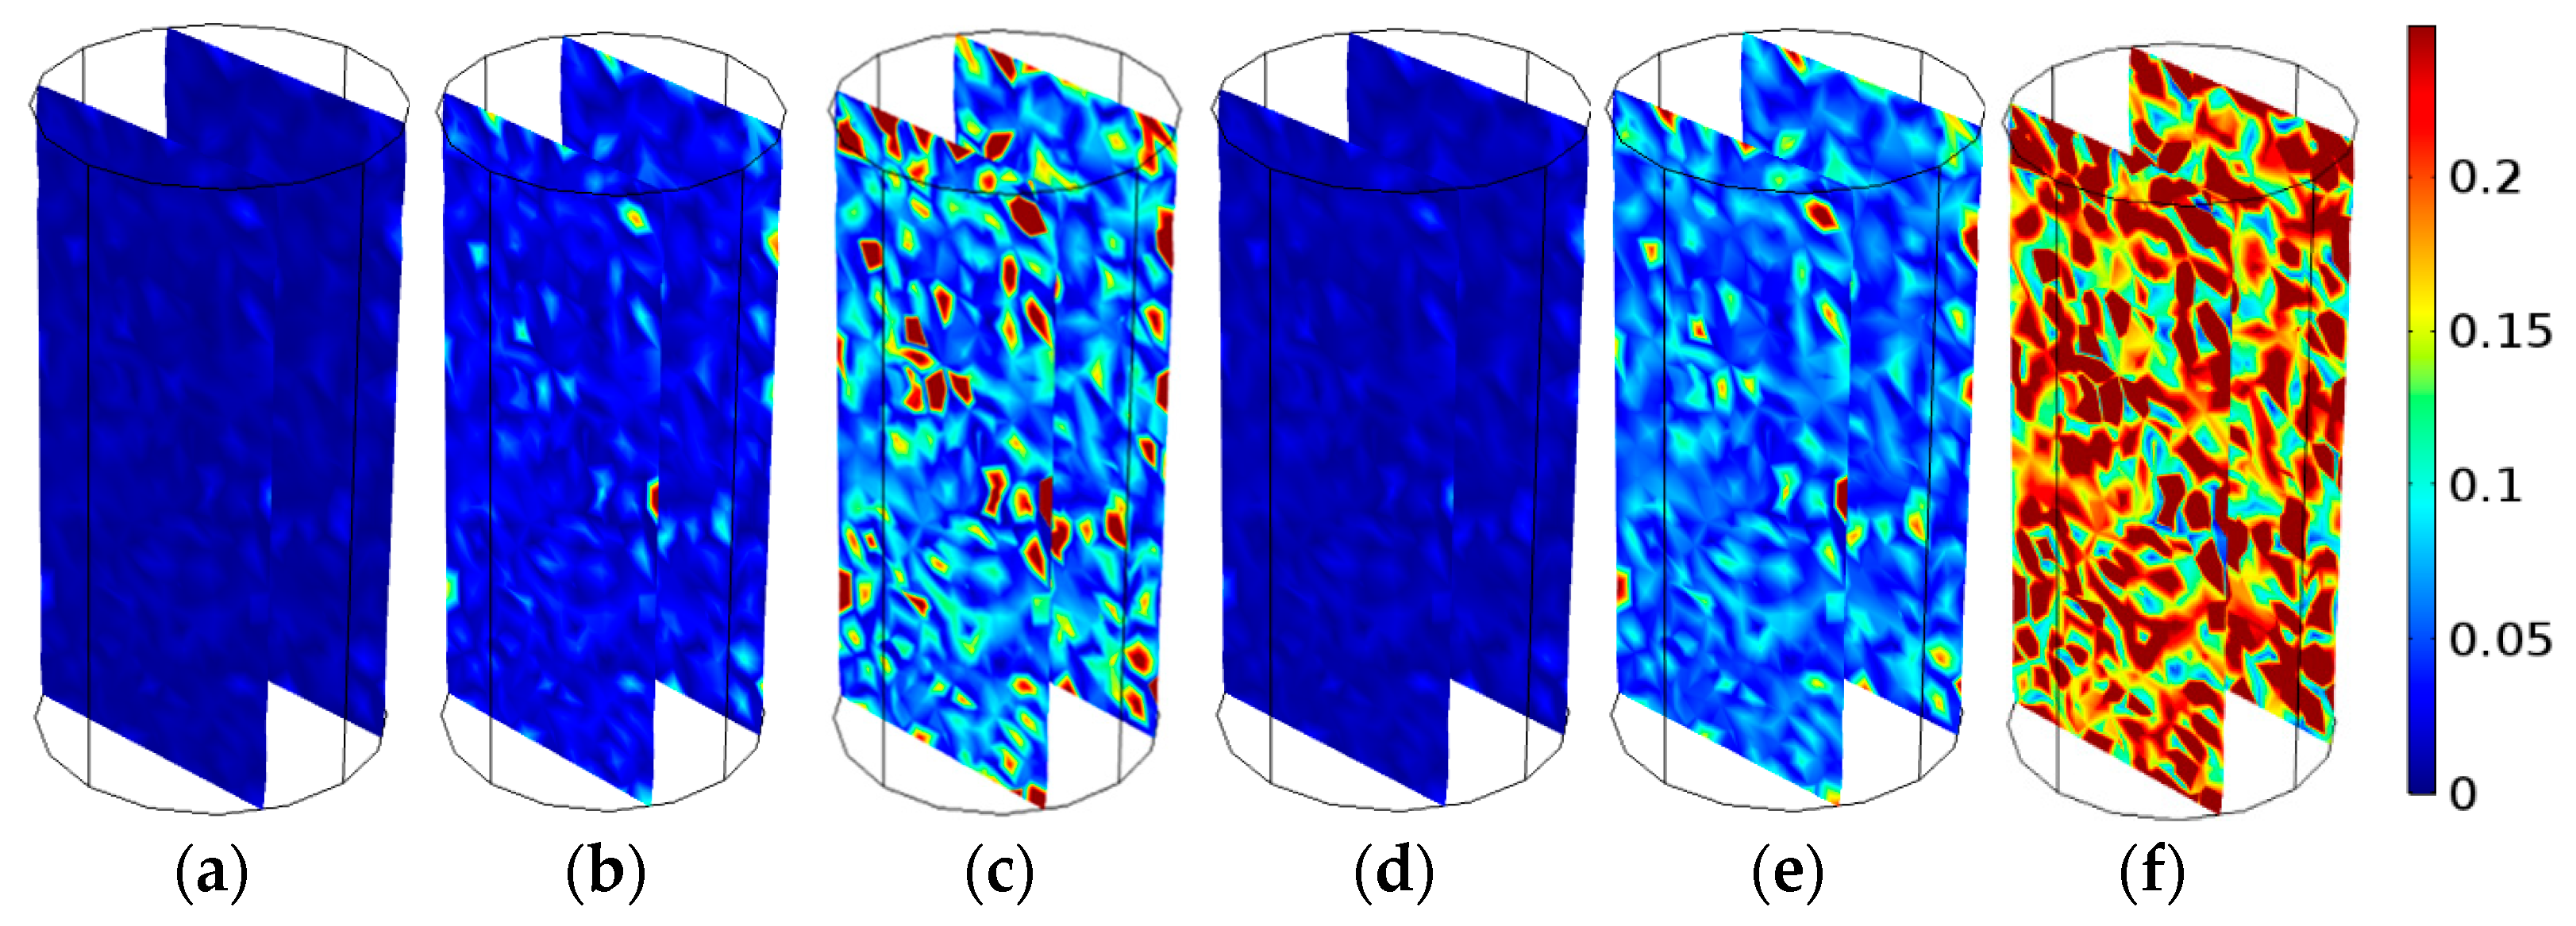
When k w is 2, T is 75 °C, the distribution of porosity at different pH values and time is shown in Figure 4 and Figure 5. In order to observe and analyze the porosity distribution conveniently, the porosity values at 692 points at each time step are sorted according to the ascending order in Figure 5. In these figures, the porosity values at most points increase with increasing time and pH value. Meanwhile, the difference between the minimum and maximum values of porosity at the 692 points increases with increasing time, which indicates that the heterogeneity of porosity increases with increasing time.
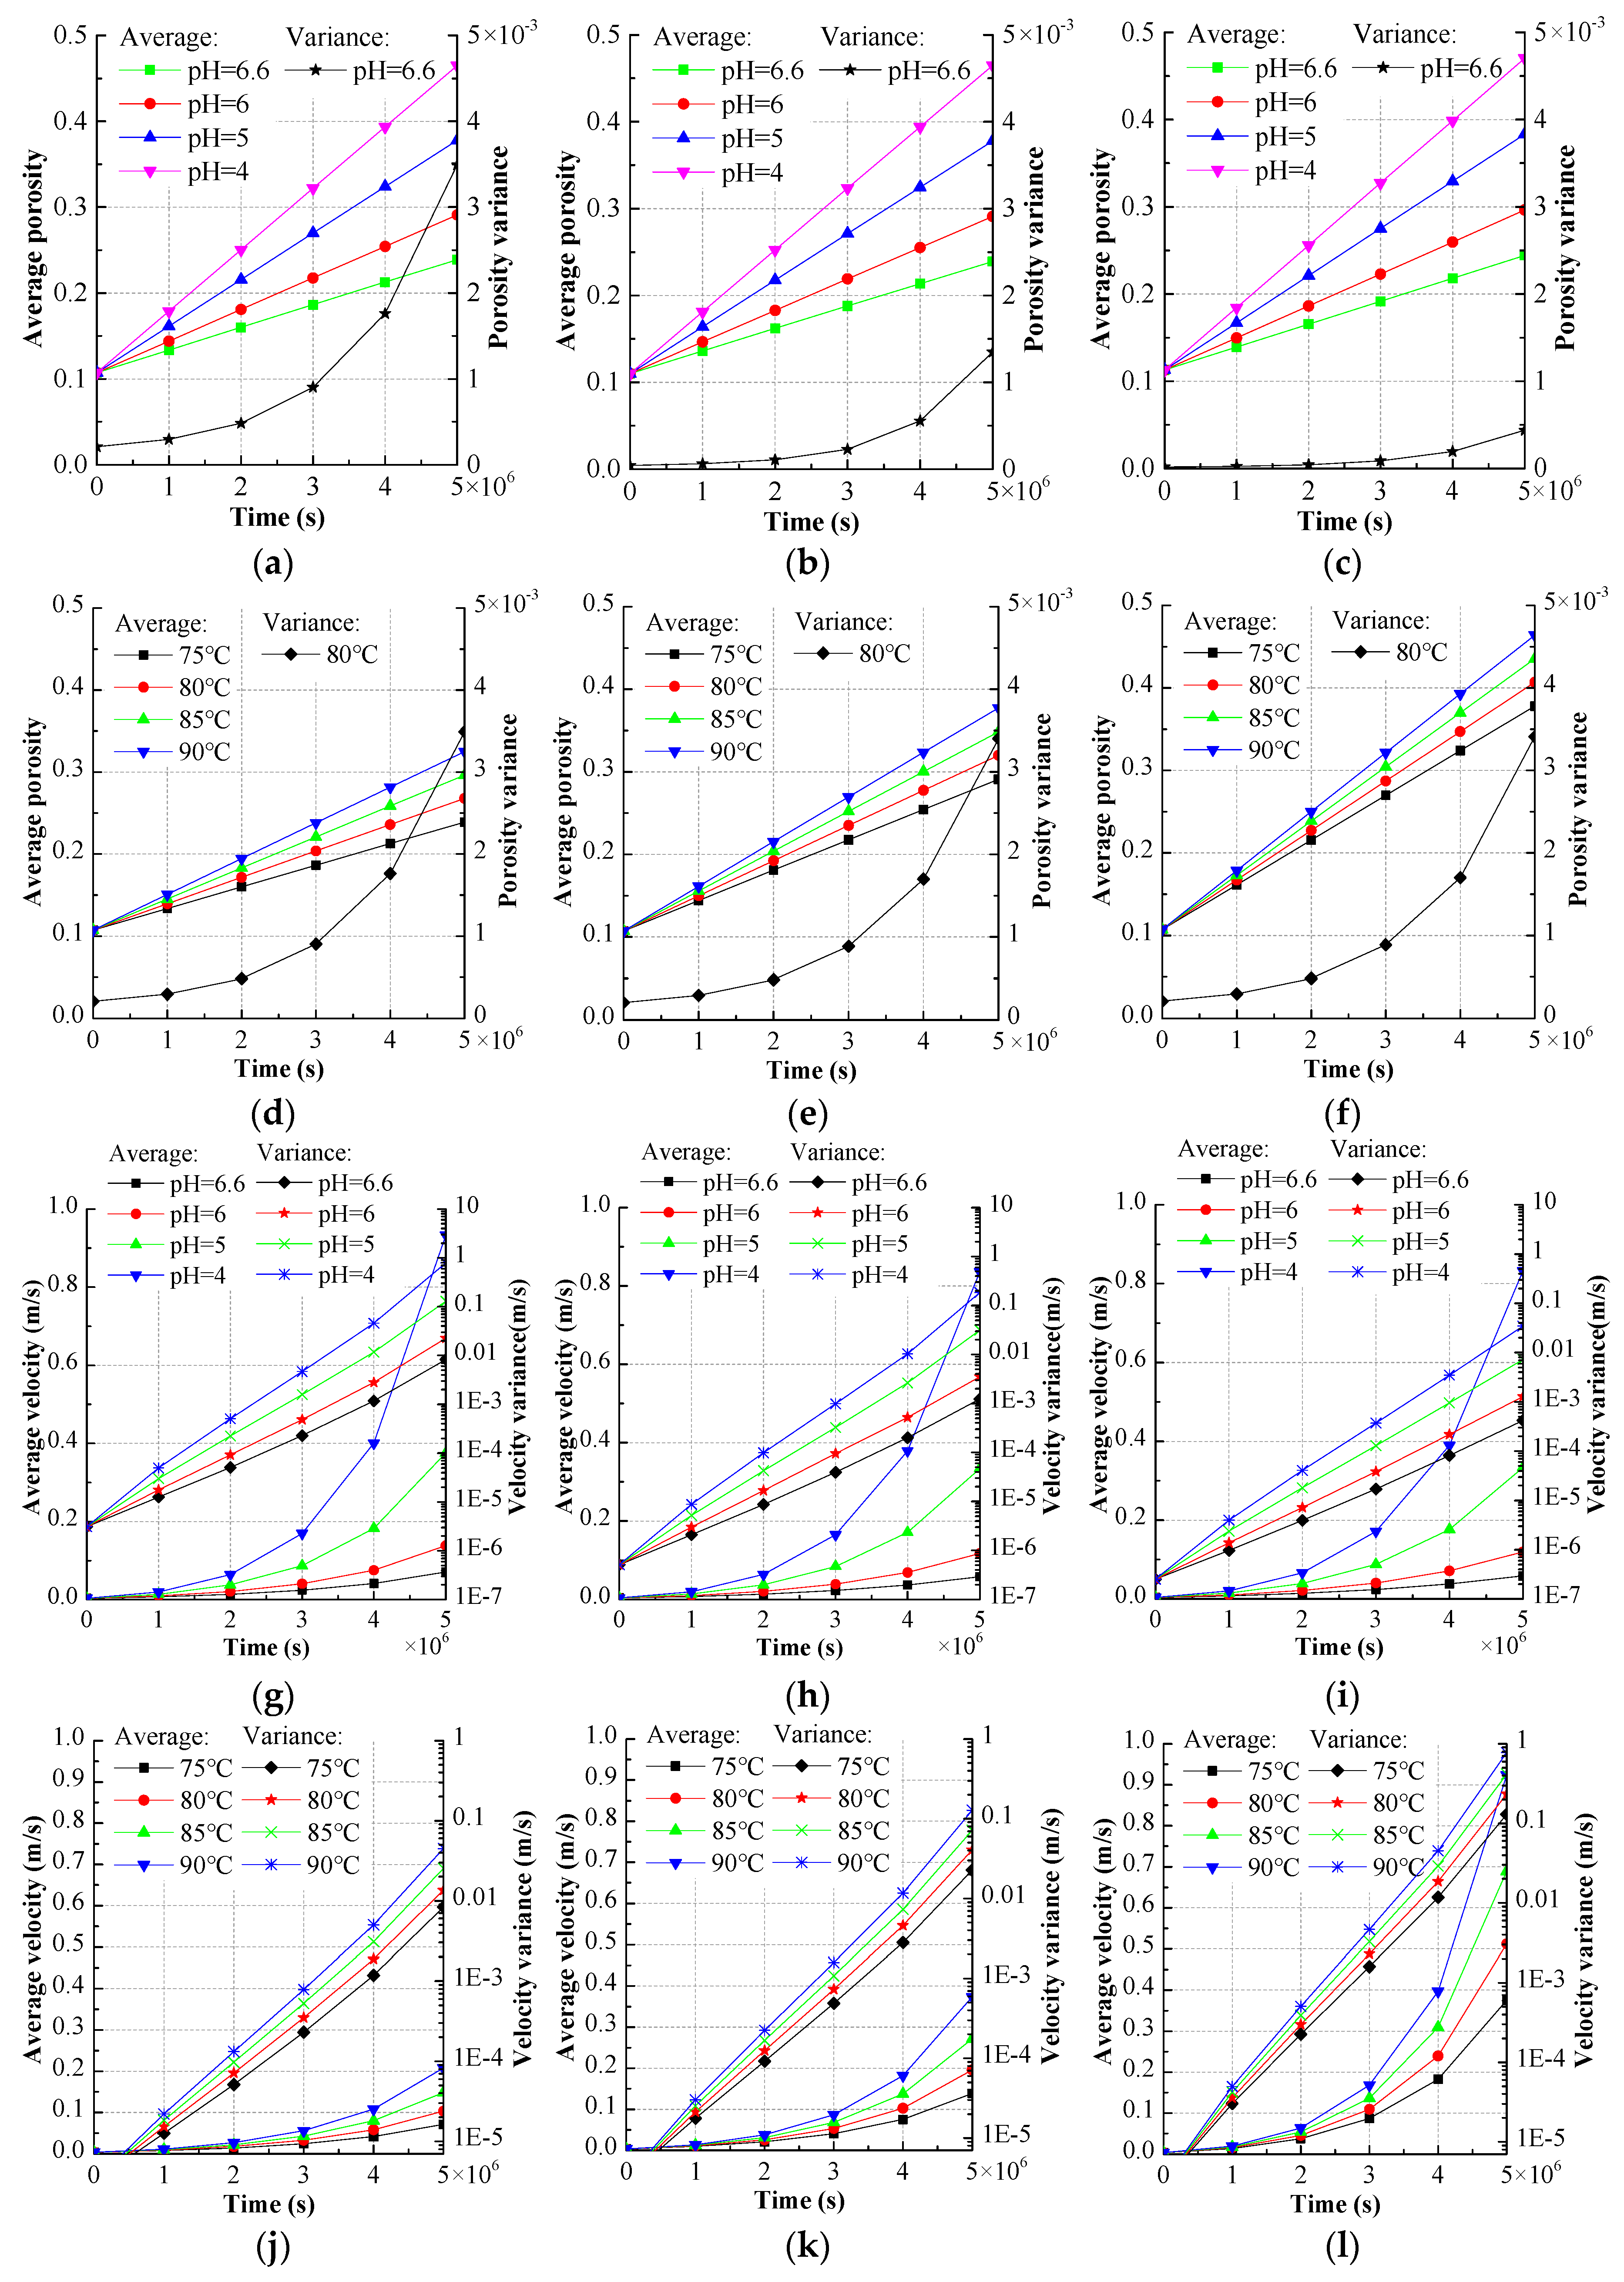
The average and variance of porosity and fluid velocity at the 692 points are shown in Figure 6. Figure 6a–c show the average porosity and porosity variance at different shape parameters. The variance change can reflect the porosity heterogeneity change. In this figure, the curves between average porosity and time are approximately straight lines, and their slopes increase with the increase of the pH value, which indicates that the increase of the pH value can increase the porosity growth rate. At different shape parameters, the curves have little change, which indicates that the heterogeneity of the initial porosity has little influence on porosity change. The porosity variance firstly experiences a slight then rapid increase, and approximately shows exponential growth with increasing time. Therefore, the rock heterogeneity increases with increasing time. In addition, by increasing the shape parameter, the increased range of the variance decreases. Specifically, after 5 × 10⁶ s, when the pH value was 6.6, and k w was 2, the variance increased from 2.09 × 10⁻⁴ to 3.49 × 10⁻³ (increased by 3.28 × 10⁻³); when k w was 5, the variance increased from 4.12 × 10⁻⁵ to 1.35 × 10⁻³ (increased by 1.31 × 10⁻³); when k w was 8, the variance increased from 1.77 × 10⁻⁵ to 4.37 × 10⁻⁴ (increased by 4.20 × 10⁻⁴). The porosity variance values at different pH values are listed in Table 2. As illustrated in this table, the pH value has little influence on the porosity variance change, which indicates that the pH value has little influence on rock heterogeneity change.
The porosity heterogeneity growth indicates that the porosity has an evolution of the polarity between 0 and 1. In order to better observe the cracks, it is assumed that the points with over 0.5 of porosity value can form the cracks. Figure 7 shows the distribution of porosity over 0.5 after 5 × 10⁶ s when k w is 2, 5, and 8. In this figure, the area formed by these points with porosity over 0.5 can be considered as the cracks. Regarding the porosity evolution of the polarity between 0 and 1, it can be considered that some pore sizes decrease and some increase. The points that trend to 1 of porosity value contribute to form cracks, which is corresponding to the results reported by Heap et al. [20]: in an inhomogeneous vesicle size, the microcracks grow from the largest vesicles. The cracks increase with a decreasing shape parameter, which indicates that the rock heterogeneity growth contributes to rock fracture and increases the complexity of cracks, and is corresponding to the results reported by Tang and Liu [21]: the heterogeneity has a great influence on rock failure mode, and the complexity of crack propagation increases with increasing rock heterogeneity.

4.1.2. The Influence of Temperature

When k w is 2, and the pH value is 6, the distribution of porosity at different a temperature and time is shown in Figure 8. This figure indicates that the porosity of most parts increases with increasing temperature and time in a certain temperature range. When k w is 2, the average porosity and porosity variance of the 692 points at different pH values and temperature are shown in Figure 7d–f. The curves between average porosity and time are straight lines, and their slopes increase with increasing temperature, which indicates that the increase of temperature can increase the porosity growth rate in a certain temperature range. The porosity variance approximately shows exponential growth with increasing time, and the temperature and pH value have little influence on the porosity variance change.

4.2. The Fluid

The influence of the hydrochemistry, the temperature, and the initial porosity heterogeneity on the fluid velocity is obtained in this section. Affected by the porosity change, the fluid velocity change rule is similar to the porosity change rule in some aspects, but there are still some differences between them in many aspects.

4.2.1. The Influence of Hydrochemistry

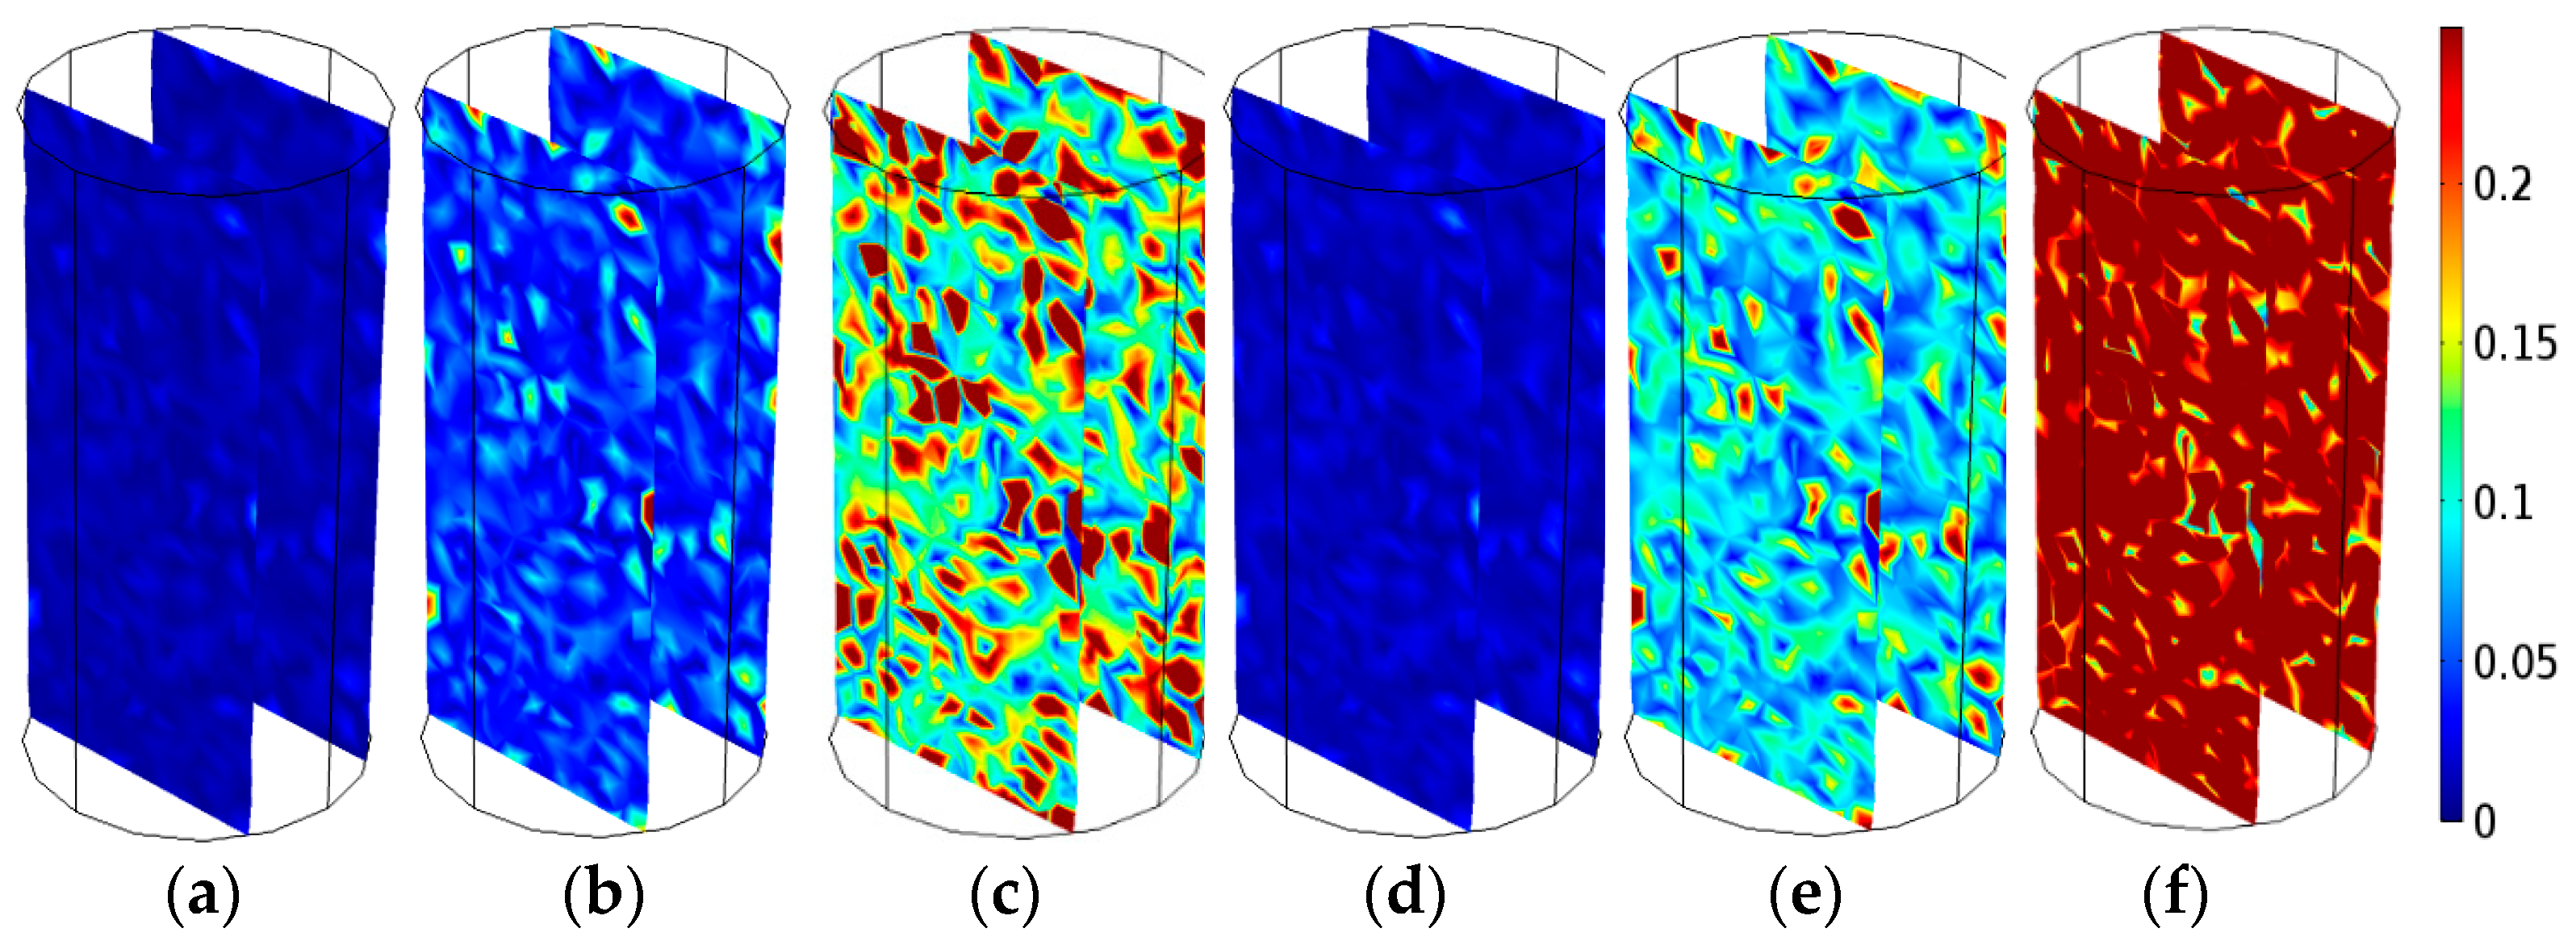
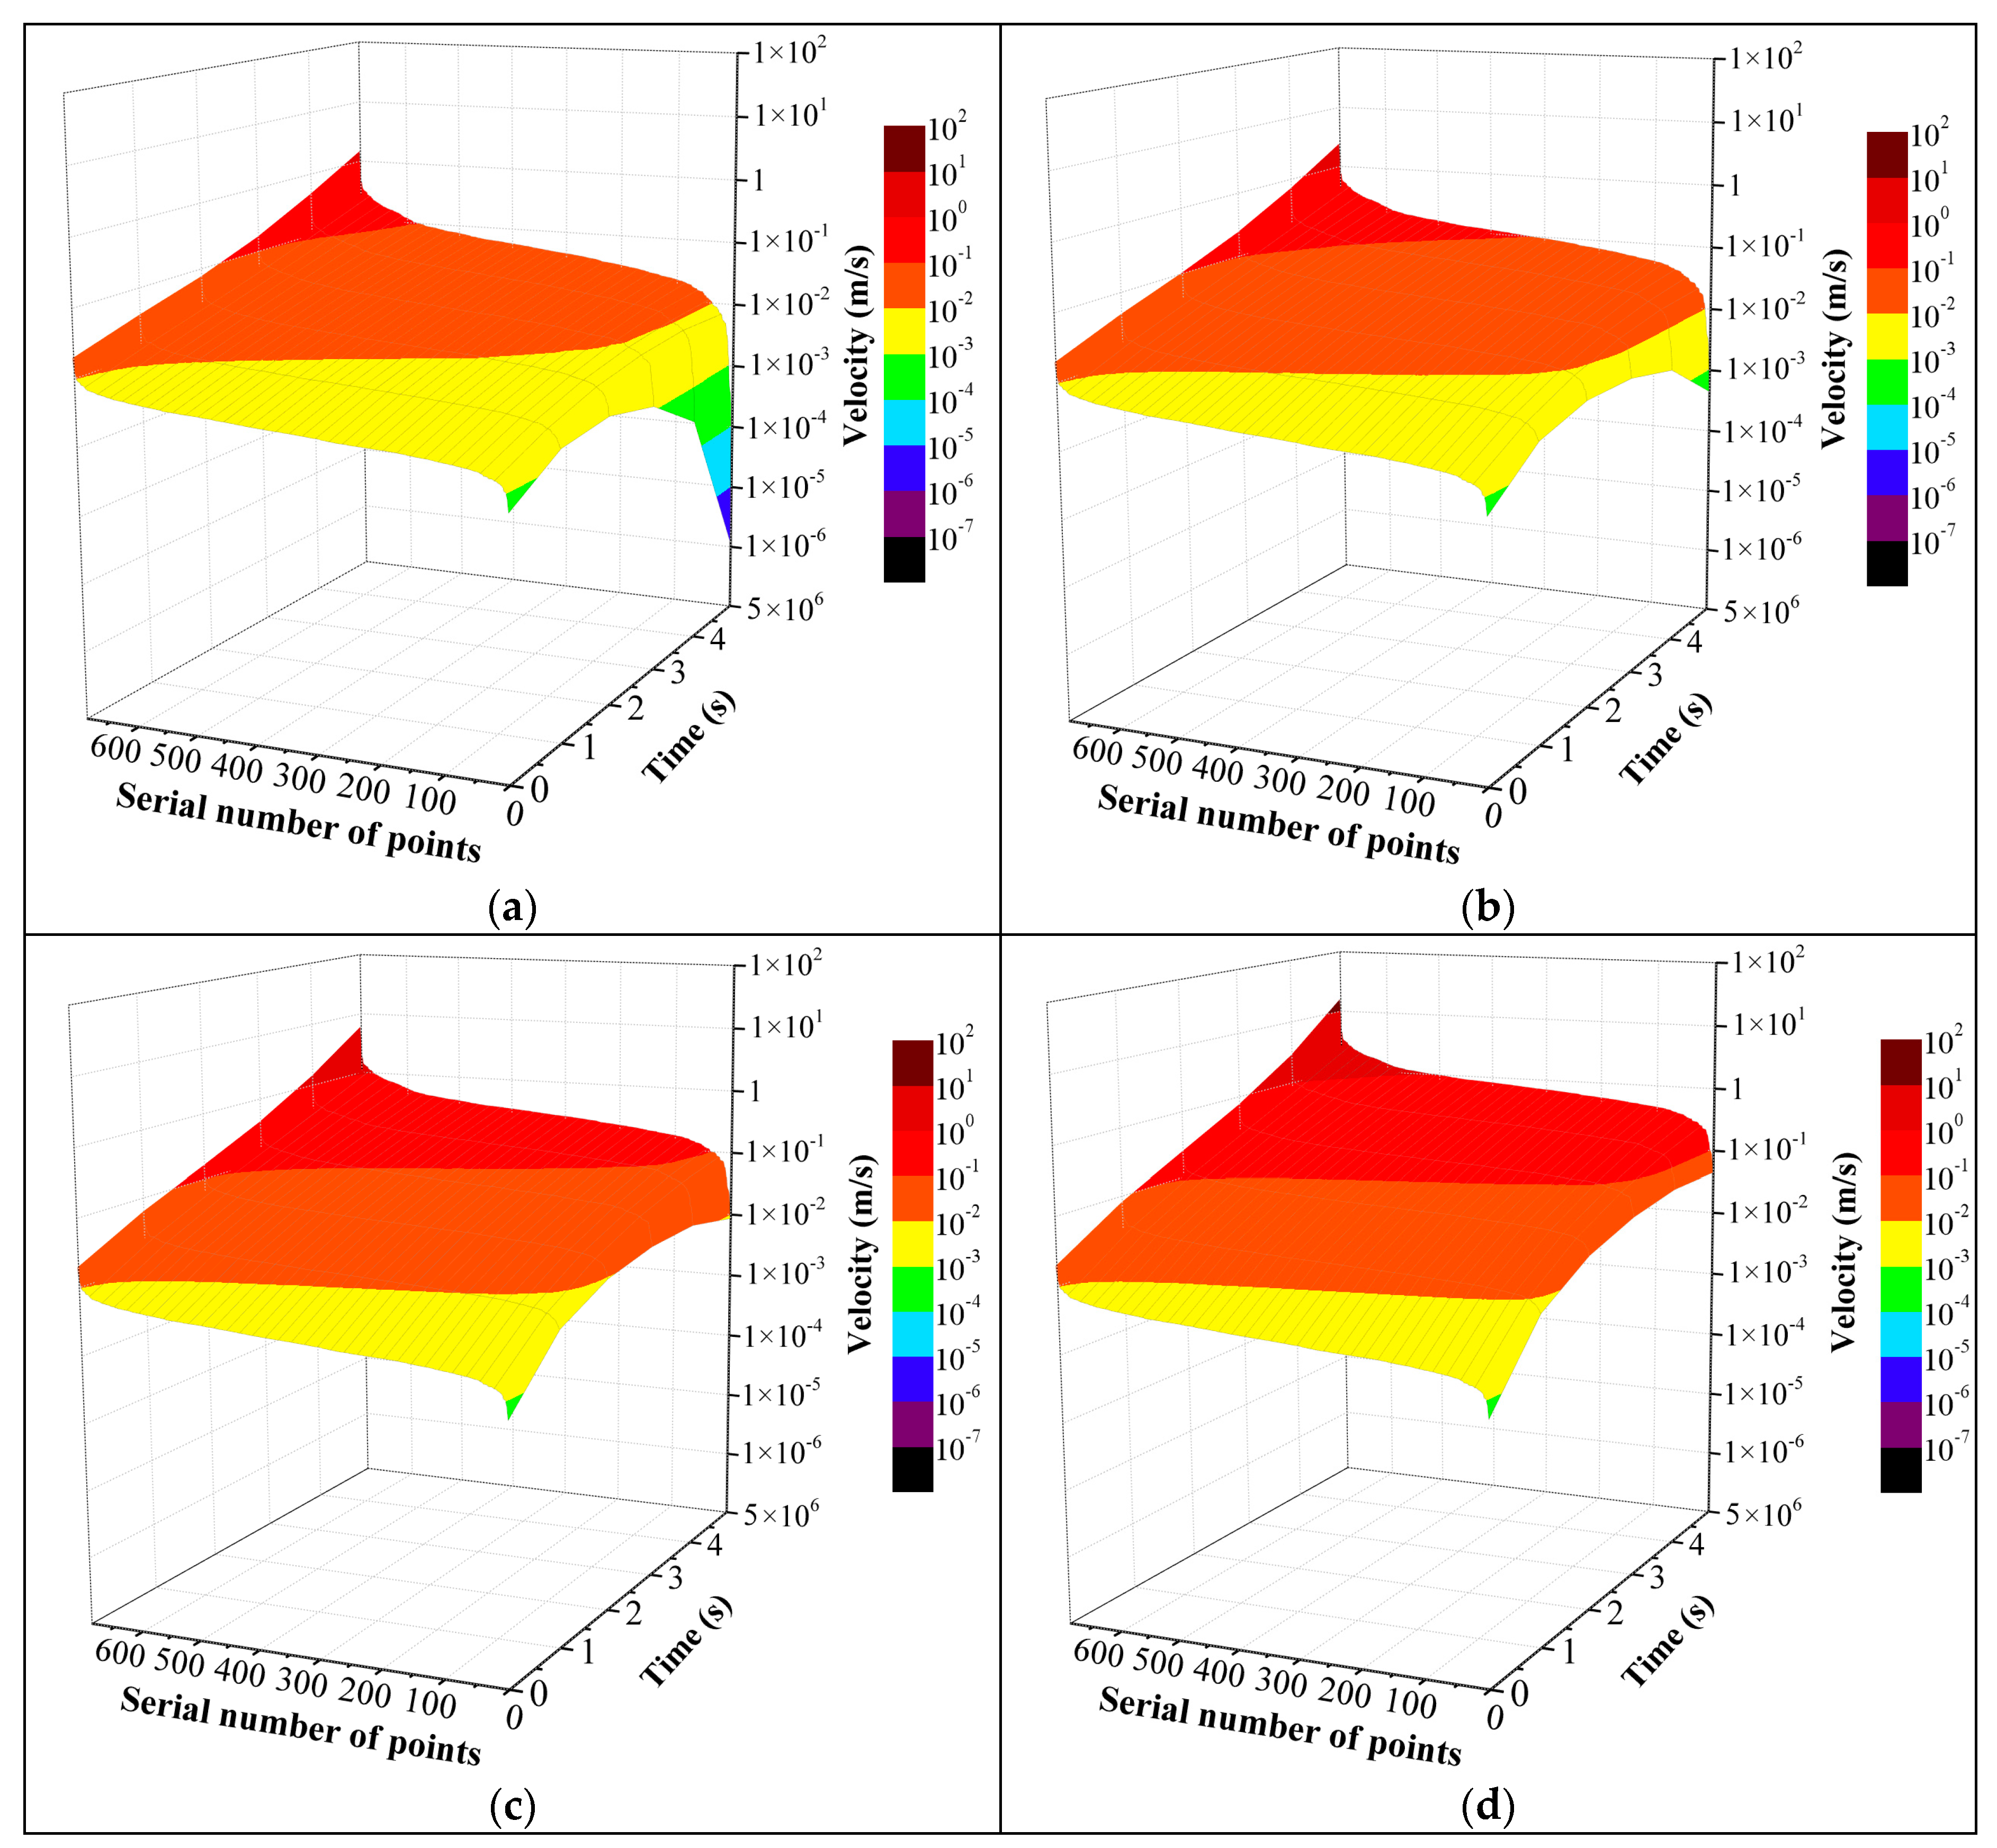
When k w is 2 and T is 75 °C, the distribution of porosity at different pH values and time is shown in Figure 9 and Figure 10, similarly, the fluid velocity values at 692 points at each time step are sorted according to ascending order in Figure 10. In these figures, the fluid velocity values at most points increase with the increase of pH value. Meanwhile, the difference between the minimum and maximum values of fluid velocity at the 692 points increases with increasing time, which indicates that the heterogeneity of fluid velocity increases with increasing time.
Compared with the average and variance of the porosity, the average and variance of the fluid velocity at the 692 points have different change rules. As shown in Figure 7g–i, the average fluid velocity approximately shows exponential growth with increasing time, and the growth rate increases with a decreasing pH value from 6.6 to 4. When k w increases from 2 to 8, after 5 × 10⁶ s, the average fluid velocity at pH 4 increases from 4 × 10⁻³ m/s to 0.93 m/s, 0.84 m/s, and 0.83 m/s, respectively, which indicates that the average fluid velocity growth rate has a little increase with the increase of the heterogeneity of the initial porosity. As shown in Figure 7d–f, the fluid velocity variance also shows exponential growth with increasing time, and the growth range is larger than that of porosity variance in the same condition. For instance, when k w is 2, the fluid velocity variance at pH 6 increases from 3.13 × 10⁻⁶ m/s to 2.26 × 10⁻² m/s (increased by about 7.21 × 10³ times) from 0 s to 5 × 10⁶ s, but in the same condition, as shown in Figure 7a–c, the porosity variance increases from 2.09 × 10⁻⁴ to 3.40 × 10⁻³ (increased by about 16.24 times). In addition, after 5 × 10⁵ s, the fluid velocity variance increases from 3.13 × 10⁻⁶ m/s to 8.31 × 10⁻³ m/s, 2.26 × 10⁻² m/s, 1.29 × 10⁻¹ m/s, and 7.89 × 10⁻¹ m/s (increased by 2.65 × 10³ times, 7.21 × 10³ times, 4.13 × 10³ m/s times, and 2.52 × 10⁵ times) when the pH values are 6.6, 6, 5, and 4, respectively. Therefore, although the pH value has little influence on the growth rate of the porosity variance (as shown in Table 2), the increase of the pH value can increase the growth rate of the fluid velocity variance.

4.2.2. The Influence of Temperature

When k w is 2, and the pH value is 6.6, the distribution of fluid velocity at a different temperature and time is shown in Figure 11. This figure indicates that the fluid velocity at most parts increases with increasing temperature and time in a certain temperature range. When k w is 2, the average fluid velocity and fluid velocity variance at the 692 points at different pH values and temperature are shown in Figure 7j–l. The curves between average fluid velocity and time shows exponential growth with increasing time, and the growth rate increases with increasing temperature, which indicates that the increase of temperature can increase the fluid velocity growth rate in a certain temperature range. The fluid velocity variance approximately also shows exponential growth with increasing time, and the variance has a wide varying change (e.g., after 5 × 10⁵ s, increases from 3.13 × 10⁻⁶ m/s to 4.49 × 10⁻² m/s, 1.28 × 10⁻¹ m/s, and 7.72 × 10⁻¹ m/s (increased by 1.43 × 10⁴ times, 4.09 × 10⁴ times, and 2.47 × 10⁵ times) at 90 °C when the pH values are 6.6, 5, and 4, respectively). Therefore, the decrease of the pH value can increase the fluid velocity variance. Meanwhile, the fluid velocity variance growth rate increases with increasing temperature.

4.3. The Rock Damage

The porosity change has been widely used to define the rock damage [32]. In this study, the rock damage is defined as
D = ϕ ¯ ϕ ¯ i n 1 ϕ ¯ i n × 100 %
where D is the rock damage; ϕ ¯ is the average porosity; ϕ ¯ i n is the initial average porosity.
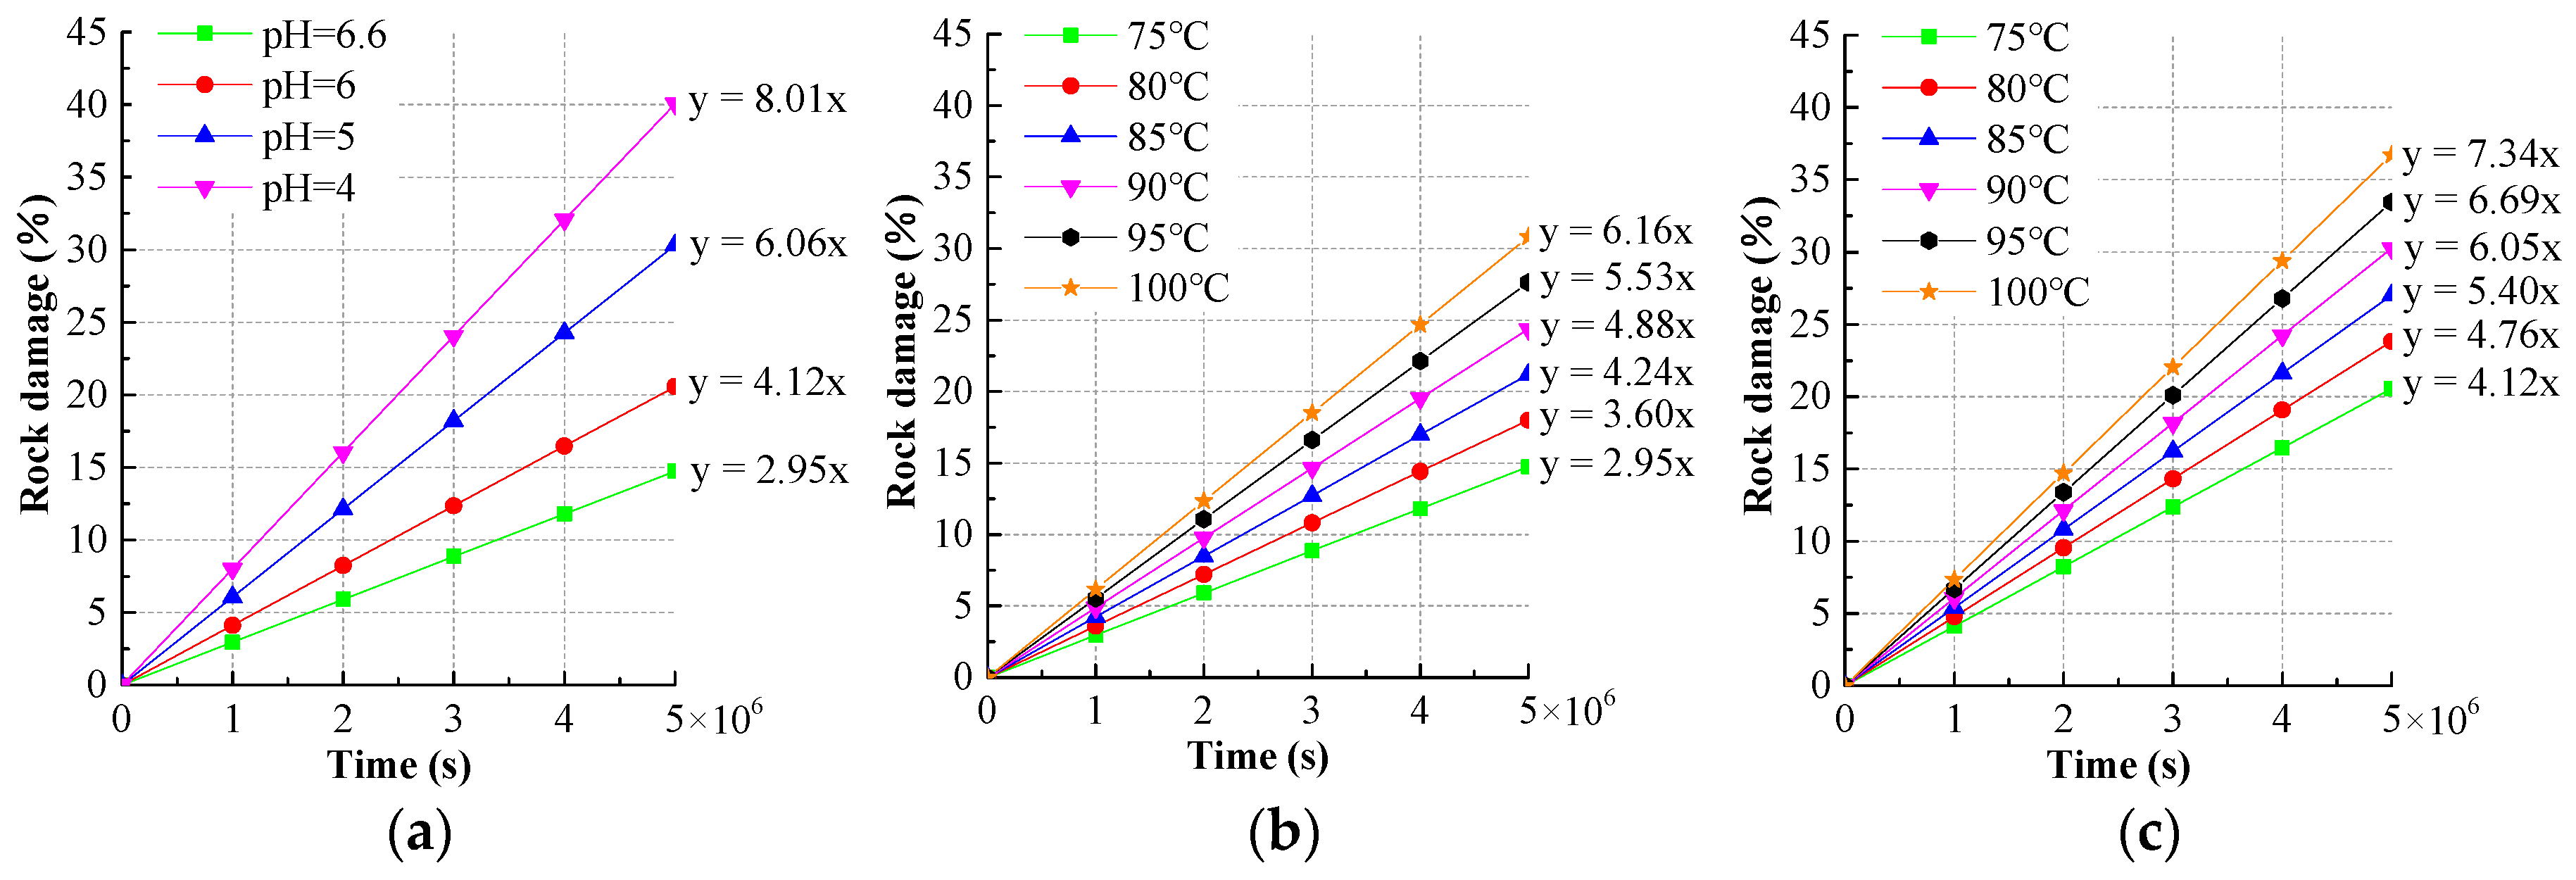
When k w is 2, the curves of rock damage change with time and their fitting polynomials at different pH values and temperature are shown in Figure 12. In this figure, the rock damage increases with time, which can be expressed as
D f = k d t
where D f is the fitting rock damage; t is time, 106 s; k d is the rock damage coefficient, which reflects the rock damage growth rate. Figure 12 shows that the rock damage coefficient increases with a decreasing pH value from 6.6 to 4 and increasing temperature from 75 °C to 100 °C, which indicates that in a certain acidity range and temperature range, the rock damage growth rate increases with decreasing pH value and increasing temperature.

5. Application in Predicting Water Inrush

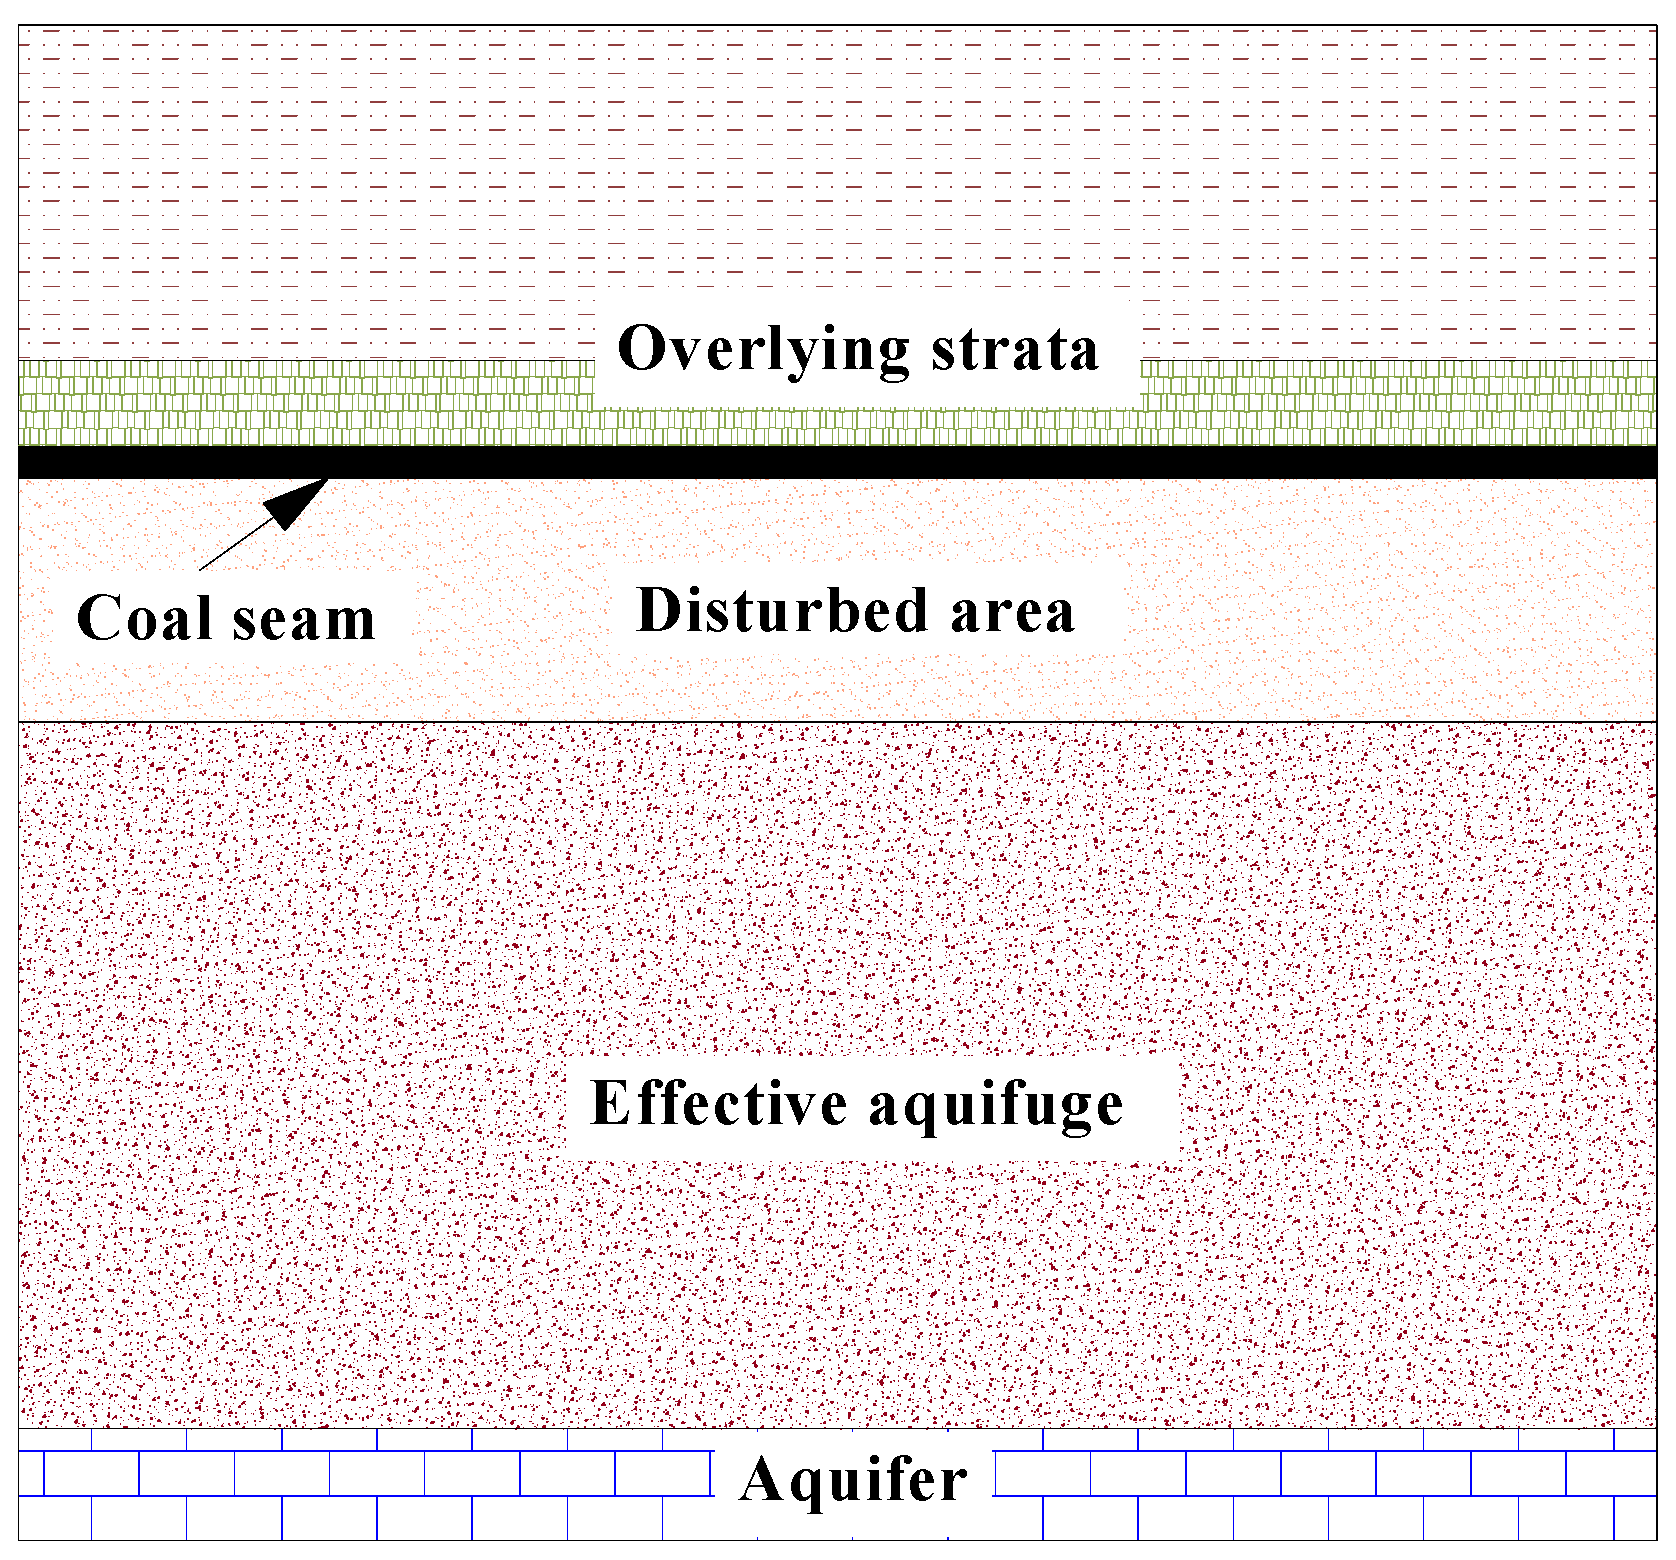
In the previous work of predicting water inrush in deep coal mines, the rock properties were generally homogeneous. In this section, based on the actual engineering background of coal seam 15 in the Huatai coal mine of China, applying the above results, the influence of rock heterogeneity on water inrush is studied. As shown in Figure 13, the depth of coal seam 15 is 1180 m, the length of the working face is 140 m, and the distance between the aquifer and the coal seam is about 85 m. The angle of the coal seam is 15°. The fractured area is induced by the coal mining. Groundwater can flow into the coal seam through the fractured area. Based on the statistical analysis of long-term experimental and engineering measured data, the researchers and engineers found that the thickness of the fractured area can be calculated by some functions of the length of the working face, the depth of the coal seam, and the angle of the coal seam, and therefore obtained the empirical equations. The empirical formulas are [33]:
h 1 = 0.7007 + 0.1079 L
h 1 = 0.303 L 0.8
h 1 = 0.00851 H + 0.1665 α + 0.1079 L 4.3579
where L is the length of the working face, m; H is the depth of the coal seam, m; and α is the angle of the coal seam. The thickness of the disturbed area is 15.8 m, 15.8 m, and 23.3 m calculated by the above empirical formulas, and the largest one, 23.3 m, is the thickness of the disturbed area.
The conception of the water inrush coefficient is proposed based on the statistical analysis of long-term water inrush data and defined in the Regulation for Coal Mine Water Prevention and Control [34],
K = P M
where K is the water inrush coefficient, MPa/m; P is the water pressure, MPa; M is the thickness of the aquifuge, m. If the water inrush coefficient is over 0.1 MPa/m, the water inrush will occur. In the 1970s, considering the thickness of the disturbed area and the height of water intrusion into the aquifuge, the water inrush coefficient was revised as
K = P M e f f
M e f f = M h 1 h 2
where M e f f is the thickness of the effective aquifuge, m; h 2 is the height of water intrusion into aquifuge, m. The height of water intrusion into the aquifuge is 0 m in this case. The water pressure is 6.17 MPa calculated by Equations (32) and (33).
The bottom boundary of the aquifer is applied 6.17 MPa, and no flow is applied to the left, right, and top boundaries of the geometric model. From the results of previous analysis in Section 3, when the scale parameter is constant, setting different shape parameters can simulate the rocks that have the same average porosity but different heterogeneity, and the larger the shape parameter is, the more homogeneous the rock. Therefore, the scale parameter is set as 0.12, the shape parameters are set as 2 and 8, respectively, to simulate the different initial rock heterogeneity. The shape parameter should be as large as possible to simulate homogeneity rock, which is set as 50. The model parameters are listed in Table 3. These parameters are from the rock compression test. The rock specimens are from the roof and floor rock strata of coal seam 15. The testing machine is MTS815.03. In addition, the effective thermal conductivity and the effective volumetric heat capacity are calculated by Equations (21) and (20), and the permeability is calculated by Equation (25), and these three parameters are governed by the porosity generated by the Weibull distribution random numbers. The thermal conductivity and heat capacity of the rock and fluid properties parameters are listed in Table 2.
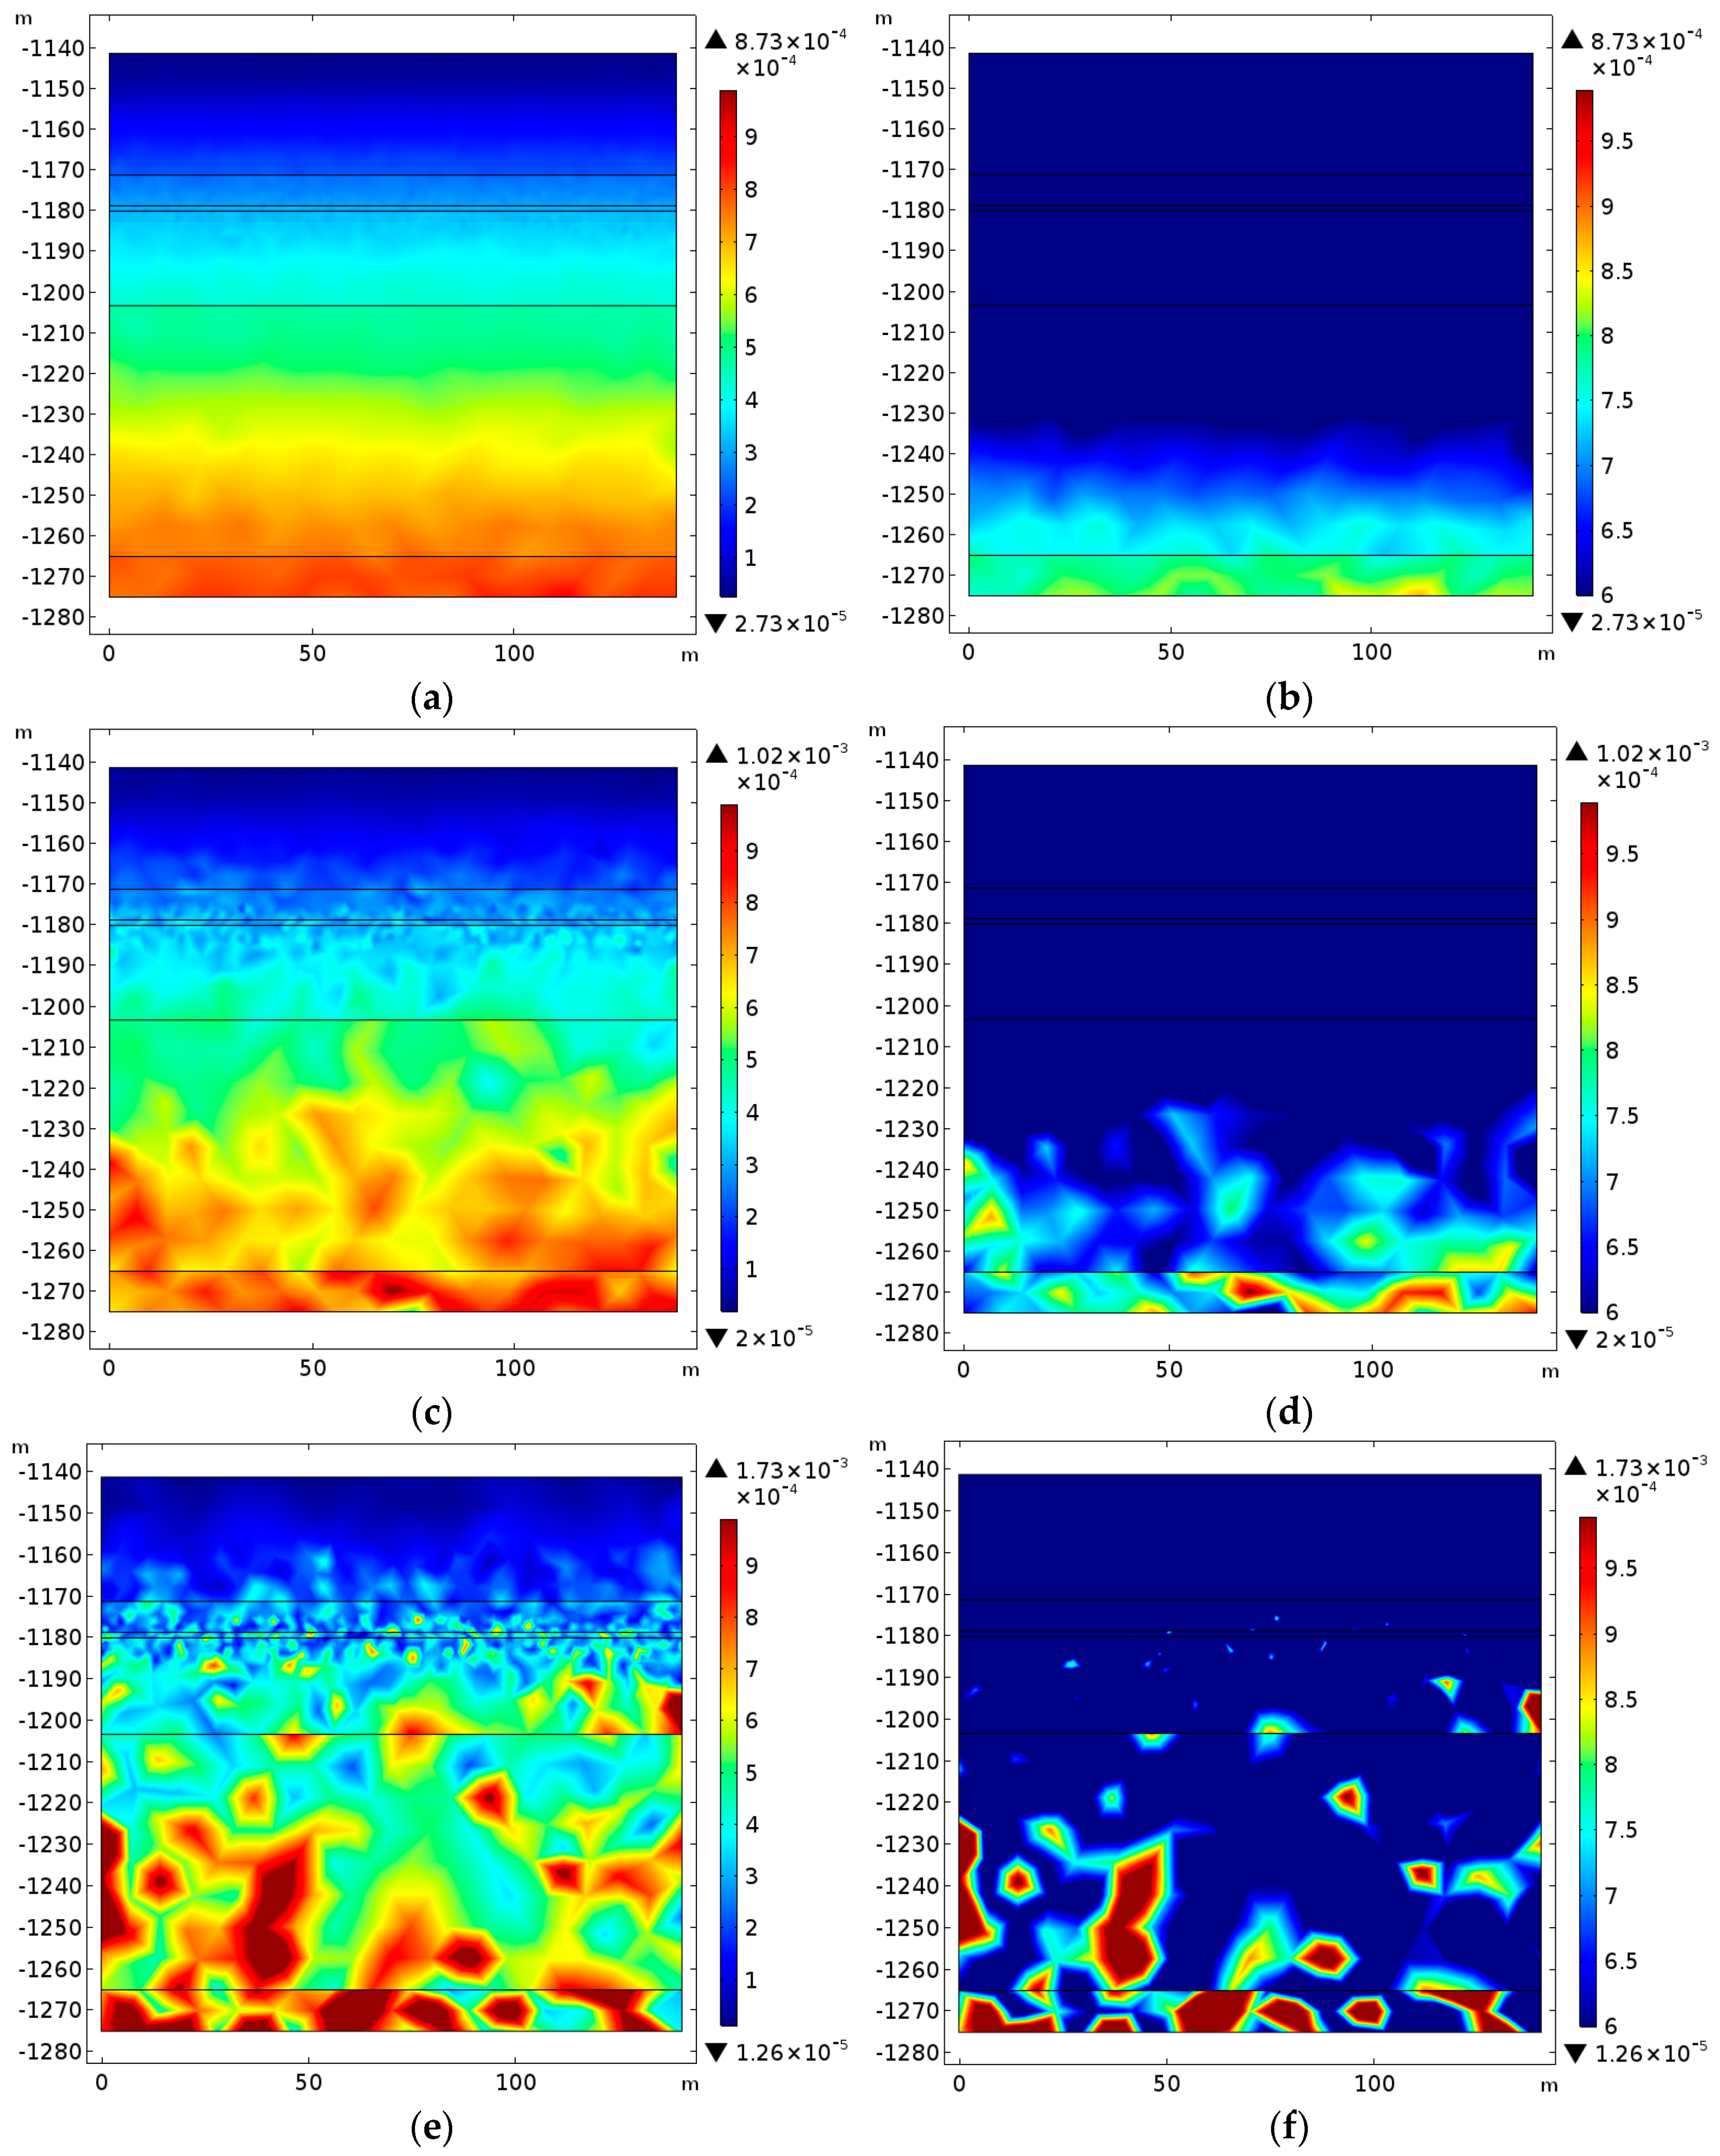
Because the scale parameter is constant, when the shape parameters are 2, 8, and 50, the average porosity at 619 points in an effective aquifuge are all 0.2, and the average fluid velocity at these points are all 6 × 10⁻⁴ m/s. Figure 14 shows the fluid velocity distribution of homogeneity rock and different heterogeneity rock, in which, Figure 14b,d,f show the fluid velocity over average value of 6 × 10⁻⁴ m/s. In this figure, the fluid velocity heterogeneity and the maximum fluid velocity increases with decreasing the shape parameters. Meanwhile, the distribution area of fluid velocity over the average value gradually extends to the disturbed area by decreasing the shape parameter, which will increase the possibility of water inrush. In the results section, the rock heterogeneity increases with increasing temperature. Therefore, the danger of water inrush will increase with the increase of rock heterogeneity due to the combined effect of high temperature and high water pressure in deep mines.

6. Discussions

This coupled THC model is mainly used to study rock heterogeneity and the coupling effect of temperature, groundwater, and hydrochemistry on rock damage, and the results indicate that the rock heterogeneity growth contributes to the formation of cracks and increases the possibility of water inrush. Our findings show that the points with a larger porosity value contribute to form cracks, which is corresponding to the finding that the microcracks grow from the largest vesicles in an inhomogeneous vesicle size reported by Heap et al. [20]. Meanwhile, rock heterogeneity growth contributes to rock fracture and increases the complexity of cracks, which is corresponding to the finding that the heterogeneity has a great influence on the rock failure mode, and the complexity of crack propagation increases with increasing rock heterogeneity reported by Tang and Liu [21]. Certainly, compared with previous heterogeneity rock models that adopted the Weibull distribution to govern the heterogeneity [22,23,24,25], some new findings of the coupling effect of temperature, groundwater, and hydrochemistry on rock heterogeneity, rock damage, and fluid velocity are obtained when THC coupling processes are considered. These findings could provide a new understanding of the impact of rock heterogeneity on rock damage for related researchers and heighten the vigilance of mining engineers to the dangers of water inrush induced by rock heterogeneity in aquifuge.
However, there are some limitations to this study which are listed as follows:
  • In alkaline conditions and high temperature that make the chemical reaction rate decrease, the rock damage change rule is not studied. In addition, the impact of thermal expansion on rock damage is not considered.
  • The relationship between the external stress and porosity change is not established. Therefore, the change in porosity due to mechanical compression or expansion is not studied. The rock damage is only defined by the porosity change. The strength parameters (e.g., the elastic modulus), are not considered to define the damage.
Future research should consider the mechanical-induced thermal, hydraulic, and chemical processes, as well as the alkaline condition and higher temperature to define and study rock damage. In addition, it is better to associate the actual heterogeneity obtained by imaging techniques with the artificial distribution. Future research should use some imaging techniques, such as Computed Tomography (CT) or Nuclear Magnetic Resonance (NMR) imaging techniques, to show the actual rock particle and pore size distribution, then based on the imaging results, adopt some statistical approaches to represent the actual rock homogeneity or heterogeneity in numerical modeling.

7. Conclusions

A coupled THC model was carried out in this paper to study the rock heterogeneity and the coupling effect of temperature, groundwater, and hydrochemistry on rock damage. The main conclusions are obtained:
  • With increasing time, the average porosity approximately shows linear growth, and the average fluid velocity approximately shows exponential growth, and their growth rates increase with decreasing pH value and increasing temperature in a certain acidity and temperature range.
  • The Weibull distribution is adopted to govern the heterogeneity of the initial rock porosity distribution, and the variance is used to express the heterogeneity. The increase of initial porosity heterogeneity has little influence on porosity change, but it can increase the fluid velocity growth rate. The porosity heterogeneity and fluid velocity heterogeneity approximately show exponential growth with increasing time. The increase of temperature and decrease of pH value have little influence on the porosity heterogeneity, but they can increase the growth rate of the fluid velocity heterogeneity. The rock heterogeneity growth contributes to rock fracture, which is corresponding to the results reported by the previous research.
  • The porosity change is used to define the rock damage. The rock damage growth rate increases with a decreasing pH value and increasing temperature in a certain acidity range and temperature range.
  • The water inrush is more likely to occur through the rock with greater heterogeneity.

Supplementary Files

Supplementary File 1

Author Contributions

W.L. contributed in the research plan. J.Z. wrote the main manuscript, established the mathematical model and prepared all figures and tables. R.N. and Y.Z. contributed in the application section. B.X. and X.S. reviewed the manuscript. All authors contributed in the conclusions.

Funding

This research was funded by the National Natural Science Foundation of China (grant 51874192), the SDUST Research Fund (grant 2018TDJH102), the Natural Science Foundation of Shandong Province (ZR2019MEE084), the Open Fund of State Key Laboratory of Mining Disaster Prevention and Control Co-founded by Shandong Province and the Ministry of Science and Technology (MDPC201813), the National High Technology Research and Development Program (863 Program) of China (grant 2015AA016404-4), and the State Key Research and Development Program of China (grant 2017YFC0804108).

Conflicts of Interest

The authors declare no conflicts of interest.

References

  1. Kong, B.; Wang, E.; Li, Z. The effect of high temperature environment on rock properties—An example of electromagnetic radiation characterization. Environ. Sci. Pollut. Res. 2018, 25, 29104–29114. [Google Scholar] [CrossRef] [PubMed]
  2. Li, G.; Tang, C.A.; Li, L.C.; Liang, Z.Z. Numerical simulation of 3d hydraulic fracturing process. Chin. J. Geotech. Eng. 2010, 32, 1875–1881. [Google Scholar]
  3. Zheng, Y.J.; Chen, M. Lab investigation of dissolution velocity of carbonate rock boreholes. Petrol. Drill. Tech. 2003, 31, 1–3. (In Chinese) [Google Scholar]
  4. Jing, L.; Tsang, C.F.; Stephansson, O. DECOVALEX—An international co-operative research project on mathematical models of coupled THM processes for safety analysis of radioactive waste repositories. Int. J. Rock Mech. Min. Sci. 1995, 32, 389–398. [Google Scholar] [CrossRef]
  5. Tsang, C.F.; Jing, L.; Stephansson, O.; Kautsky, F. The DECOVALEX III project: A summary of activities and lessons learned. Int. J. Rock Mech. Min. Sci. 2005, 42, 593–610. [Google Scholar] [CrossRef] [Green Version]
  6. Rutqvist, J.; Wu, Y.S.; Tsang, C.F.; Bodvarsson, G. A modeling approach for analysis of coupled multiphase fluid flow, heat transfer, and deformation in fractured porous rock. Int. J. Rock Mech. Min. Sci. 2002, 39, 429–442. [Google Scholar] [CrossRef]
  7. Graupner, B.J.; Shao, H.; Wang, X.R.; Nguyen, T.S.; Li, Z.; Rutqvist, J.; Chen, F.; Birkholzer, J.; Wang, W.; Kolditz, O.; et al. Comparative modelling of the coupled thermal–hydraulic-mechanical (THM) processes in a heated bentonite pellet column with hydration. Environ. Earth Sci. 2018, 77, 84. [Google Scholar] [CrossRef]
  8. Xiao, Y.; Guo, J.; Wang, H.; Lu, L.; Mclennan, J.; Chen, M. Coupled THM and matrix stability modeling of hydroshearing stimulation in a coupled fracture-matrix hot volcanic system. Math. Probl. Eng. 2018. [Google Scholar] [CrossRef]
  9. Sun, Z.; Pin, Y.; Yao, J.; Zhang, K.; Zhuang, L.; Zhu, X.; Wang, T.; Jiang, C. Numerical Investigation on the Heat Extraction Capacity of Dual Horizontal Wells in Enhanced Geothermal Systems Based on the 3-D THM Model. Energies 2018, 11, 280. [Google Scholar] [CrossRef]
  10. Zhu, W.; Wei, C.; Tian, J.; Yang, T.; Tang, C. Coupled thermal-hydraulic-mechanical model during rock damage and its preliminary application. Rock Soil Mech. 2009, 30, 3851–3857. (In Chinese) [Google Scholar]
  11. Guo, W.; Zhao, J.; Yin, L.; Jiang, N. Study on Fault Water Inrush Mechanism and Nonlinear Seepage-stress Coupling. J. Shandong Univ. Sci. Technol. 2017, 6, 1–7. (In Chinese) [Google Scholar]
  12. Yeh, G.T.; Tripathi, V.S. A Model for Simulating Transport of Reactive Multispecies Components: Model Development and Demonstration. Water Resour. Res. 1991, 27, 3075–3094. [Google Scholar] [CrossRef]
  13. Xu, T.; Sonnenthal, E.; Spycher, N.; Pruess, K. TOUGHREACT—A simulation program for non-isothermal multiphase reactive geochemical transport in variably saturated geologic media: Applications to geothermal injectivity and CO geological sequestration. Comp. Geosci. 2006, 32, 145–165. [Google Scholar] [CrossRef]
  14. Cui, Q.; Feng, X.; Xue, Q.; Zhou, H.; Zhang, Z. Mechanism study of porosity structure change of sandstone under chemical corrosion. Chin. J. Rock Mech. Eng. 2008, 27, 1209–1216. (In Chinese) [Google Scholar]
  15. Liu, J.; Sheng, J.; Polak, A.; Elsworth, D.; Yasuhara, H.; Grader, A. A fully-coupled hydrological–mechanical–chemical model for fracture sealing and preferential opening. Int. J. Rock Mech. Min. Sci. 2006, 43, 23–36. [Google Scholar] [CrossRef]
  16. Karrech, A. Non-equilibrium thermodynamics for fully coupled thermal hydraulic mechanical chemical processes. J. Mech. Phys. Solids 2013, 61, 819–837. [Google Scholar] [CrossRef]
  17. Yasuhara, H.; Elsworth, D. A numerical model simulating reactive transport and evolution of fracture permeability. Int. J. Numer. Anal. Methods Geomech. 2006, 30, 1039–1062. [Google Scholar] [CrossRef]
  18. Poulet, T.; Karrech, A.; Regenauer-Lieb, K.; Fisher, L.; Schaubs, P. Thermal–hydraulic–mechanical–chemical coupling with damage mechanics using ESCRIPT RT and ABAQUS. Tectonophysics 2012, 526–529, 124–132. [Google Scholar] [CrossRef]
  19. Bond, A.E.; Bruský, I.; Cao, T.; Chittenden, N.; Fedors, R.; Feng, X.T.; Gwo, J.P.; Kolditz, O.; Lang, P.; McDermott, C.; et al. A synthesis of approaches for modelling coupled thermal–hydraulic–mechanical–chemical processes in a single novaculite fracture experiment. Environ. Earth. Sci. 2017, 76, 12. [Google Scholar] [CrossRef]
  20. Heap, M.J.; Xu, T.; Chen, C.F. The influence of porosity and vesicle size on the brittle strength of volcanic rocks and magma. Bull. Volcanol. 2014, 76, 856. [Google Scholar] [CrossRef]
  21. Tang, C.A.; Liu, H.Y. Influence of heterogeneity on crack propagation modes in brittle rock. Chin. J. Geophys. 2000, 43, 117–125. [Google Scholar] [CrossRef]
  22. Zhang, K.; Yao, B.H.; Wu, S.G.; Zhang, H.T. Study on the characteristics of variable mass seepage and water inrush mechanism of collapse column. J. Min. Saf. Eng. 2013, 30, 892–896. (In Chinese) [Google Scholar]
  23. Zhu, W.C.; Tang, C.A. Micromechanical model for simulating the fracture process of rock. Rock Mech. Rock Eng. 2004, 37, 25–56. [Google Scholar] [CrossRef]
  24. Wang, Q.Y.; Zhu, W.C.; Xu, T.; Niu, L.L.; Wei, J. Numerical simulation of rock creep behavior with a damage-based constitutive law. Int. J. Geomech. 2016, 17, 04016044. [Google Scholar] [CrossRef]
  25. Zheng, C.; Kizil, M.S.; Aminossadati, S.M.; Chen, Z. Effects of geomechanical properties of interburden on the damage-based permeability variation in the underlying coal seam. J. Nat. Gas Sci. Eng. 2018, 55, 42–51. [Google Scholar] [CrossRef]
  26. Papamichos, E.; Vardoulakis, I. Sand erosion with a porosity diffusion law. Comput. Geotech. 2005, 32, 47–58. [Google Scholar] [CrossRef]
  27. Bear, J.; Bachmat, Y. Introduction to modeling of transport phenomena in porous media. Theory Appl. Transp. Porous Med. 1990, 4, 481–516. [Google Scholar]
  28. Nasir, O. Coupled Thermo-Hydro-Mechanical-Chemical (THMC) Responses of Ontario’s Host Sedimentary Rocks for Nuclear Waste Repositories to Past and Future Glaciations and Deglaciations. Ph.D. Thesis, University of Ottawa, Ottawa, ON, USA, 2013. [Google Scholar]
  29. Ding, W.X.; Chen, J.P.; Xu, T.; Chen, H.J.; Wang, H.Y. Mechanical and chemical characteristics of limestone during chemical erosion. Rock Soil Mech. 2015, 36, 1825–1830. (In Chinese) [Google Scholar]
  30. Tan, F.; Zhang, Y.F.; Wang, Z.Y.; Dong, Z.X.; Huang, Z.L.; Wang, Q.P.; Gao, J.W. Simulation Experiment for the Burial Dissolution of Different Petrofabric Carbonate Rocks of Ordovician in the Ordos Basin. Acta Sedimentol. Sin. 2017, 35, 413–424. (In Chinese) [Google Scholar]
  31. Yang, J.; Huang, S.; Zhang, W.; Huang, Y.; Liu, G.; Xiao, L. Experimental simulation of dissolution for carbonate with different composition under the conditions from epigenesis to burial diagenesis environment. Acta Sedimentol. Sin. 1995, 13, 49–54. (In Chinese) [Google Scholar]
  32. Wang, J.X. Study on Elastoplastic Damage and MHC Coupling Model of Rock and Numerical Algorithm. Ph.D. Thesis, Dalian Maritime University, Dalian, Liaoning, China, 2014. (In Chinese). [Google Scholar]
  33. Guo, W.J.; Liu, W.T.; Zhang, W.Q. Special Mining Method of Coal Mine, 1st ed.; China Coal Industry Publishing House: Beijing, China, 2008; pp. 150–151. (In Chinese) [Google Scholar]
  34. Li, W.; Liu, Y.; Qiao, W.; Zhao, C.; Yang, D.; Guo, Q. An improved vulnerability assessment model for floor water bursting from a Confined Aquifer Based on the Water Inrush Coefficient Method. Mine Water Environ. 2017, 37, 11–19. [Google Scholar] [CrossRef]
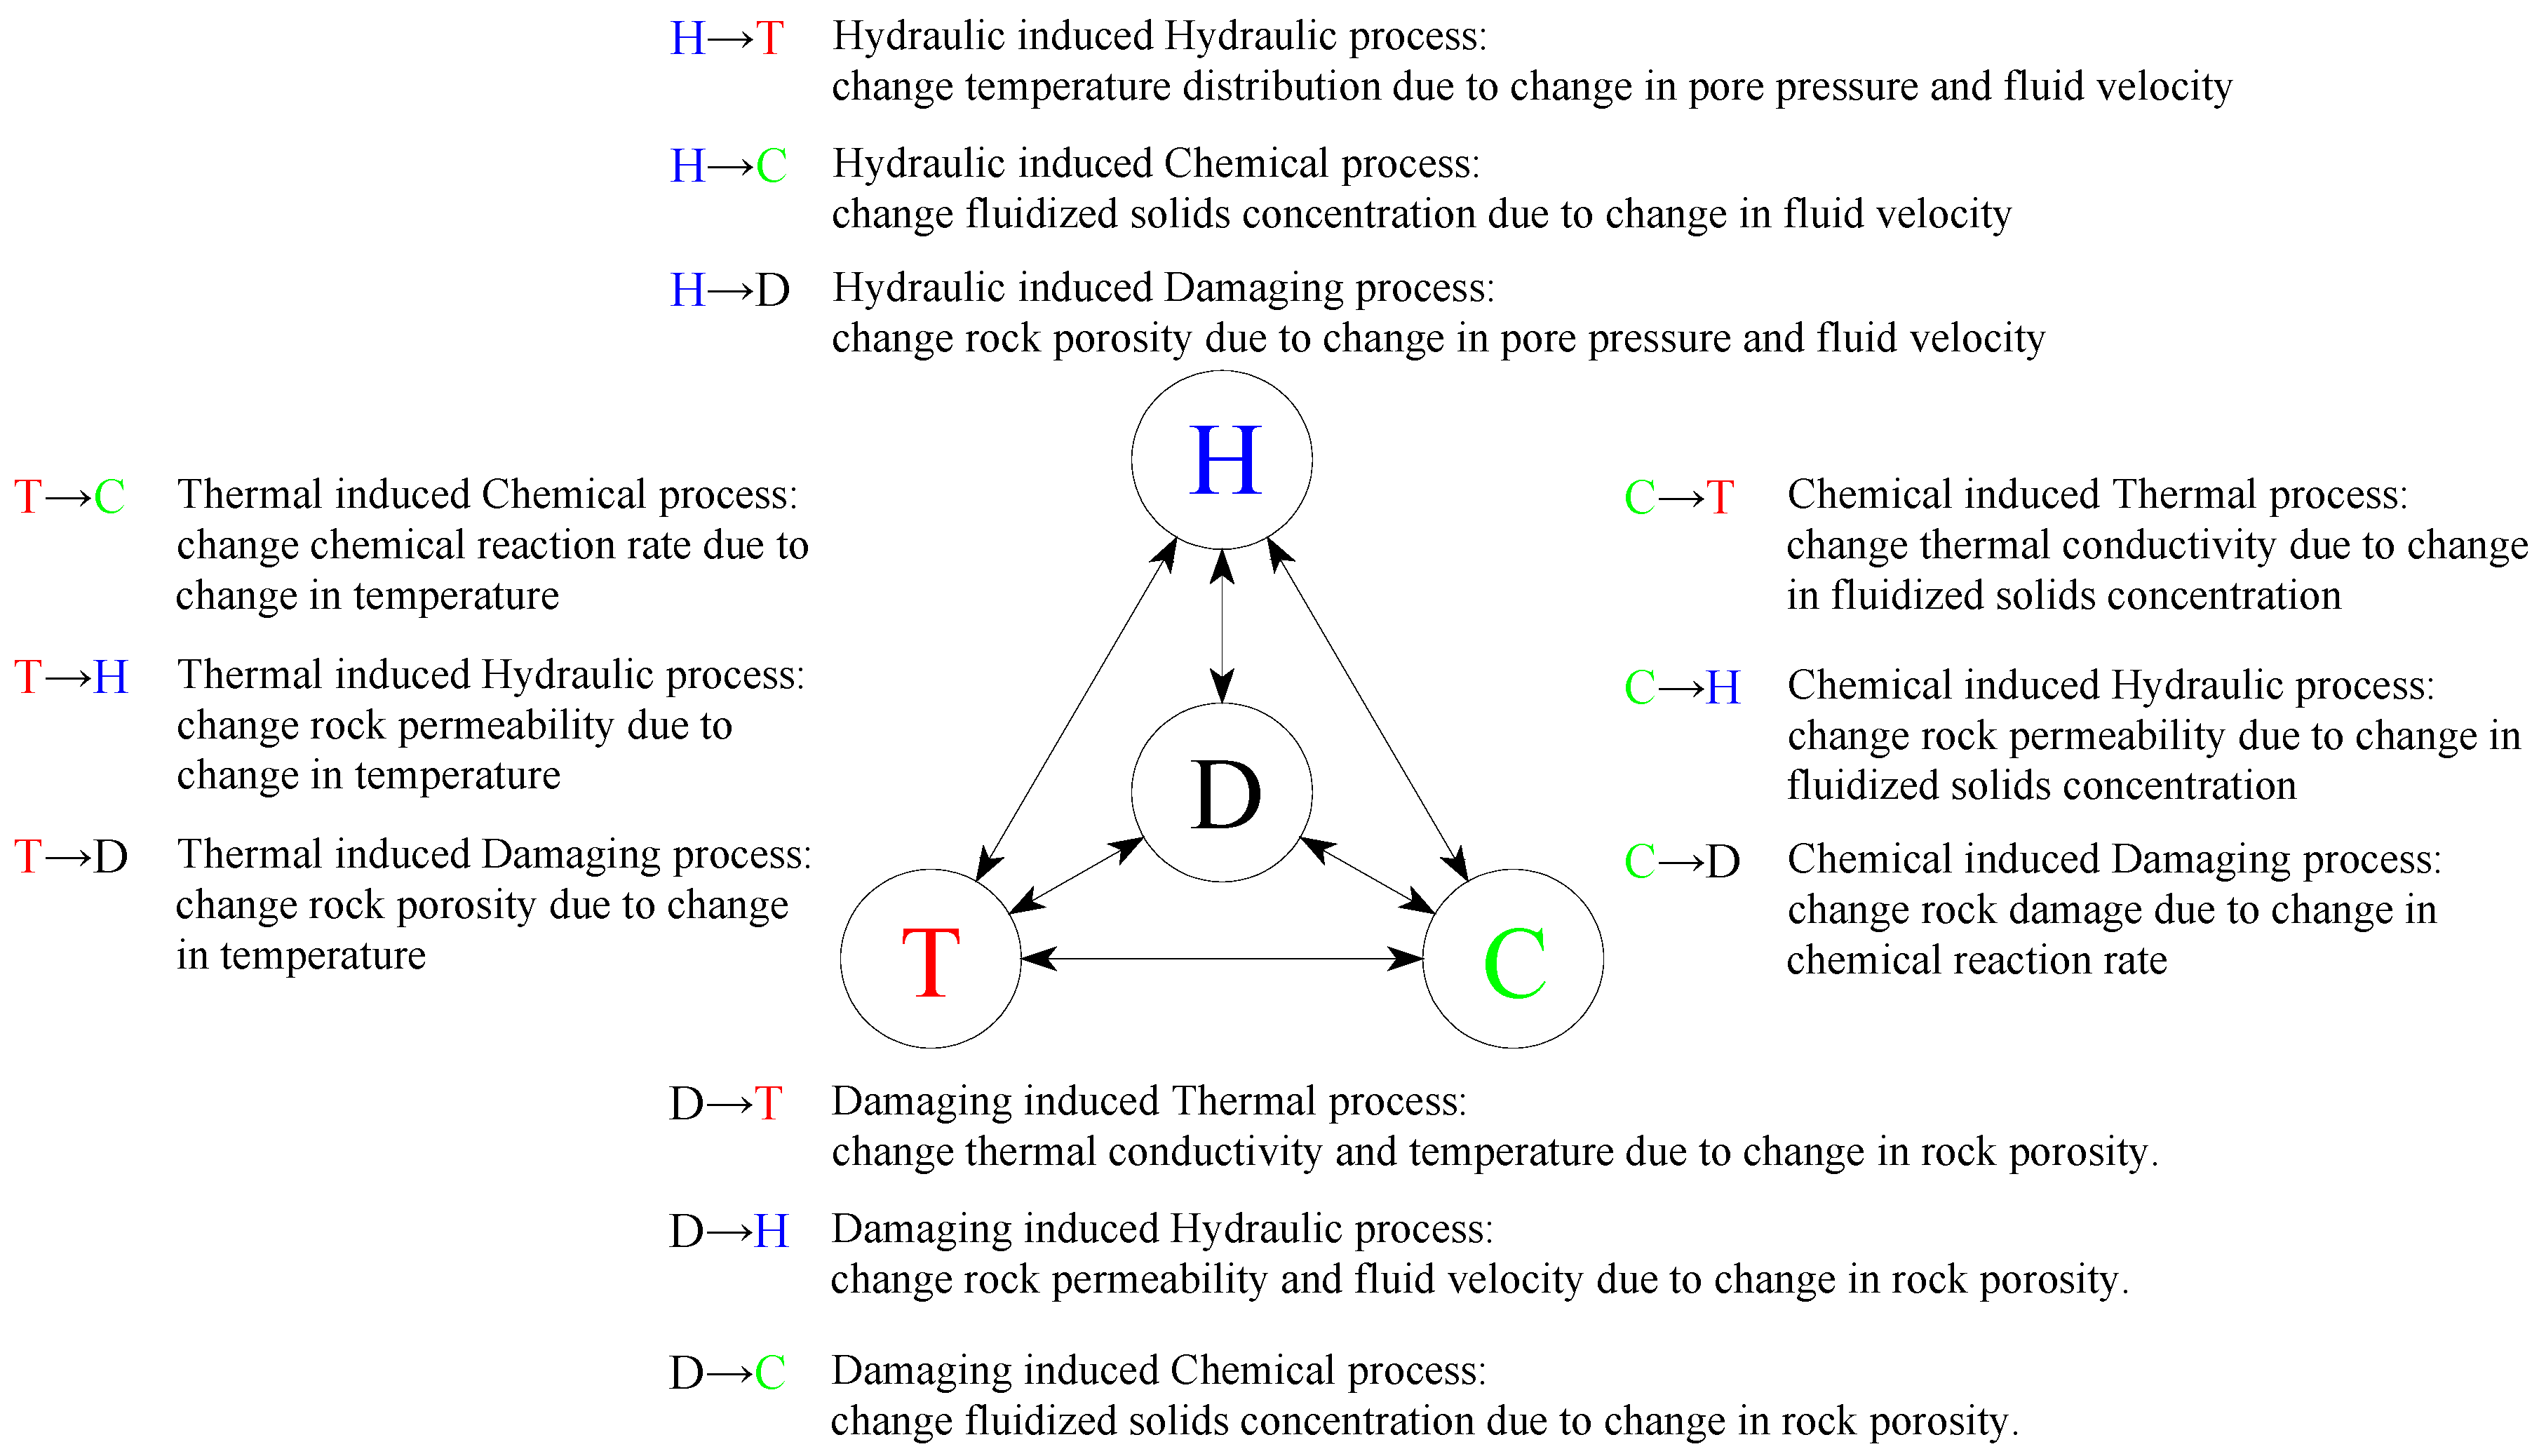
Figure 1. The coupled thermal–hydraulic–chemical (THC) processes for heterogeneity rock damage.
Applsci 09 02195 g001
Figure 2. The initial porosity distribution at different shape parameters: (a) k w = 2; (b) k w = 5; (c) k w = 8.
Applsci 09 02195 g002
Figure 3. The initial porosity values at 692 points of the cylinder at three times: (a) k w = 2; (b) k w = 5; (c) k w = 8.
Applsci 09 02195 g003
Figure 4. The distribution of porosity at different pH values and times ( k w = 2, T = 75 °C): (a) pH = 6, 1 × 10⁶ s; (b) pH = 6, 3 × 10⁶ s; (c) pH = 6, 5 × 10⁶ s; (d) pH = 5, 1 × 10⁶ s; (e) pH = 5, 3 × 10 6 s; (f) pH = 5, 5 × 10⁶ s.
Applsci 09 02195 g004
Figure 5. The porosity values at 692 points at different times and pH values ( k w = 2): (a) pH = 6.6; (b) pH = 6; (c) pH = 5; (d) pH = 4.
Applsci 09 02195 g005
Figure 6. The average porosity and porosity variance: (a) k w = 2; (b) k w = 5; (c) k w = 8; (d) pH = 6.6; (e) pH = 6; (f) pH = 5; (g) k w = 2; (h) k w = 5; (i) k w = 8; (j) pH = 6.6; (k) pH = 6; (l) pH = 5.
Applsci 09 02195 g006
Figure 7. The distribution of porosity over 0.5 after 5 × 10⁶ s (pH = 4): (a) = 2; (b) k w = 5; (c) k w = 8.
Applsci 09 02195 g007
Figure 8. The distribution of porosity at different temperature and time ( k w = 2, pH = 6.6): (a) T = 80 °C, 1 × 10⁶ s; (b) T = 80 °C, 3 × 10⁶ s; (c) T = 80 °C, 5 × 10⁶ s; (d) T = 90 °C, 1 × 10⁶ s; (e) T = 90 °C, 3 × 10⁶ s; (f) T = 90 °C, 5 × 10⁶ s.
Applsci 09 02195 g008
Figure 9. The distribution of fluid velocity at different pH values and time ( k w = 2, T = 75 °C): (a) pH = 6, 1 × 10⁶ s; (b) pH = 6, 3 × 10⁶ s; (c) pH = 6, 5 × 10⁶ s; (d) pH = 5, 1 × 10⁶ s; (e) pH = 5, 3 × 10⁶ s; (f) pH = 5, 5 × 10⁶ s.
Applsci 09 02195 g009
Figure 10. The velocity values at 692 points at different times and pH values ( k w = 2): (a) pH = 6.6; (b) pH = 6; (c) pH = 5; (d) pH = 4.
Applsci 09 02195 g010
Figure 11. The distribution of fluid velocity at different temperature and time ( k w = 2, pH = 6.6): (a) T = 80 °C, 1 × 10⁶ s; (b) T = 80 °C, 3 × 10⁶ s; (c) T = 80 °C, 5 × 10⁶ s; (d) T = 90 °C, 1 × 10⁶ s; (e) T = 90 °C, 3 × 10⁶ s; (f) T = 90 °C, 5 × 10⁶ s.
Applsci 09 02195 g011
Figure 12. The rock damage change with time at different pH values and temperature ( k w = 2): (a) T = 75 °C; (b) pH = 6.6; (c) pH = 6.
Applsci 09 02195 g012
Figure 13. The geometric model.
Applsci 09 02195 g013
Figure 14. The fluid velocity distribution of homogeneity rock and different heterogeneity rock (pH = 6.6): (a) k w = 50; (b) k w = 50, the fluid velocity over average value 6 × 10⁻⁴ m/s; (c) k w = 8; (d) k w = 8, the fluid velocity over average value 6 × 10⁻⁴ m/s; (e) k w = 2; (f) k w = 2, the fluid velocity over average value 6 × 10⁻⁴ m/s.
Applsci 09 02195 g014
Table 1. The model parameters.
Parameter NameValue
Confining pressure5 MPa
Axial pressure20 MPa
Initial average porosity ϕ ¯ i n 0.11
Solid density ρ s 2660 m3/kg
Bulk modulus9.896 × 109 N/m2
Shear modulus8.051 × 109 N/m2
Fluid density ρ f 1000 m3/kg
Dynamic viscosity μ 1 × 10⁻³ Pa·s
Thermal conductivity of fluid k f 0.6 W/(m·K)
Heat capacity of fluid c f 4.2 × 10³ J/(kg·K)
Thermal conductivity of solid matrix k s 2.8 W/(m·K)
Heat capacity of solid matrix c s 9.21 × 10² J/(kg·K)
Permeability parameter k c 1.1 × 10⁻¹⁰ m2
Porosity diffusivity coefficient λ 1 × 10⁻¹¹ m2/s
Scale parameter λ w 0.12
Table 2. The porosity variance at different pH values.
The Shape ParameterThe pH Value0 s1 × 106 s2 × 106 s3 × 106 s4 × 106 s5 × 106 s
26.60.0002090.0002970.0004830.0009030.0017620.003491
60.0002090.0002970.0004830.0008860.00170.0034
50.0002090.0002970.0004830.0008860.00170.003409
40.0002090.0002970.0004830.0008860.00170.003395
56.64.12 × 10−56.14 × 10−50.0001070.0002260.0005550.001347
64.12 × 10−56.14 × 10−50.0001120.0002410.0005380.001326
54.12 × 10−56.14 × 10−50.0001120.0002410.0006130.001689
44.12 × 10−56.14 × 10−50.0001120.0002410.0006130.001788
86.61.77 × 10−52.51 × 10−54.31 × 10−58.6e × 10−50.0001940.000437
61.77 × 10−52.51 × 10−54.31 × 10−58.6e × 10−50.0001940.000438
51.77 × 10−52.51 × 10−54.31 × 10−58.61 × 10−50.0001950.000439
41.77 × 10−52.51 × 10−54.22 × 10−58.19 × 10−50.0001820.000405
Table 3. The model parameters of rock and coal.
Rock and CoalElastic Modulus (MPa)Poisson RatioDensity (m3/kg)
Overlying strata9.9880.272657
Coal seam3.6090.391490
Disturbed area8.0550.282635
Aquifuge13.4340.202687