Article

Chronic Disease Prediction Using Character-Recurrent Neural Network in The Presence of Missing Information

Department of Industrial and Systems Engineering, Dongguk University—Seoul, Seoul 04620, Korea
*
Author to whom correspondence should be addressed.
Appl. Sci. 2019, 9(10), 2170; https://doi.org/10.3390/app9102170
Submission received: 29 March 2019 / Revised: 14 May 2019 / Accepted: 24 May 2019 / Published: 27 May 2019
(This article belongs to the Special Issue Advances in Deep Learning)

Abstract

:
The aim of this study was to predict chronic diseases in individual patients using a character-recurrent neural network (Char-RNN), which is a deep learning model that treats data in each class as a word when a large portion of its input values is missing. An advantage of Char-RNN is that it does not require any additional imputation method because it implicitly infers missing values considering the relationship with nearby data points. We applied Char-RNN to classify cases in the Korea National Health and Nutrition Examination Survey (KNHANES) VI as normal status and five chronic diseases: hypertension, stroke, angina pectoris, myocardial infarction, and diabetes mellitus. We also employed a multilayer perceptron network for the same task for comparison. The results show higher accuracy for Char-RNN than for the conventional multilayer perceptron model. Char-RNN showed remarkable performance in finding patients with hypertension and stroke. The present study utilized the KNHANES VI data to demonstrate a practical approach to predicting and managing chronic diseases with partially observed information.

1. Introduction

Chronic diseases require long-term, continuous management. They take a long time to manifest and are difficult to cure [1]. According to the Current Status and Future Development of Chronic Disease Management Project of the Korean Ministry of Health and Welfare, death by five major chronic diseases (hypertension, stroke, angina pectoris, myocardial infarction, and diabetes mellitus) constituted 63.1% of the total deaths in Korea in 2003. While the cost burden of diseases has increased annually, the number of deaths caused by chronic diseases also continues to increase.
Various approaches have been introduced to prevent chronic diseases, and most of them focus on lifestyle [1,2,3]. However, it is difficult for individuals to change their lifestyle to prevent chronic diseases, because many people do not know which chronic diseases they may be susceptible to based on their physical condition and medical history. Although a few approaches have been used to predict the possibility of contracting these diseases, their performance was limited because relevant information on the physical condition and medical history was often omitted.
Various studies on chronic diseases have received a lot of attention since the 1990s. A few studies were conducted on the assumption that smoking, drinking, and high cholesterol levels cause chronic diseases. Summer et al. [2] examined the association of cholesterol level with stroke and coronary heart disease using experimental groups. Other related studies have included reports investigating the effects of dietary supplements on preventing chronic diseases. One such dietary supplement is chlorella, which is reportedly effective in facilitating growth and improving stress-related ulcers in individuals at high risk for chronic disease. A study evaluating the effects of chlorella use found that this supplement improved fat metabolism and lowered blood glucose levels, suggesting that it may have beneficial effects in preventing chronic disease [3]. Disease development may also be influenced by an individual’s living environment. A recent study quantified many diseases and risk factors that correspond to environmental variables by conducting correlation analyses on stress-related variables and chronic diseases [4]. As more health information data become available, a number of machine learning approaches have been implemented [2,3,4] to predict the characteristics of chronic disease potential using data as input variables and to predict these as individual medical histories. However, studies of chronic disease are usually experimental; hence, the resulting datasets tend to contain many missing values. Consequently, researchers are unlikely to obtain complete medical records and relevant information when analyzing chronic diseases. However, to the best of our knowledge, only a few approaches have predicted chronic diseases when there are missing values, and most of them have focused on handling them by imputation instead of implicit treatment.
This study aims to accurately predict chronic diseases when there are missing values by using the character-recurrent neural network (Char-RNN). Char-RNN is a deep learning analysis method that specializes in text learning. It learns the relationships among sentences and the words they contain. Char-RNN learns sequences more efficiently than traditional machine learning methods because it learns sequences by character basis. In addition, it has a high performance for missing data analysis because it learns the sequence of data in the data learning where the missing value exists and learns it according to the rule of the preceding and succeeding words. If an incorrect sentence is identified, it finds the meaning of the sentence by the learned relationships between words and sentences and generates the correct sentence with a similar meaning for the input.
Char-RNN has not been employed to deal with missing data, although it can implicitly treat unknown values. Thus, we applied Char-RNN to the Korea National Health and Nutrition Examination Survey (KNHANES) VI dataset (Supplementary Materials), which contains a large amount of missing information, to predict five types of chronic disease. Using the results of the five chronic diseases and normal health status, we learned the complete data that were not missing and used the learned model to predict the disease when data with missing values came in. The results show that Char-RNN has better prediction than the conventional multilayer perceptron model because it can predict by using previously learned data and shows better performance in processing missing values. We also found that the method of classifying missing data in one sentence has better predictive power than the method of sorting missing numerical values.
The remainder of this paper is structured as follows: the next section briefly reviews a few milestone studies on missing data analysis, chronic disease prediction, and recent deep learning approaches for health care; Section 3 describes the data and methods used in this study, including the model-building procedure; Section 4 presents the summarized results involving a comparison with conventional multilayer perceptron models; and finally, Section 5 provides the concluding remarks and future directions.

2. Related Work

Data on individual lifestyle habits, which are generally obtained through surveys, similar to other health-related data, must be collected to analyze chronic diseases related to lifestyle habits. However, individuals are often unable to answer some health survey questions, which introduces missing information to the survey dataset. A dataset containing missing values often causes failure in analysis. Missing data is a common problem in survey datasets; hence, various studies have been conducted on how to handle missing values. García-Laencina et al. [5] analyzed the missing data problem in pattern classification and analyzed the missing data by using pattern recognition technology when solving for missing or unknown data by using the actual classification operation. Case detection, missing data imputation, model-based procedures, and machine learning methods for handling were used. We decided to introduce missing data and make the right choice for the situation of the data [5]. The missing values are also applied to medical data. This method was applied to data collected through the El Alamo-I project using alternative methods based on statistical techniques such as multilayer perceptron (MLP), self-organization map (SOM), and k-nearest neighbor (KNN). The accuracy of predicting early cancer recurrence was measured using artificial neural network (ANN), estimated using ANN with missing data [6]. In 2019, Williams et al. [7] suggested knowledge extraction and management (KEM). KEM can identify all related relationships between variables, even when there is only weak correlation, compared to statistical approaches. Conventional methods for identifying multivariate classifiers use univariate analysis of all functions, marker identification to allow class discrimination, and optimization algorithms such as random forest, support vector machine (SVM), or neural networks to find the optimal combination.
Several studies on health care data analysis with missing values have been presented. Schuster et al. [8] suggested a multilevel support vector machine framework to handle missing information and incorrect data. Razzaghi et al. [9] imputed missing values by assigning the values of neighboring data points using four approaches: hierarchical multiagglomerative clustering, normal distribution model, normal regression model, and predictive mean matching. Liu et al. [10] handled missing data using a clustering approach to reduce bias when analyzing a virus’s potential for circulation. As demonstrated by these examples, most approaches control missing data by evaluating the surrounding mean and use clustering to compute the distance. Missing data have also been accurately estimated by applying an adjusted weight voting random forest–based model [11]. In 2001, data from the National Health Interview Survey were used to analyze multiple risk factors in the US population [12]. A total of 29,183 data points were used to analyze the data by cluster analysis of the risk factors. The analysis was excluded if there were missing data that would impair the accuracy.
In this study, the prediction of information about health is very sensitive to data omission; hence, a method to eliminate missing data is used. However, there is a limit to understanding data on missing information from the experimenter if there is a small amount of data or if data are missing because the participant does not know the information [13]. In 2002, Casaburi et al. [14] evaluated the safety and efficacy of new drugs for chronic obstructive pulmonary disease. They performed two 12-month clinical trials comparing the placebo effect to the drug effect, collected data, conducted covariance analysis using the collected data, and analyzed patients who could not be diagnosed by disease deterioration with the worst of the existing data. A commonality across these approaches is that missing values were imputed by estimating the values using adjacent data points in an arbitrary manner. In 2016, Liu et al. [15] looked at the 2003–2004 National Health and Nutrition Survey (NHANES) and physical activity data, and analyzed the missing data due to device failure in accelerometer measurement using a multiple imputation approach based on additive regression, bootstrapping, and predictive mean matching (ARBP). As a result, the most accurate ARBP model was selected and analyzed as the final model [15]. In 2017, Beaulieu-Jones and Moore [16] examined electronic health records (EHRs), which are a source of important data for patient status but have a lot of missing data. In this paper, imputation of missing information using deeply learned autoencoders in the Pooled Resource Open-Access ALS Clinical Trials Database (PRO-ACT) showed strong performance on estimation accuracy and contributed as the most powerful predictor of disease progression [17]. In 2019, Azimi et al. studied remote health status monitoring used to track patients and provide early detection of disease and preventive care. Internet-of-Things (IoT) technology should solve serious problems in real exams, but it facilitates the development of these monitoring systems. Therefore, forecasting is impossible with real-time health monitoring because missing data on human health indicators ignores variability. Therefore, IoT-based systems provide a way to experiment with clinical trials, learn new data from them, and make decisions on other missing data [18].
In 2019, a variety of machine learning data imputation methods was used to compare the accuracy of the data in order to replace the data of untested CpG coverage (i.e., for most CpGs, we have missing values), sites in the Bayesian hierarchy method of clustering cells using MEthyLation Inference for Single cell Analysis (Melissa) and finding posterior transition patterns between cells [19]. Another paper that makes it difficult to derive the complexity and trace levels of pollutants in the detection of unexpected compounds and chemical stability assessments for food safety assessment. Therefore, we performed missing data substitutions using Liquid Chromatography-High Resolution Mass Spectrometry(LC-HRMS) Peak Peaks, Mean-LOD, and Value Decomposition-Quantile Regression Imputation of Left-censored data(SVD-QRILC) combined with chemical measurement tools that use MTBLS752 and MTBLS74 data not explicitly stated [20]. Several studies on analyzing chronic diseases paying attention to preventing chronic diseases caused by the growing elderly population have recently been published.
The amount of health care data is steadily increasing; hence, various studies using deep learning and state-of-the-art methods in several applications, including image classification [21], text analysis [22], and speech recognition [23], are being conducted for data classification. In the field of health informatics, different deep learning architectures have been proposed along with the increased volume of relevant data, including convolutional neural network [24], recurrent neural network (RNN) [25], and deep neural network (DNN) [26], which is the most commonly used deep learning architecture in studies investigating data classification [27]. As such, the deep learning algorithm is also applied for health status and disease prediction. In 2013, Ahmed and Loutfi [28] introduced various methods and procedures for health monitoring and biometric information and data analysis using wearable sensors. Their methods processed and validated data to ensure that the data configuration was significant to the analysis, defined attributes for the datasets, and provided methods for analysis in the health and welfare sector.
Various machine learning methods are used as analysis methods. Using a machine learning method according to the data characteristics has also been suggested. In 2014, Kaur et al. [29] presented an improved J48 algorithm for predicting diabetes and analyzed it using the diabetes data of Pima Indians. Using a total of 768 pieces of data, they analyzed information from patients with diabetes and predicted diabetes. In 2019, using data collected from the National Institute of Diabetes and Digestive and Kidney Diseases, we compared SVM, Naïve bayes, Random forest, and Simple cart and SVM provided the best accuracy for predicting diabetes. Because the variables of the collected data for the prediction of diabetes were fixed and simple prediction to determine the presence or absence of the disease, good accuracy was obtained through the existing machine learning method. One study [30] predicted spatial prediction of landslide susceptibility in China’s Long Country region using kernel logistic regression, naive Bayes and RBFNetwork. In this study, we compared the accuracy of spatial prediction with the existing machine learning method and RBFNetwork because the analysis data structure was simple in predicting spatial sensitivity of landslide sensitivity [31]. In order to classify the signal of single channel Electroenocephalography (EEG), the EEG signal was judged as one sequence and the sequence of EEG was analyzed by LSTM method. This automatically classifies sleep stages for single-channel EEG signals. Because of this, it showed excellent performance in classifying sleep stages and analyzing sequence data through the order of EEG [32].
Moreover, we present improved analytical models to improve health status and disease prediction; however, there is a limit to the application of other similar data in practice using refined data. Therefore, we compare the model proposed in this paper by applying some of the missing data replacement methods and the machine learning classification method mentioned in the recent paper.

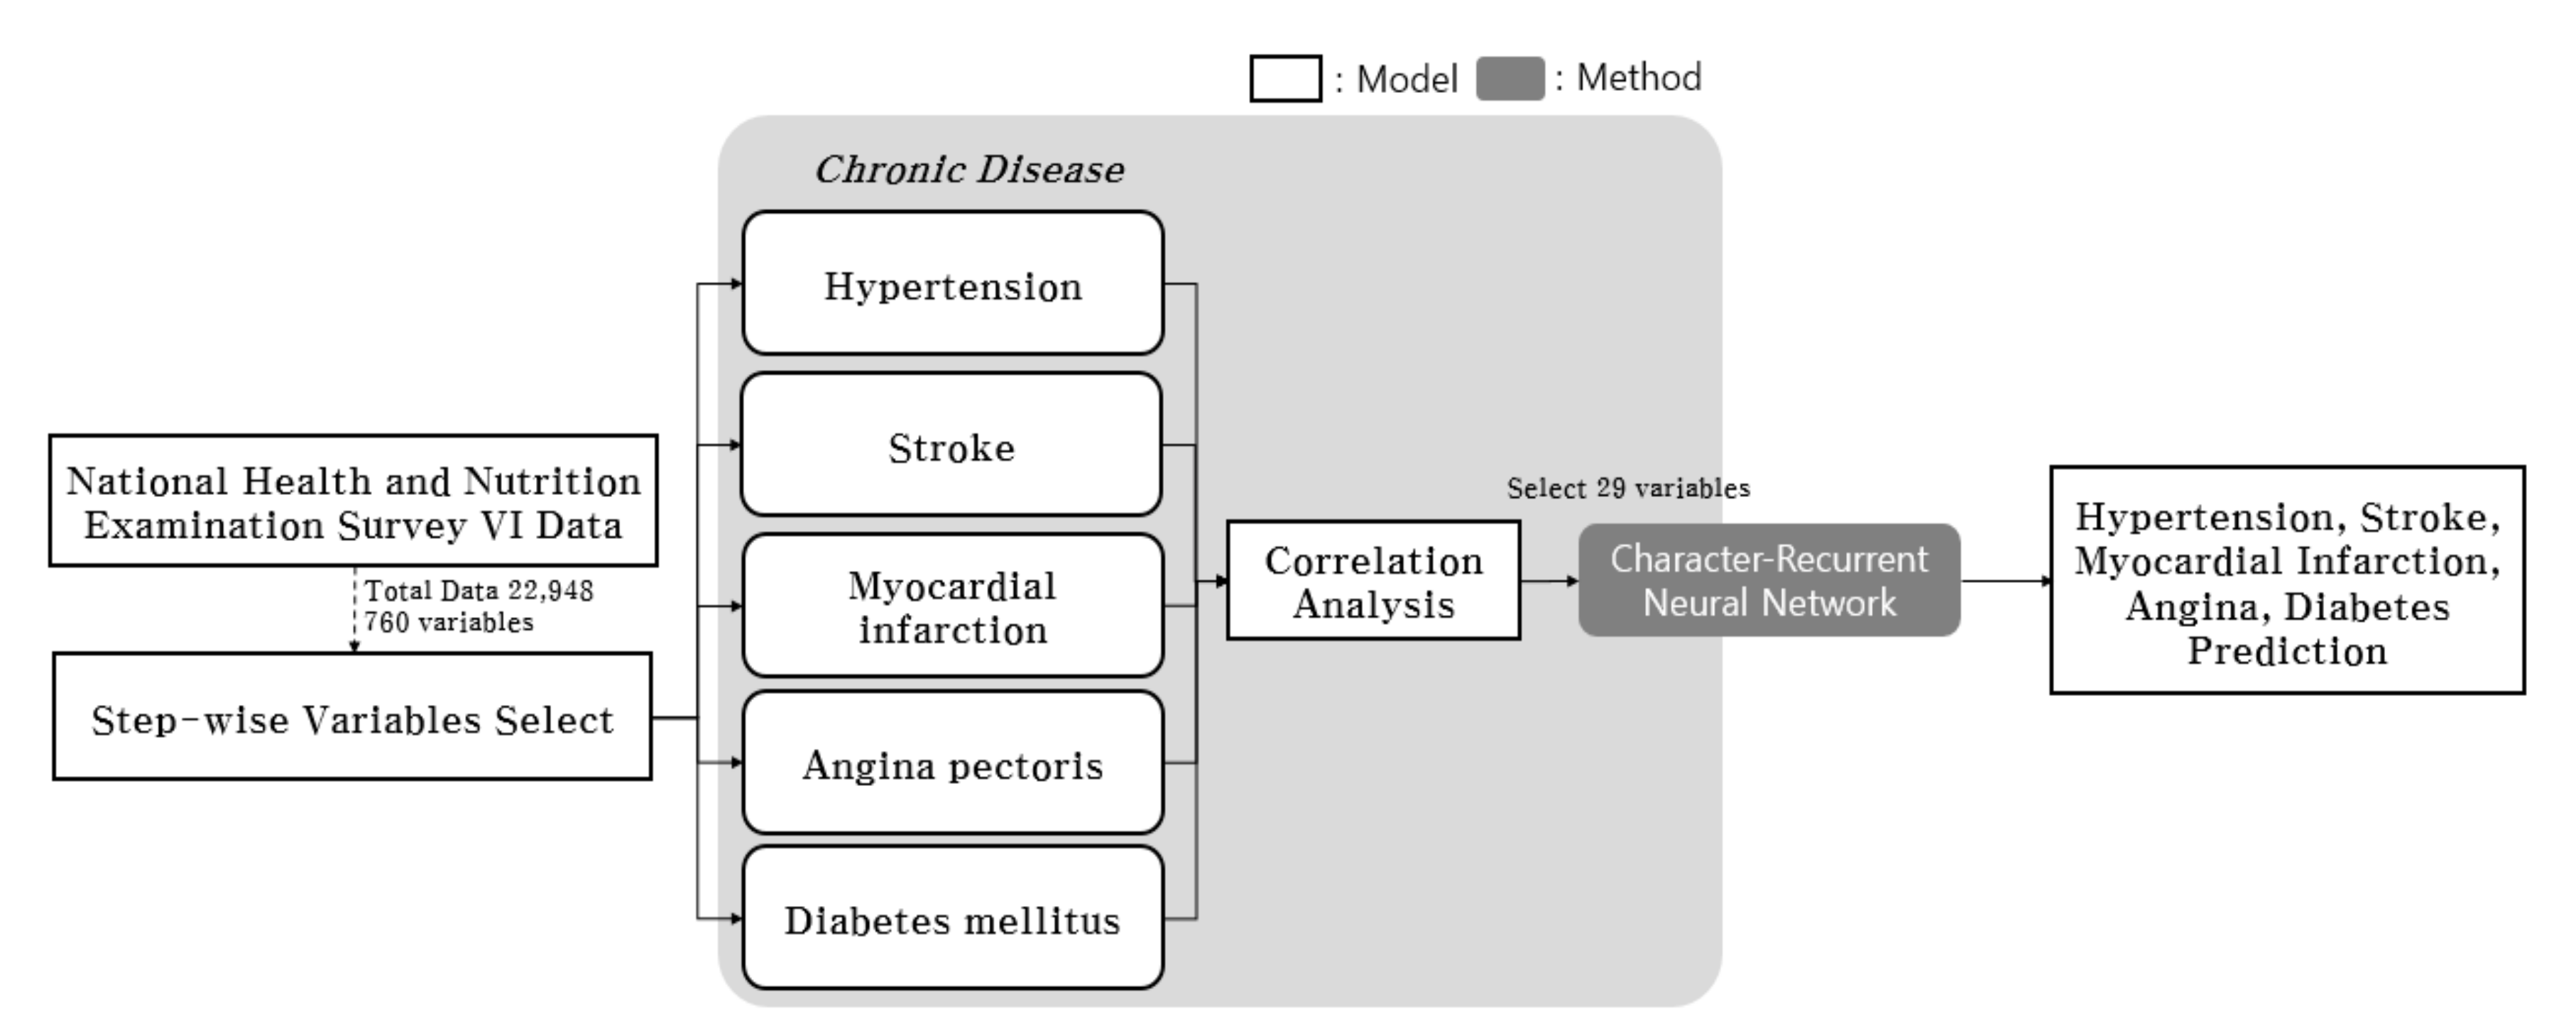
3. Materials and Methods

This study employed Char-RNN, which is a deep learning method for text analysis that considers the relationships between nearby values, to classify five chronic diseases in the KNHANES dataset with missing values. This section presents detailed descriptions of the dataset employed in this study, preprocessing applied to the dataset, and learning procedure. The Char-RNN algorithm is also explained.
Char-RNN is a deep learning model that creates short strings of characters using RNN. Char-RNN can learn and generate similar new sentences based on learned sentences and derive the sentence class similar to the learned sentences. In a study conducted by Yuan et al. (2017), they learned the drug molecule with Char-RNN and derived a new compound-binding equation [33]. RNN is a deep learning method that learns training data letter by letter, whereas Char-RNN segments a sentence into words and learns word by word. Char-RNN is trained on sentences and segments them into n-grams while learning them. Char-RNN is frequently used in translation, because this model accurately interprets typographical errors and missing letters and has higher accuracy in sentence learning compared with RNN. For example, in [34], training a Char-RNN model on music data to develop a transcription model showed that Char-RNN performed better than the existing methods in music transcription.
RNN is a deep learning method frequently used in work involving natural language processing (NLP) [35]. The model equation is h t = ( Wx t + Uh t 1 ) , where h t is a hidden layer at time t that is a function of x t (input at the same time t), W (a coefficient matrix), and a matrix U, which shows the value of a hidden layer at time t − 1 (i.e., h t 1 ). Memory is reflected in the coefficient matrix, W. A decision is made based on the current input value x t , an error value is computed, and the computed error is fed to the hidden layers. Next, W is updated based on the values. The sum of input x and memory h passes through the function and is compressed. The range of output values is restricted by a hyperbolic tangent function (tanh function) and can be differentiated segment by segment; hence, backpropagation is applied. Accordingly, h t and h t 1 feedback occurs at every moment. Through the learning process, the output is produced via a tanh function of input x and weight W multiplied by the input data. When an RNN model is trained on text based on these learning processes, it can learn short sentences; however, it does not perform well in learning long sentences or determining relationships among words.
In contrast to RNN, text analysis by Char-RNN learns a sentence by dividing it into n-gram segments, which results in superior learning performance when determining the relationships among words. Given a previous character sequence, Char-RNN effectively learns to predict the next character. This learning mode is similar to that of learning characters and sentences to output text vocabulary by generating a probability distribution of an object class-like image or character [35]. In this case, a standard categorical cross-entropy loss is used to effectively classify characters in a sentence and train a model whose output class is text vocabulary. Char-RNN divides the order of words into n-grams in each sentence, predicts the next word according to the order of the divided words, and grasps the meaning of the sentence. According to function 2, Char-RNN understands the sentences for n-grams before and after function 2 and learns one sentence by using it.
i = 1 n y i log ( y i ^ )
P ( w 1 , w 2 w n ) = P ( w i   |   w 1 , w 2 w i 1 )                

4. Data Description and Learning Procedure

We applied Char-RNN to data from the KNHANES VI (2013, 2014, and 2015) to predict five chronic diseases (hypertension, stroke, myocardial infarction, angina pectoris, and diabetes mellitus) with the greatest influence on comorbidities. The KNHANES is a national health survey conducted annually by the Korea Center for Disease Control that consists of questions to examine characteristics such as health behavior, nutritional intake, and chronic diseases [36]. The survey is administered to participants selected at the city, province, and county level. The screening items included in the survey are selected by the sector advisory committees and the coordinating advisory council. The KNHANES datasets have high reliability and accuracy because the data are collected by a national institute and the survey items are revised during each phase of the survey. The KNHANES datasets consist of 760 variables. This study focused on the phase VI data, containing approximately 22,000 cases reflecting the most recent lifestyle habits and patterns available in the datasets.
We selected five popular chronic diseases among a variety of diseases and related variables, including osteoarthritis, rheumatoid arthritis, osteoporosis, tuberculosis, asthma, thyroid disease, cancer, inflammation, and hepatitis. Table 1 presents the gender and age composition of the subjects included in the dataset for this study. Although the dataset contained 22,000 cases, most individual cases did not have any diagnosed disease. Consequently, significant variables were selected from the dataset with 760 variables using a regression analysis with stepwise variable selection. A total of 62 variables were selected for the five diseases. Correlations among selected variables were used to remove variables with strong correlation, with a correlation coefficient of 0.6 or higher, and finally, 32 variables were used for analysis. To maximize analytical accuracy, we excluded selected variables that coexisted with other selected variables during data processing (Table 2).
After variable selection, each variable value was interpreted as text and converted to character format. As shown in Figure 1, the numerical values of 29 variables relevant to the five diseases were converted to letters using the following rule: (0 → a, 1 → b, 2 → c…). The missing values were replaced with tabs that could not be represented in alphabetical order. The reason for assigning numbers to one alphabet was to train the data in the form of one sentence. The sequences 0001 and AAAB are the same.
Pretreatment divided the five diseases and six normal variables into the required variables. We extracted the variables using regression analysis to determine the variables affecting the disease. We trained Char-RNN with the preprocessed dataset after completing the preprocessing. Char-RNN learned each case as a sentence, identified the characteristics of the sentence from the cases, and determined the relationship between the label of each case and the corresponding characteristics of the transformed sentence. This approach assigned missing values in a new instance based on the characteristics or by considering the nearby values identified during the learning phase.

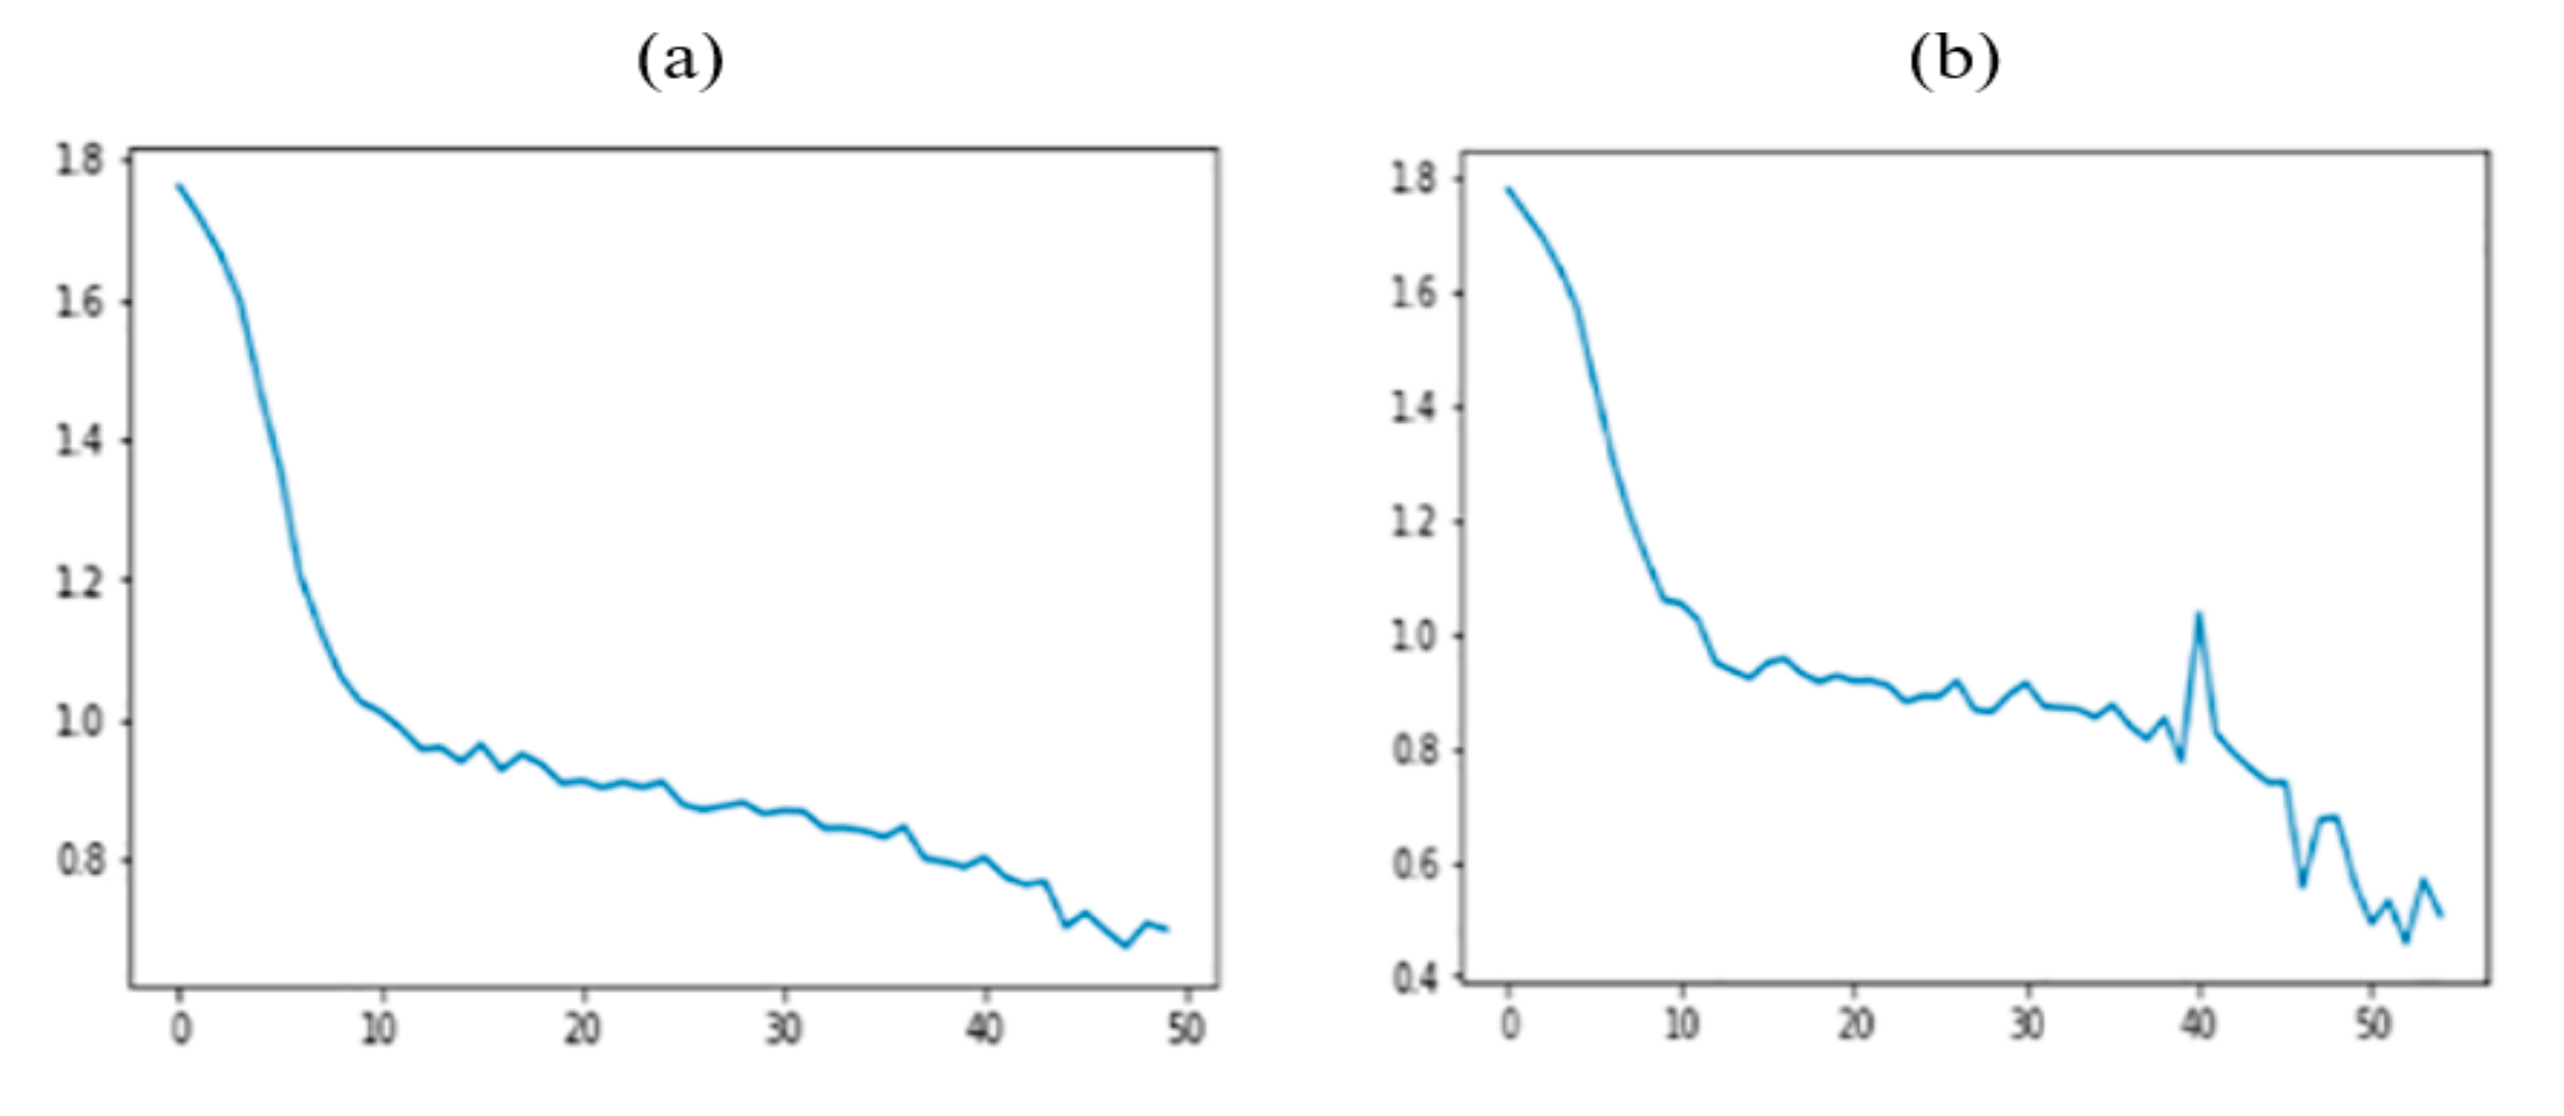
5. Experimental Results

The analysis was performed using two deep learning models. Figure 2 shows the whole process. Each model was trained to make decisions regarding cases labeled as normal, hypertension, stroke, myocardial infarction, angina pectoris, or diabetes mellitus and tested on test datasets with missing information to classify new cases. Learning was conducted with approximately 600 cases per label. The number of cases of angina pectoris and myocardial infarction was reduced to fewer than 600 during data processing; therefore, it can be seen that they are lower than the other chronic diseases. Hence, the sizes of these groups were increased by replicating existing cases to prevent overfitting due to imbalanced data. Char-RNN required the value of each case to be text, thus the data were converted using the rule (0 → a, 1 → b, 2 → c…). The data format was text separated by tabs. The data were transformed to sentence format for the learning phase.
Stepwise regression was used to remove the KNHANES VI variables that did not influence the five selected chronic diseases. There were a total of 760 variables in KNHANES VI, and 652 were selected after excluding pediatric- and female-specific and cancer-, joint-, or dental-related variables. Next, variables that were significantly associated with the five chronic diseases were selected using a stepwise selection method. In this case, variables with a p-value less than a significance level of 0.05 were extracted, and the rest were excluded because they were greater than that level. As a result, 17 variables were selected for hypertension, 20 for stroke, 23 for myocardial infarction, 22 for angina pectoris, and 29 for diabetes mellitus (Table A1). A few influential variables were associated with more than one disease; therefore, a total of 62 unique variables were selected. Table A2 lists detailed descriptions of the selected variables shown in Table A1, along with the variables affecting the five diseases, and detailed descriptions of the variables came with the KNHANES VI guideline. Of the available 22,000 cases, those with missing values in 200 or more variables relevant to the five chronic diseases were completely removed from the analysis dataset. In addition, the existing training data had to be cleaned up to make the model using the data of the selected variables. Therefore, we removed the data where there was at least one missing value for each disease. Finally, approximately 3000 cases were selected after the filtering steps. The analysis outcome can be affected by the presence of correlations among the selected variables; hence, a correlational analysis was conducted. The results show that a few variables were correlated with others, and those that strongly correlated with included variables were removed. The criterion of r > 0.6 was used to select and remove strongly correlated variables. A total of 32 variables remained after strongly correlated variables were removed.
Next, three variables (time of depression diagnosis, DF2_ag; time of angina pectoris diagnosis, DI6_ag; and presence or absence of comorbidities of myocardial infarction and angina pectoris, DI4_pr) were removed because they had similar values across all five chronic diseases and were likely to reduce the analysis accuracy. The response rates for these three variables were very low because a large majority of respondents did not know the answer. Consequently, the value of DF2_ag, DI4_pr, and DI6_ag was mostly 8, which was used to code the response “do not know” (Figure 2). Such variables may reduce the analysis accuracy; thus, they were removed, and the analysis was performed on the final set of 29 variables. Based on the finally selected 29 variables included in the KNHANES VI (2013, 2014, 2015) dataset, we performed a classification of the five chronic diseases (hypertension, stroke, myocardial infarction, angina pectoris, and diabetes mellitus) that affect many individuals but do not yet have clear predictive criteria. Figure 3 depicts a graph of the optimal learning frequency of the analytical model. The number of iterations during the learning phase was set at 50,000, because data loss increased when the number of iterations exceeded 50,000. Char-RNN was compared against multilayer perceptron (MLP), an extensively employed deep neural network model that was specifically developed for data classification. For MLP, three hidden layers were formed with 256, 128, and 64 nodes. The prediction accuracy was higher for Char-RNN than for MLP.
Table 4 shows the accuracies of chronic disease predictions in 100, 200, and 300 test datasets with missing values based on the outcomes of learning via DNN and Char-RNN. In testing the model using test data, data imputation was performed on the models other than Char-RNN. KNNimputation uses k-nearest neighbor and multiple imputation. KNNimputation finds k-nearest neighbors with missing data, and then finds k-missing neighbors. This was used to find the class of data. There are several ways to measure the distance of neighbor algorithms. In this paper, we used Euclidean distance to find the closest neighbor and then used that value as a replacement for missing data. Alternatively, KNN with k neighbors can be used to take the weighted average of the distance from neighbors as a weight. The closer you are to neighbors, the more weight you have when you average. Weighted averages seem to be the most commonly used method [37]. Multiple imputation consists of three steps: imputation, analysis, and pooling. Multiple imputation can be used to account for the uncertainty of results in all environments. It can be interpreted as multiple substitution using chain equations. Therefore, we simulated multiple imputation using existing data, created several missing value substitution sets (m), performed specific statistical modeling with functions in the analysis step, and averaged m sets of substitutions generated in the pooling step to derive the results. This found the most optimal missing data replacement value [38].
The variables (HE_HPdg, HE_DMdg, HE_HLdg, and HE_fh) were physician diagnoses; hence, they directly affected the prediction outcome. The brightness contrast in the confusion matrices indicated that Char-RNN performed better than other models in predicting chronic diseases. Overall, the accuracy and precision were higher for Char-RNN, and the recall level was similar between the two models. The predictive power of Char-RNN was particularly high for hypertension and stroke.
The accuracy was higher for Char-RNN compared to DNN, Bayesian, SVM, and long short-term memory (LSTM) models (Table 3 and Table 4), most likely because other models classify new data based on learning the training data, whereas Char-RNN learns training data by treating words as a data pattern and attributes meaning to a word when encountering a similar word in each label. Therefore, Char-RNN is far more effective than other models in handling missing values. In addition, it can learn long sequences exceptionally well even when there is missing information, because it learns the training data by dividing sequences into n-grams. The missing values of test datasets of other models were solved through data imputation. For the data imputation method, we processed the missing values using KNNimpute, mode impute, and multiple impute methods.

6. Conclusions

This study applied Char-RNN to the KNHANES VI dataset to classify five chronic diseases (hypertension, stroke, myocardial infarction, angina pectoris, and diabetes) and normal status to deal with missing values in the data. We first selected 29 of 760 variables using the stepwise selection method. We then applied Char-RNN to classify the five chronic diseases and normal status. A conventional DNN model with three hidden layers having 256, 128, and 64 nodes was applied to the same dataset for comparison. Additionally, LSTM and machine learning models, naïve Bayes, and SVM were used to compare the five chronic diseases. The results show that Char-RNN performed, on average, 10% better than the other models with KNN, mode, and multiple imputation methods. Table 4 shows that LSTM was more accurate for normal status and SVM was more accurate for stroke; however, Char-RNN had higher performance for the remaining four classes. In the comparison of missing values in Table 3, we can see that Char-RNN had better accuracy than the other models on the test dataset with missing values, because it predicted the labels of partially observed instances by identifying the data patterns surrounding the missing values. In addition, the data replacement method was used to replace the missing values in the other four models; however, Char-rnn did not go through the data replacement process for the missing values. Therefore, Char-rnn can provide better results than other machine learning methods that result when analyzing missing data without passing through the data transfer process, thus reducing data preprocessing time. Characterization of char-rnn allows for more accurate prediction and classification.
However, a few limitations must also be considered. First, the KNHANES dataset was only collected in South Korea. Therefore, applying Char-RNN to a dataset including respondents of diverse ethnicities and lifestyle habits can be one future research direction. This study also focused on the prediction of a dataset with missing values using machine learning methods. Identifying common and different features across chronic diseases to prevent those diseases by using machine learning methods can be studied in future work. Finally, there are several implicit methods for missing data analysis other than Char-RNN. Applying these implicit methods and comparing the results to find the best method of predicting chronic diseases can be useful.

Supplementary Materials

The data Korea National Health and Nutrition Examination Survey (KNHANES) VI are available online at https://www.cdc.go.kr/CDC/contents/CdcKrContentView.jsp?cid=60939&menuIds=HOME001-MNU1130-MNU1639-MNU1748-MNU1751.

Author Contributions

C.K. responsible the whole part of the paper (Conceptualization, methodology, analysis and writing—original draft preparation) Y.S. responsible methodology and review and editing and S.Y. responsible methodology review and editing and supervision.

Funding

This research was supported by the Basic Science Research Program through the National Research Foundation of Korea (NRF) funded by the Ministry of Education (2017R1D1A1B03034028) and the Dongguk University Research Fund of 2016.

Conflicts of Interest

The authors declare no conflict of interest.

Appendix A

Table A1. Chronic disease variables, P-values.
Chronic DiseaseVariablesPr(>|t|)
HypertensionDI1_dg<2e−16***
DI1_pt<2e−16***
DI1_20.003949**
DE1_dg0.023553*
DE1_pt0.024046*
DE1_320.011176*
DF2_ag0.024011*
LQ4_060.003265**
LQ4_070.048531*
LQ4_080.002055**
LQ4_146.13e−06***
EC1_20.022494*
BS6_2_10.042053*
BS6_2_20.035517*
HE_HPdg0.000380***
HE_DMdr6.90e−05***
HE_STRfh10.000204***
Myocardial infarctionDI1_dg0.018140*
DI1_pt0.022980*
DI1_20.048649*
DI3_dg0.015375*
DI3_ag0.003401**
DI3_26.39e−07***
DI4_dg<2e−16***
DI4_pr<2e−16***
DI4_pt0.005583**
DI5_dg9.58e−10***
DI5_ag<2e−16***
DI5_pt<2e−16***
DI6_dg<2e−16***
DI6_ag6.88e−08***
DI6_pt<2e−16***
DE1_ag0.036523*
DE1_330.000187***
LQ4_040.000334***
LQ1_mn0.012614*
educ0.000503***
BO3_070.002166**
BP6_310.027196*
HE_HPdg0.000907***
DE1_330.000187***
LQ4_040.000334***
LQ1_mn0.012614*
educ0.000503***
BO3_070.002166**
BP6_310.027196*
HE_HPdg0.000907***
Diabetes mellitusDI1_dg<2e−16***
DI1_pt<2e−16***
DI1_21.54e−14***
DI5_dg0.008476**
DI5_ag0.003172**
DI6_dg0.018528*
DI6_ag0.003206**
DE1_dg0.000918***
DE1_pt0.002990**
DE1_40.014432*
DE2_dg0.030405*
DF2_pr0.014291*
DK4_pr0.010164*
LQ4_150.001020**
LQ4_220.000761***
EC_occp0.022475*
EC_lgw_20.000365***
EC_lgw_40.000505***
EC_lgw_50.003918**
BO3_040.005202**
BD7_40.023864*
BP50.045927*
BS6_2_10.044478*
BS6_30.007516**
BS6_40.015076*
HE_HPdg0.000262***
HE_DMdg9.46e−14***
HE_HLdg1.07e−05***
HE_fh0.000380 ***
StrokeDI3_dg<2e−16***
DI3_dg<2e−16***
DI3_ag4.82e−15***
DI3_pt<2e−16***
DI3_23.31e−09***
DI4_dg3.94e−07***
DI4_pt0.000148***
DI5_ag0.000691***
DI5_pt2.13e−09***
DI6_pt1.91e−05***
LQ4_040.001673**
LQ4_067.47e−14***
BS3_10.031119*
BS3_20.030441*
BS3_30.028916*
BS6_30.002509**
HE_fst0.041026*
HE_HPdg0.001564**
HE_HLfh30.044872*
HE_IHDfh30.003670**
HE_STRfh11.82e−05***
Angina pectorisDI1_dg0.001704**
DI1_pt0.001441**
DI1_20.000919***
DI3_dg0.002154**
DI3_ag0.000437***
DI3_21.05e−08***
DI4_dg<2e−16***
DI4_pr<2e−16***
DI4_pt<2e-16***
DI5_dg6.35e−11***
DI5_ag5.68e−11***
DI6_dg<2e−16***
DI6_pt<2e−16***
DE1_330.000111***
LQ4_040.003495**
LQ4_060.008981**
LQ1_mn0.038536*
educ0.008716**
BO3_070.047492*
BD2_320.028725*
BS6_30.049513*
HE_STRfh10.036219*
Table A2. Chronic disease variables, explanation.
Chronic DiseaseVariablesVariable Description
HypertensionDI1_dgWhether diagnosed with hypertension by a physician
DI1_ptHypertension treatment
DI1_2Taking blood pressure regulator
DE1_dgWhether diagnosed with diabetes mellitus by a physician
DE1_ptDiabetes mellitus treatment
DE1_32Diabetes mellitus treatment_antidiabetics
DF2_agTime of depression diagnosis
LQ4_06(Adult) Reason for limited activity: stroke
LQ4_07(Adult) Reason for limited activity: diabetes mellitus
LQ4_08(Adult) Reason for limited activity: hypertension
LQ4_14(Adult) Reason for limited activity: dementia
EC1_2Reason for unemployment
BS6_2_1(Adult) Smoking duration of past smokers (years)
BS6_2_2(Adult) Smoking duration of past smokers (months)
StrokeDI3_dgWhether diagnosed with stroke by a physician
DI3_agTime of stroke diagnosis
DI3_ptStroke treatment
DI3_2Sequelae of stroke
DI4_dgWhether diagnosed with myocardial infarction, angina pectoris by a physician
DI4_ptMyocardial infarction, angina pectoris treatment
DI5_agTime of myocardial infarction diagnosis
DI5_ptMyocardial infarction treatment
DI6_ptAngina pectoris treatment
LQ4_04Reason for limited activity: heart disease
LQ4_06(Adult) Reason for limited activity: stroke
BS3_1(Adult) Currently smoking or not
BS3_2(Adult) Average daily smoking amount of current smokers
BS3_3(Adult) Number of days smoking per month of occasional smokers
BS6_3(Adult) Average daily smoking amount of past smokers
HE_fstFasting duration
HE_HPdgWhether diagnosed with hypertension by a physician
HE_HLfh3Whether diagnosed with hypercholesterolemia by a physician (siblings)
HE_IHDfh3Whether diagnosed with ischemic heart disease by a physician (siblings)
HE_STRfh1Whether diagnosed with stroke by a physician (father)
Myocardial infarctionDI1_dgWhether diagnosed with hypertension by a physician
DI1_ptHypertension treatment
DI1_2Taking blood pressure regulator
DI3_dgWhether diagnosed with stroke by a physician
DI3_agTime of stroke diagnosis
DI3_2Sequelae of stroke
DI4_dgWhether diagnosed with myocardial infarction, angina pectoris by a physician
DI4_prCurrent morbidity of myocardial infarction, angina pectoris
DI4_ptMyocardial infarction, angina pectoris treatment
DI5_dgWhether diagnosed with myocardial infarction by a physician
DI5_agTime of myocardial infarction diagnosis
DI5_ptMyocardial infarction treatment
DI6_dgWhether diagnosed with angina pectoris by a physician
DI6_agTime of angina pectoris diagnosis
DI6_ptAngina pectoris treatment
DE1_agTime of diabetes mellitus diagnosis
DE1_33Diabetes mellitus treatment: non-pharmaceutical therapy
LQ4_04Reason for limited activity: heart disease
LQ1_mnNumber of days bedridden in the last month
educEducation level
BO3_07Weight control method: health functional food
BP6_31Whether attempted suicide in the past year
HE_HPdgWhether diagnosed with hypertension by a physician
Angina pectorisDI1_dgWhether diagnosed with hypertension by a physician
DI1_ptHypertension treatment
DI1_2Taking blood pressure regulator
DI3_dgWhether diagnosed with stroke by a physician
DI3_agTime of stroke diagnosis
DI3_2Sequelae of stroke
DI4_dgWhether diagnosed with myocardial infarction, angina pectoris by a physician
DI4_prCurrent morbidity of myocardial infarction, angina pectoris
DI4_ptMyocardial infarction, angina pectoris treatment
DI5_dgWhether diagnosed with myocardial infarction by a physician
DI5_agTime of myocardial infarction diagnosis
DI6_dgWhether diagnosed with angina pectoris by a physician
DI6_ptMyocardial infarction treatment
DE1_33Diabetes mellitus treatment: non-pharmaceutical therapy
LQ4_04Reason for limited activity: heart disease
LQ4_06(Adult) Reason for limited activity: stroke
LQ1_mnNumber of days bedridden in the last month
educEducation level
BO3_07Weight control method: health functional food
BD2_32(Adult) Frequency of heavy drinking
BS6_3(Adult) Average daily smoking amount of past smokers
HE_STRfh1Whether diagnosed with stroke by a physician (father)
Diabetes mellitusDI1_dgWhether diagnosed with hypertension by a physician
DI1_ptHypertension treatment
DI1_2Taking blood pressure regulator
DI5_dgWhether diagnosed with myocardial infarction by a physician
DI5_agTime of myocardial infarction diagnosis
DI6_dgWhether diagnosed with angina pectoris by a physician
DI6_agTime of angina pectoris diagnosis
DE1_dgWhether diagnosed with diabetes mellitus by a physician
DE1_ptDiabetes mellitus treatment
DE1_4Ophthalmoscopy
DE2_dgWhether diagnosed with thyroid disease by a physician
DF2_prCurrent morbidity of depression
DK4_prCurrent morbidity of cirrhosis
LQ4_15Reason for limited activity: depression/anxiety/emotional problem
LQ4_22(Adult) Reason for limited activity: old age
EC_occp(If employed) Occupation type
EC_lgw_2(Adult) Longest occupation: occupational code + unemployment/non-economic activity status
EC_lgw_4(Adult) Longest occupation: worker title
EC_lgw_5(Adult) Longest occupation: worker title wage workers in detail
BO3_04(Adult) Weight control method: prescription weight loss pills
BD7_4(Adult) Whether family/physician recommended to quit drinking
BP5Whether feeling depressed for two 2 weeks or more at a time
BS6_2_1(Adult) Smoking duration of past smokers (years)
BS6_3(Adult) Average daily smoking amount of past smokers
BS6_4(Adult) Smoking cessation period of past smokers converted to months
HE_HPdgWhether diagnosed with hypertension by a physician
HE_DMdgWhether diagnosed with diabetes mellitus by a physician
HE_HLdgWhether diagnosed with hypercholesterolemia by a physician
HE_fhFamily history of diagnosis of chronic disease by a physician

References

  1. Beratarrechea, A.; Lee, A.G.; Willner, J.M.; Jahangir, E.; Ciapponi, A.; Rubinstein, A. The impact of mobile health interventions on chronic disease outcomes in developing countries: A systematic review. Telemed. J. E Health 2014, 20, 75–82. [Google Scholar] [CrossRef] [PubMed]
  2. Sumner, M.D.; Elliott-Eller, M.; Weidner, G.; Daubenmier, J.J.; Chew, M.H.; Marlin, R.; Raisin, C.J.; Ornish, D. Effects of pomegranate juice consumption on myocardial perfusion in patients with coronary heart disease. Am. J. Cardiol. 2005, 96, 810–814. [Google Scholar] [CrossRef]
  3. Mizoguchi, T.; Takehara, I.; Masuzawa, T.; Saito, T.; Naoki, Y. Nutrigenomic studies of effects of Chlorella on subjects with high-risk factors for lifestyle-related disease. J. Med. Food 2008, 11, 395–404. [Google Scholar] [CrossRef]
  4. Liu, S.H.; Erion, G.; Novitsky, V.; De Gruttola, V. Viral genetic linkage analysis in the presence of missing data. PLoS ONE 2015, 10, e0135469. [Google Scholar] [CrossRef] [PubMed]
  5. García-Laencina, P.J.; Sancho-Gómez, J.L.; Figueiras-Vidal, A.R. Pattern classification with missing data: A review. Neural Comput. Appl. 2010, 19, 263–282. [Google Scholar] [CrossRef]
  6. Jerez, J.M.; Molina, I.; García-Laencina, P.J.; Alba, E.; Ribelles, N.; Martín, M.; Franco, L. Missing data imputation using statistical and machine learning methods in a real breast cancer problem. Artif. Intell. Med. 2010, 50, 105–115. [Google Scholar] [CrossRef] [PubMed]
  7. Williams, C.; Polom, K.; Adamczyk, B.; Afshar, M.; D’Ignazio, A. Machine learning methodology applied to characterize subgroups of gastric cancer patients using an integrated large biomarker dataset. Eur. J. Surg. Oncol. 2019, 45, e79. [Google Scholar] [CrossRef]
  8. Schuster, T.L.; Dobson, M.; Jauregui, M.; Blanks, R.H. Wellness lifestyles I: A theoretical framework linking wellness, health lifestyles, and complementary and alternative medicine. J. Altern. Complement. Med. 2004, 10, 349–356. [Google Scholar] [CrossRef]
  9. Razzaghi, T.; Roderick, O.; Safro, I.; Marko, N. Multilevel weighted support vector machine for classification on healthcare data with missing values. PLoS ONE 2016, 11, e0155119. [Google Scholar] [CrossRef]
  10. Tian, T.; McLachlan, G.J.; Dieters, M.J.; Basford, K.E. Application of multiple imputation for missing values in three-way three-mode multi-environment trial data. PLoS ONE 2015, 10, e0144370. [Google Scholar] [CrossRef] [PubMed]
  11. Xiao, J.; Xu, Q.; Wu, C.; Gao, Y.; Hua, T.; Xu, C. Performance Evaluation of missing-value imputation clustering based on a multivariate Gaussian mixture model. PLoS ONE 2016, 11, e0161112. [Google Scholar] [CrossRef]
  12. Fine, L.J.; Philogene, G.S.; Gramling, R.; Coups, E.J.; Sinha, S. Prevalence of multiple chronic disease risk factors: 2001 National Health Interview Survey. Am. J. Prev. Med. 2004, 27, 18–24. [Google Scholar] [CrossRef]
  13. Gupta, S.; Kumar, D.; Sharma, A. Performance analysis of various data mining classification techniques on healthcare data. Perform. J. Comput. Sci. Inf. Technol. 2011, 3, 155–169. [Google Scholar]
  14. Casaburi, R.; Mahler, D.A.; Jones, P.W.; Wanner, A.; San Pedro, G.; ZuWallack, R.L.; Menjoge, S.S.; Serby, C.W.; Witek, T. A long-term evaluation of once-daily inhaled tiotropium in chronic obstructive pulmonary disease. Eur. Respir. J. 2002, 19, 217–224. [Google Scholar] [CrossRef] [PubMed] [Green Version]
  15. Liu, B.; Yu, M.; Graubard, B.I.; Troiano, R.P.; Schenker, N. Multiple imputation of completely missing repeated measures data within person from a complex sample: Application to accelerometer data in the National Health and Nutrition Examination Survey. Stat. Med. 2016, 35, 5170–5188. [Google Scholar] [CrossRef]
  16. Beaulieu-Jones, B.K.; Moore, J.H. Missing data imputation in the electronic health record using deeply learned autoencoders. In Proceedings of the Pacific Symposium Pacific Symposium on Biocomputing 2017, Kohala Coast, HI, USA, 4–8 January 2017; pp. 207–218. [Google Scholar]
  17. Youm, S.; Park, S. How the awareness of u-Healthcare service and health conditions affect healthy lifestyle: An empirical analysis based on a u-Healthcare service experience. Telemed. J. e-Health 2015, 21, 286–295. [Google Scholar] [CrossRef]
  18. Azimi, I.; Pahikkala, T.; Rahmani, A.M.; Niela-Vilén, H.; Axelin, A.; Liljeberg, P. Missing data resilient decision-making for healthcare IoT through personalization: A case study on maternal health. Future Gener. Comput. Syst. 2019, 96, 297–308. [Google Scholar] [CrossRef]
  19. Kapourani, C.A.; Sanguinetti, G. Melissa: Bayesian clustering and imputation of single-cell methylomes. Genome Biol. 2019, 20, 61. [Google Scholar] [CrossRef]
  20. Delaporte, G.; Cladière, M.; Camel, V. Missing value imputation and data cleaning in untargeted food chemical safety assessment by LC-HRMS. Chemom. Intell. Lab. Syst. 2019, 188, 54–62. [Google Scholar] [CrossRef]
  21. Lin, Y.; Lv, F.; Zhu, S.; Yang, M.; Cour, T.; Yu, K.; Cao, L.; Huang, T. Large-scale image classification: Fast feature extraction and SVM training. In Proceedings of the 2011 IEEE Conference on Computer Vision and Pattern Recognition (CVPR), Colorado Springs, CO, USA, 20–25 June 2011. [Google Scholar]
  22. Lin, X.; Yang, J.; Zhao, J. The text analysis and processing of Thai language text to speech conversion system. In Proceedings of the 2014 9th International Symposium on Chinese Spoken Language Processing (ISCSLP), Singapore, 12–14 September 2014. [Google Scholar]
  23. Molina, C.; Yoma, N.B.; Huenupan, F.; Garretón, C.; Wuth, J. Maximum entropy-based reinforcement learning using a confidence measure in speech recognition for telephone speech. IEEE Trans. Audio Speech Lang. Process. 2010, 18, 1041–1052. [Google Scholar] [CrossRef]
  24. Kwak Müller, K.; Lee, S. A convolutional neural network for steady state visual evoked potential classification under ambulatory environment. PLoS ONE 2017, 12, e0172578. [Google Scholar]
  25. Miotto, R.; Wang, F.; Wang, S.; Jiang, X.; Dudley, J.T. Deep learning for healthcare: Review, opportunities and challenges. Brief. Bioinform. 2017, 19, 1236–1246. [Google Scholar] [CrossRef]
  26. Esteva, A.; Kuprel, B.; Novoa, R.A.; Ko, J.; Swetter, S.M.; Blau, H.M.; Thrun, S. Dermatologist-level classification of skin cancer with deep neural networks. Nature 2017, 542, 115. [Google Scholar] [CrossRef]
  27. Ravì, D.; Wong, C.; Deligianni, F.; Berthelot, M.; Andreu-Perez, J.; Lo, B.; Yang, G.Z. Deep learning for health informatics. J. Biomed. Health Inform. 2017, 21, 4–21. [Google Scholar] [CrossRef]
  28. Banaee, H.; Ahmed, M.; Loutfi, A. Data mining for wearable sensors in health monitoring systems: A review of recent trends and challenges. Sensors 2013, 13, 17472–17500. [Google Scholar] [CrossRef]
  29. Kaur, G.; Chhabra, A. Improved J48 classification algorithm for the prediction of diabetes. Int. J. Comput. Appl. 2014, 98, 13–17. [Google Scholar] [CrossRef]
  30. Mir, A.; Dhage, S.N. Diabetes Disease Prediction Using Machine Learning on Big Data of Healthcare. In Proceedings of the 2018 Fourth International Conference on Computing Communication Control and Automation (ICCUBEA), Pune, India, 16–18 August 2018; pp. 1–6. [Google Scholar]
  31. Chen, W.; Yan, X.; Zhao, Z.; Hong, H.; Bui, D.T.; Pradhan, B. Spatial prediction of landslide susceptibility using data mining-based kernel logistic regression, naive Bayes and RBFNetwork models for the Long County area (China). Bull. Eng. Geol. Environ. 2019, 78, 247–266. [Google Scholar] [CrossRef]
  32. Michielli, N.; Acharya, U.R.; Molinari, F. Cascaded LSTM recurrent neural network for automated sleep stage classification using single-channel EEG signals. Comput. Biol. Med. 2019, 106, 71–81. [Google Scholar] [CrossRef]
  33. Yuan, W.; Jiang, D.; Nambiar, D.K.; Liew, L.P.; Hay, M.P.; Bloomstein, J.; Lu, P.; Turner, B.; Le, Q.T.; Tibshirani, R.; et al. Chemical space mimicry for drug discovery. J. Chem. Inf. Model. 2017, 57, 875–882. [Google Scholar] [CrossRef] [PubMed]
  34. Bojanowski, P.; Joulin, A.; Mikolov, T. Alternative structures for character-level RNNs. arXiv 2015, arXiv:1511.06303. [Google Scholar]
  35. Cho, K.; Van Merriënboer, B.; Gulcehre, C.; Bahdanau, D.; Bougares, F.; Schwenk, H.; Bengio, Y. Learning phrase representations using RNN encoder–decoder for statistical machine translation. arXiv 2014, arXiv:1406.1078. [Google Scholar]
  36. Korea Centers for Disease Control & Prevention. Available online: https://knhanes.cdc.go.kr/knhanes/eng/index.do (accessed on 6 November 2018).
  37. Zhang, S. Nearest neighbor selection for iteratively kNN imputation. J. Syst. Softw. 2012, 85, 2541–2552. [Google Scholar] [CrossRef]
  38. Royston, P. Multiple imputation of missing values: Update of ice. Stata J. 2005, 5, 527–536. [Google Scholar] [CrossRef]
Figure 1. Data category configuration.
Applsci 09 02170 g001
Figure 2. Overview of proposed procedure using character-recurrent neural network (Char-RNN).
Applsci 09 02170 g002
Figure 3. Data loss at (a) 50,000 and (b) 55,000 epochs.
Applsci 09 02170 g003
Table 1. Demographic variables in Korea National Health and Nutrition Examination Survey (KNHANES) VI.
Age1–9: 2489 (10.8%)
10–18: 2425 (10.6%)
19–29: 2250 (9.8%)
30–39: 2946 (12.8%)
40–49: 3283 (14.3%)
50–59: 3499 (15.2%)
60–69: 3014 (13.1%)
70 and older: 3042 (13.3%)
Gender variableMale: 10,411 (45.4%)
Female: 12,537 (54.6%)
Type of residential areaNeighborhood: 18,551 (80.8%)
Town/township: 4397 (19.2%)
Marital status (for those aged 30 or older)Not married: 904 (5.7%)
Married (with a spouse): 12,298 (78.1%)
Married (widowed, divorced, or separated): 2549 (16.2%)
Education level (for those aged 30 or older)Graduated from elementary school or less: 3670 (27.2%)
Graduated from middle school: 1609 (11.9%)
Graduated from high school: 4135 (30.6%)
Graduated from college or higher: 4084 (30.3%)
Table 2. Data construct. DF2_ag, time of depression diagnosis; DI6_ag, time of angina pectoris diagnosis; DI4_pr, presence or absence of comorbidities of myocardial infarction and angina pectoris.
DF2_agDI4_prDI6_ag
8888888
8888888
8888888
8881888
8888888
8888888
8888888
8888888
8888888
Table 3. Accuracies with varying numbers of selected variables. MLP, multilayer perceptron; SVM, support vector machine; LSTM, long short-term memory; KNN, k-nearest neighbor; MI.
MLP
Number of VariablesAccuracy (100)Accuracy (200)Accuracy (300)
KNNModeMIKNNModeMIKNNModeMI
1058%54%51%57.3%56.1%53.1%60.9%58.2%64.4%
2067%65%62%65.5%68.6%64.5%68.8%64%62.5%
3084%75%87%79.2%71.7%73.7%72.5%77.8%78.5%
Naïve Bayes
Number of VariablesAccuracy (100)Accuracy (200)Accuracy (300)
KNNModeMIKNNModeMIKNNModeMI
1042%45%48%48.2%51.8%42.2%68.1%62.5%64.2%
2062%69%63%65.2%62.4%64.6%69.3%65.6%66.7%
3076%74%77%79.5%71.7%72.6%74.8%71.8%76.8%
SVM
Number of VariablesAccuracy (100)Accuracy (200)Accuracy (300)
KNNModeMIKNNModeMIKNNModeMI
1055%57%51%52.7%57.4%55.5%62.3%64.2%62.6%
2065%67%59%65.4%68.2%62.1%64.2%68.1%67.6%
3077%81%82%84.1%82.7%76.4%72.5%79.5%72.8%
LSTM
Number of VariablesAccuracy (100)Accuracy (200)Accuracy (300)
KNNModeMIKNNModeMIKNNModeMI
1060%62%64%60.5%58.2%57.4%56.8%54.5%65.8%
2067%68%74%72.8%71.5%78.5%73.5%75.4%77.1%
3082%84%86%80.9%82.8%87.8%90.9%91.4%85.5%
Char-RNN
Number of VariablesAccuracy (100)Accuracy (200)Accuracy (300)
1064%66.3%62.5%
2081%84.2%79.4%
3092%91.5%91.7%
Table 4. Comparison of results of Char-RNN and other models.
MLPNaïve Bayes
VariablesAccuracyPrecisionRecallAccuracyPrecisionRecall
Normal74.4%77.9%50.7%62.2%75.5%42.5%
Hypertension46.2%48.9%45.7%53.2%82.2%47.4%
Stroke35.7%46.2%51.4%48.7%84.6%56.4%
Myocardial infarction80.3%86.2%49.7%71.4%73%64.4%
Angina pectoris92.1%97.9%50.3%68.4%86.4%61.2%
Diabetes mellitus93.6%94.9%50.1%74.4%76.2%66.6%
SVMLSTM
VariablesAccuracyPrecisionRecallAccuracyPrecisionRecall
Normal72.3%82.8%62.5%79.5%82.4%51.7%
Hypertension74.2%86.4%45.2%75.2%84.1%46.2%
Stroke81.4%96.5%47.6%80.1%97.1%48.5%
Myocardial infarction75.8%89.1%65.4%79.8%92.4%47.2%
Angina pectoris74.3%84.2%67.5%84.5%94.2%56.4%
Diabetes mellitus81.1%78.5%57.2%89.7%96.6%65.6%
Char-RNN
VariablesAccuracyPrecisionRecall
Normal77.6%78.4%49.8%
Hypertension82.6%86.0%50.7%
Stroke80.6%88.6%48.4%
Myocardial infarction82.5%94.4%48.6%
Angina pectoris96.5%98.0%49.7%
Diabetes mellitus95.2%96.9%47.5%

