A Novel Wavelet-Based Algorithm for Detection of QRS Complex

Abstract
1. Introduction
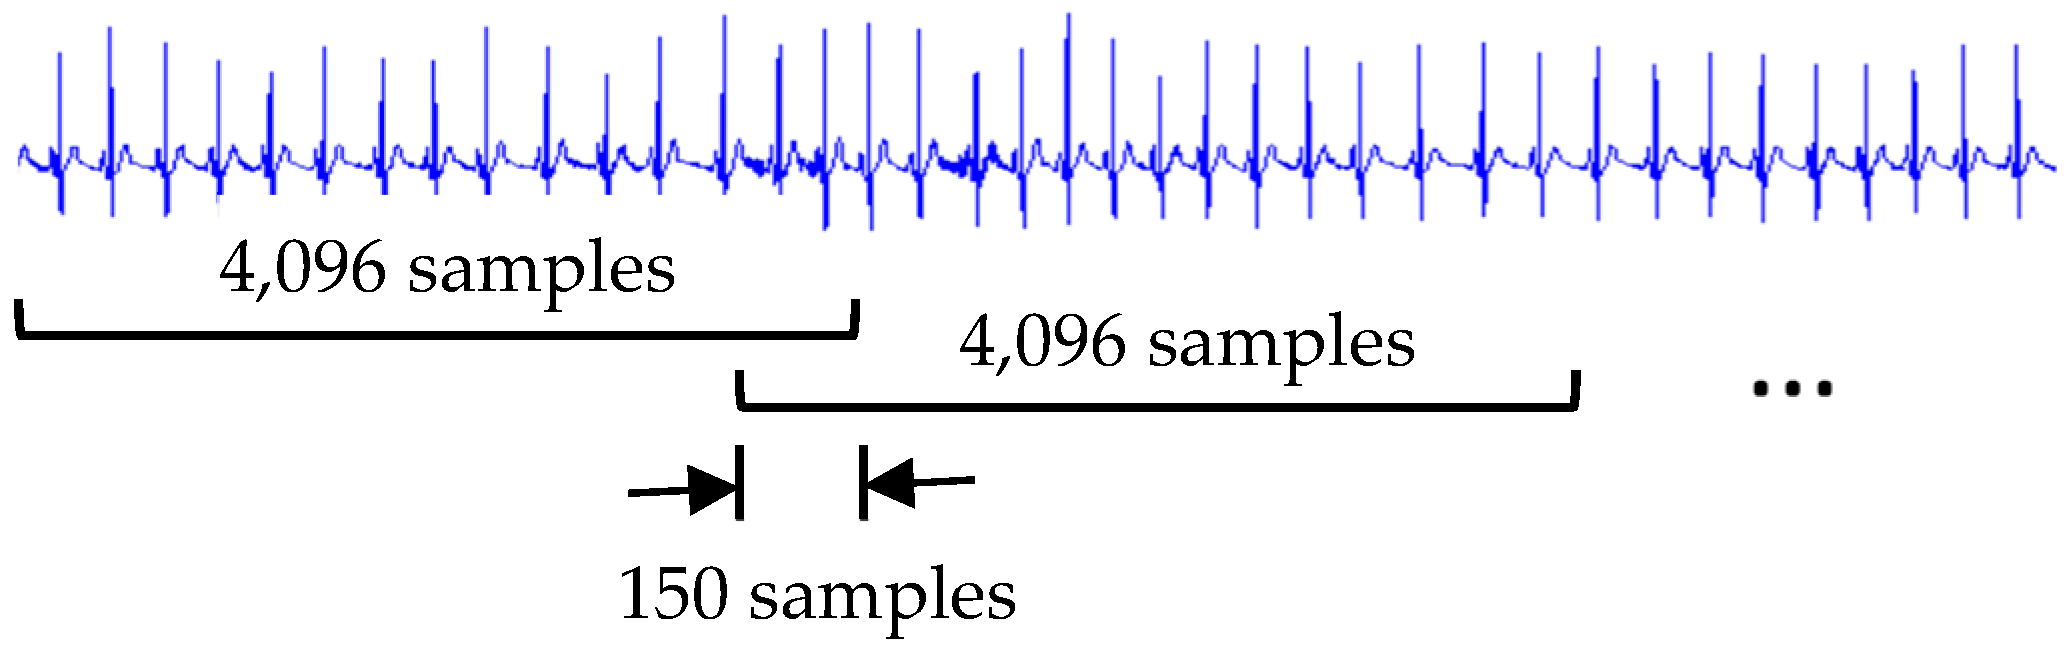
2. ECG Recordings
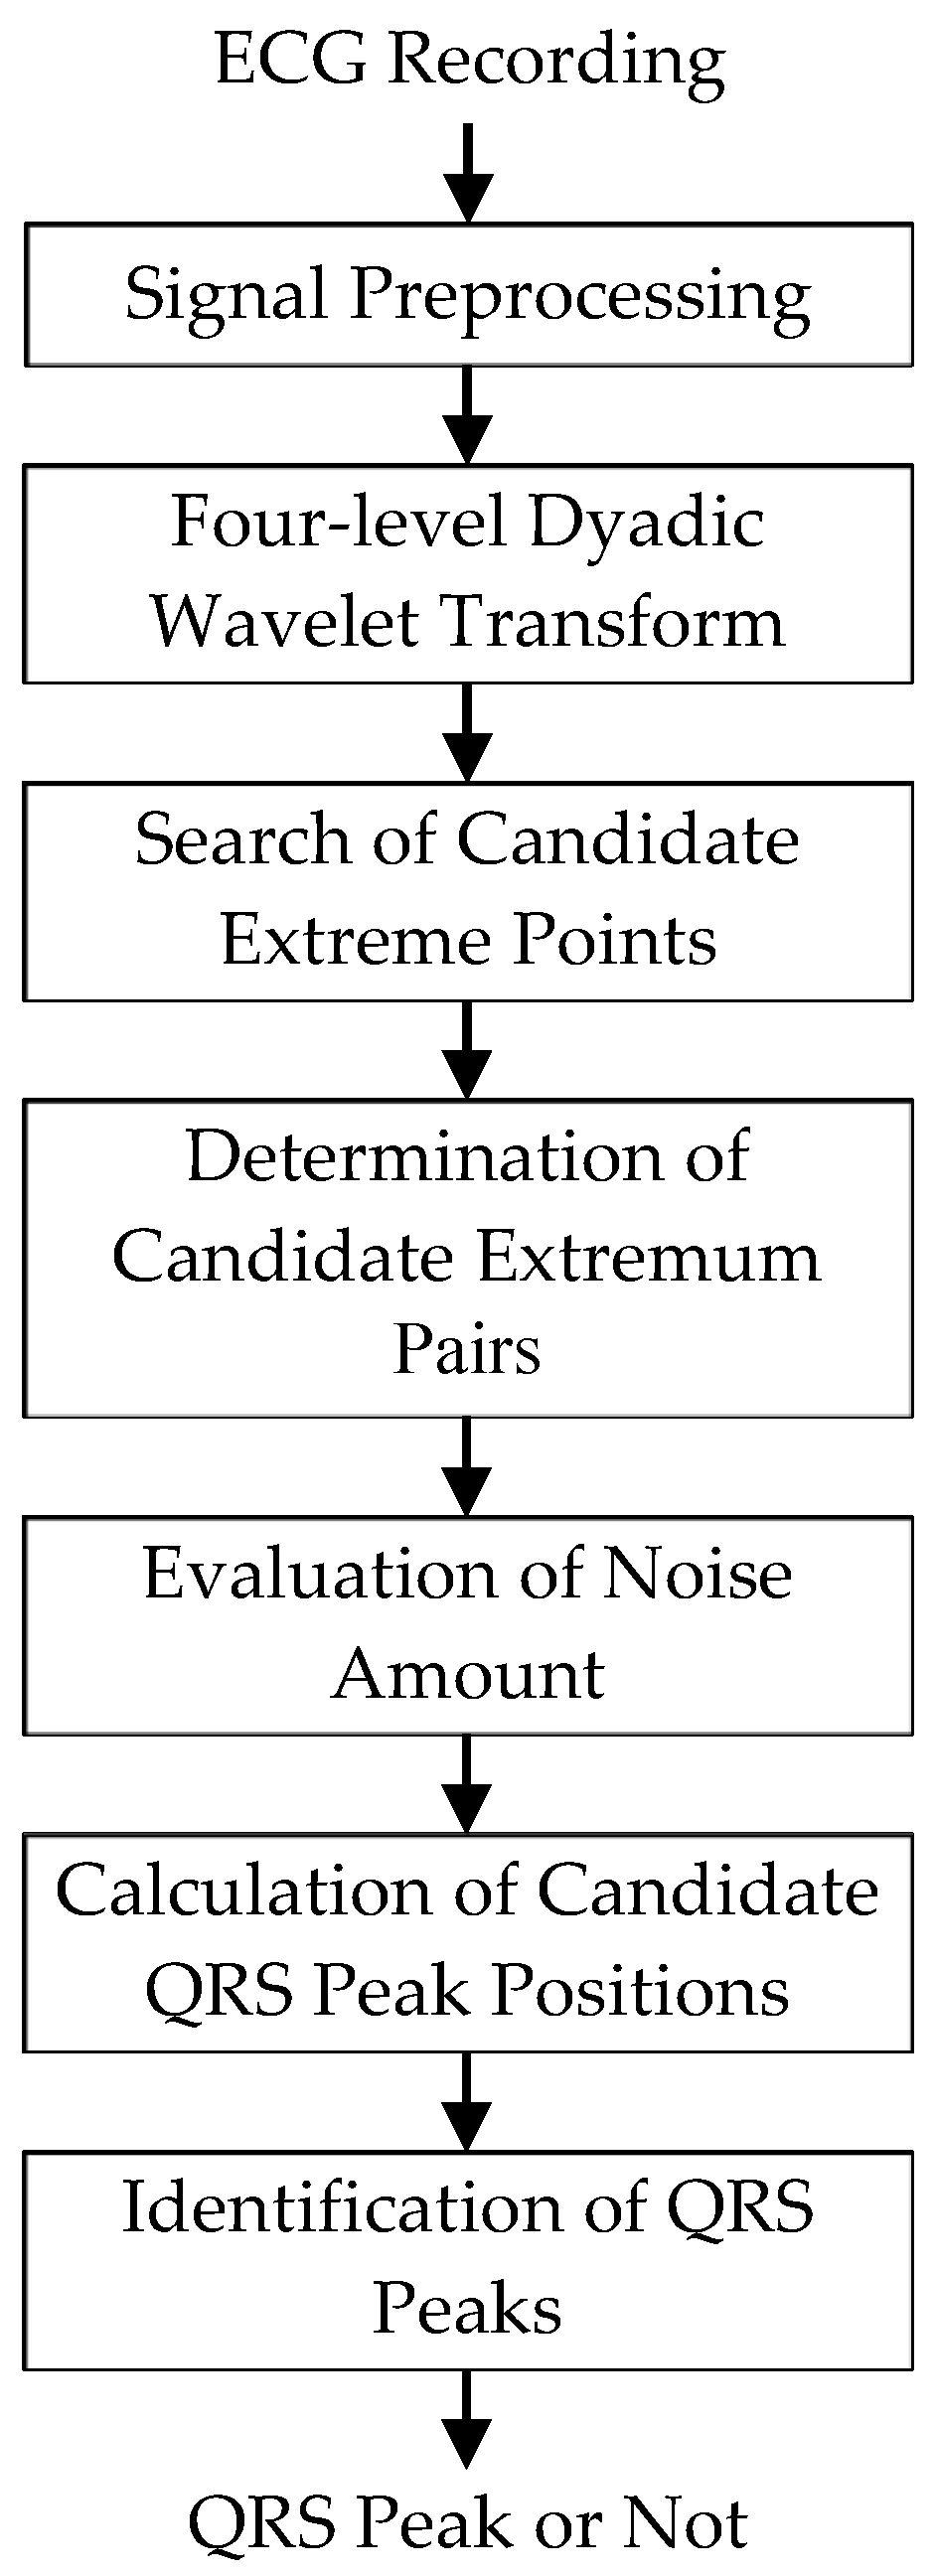
3. Methodology
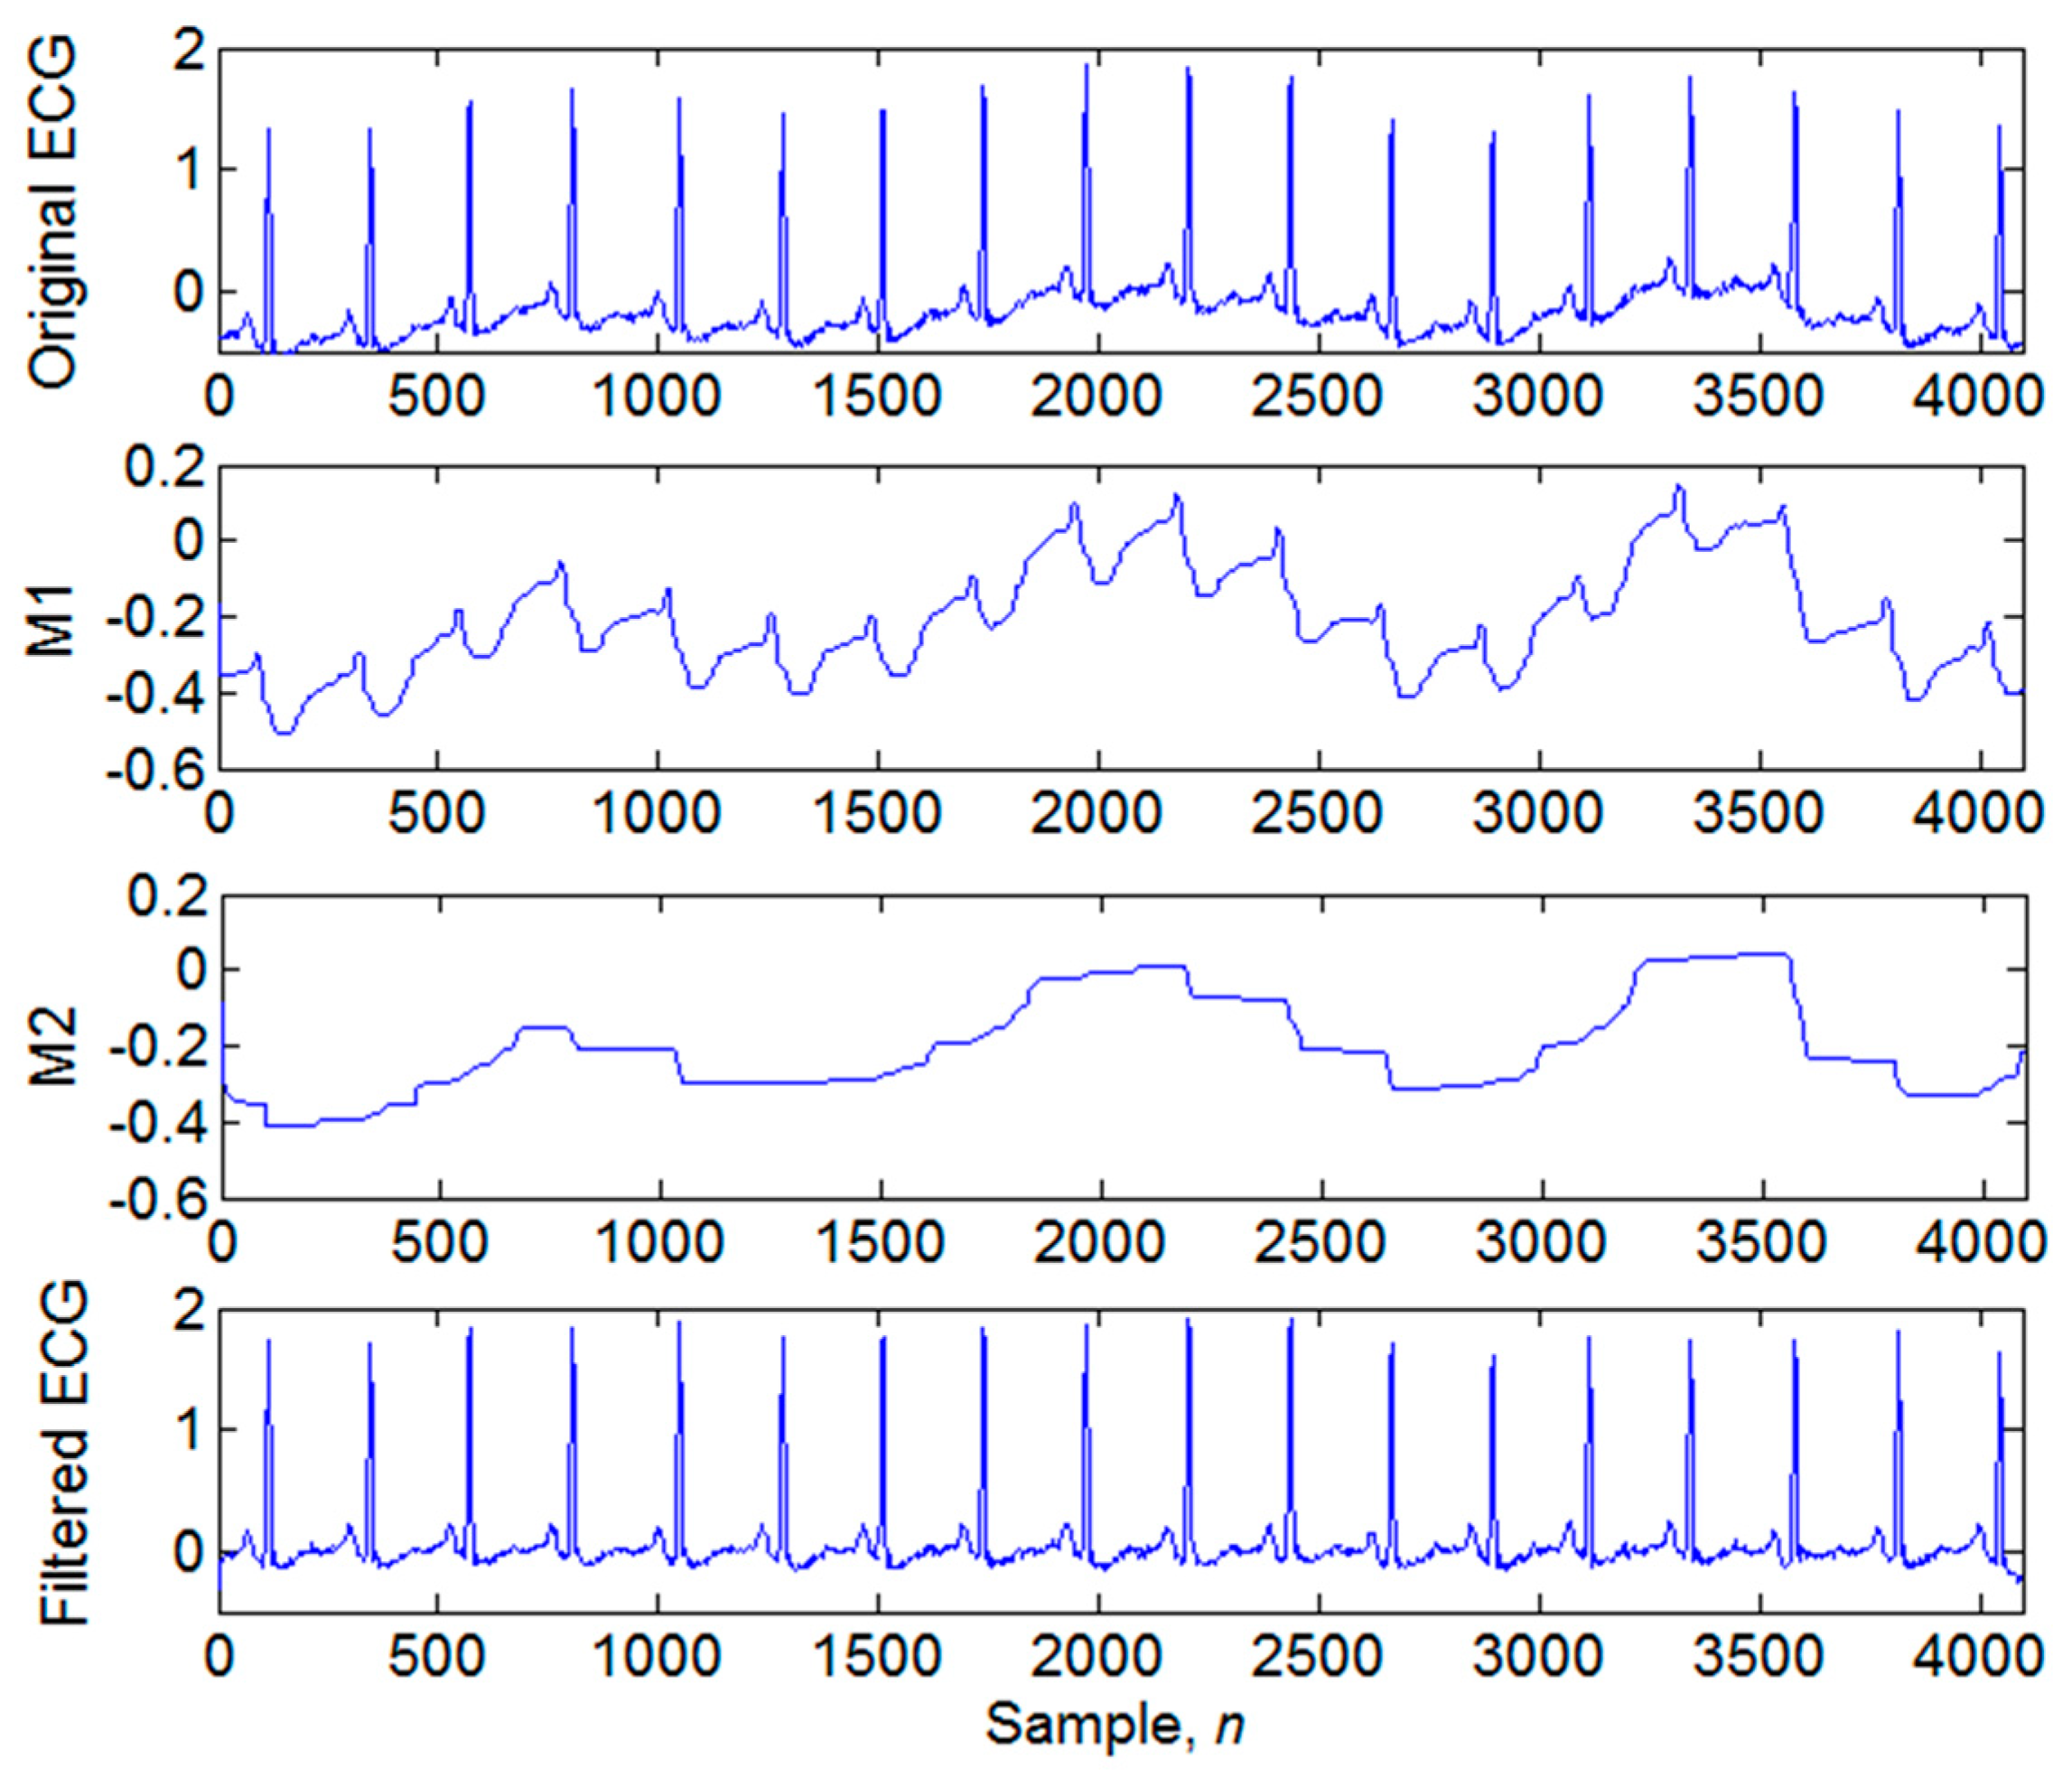
3.1. Signal Preprocessing
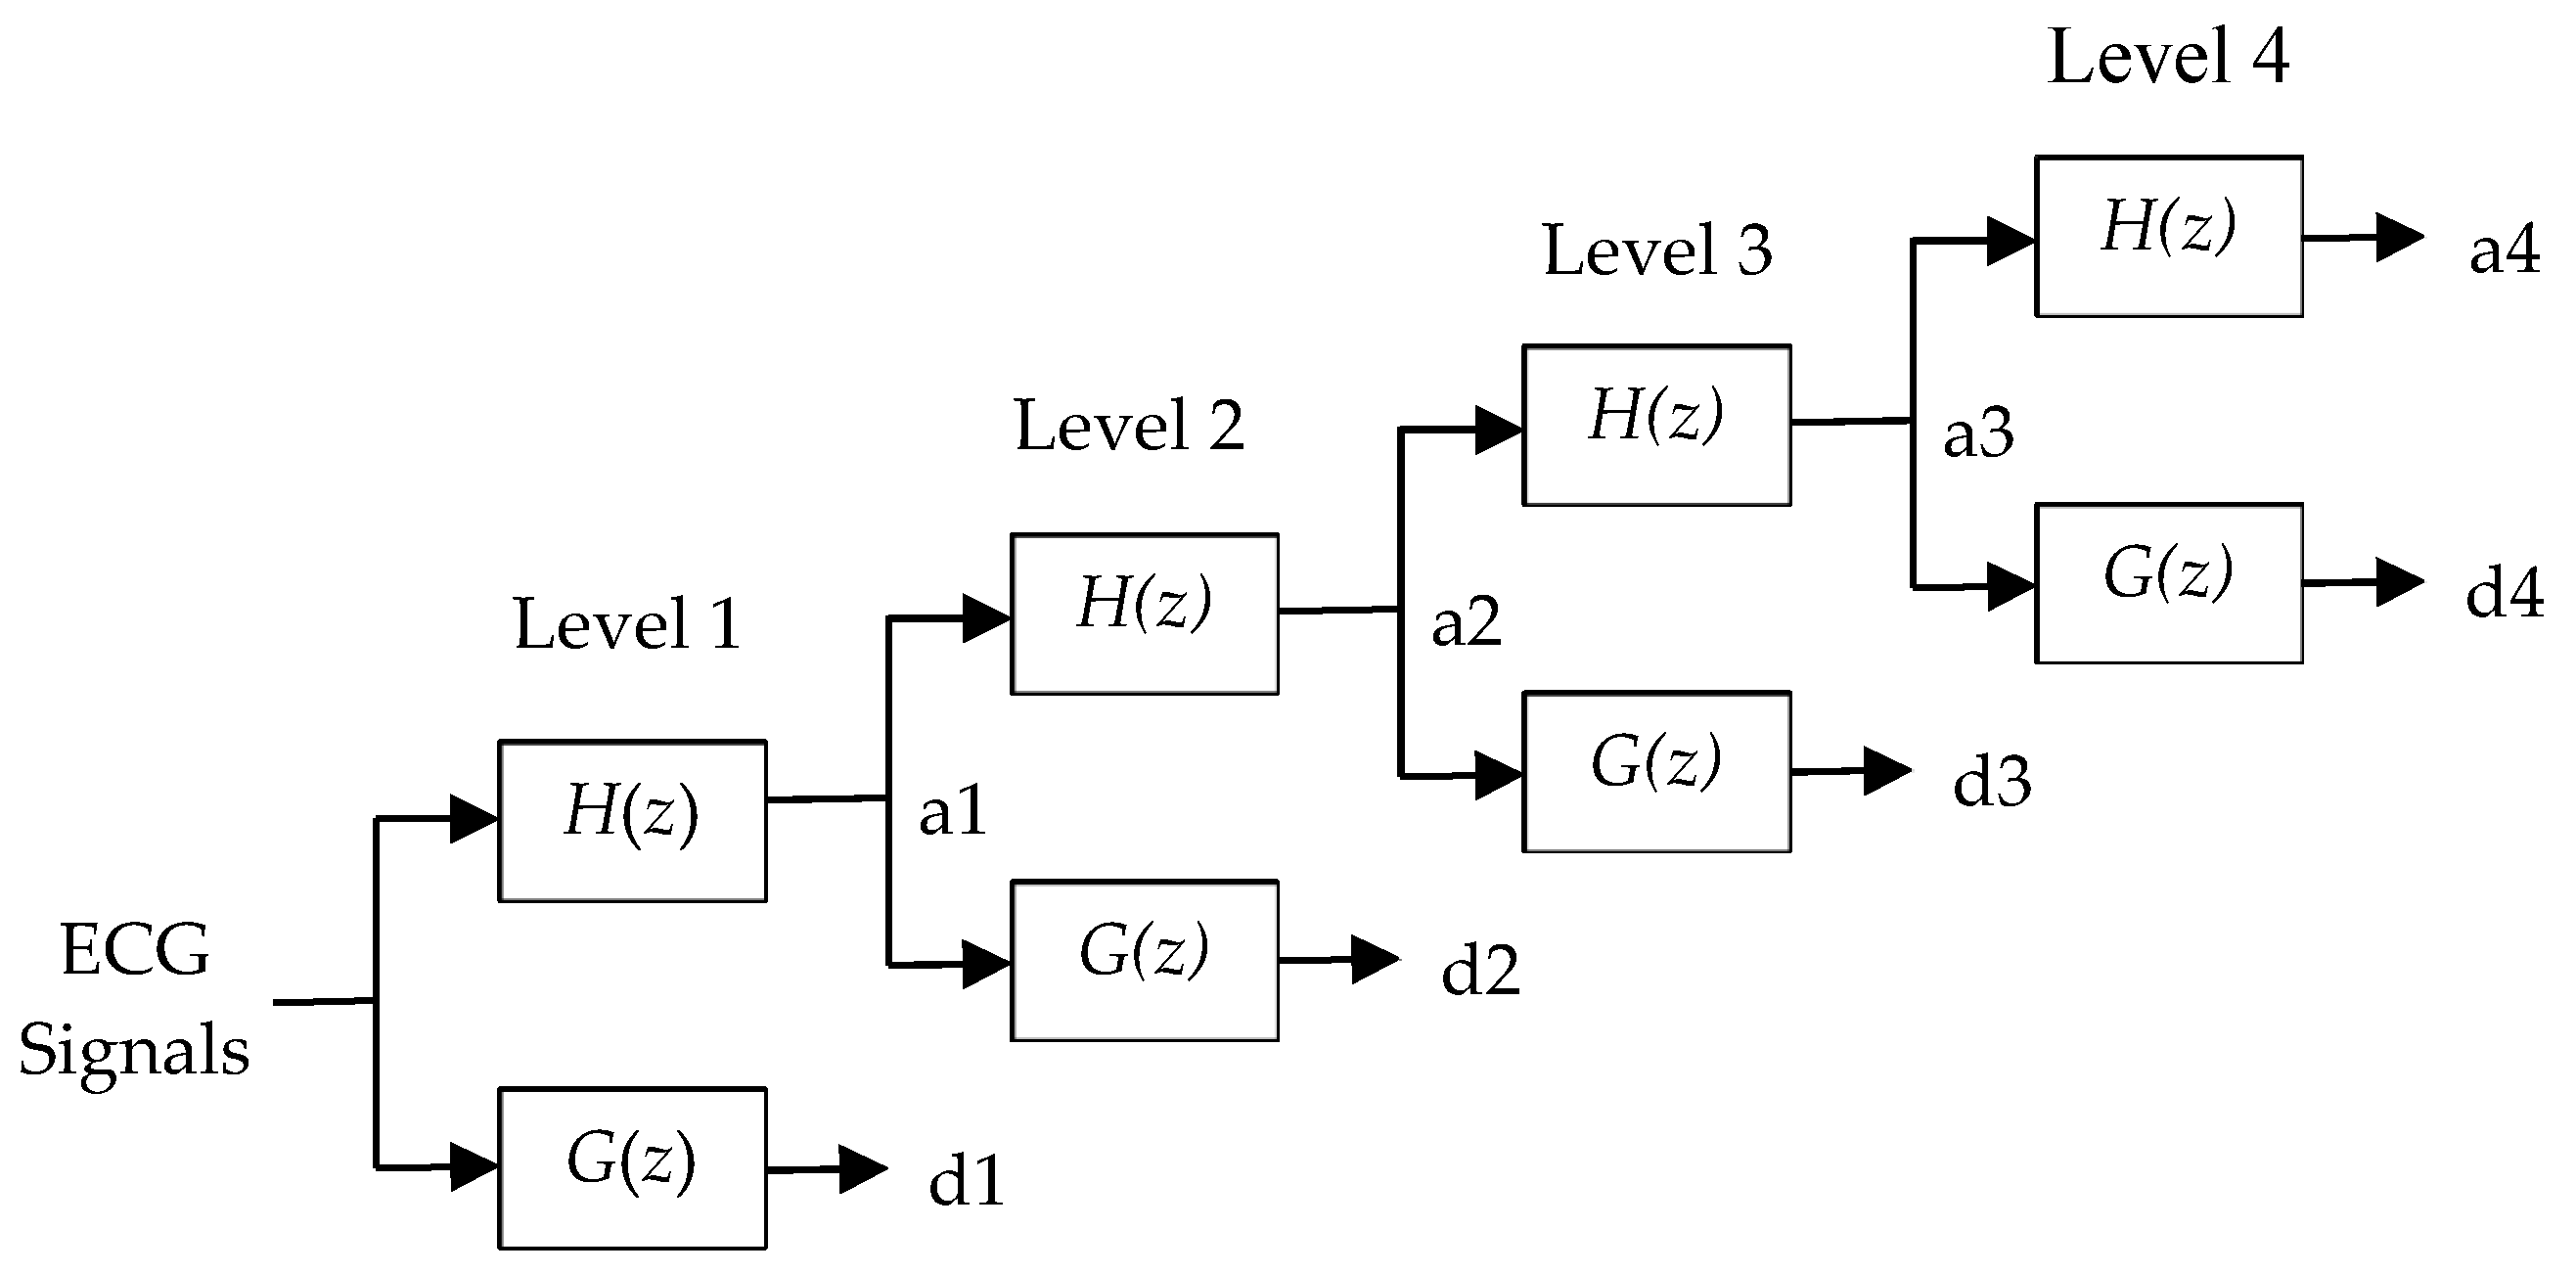
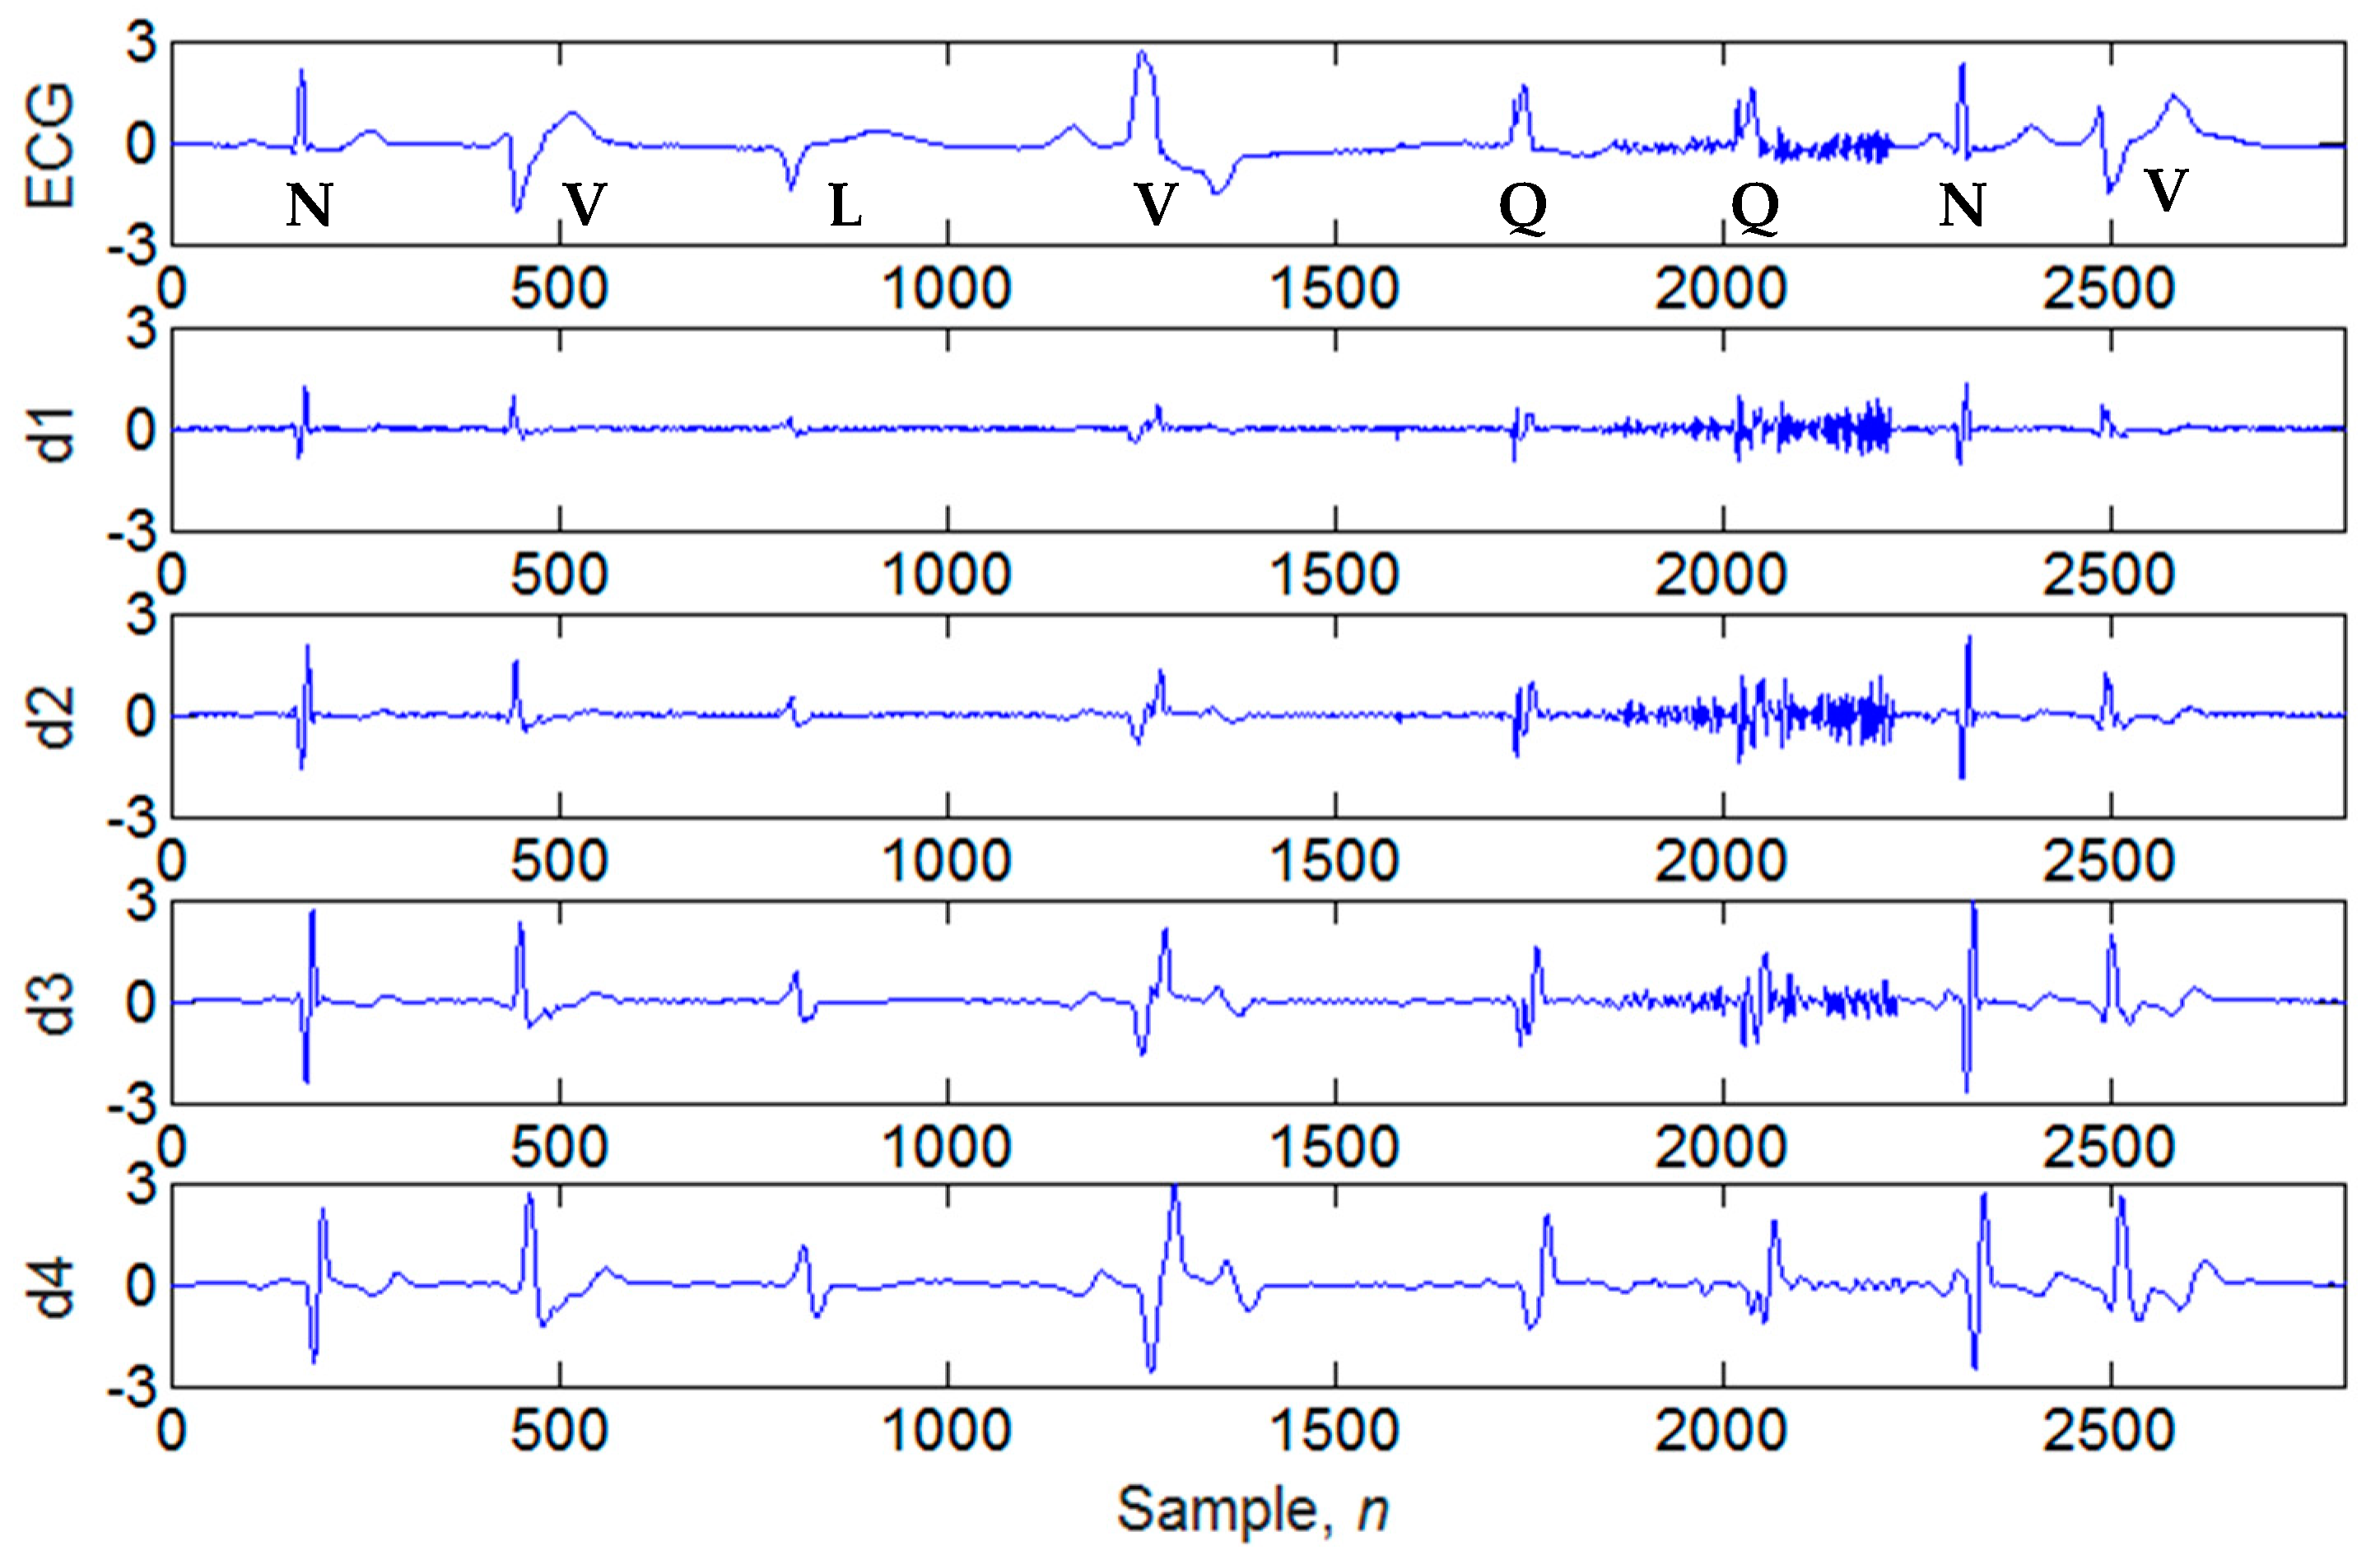
3.2. Four-Level Dyadic Wavelet Transform
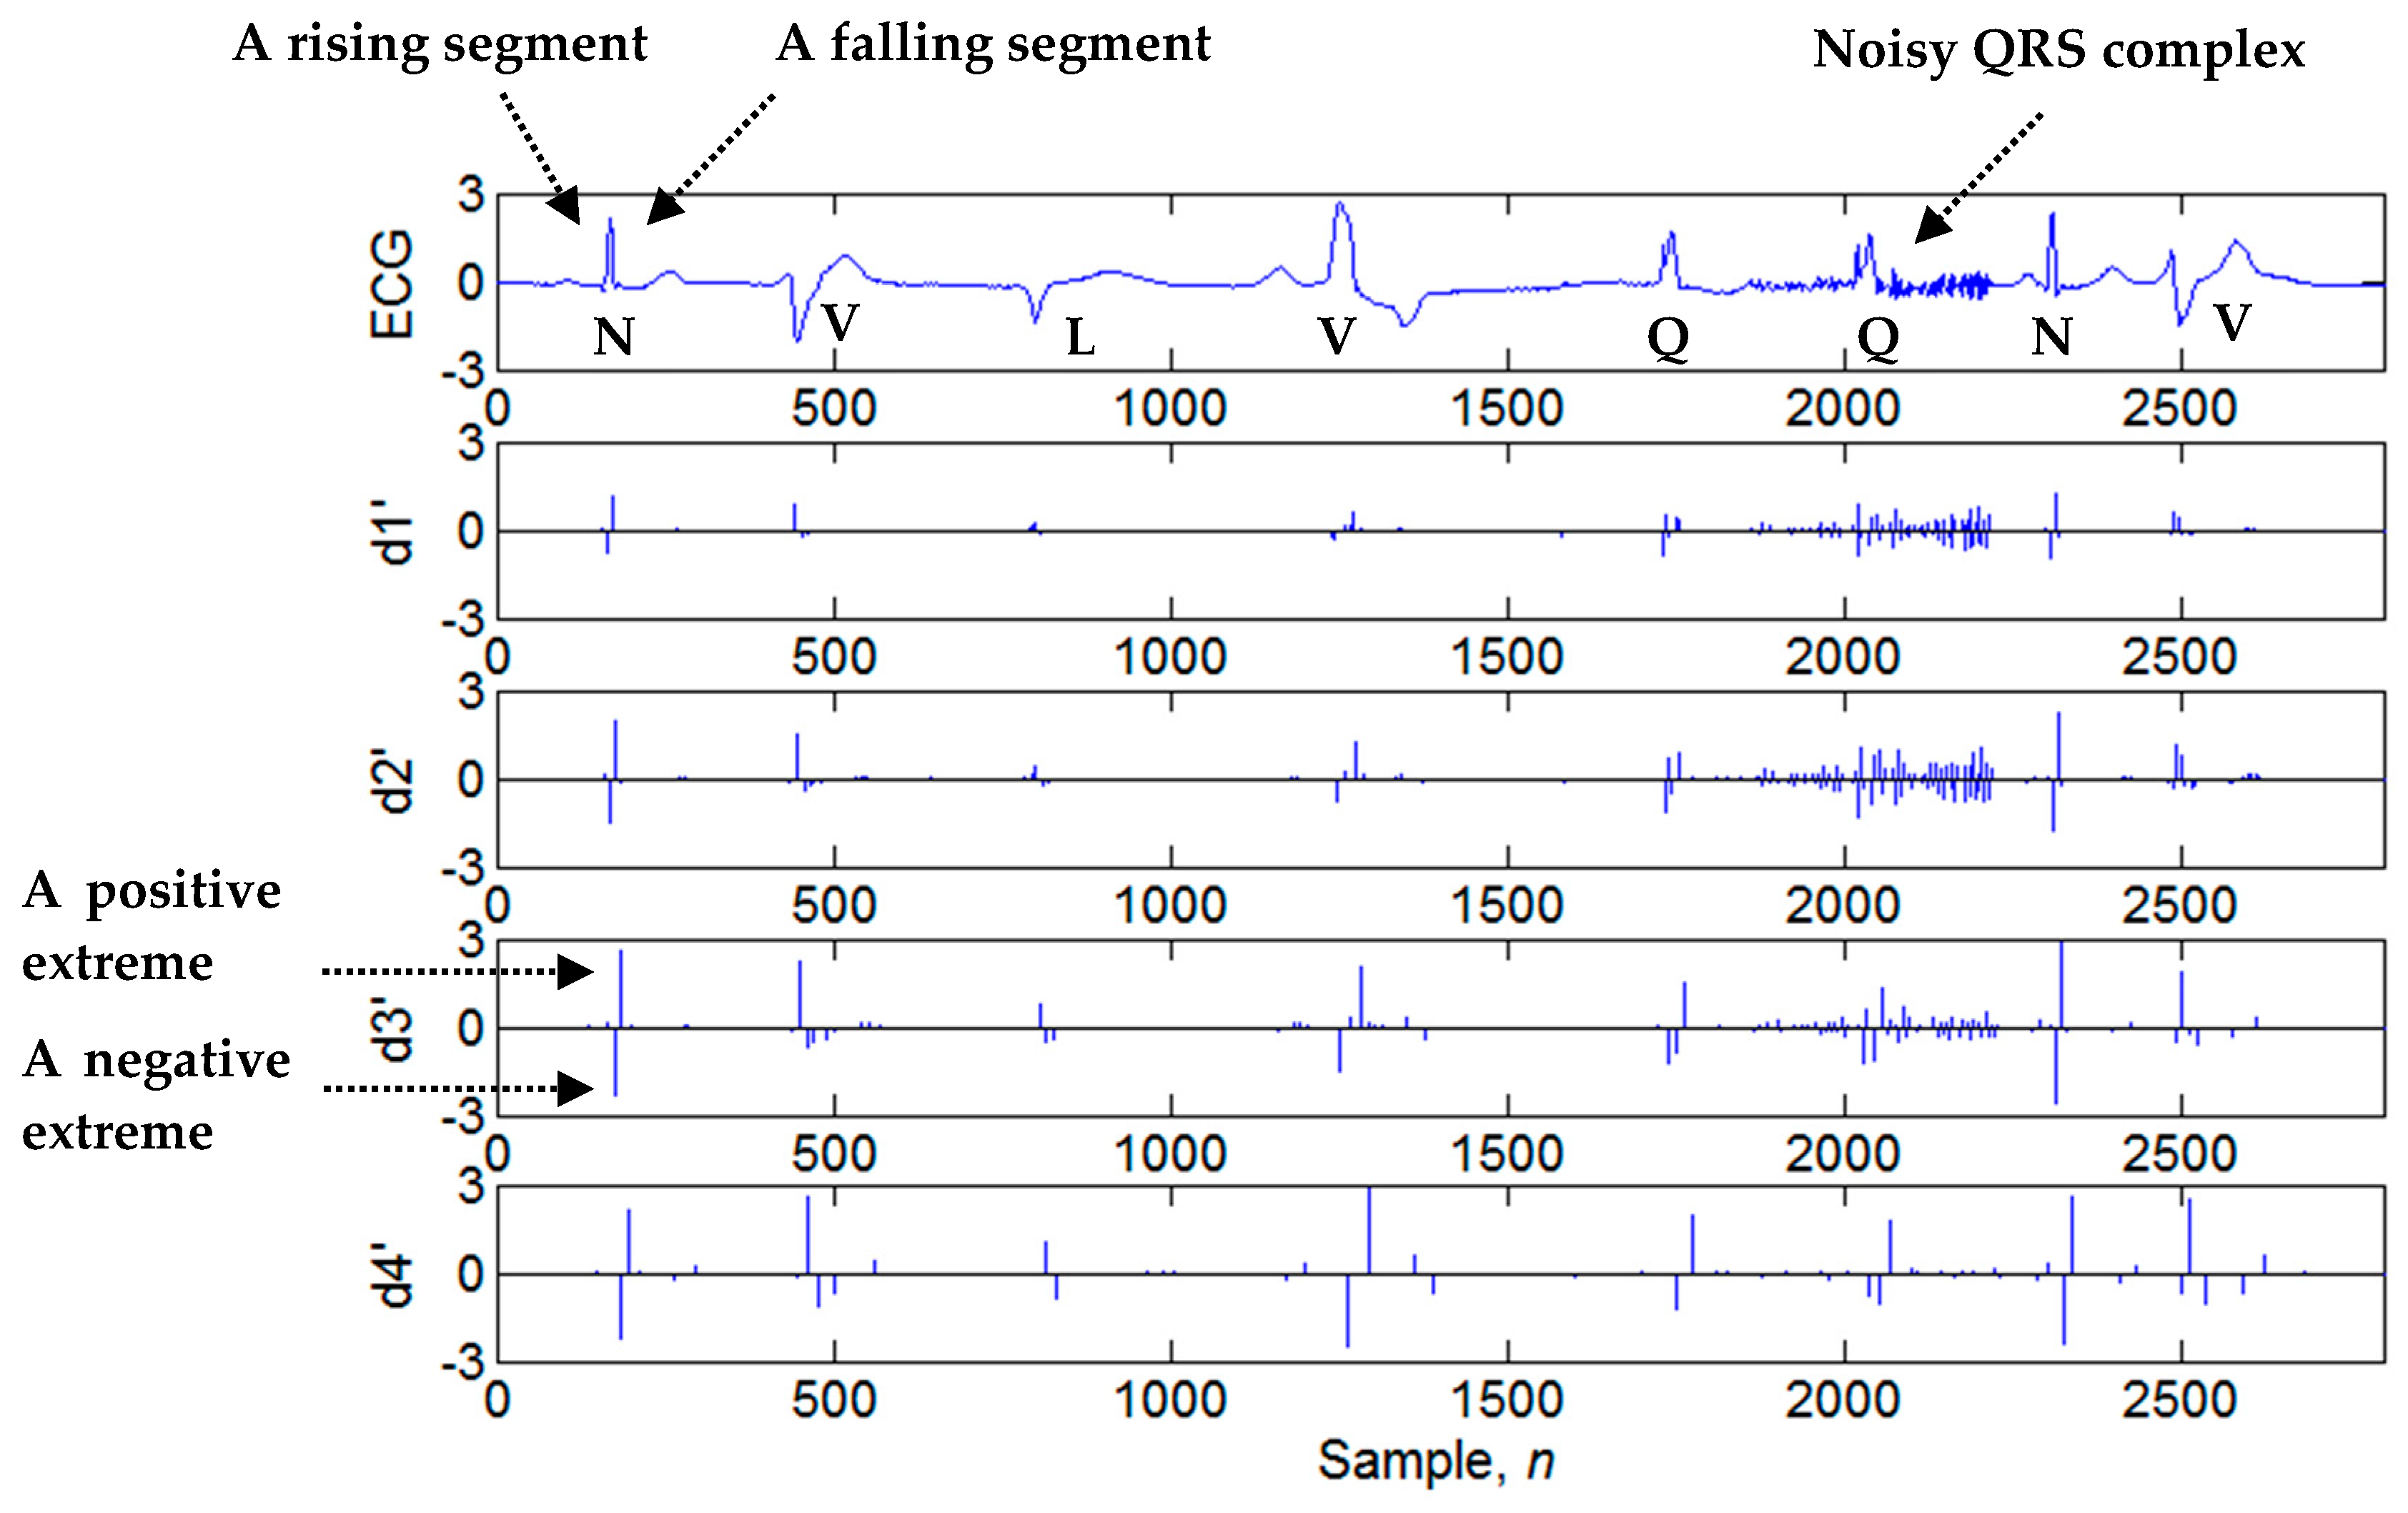
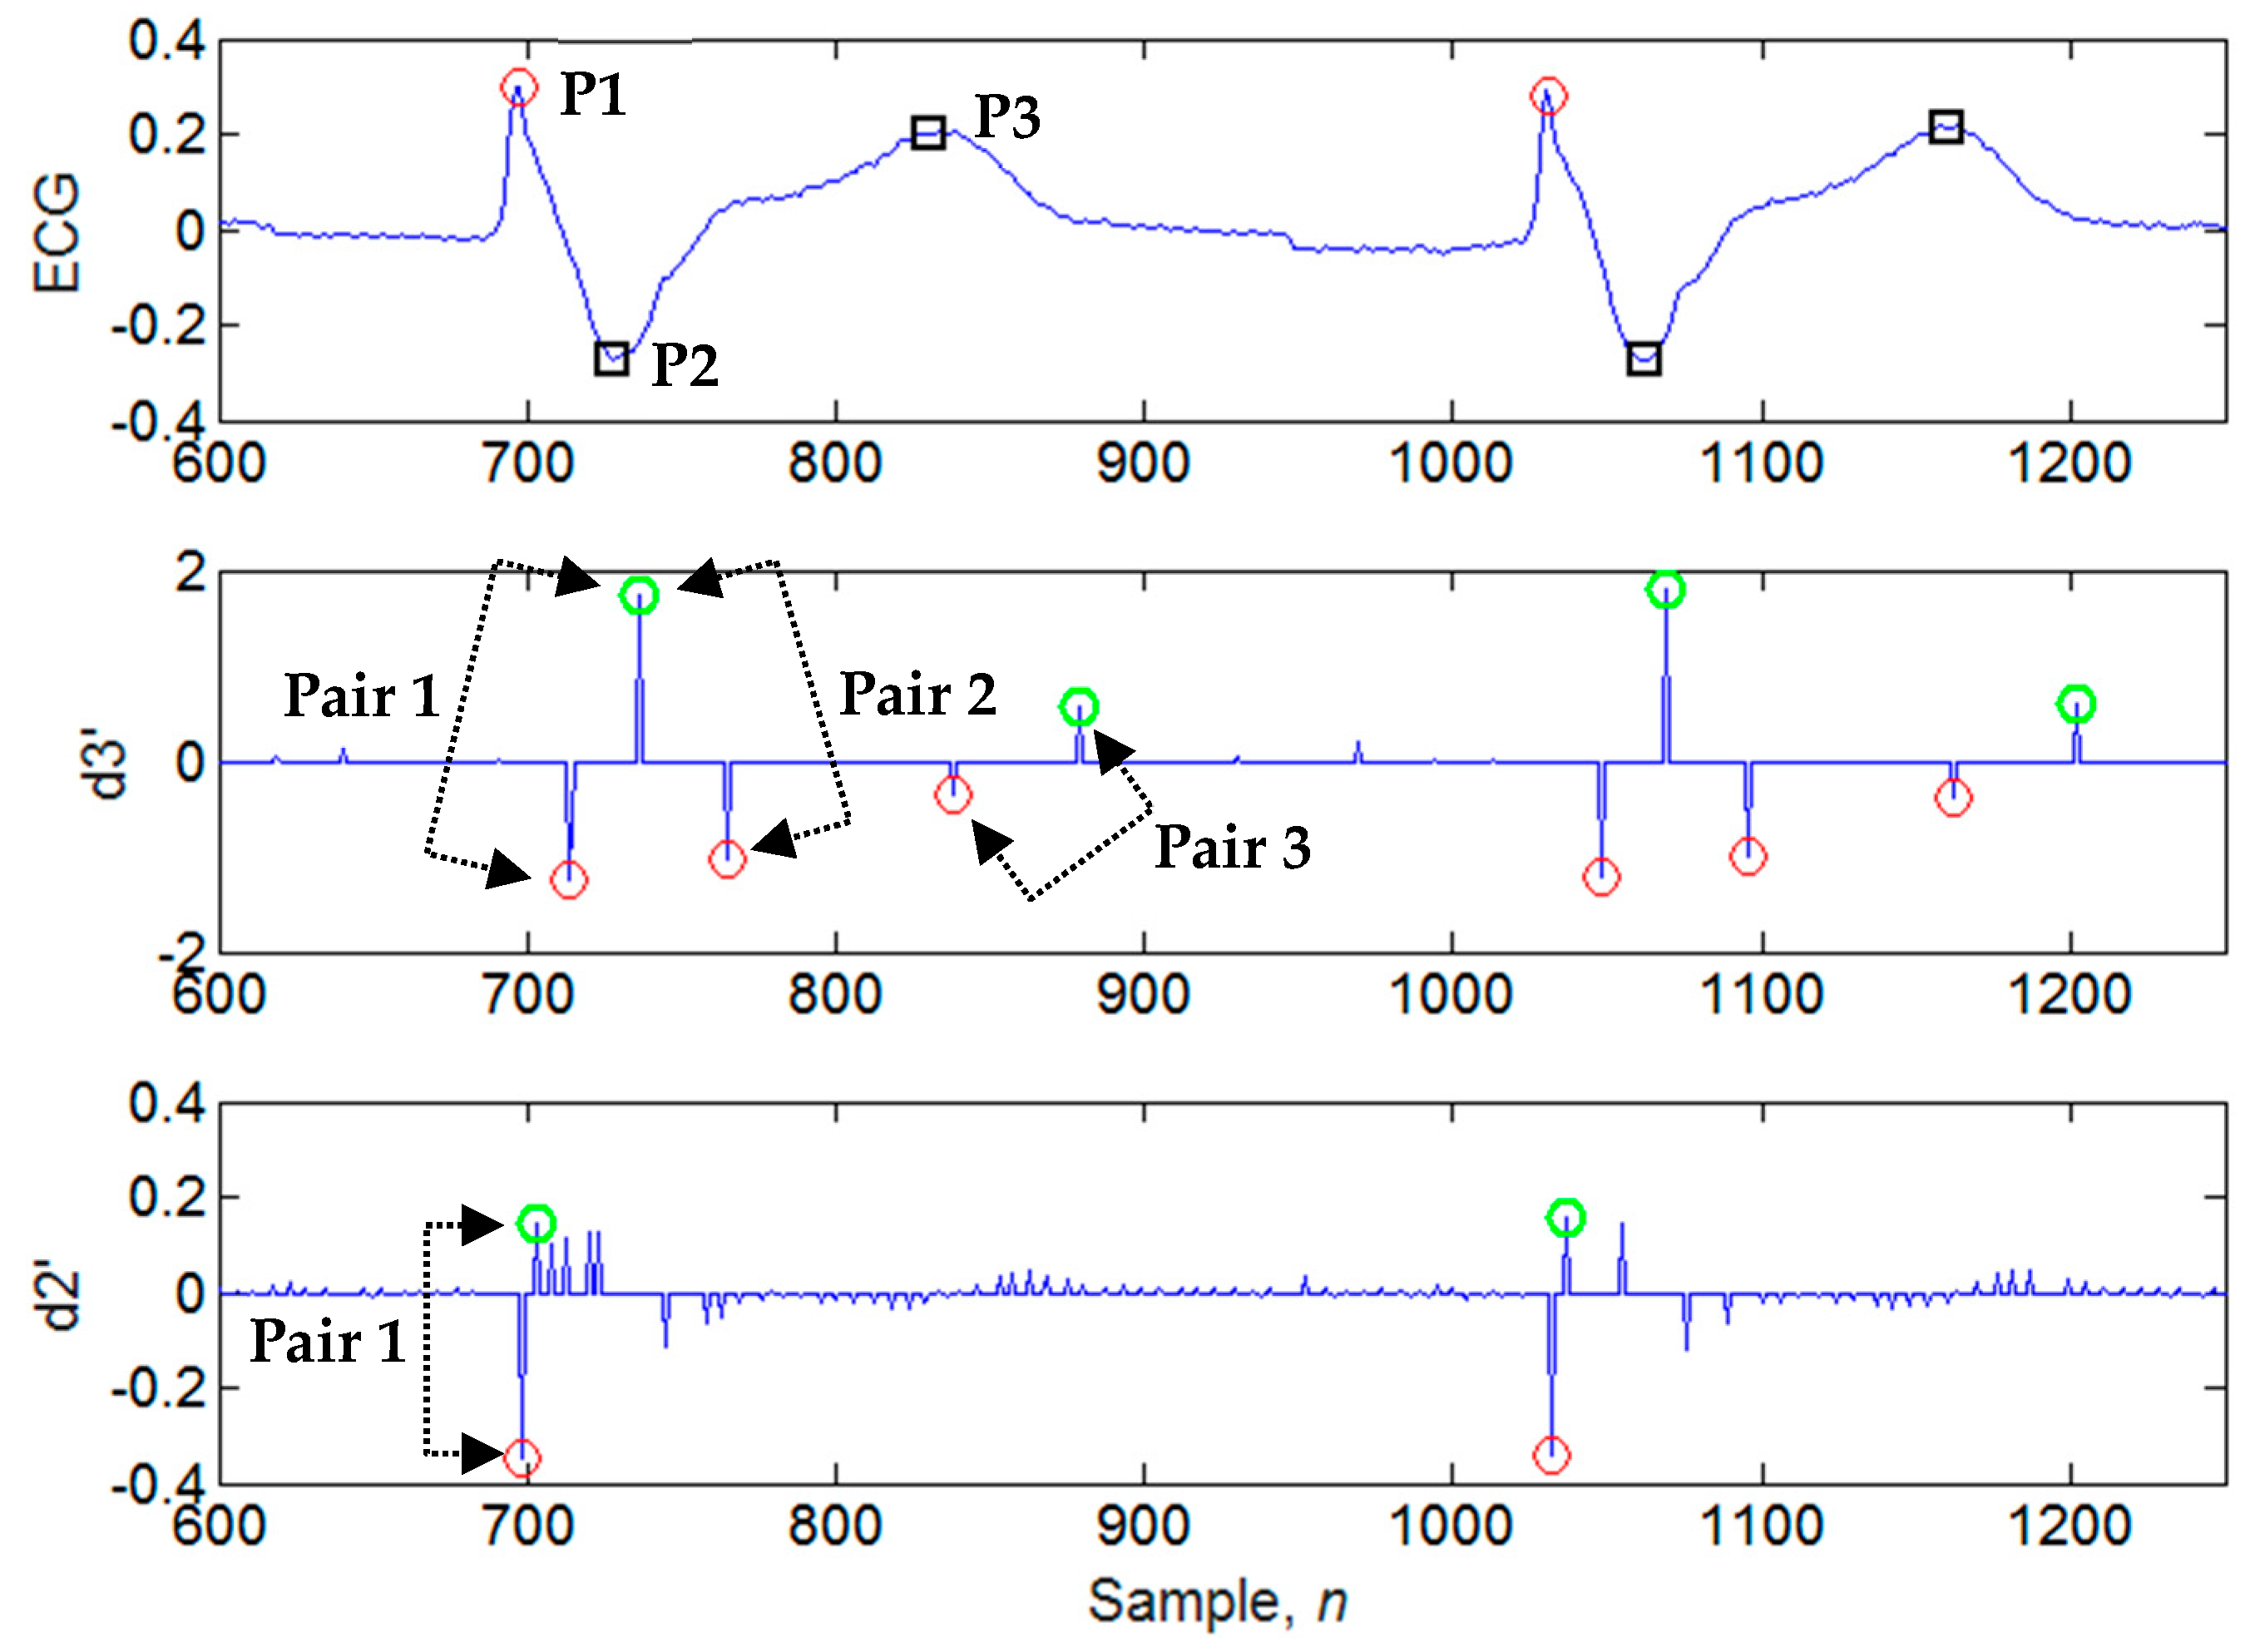
3.3. Search of Candidate Extreme Points
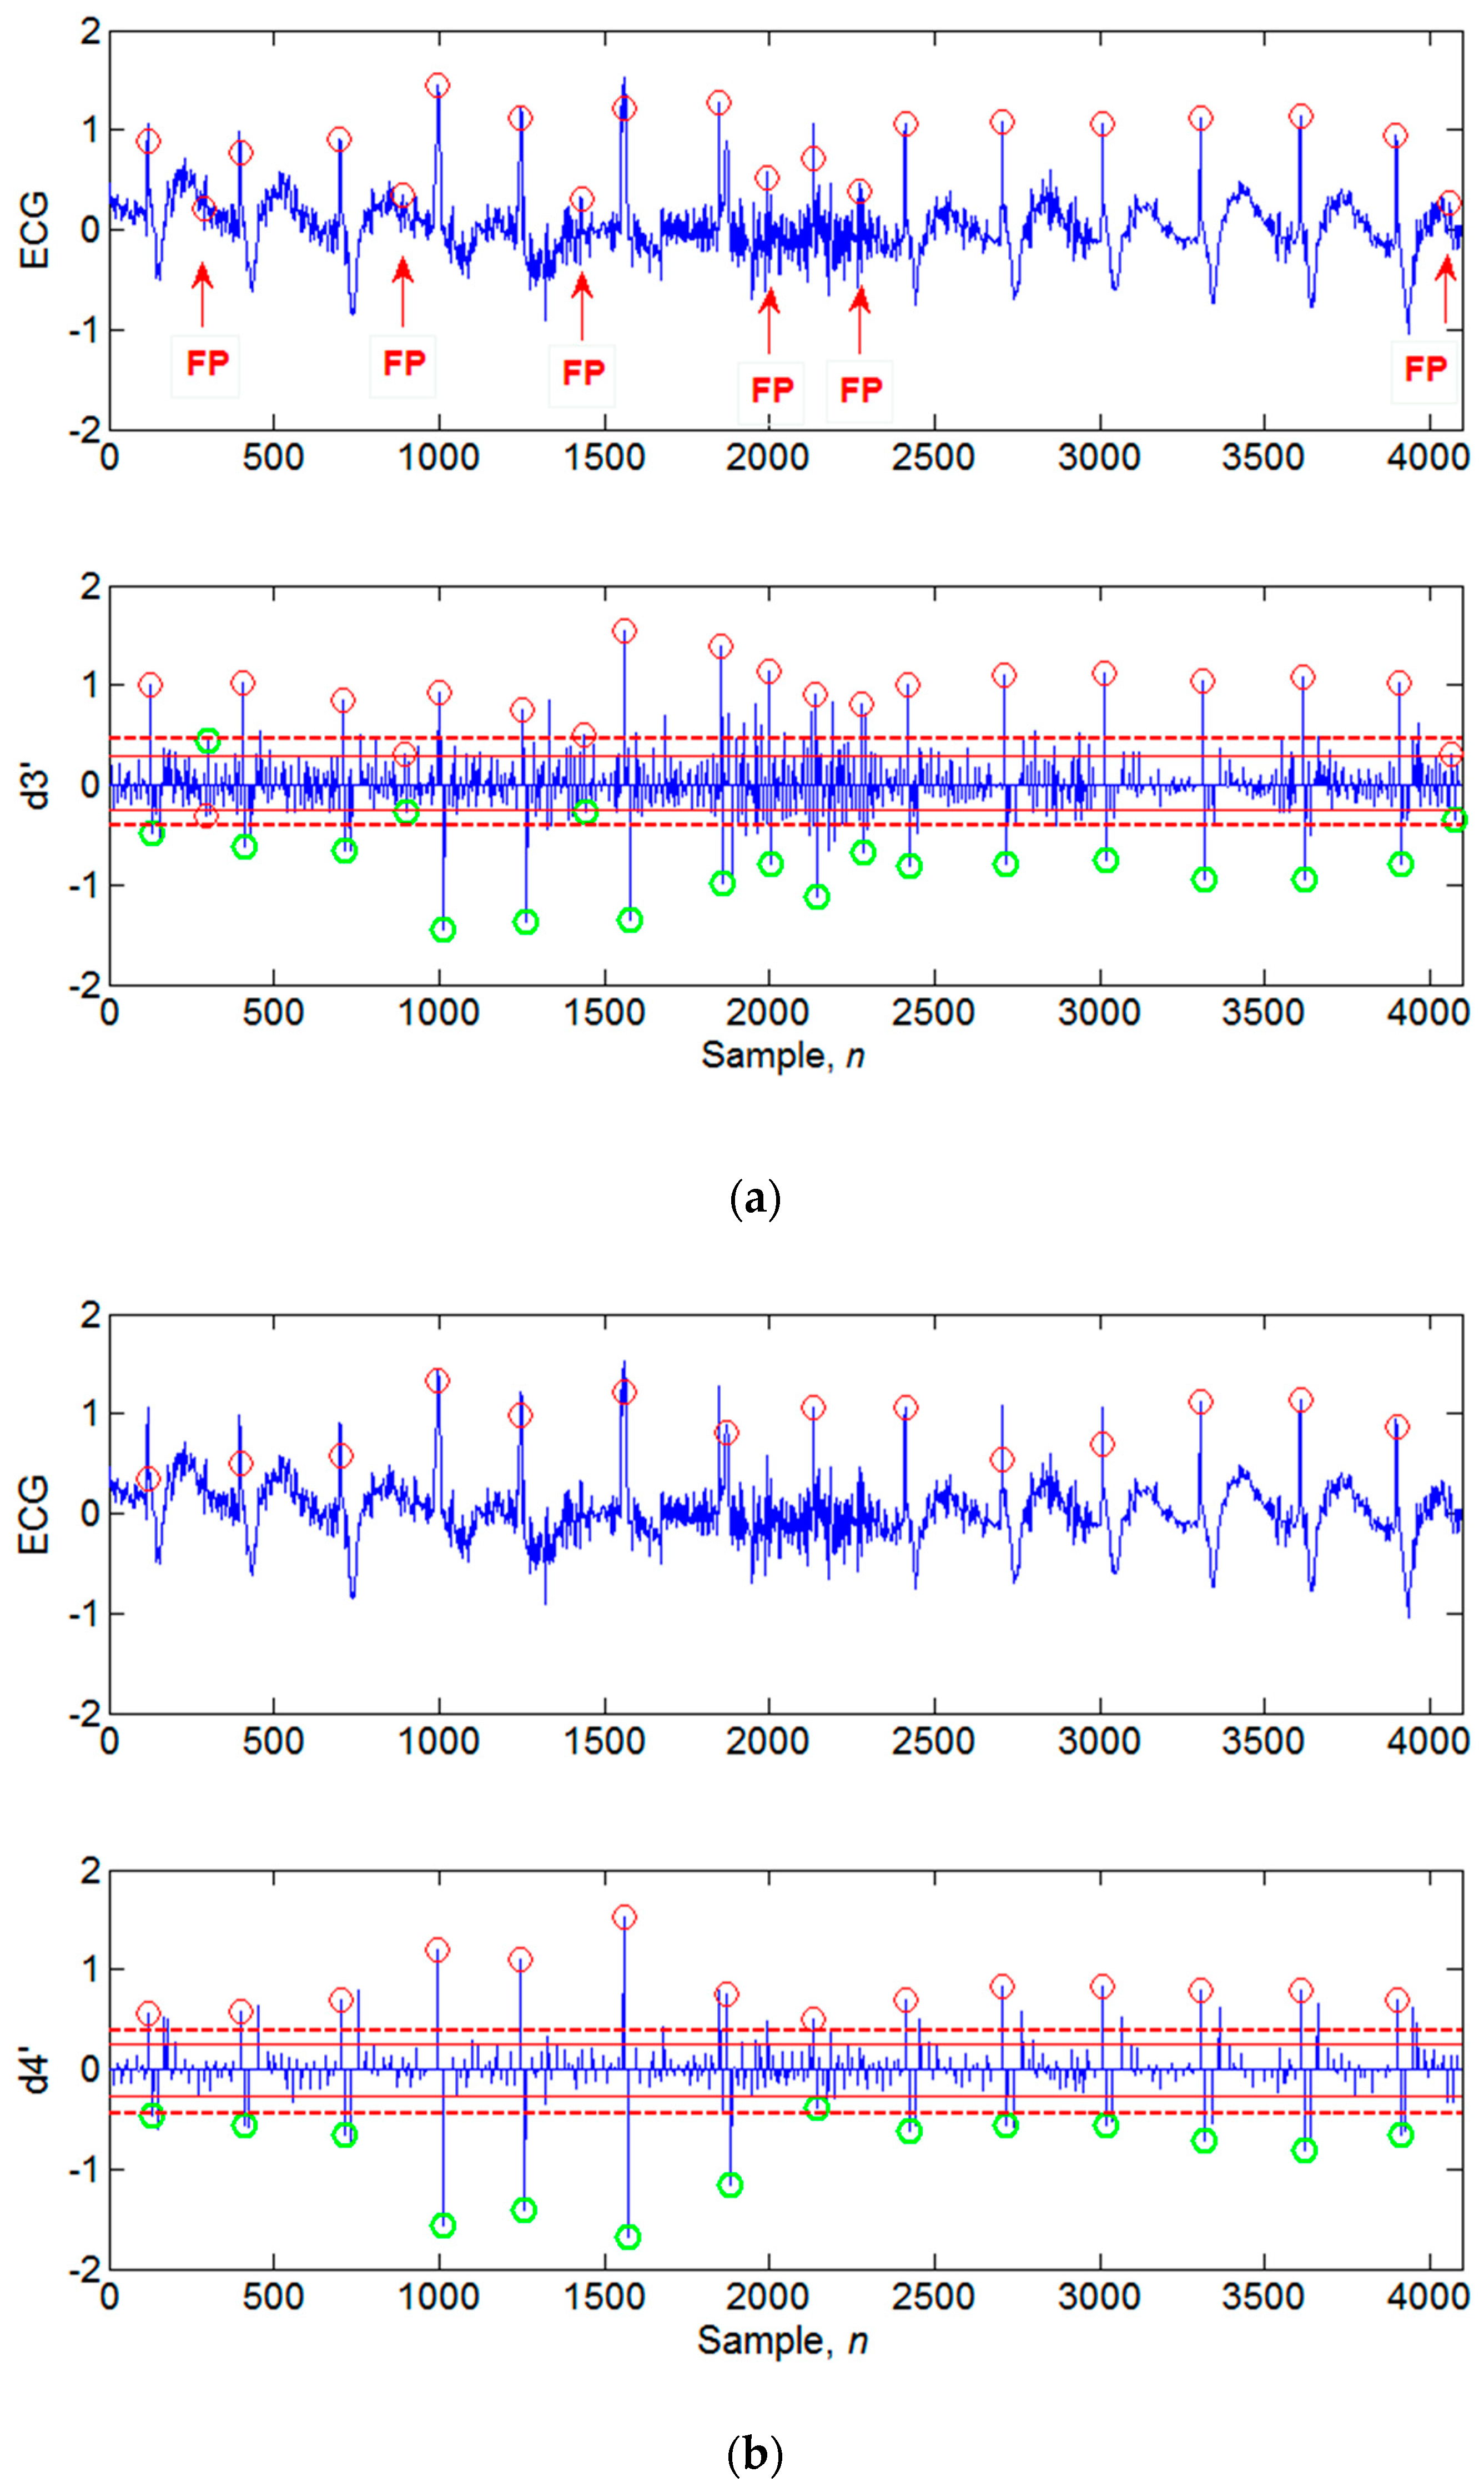
3.4. Determination of Candidate Extremum Pairs
3.5. Evaluation of Noise Amount
3.6. Calculation of the Positions of the Candidate QRS Peaks in the Time-Domain
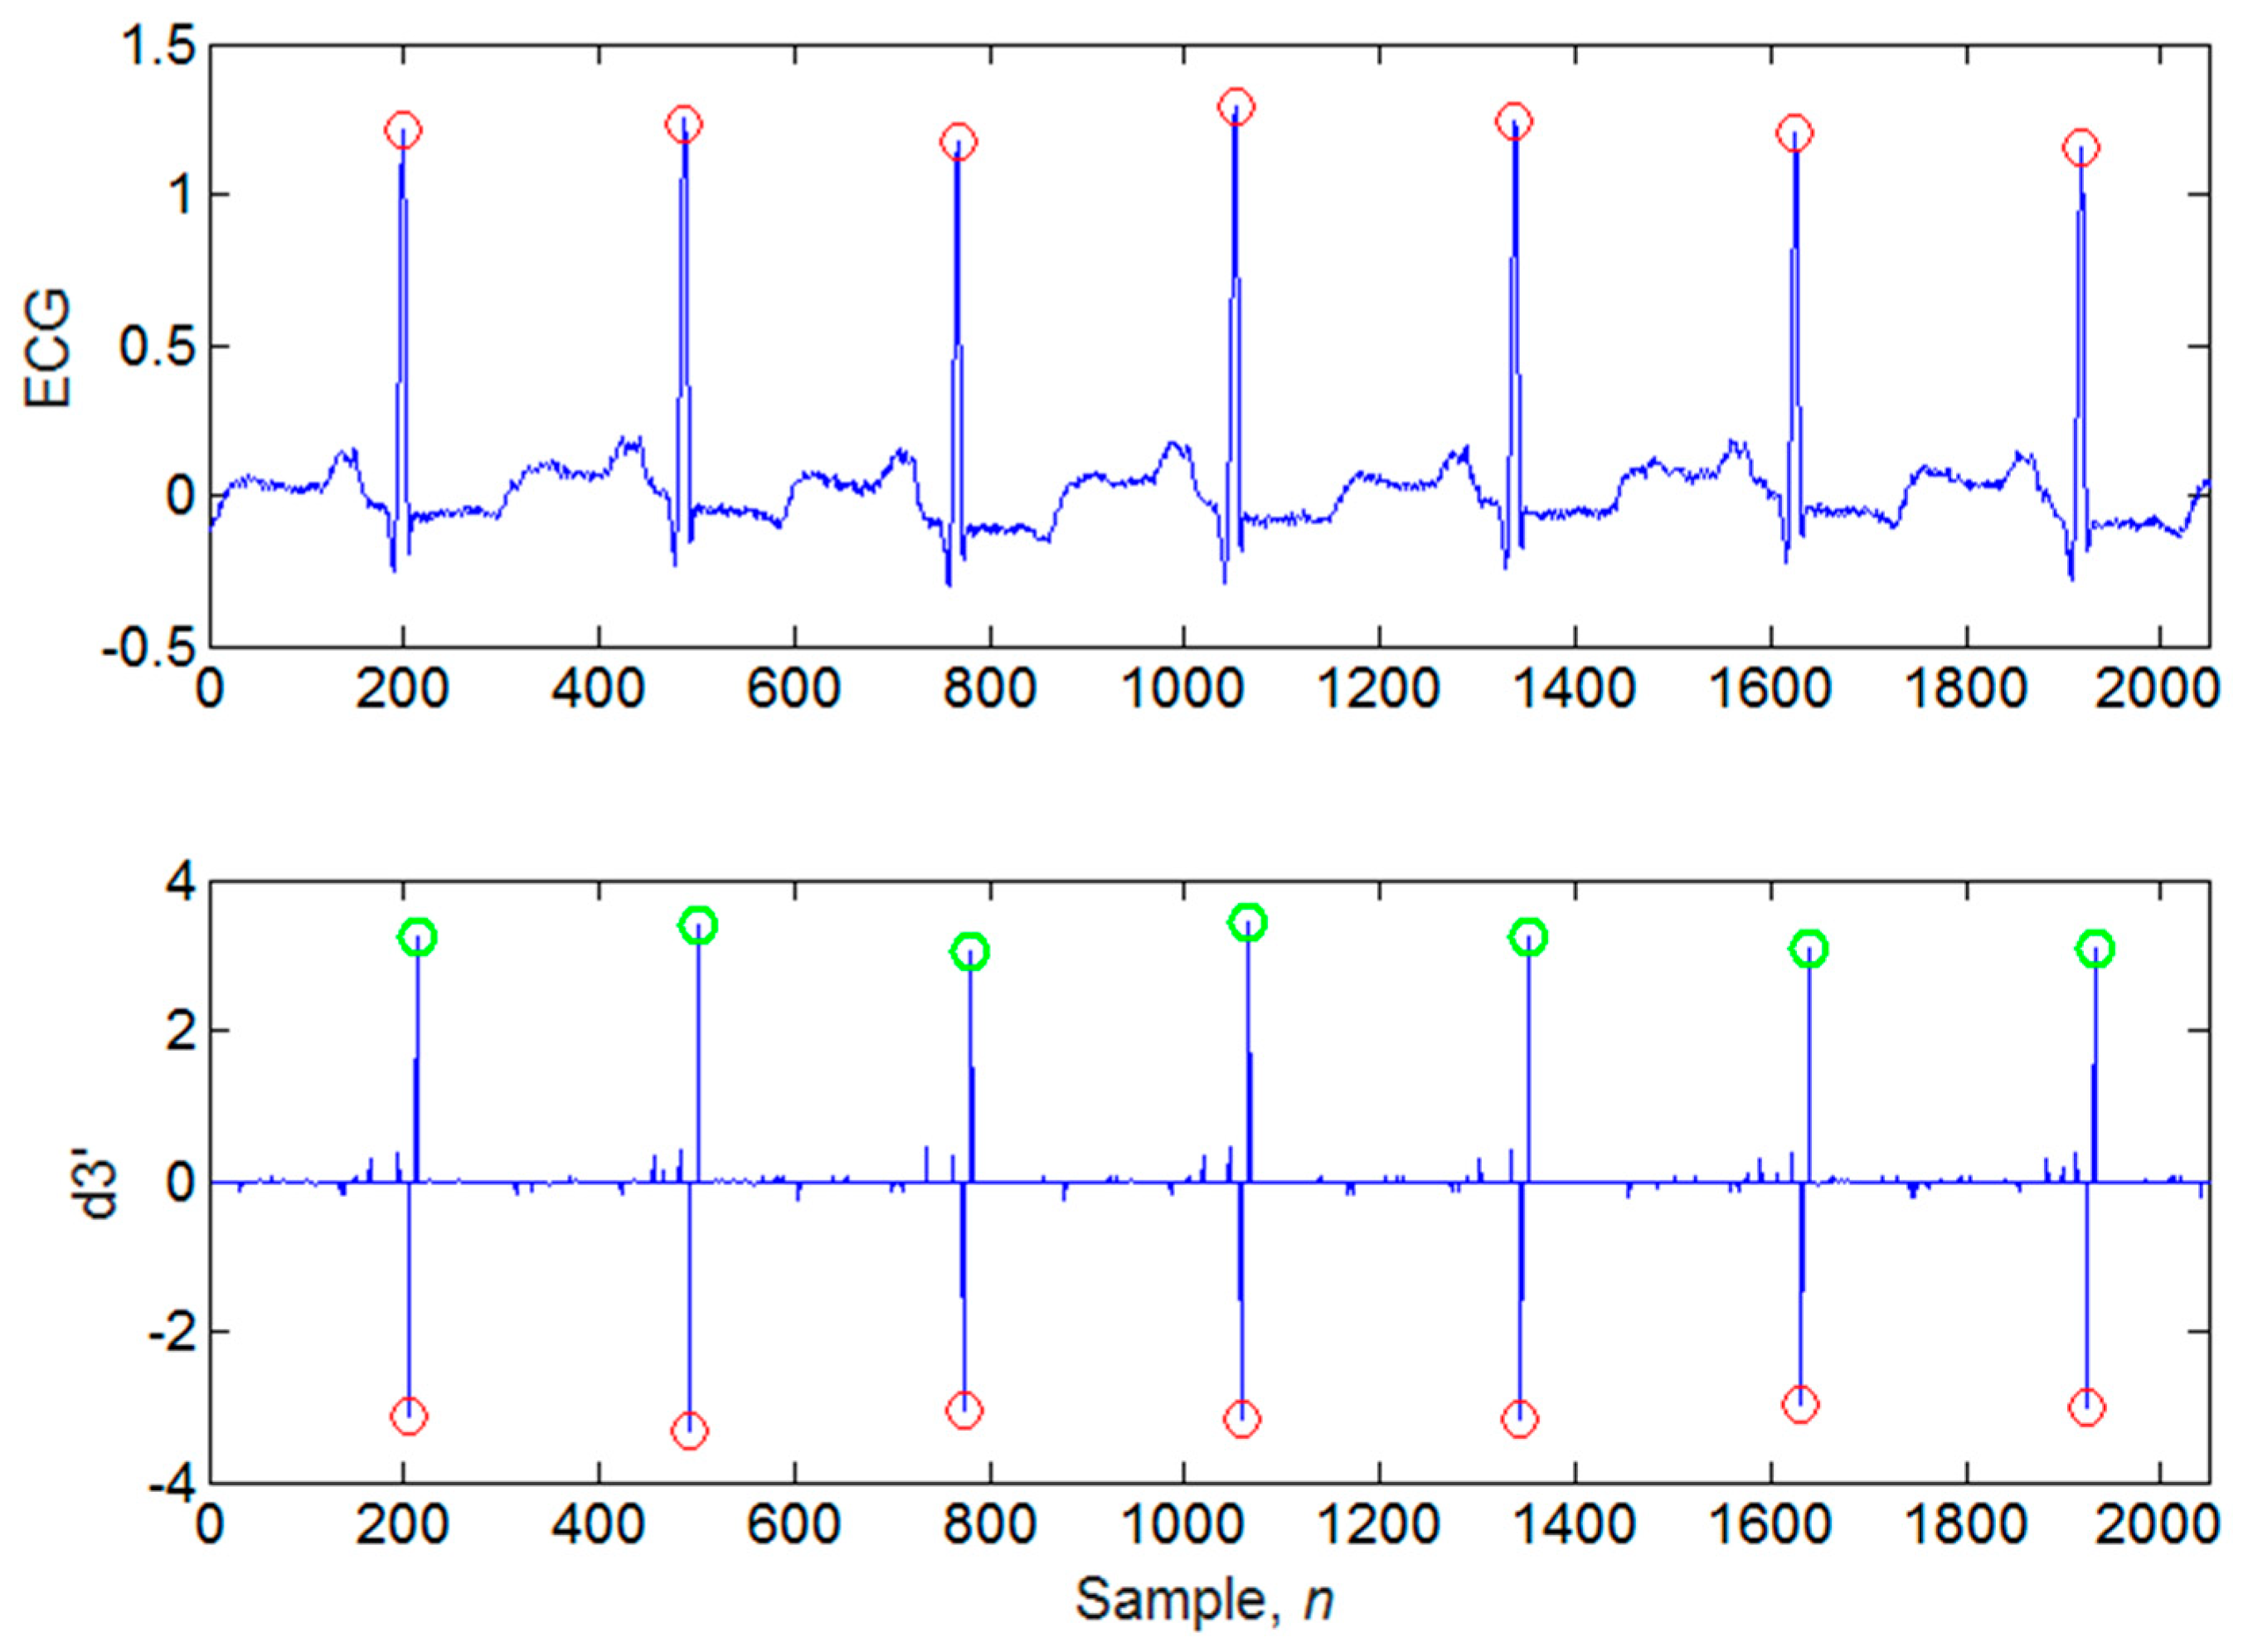
3.7. Identification of QRS Peaks
4. Results and Discussion
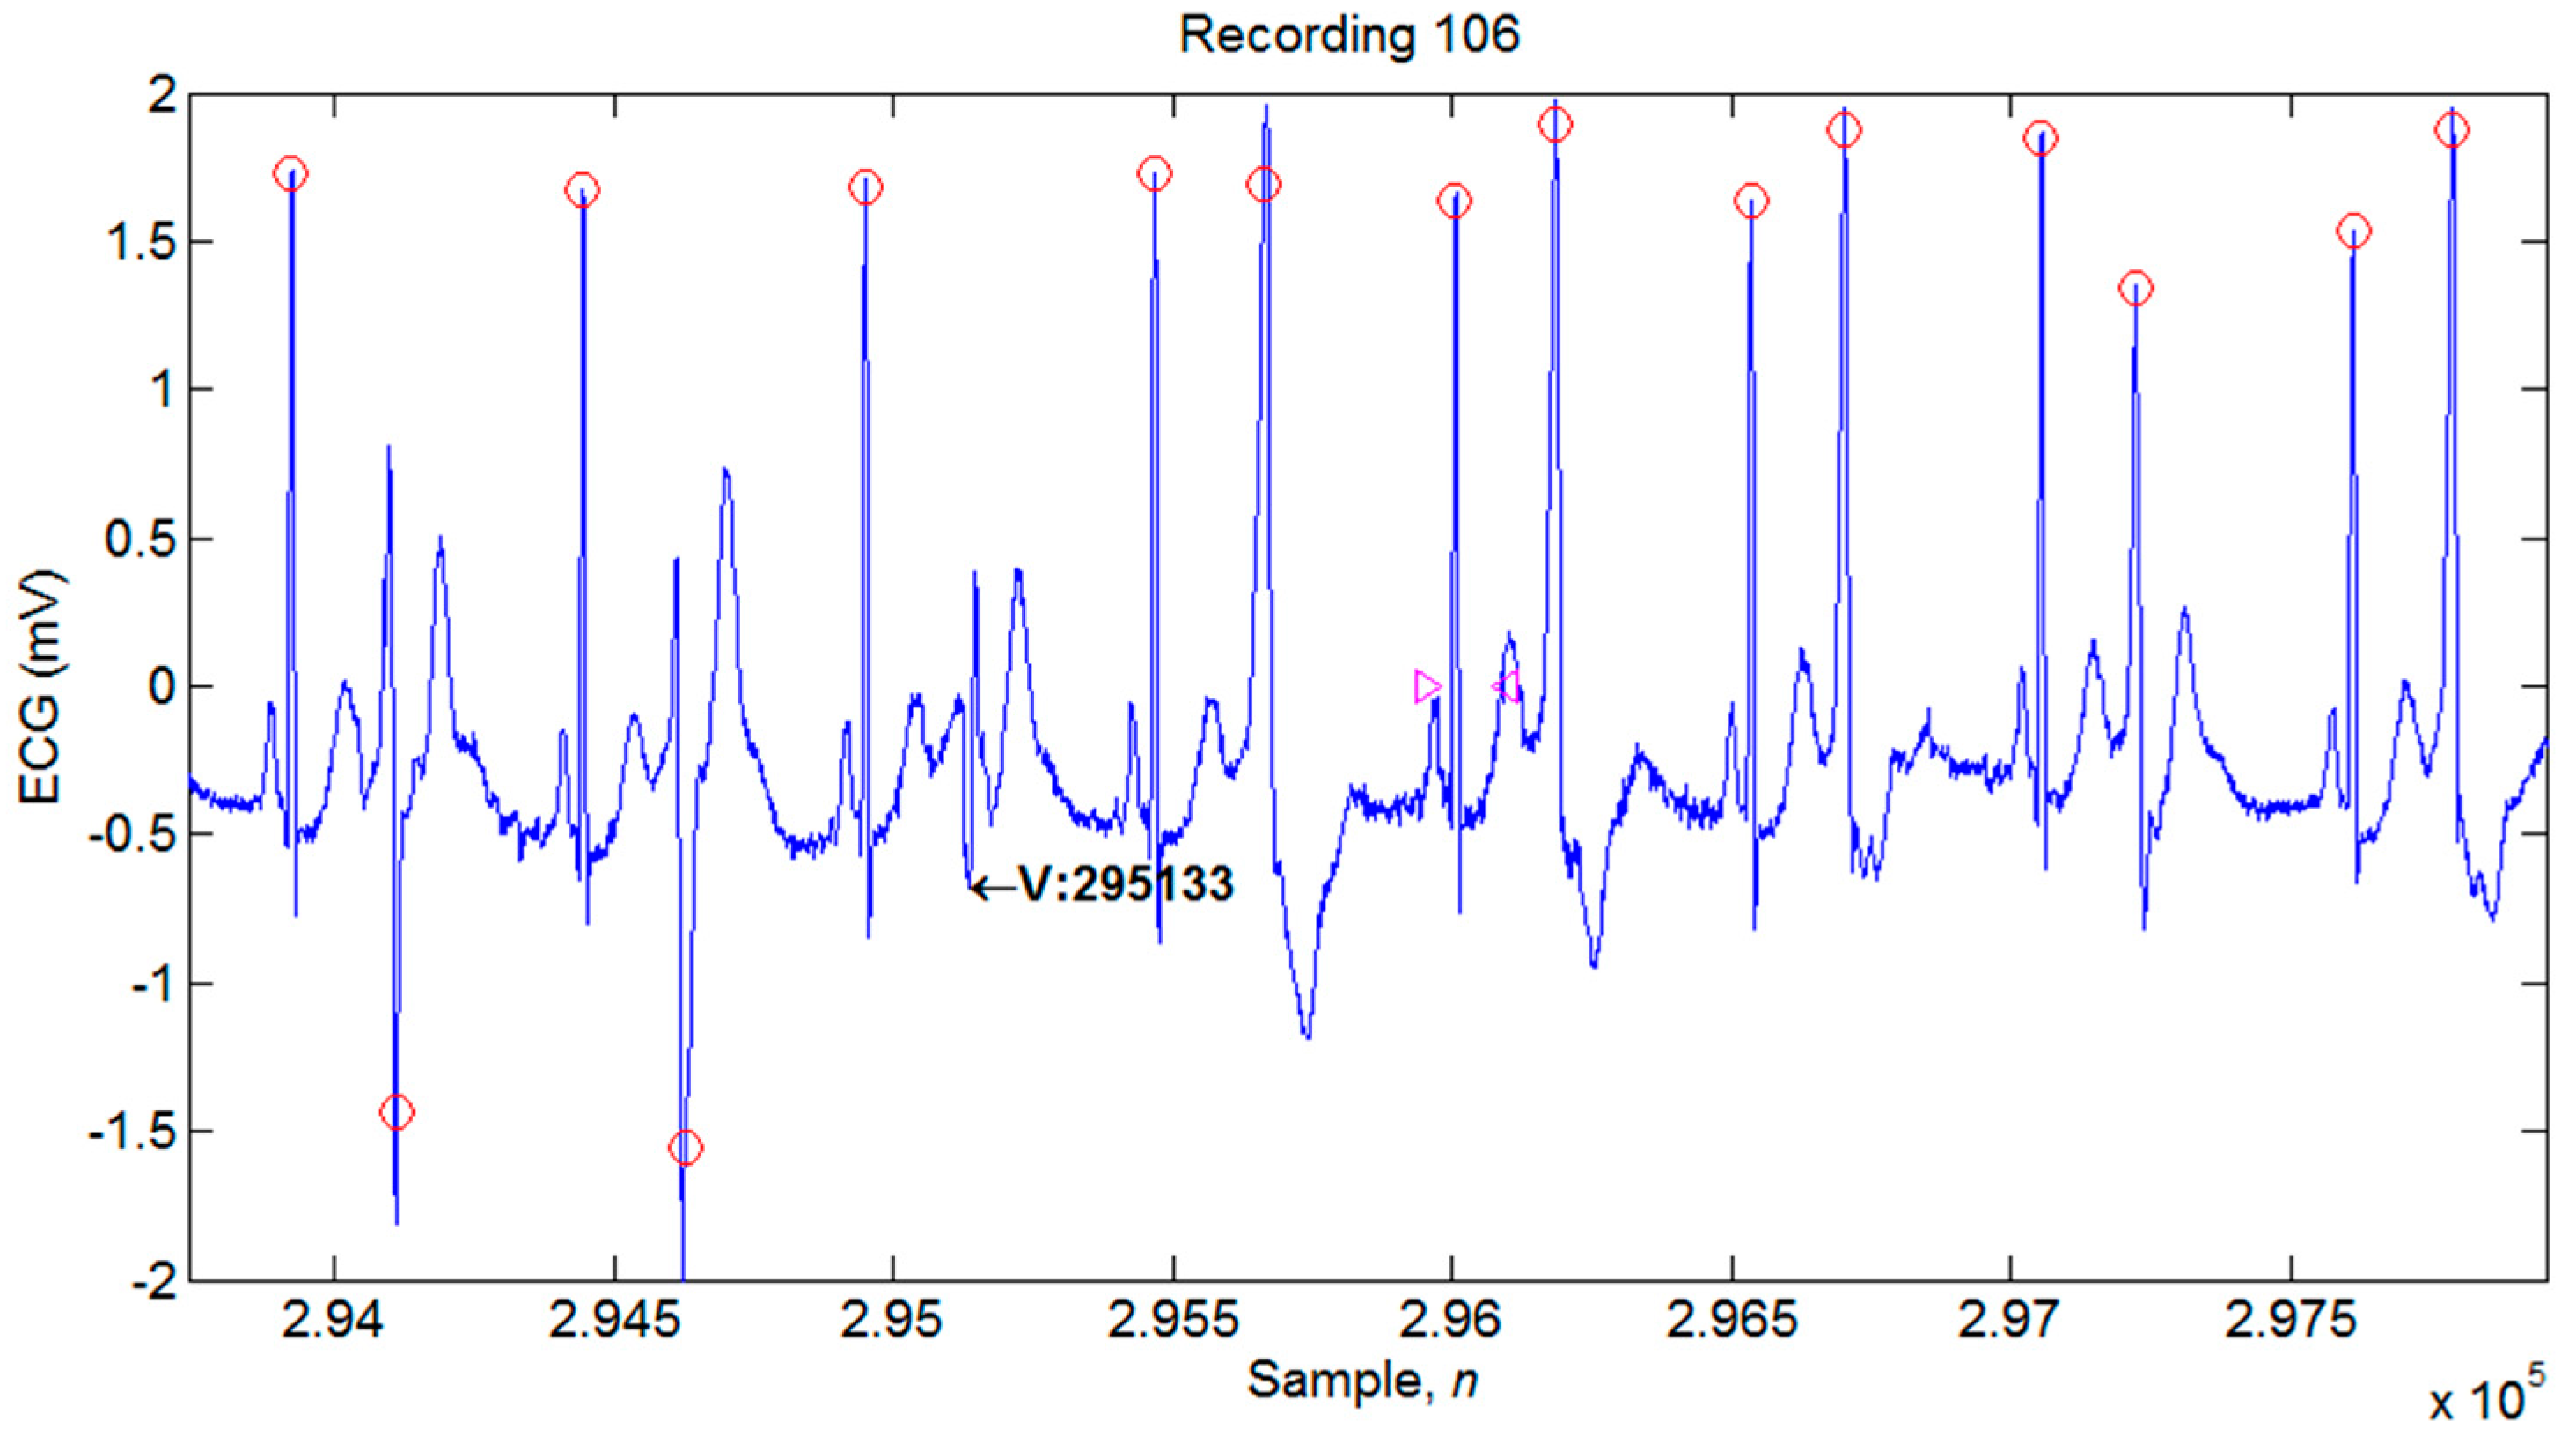
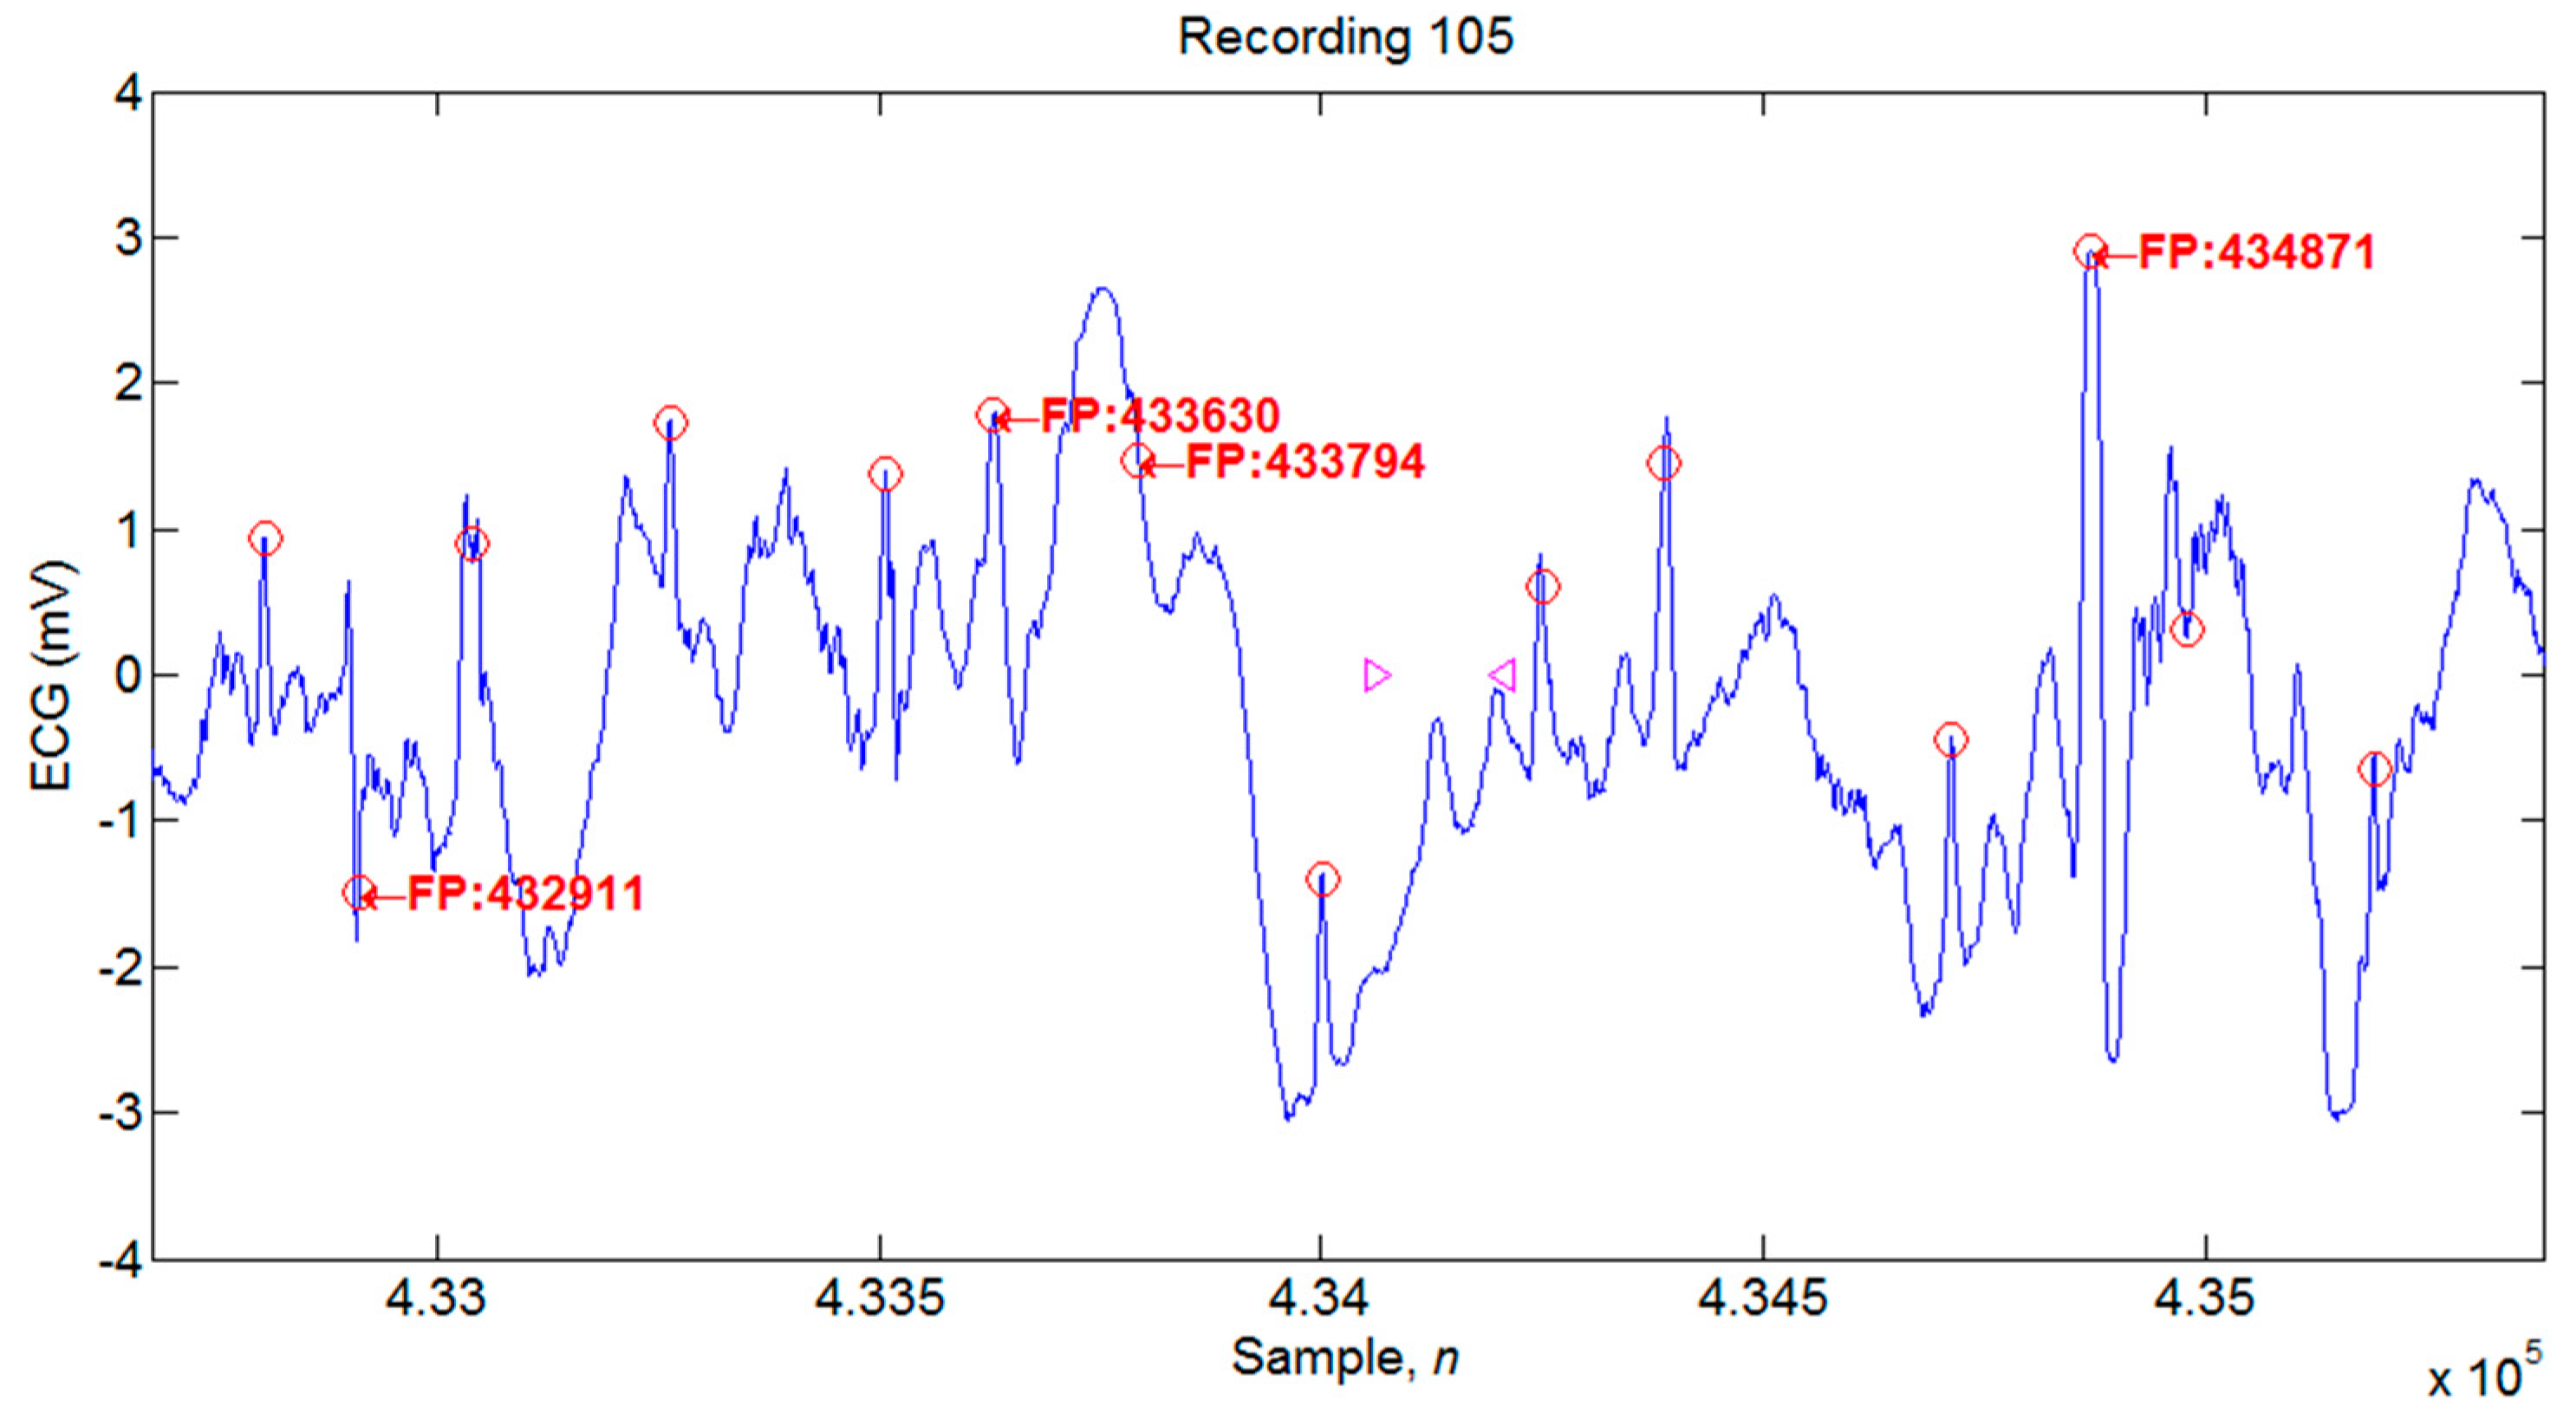
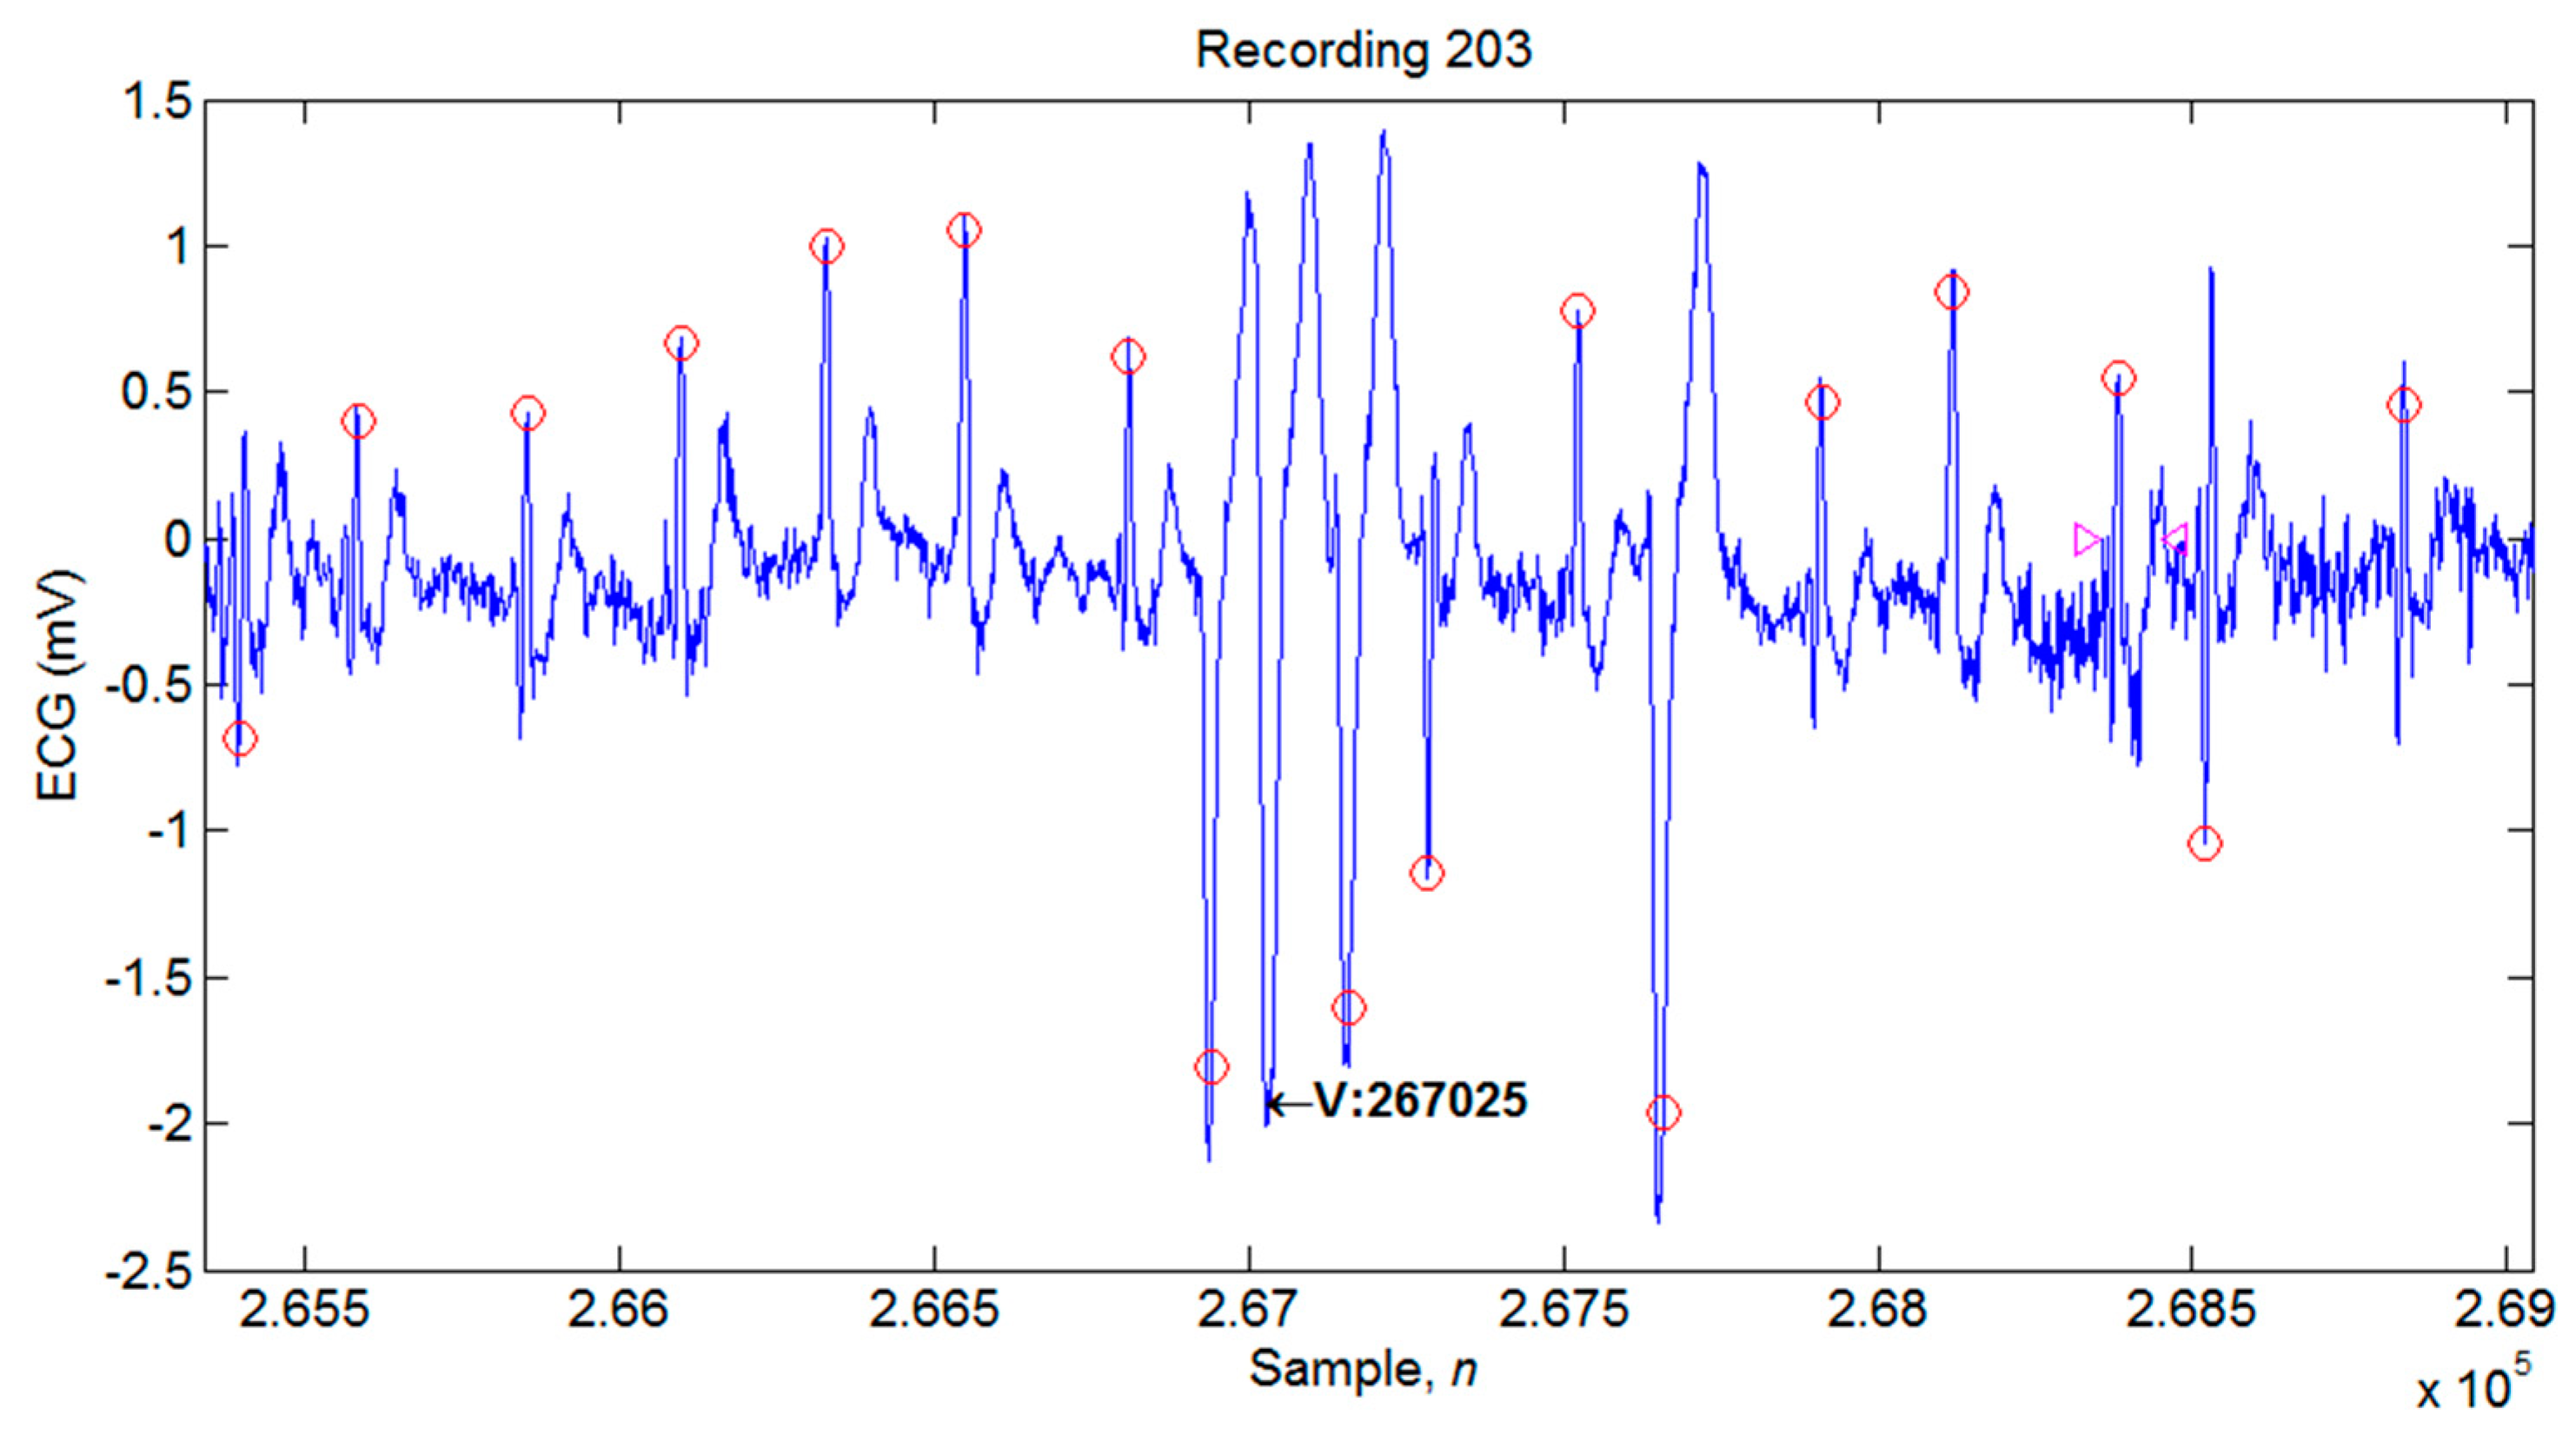
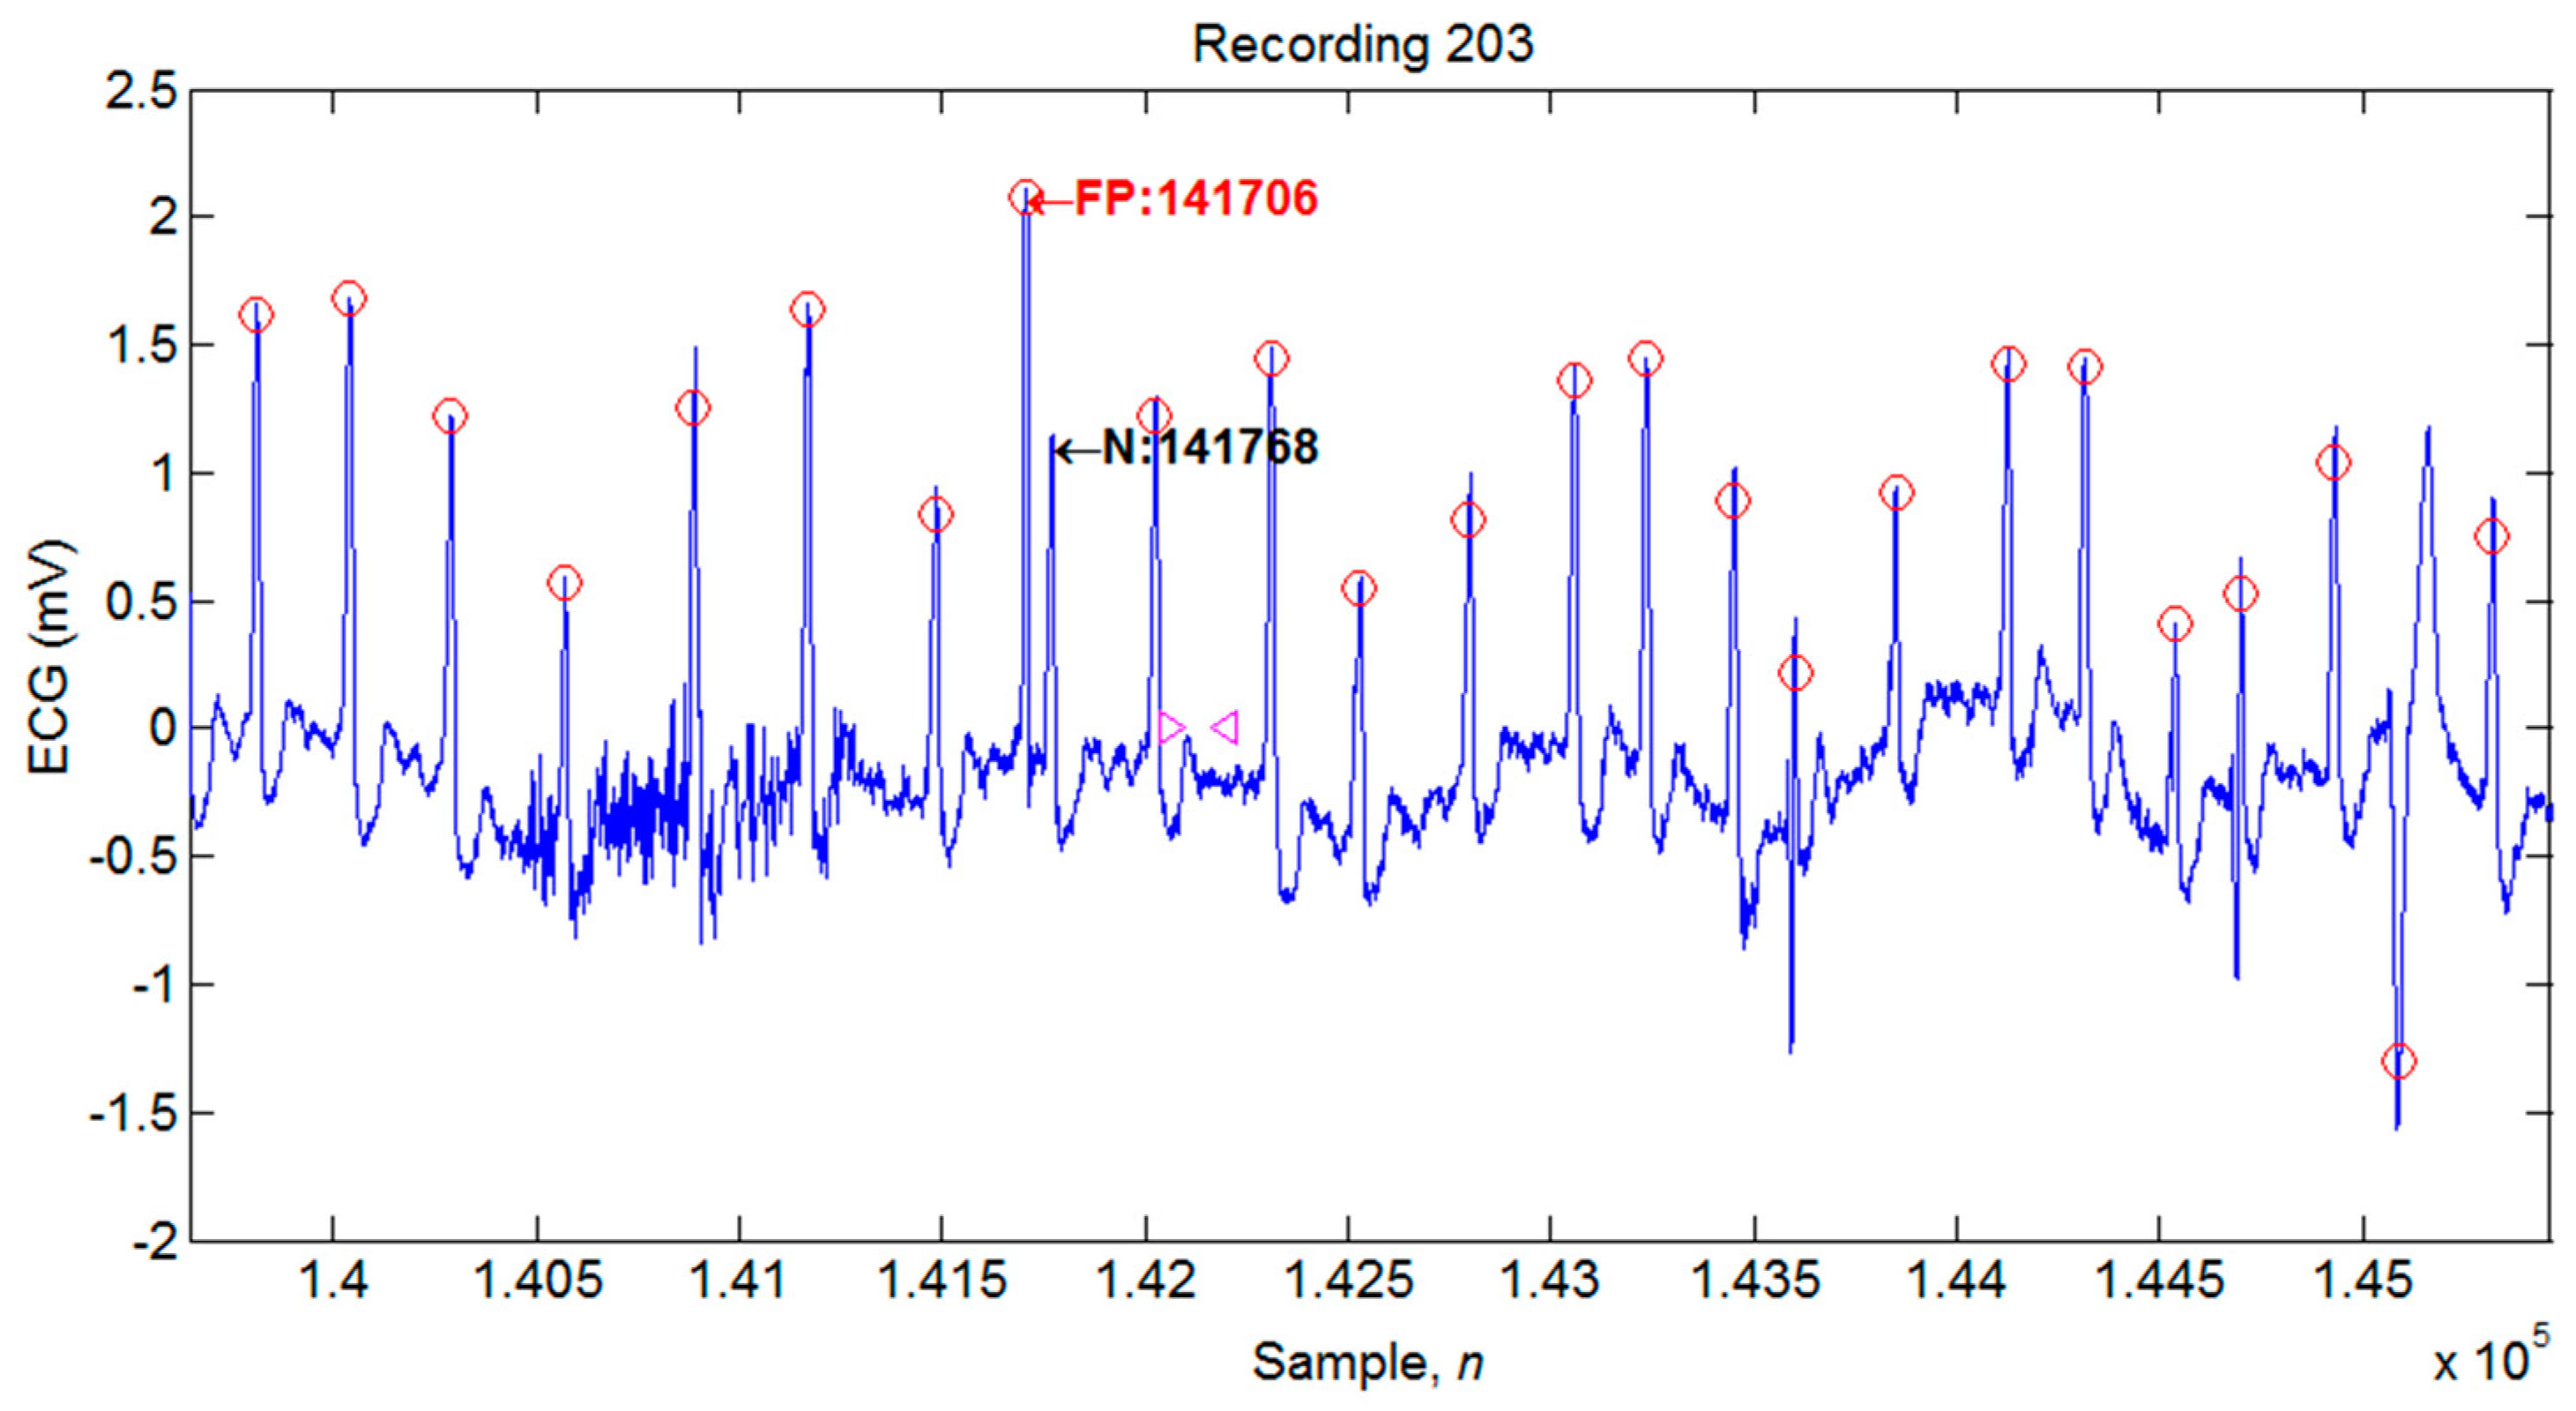
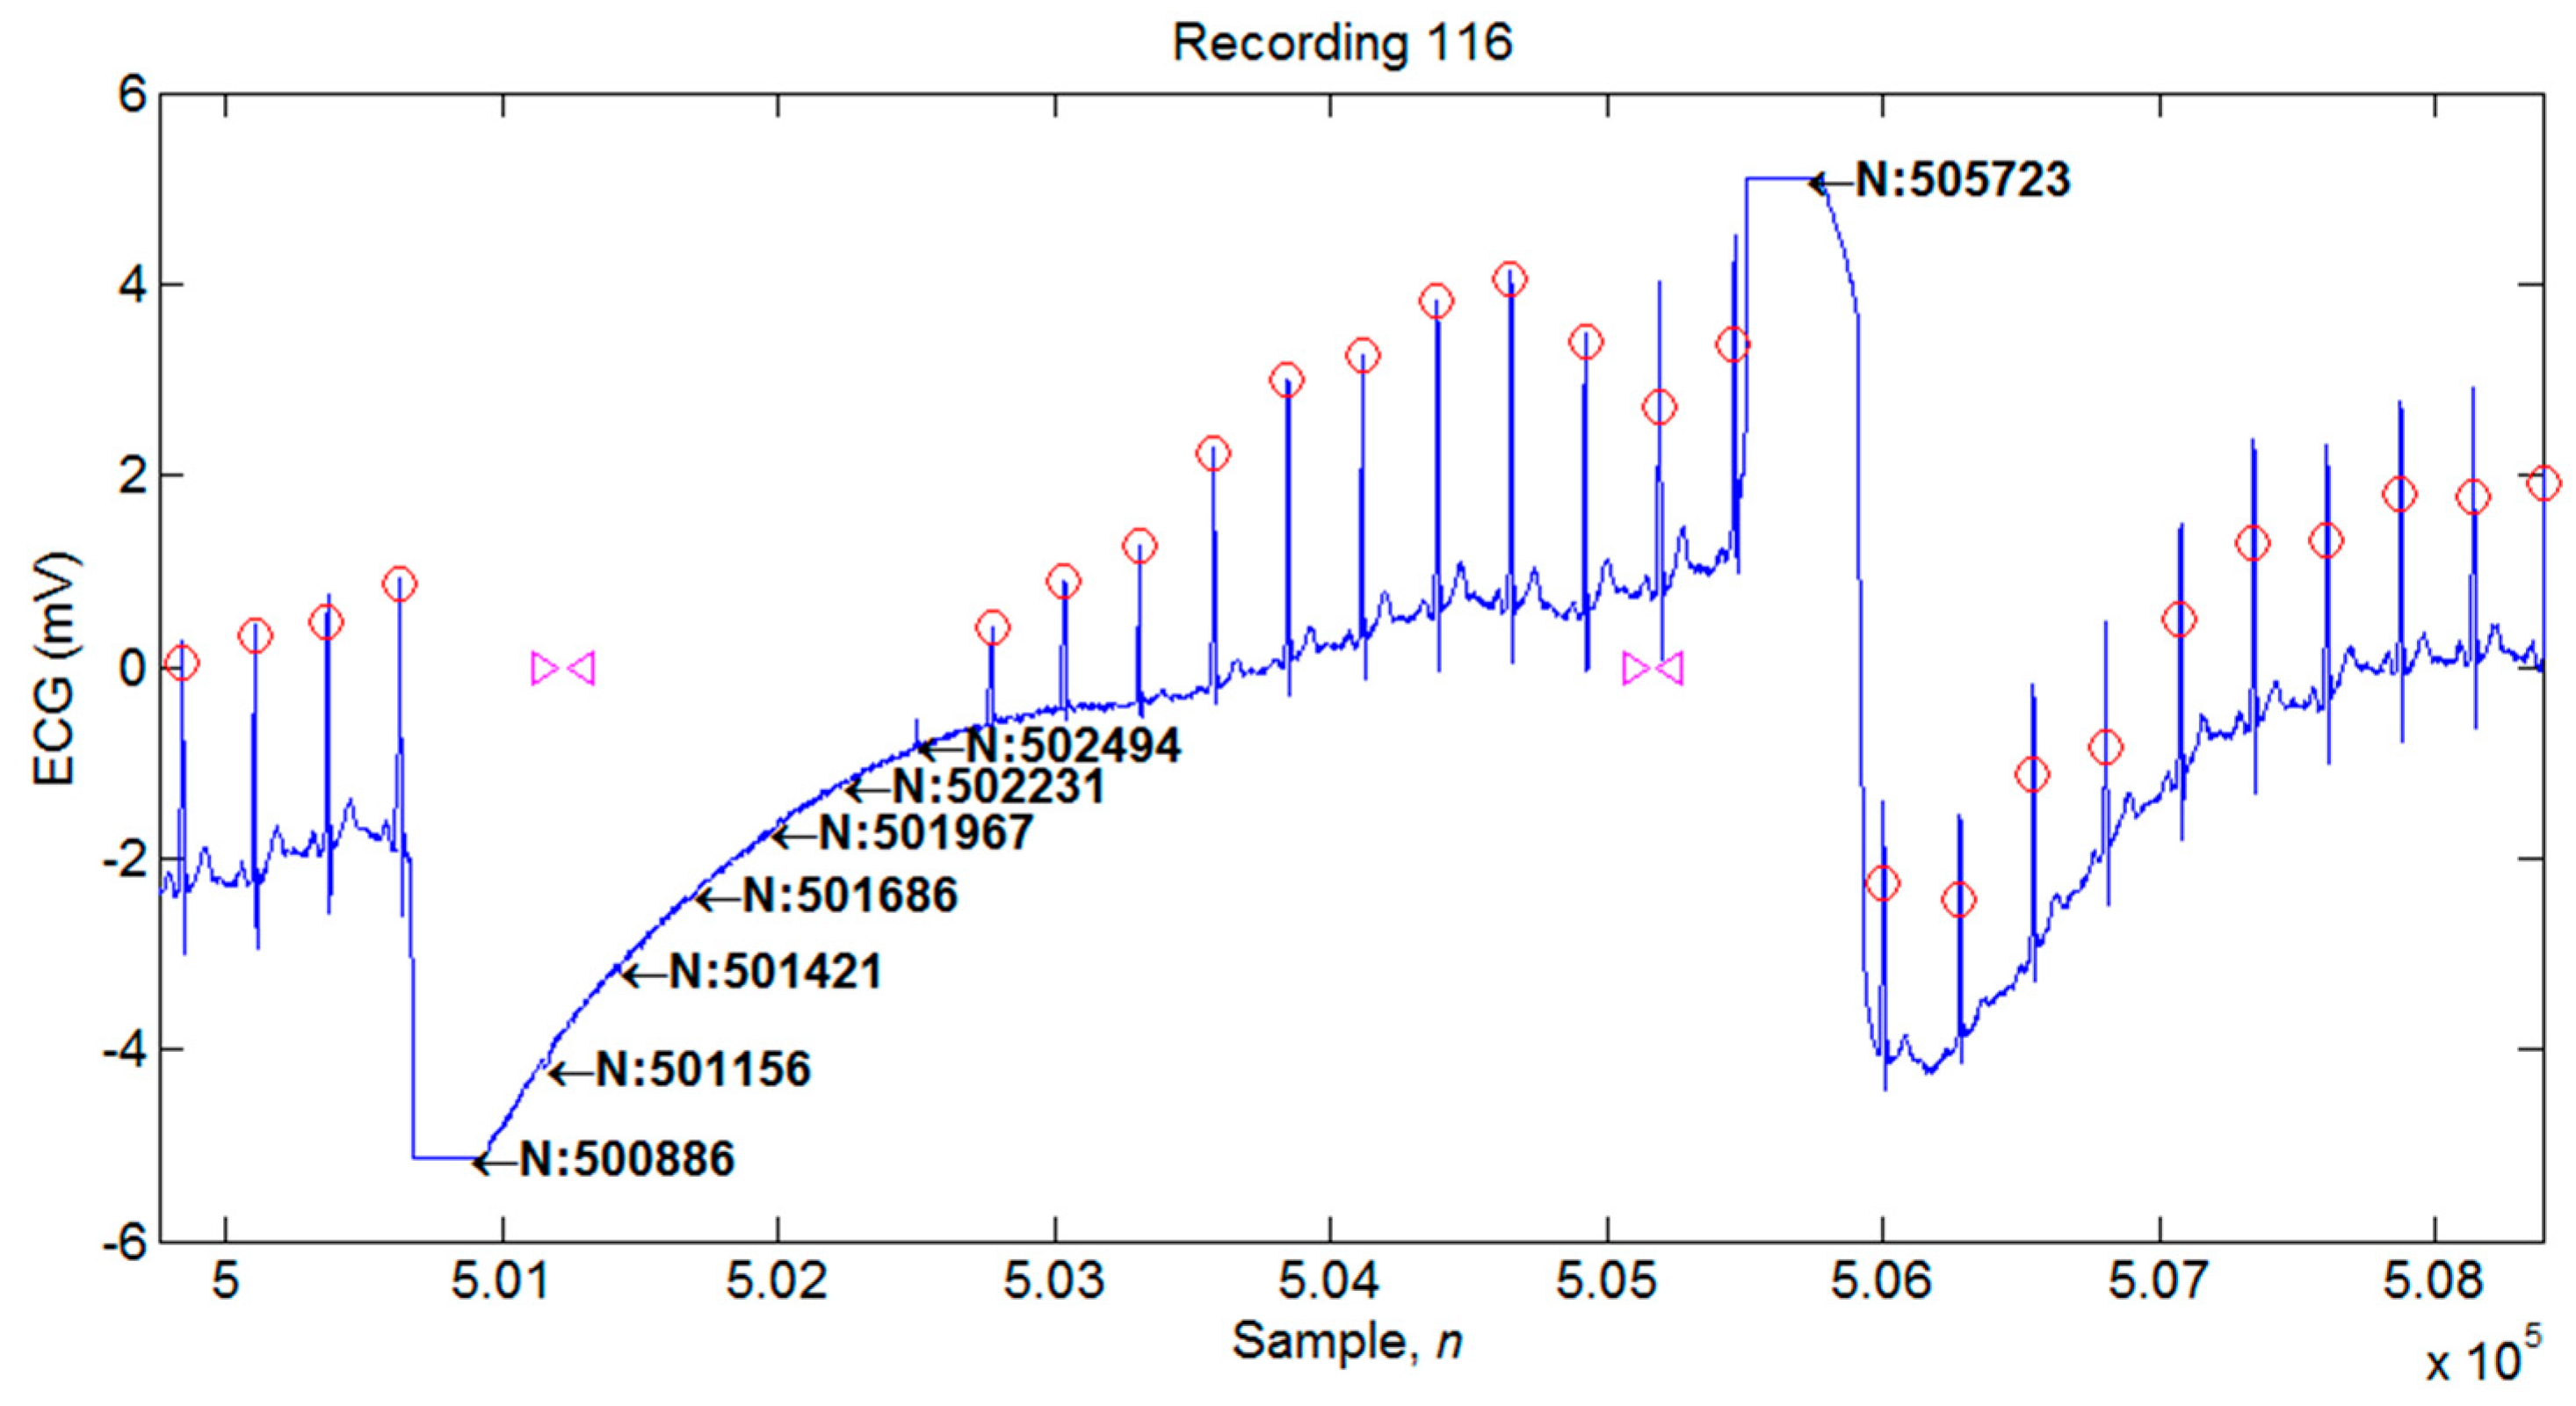
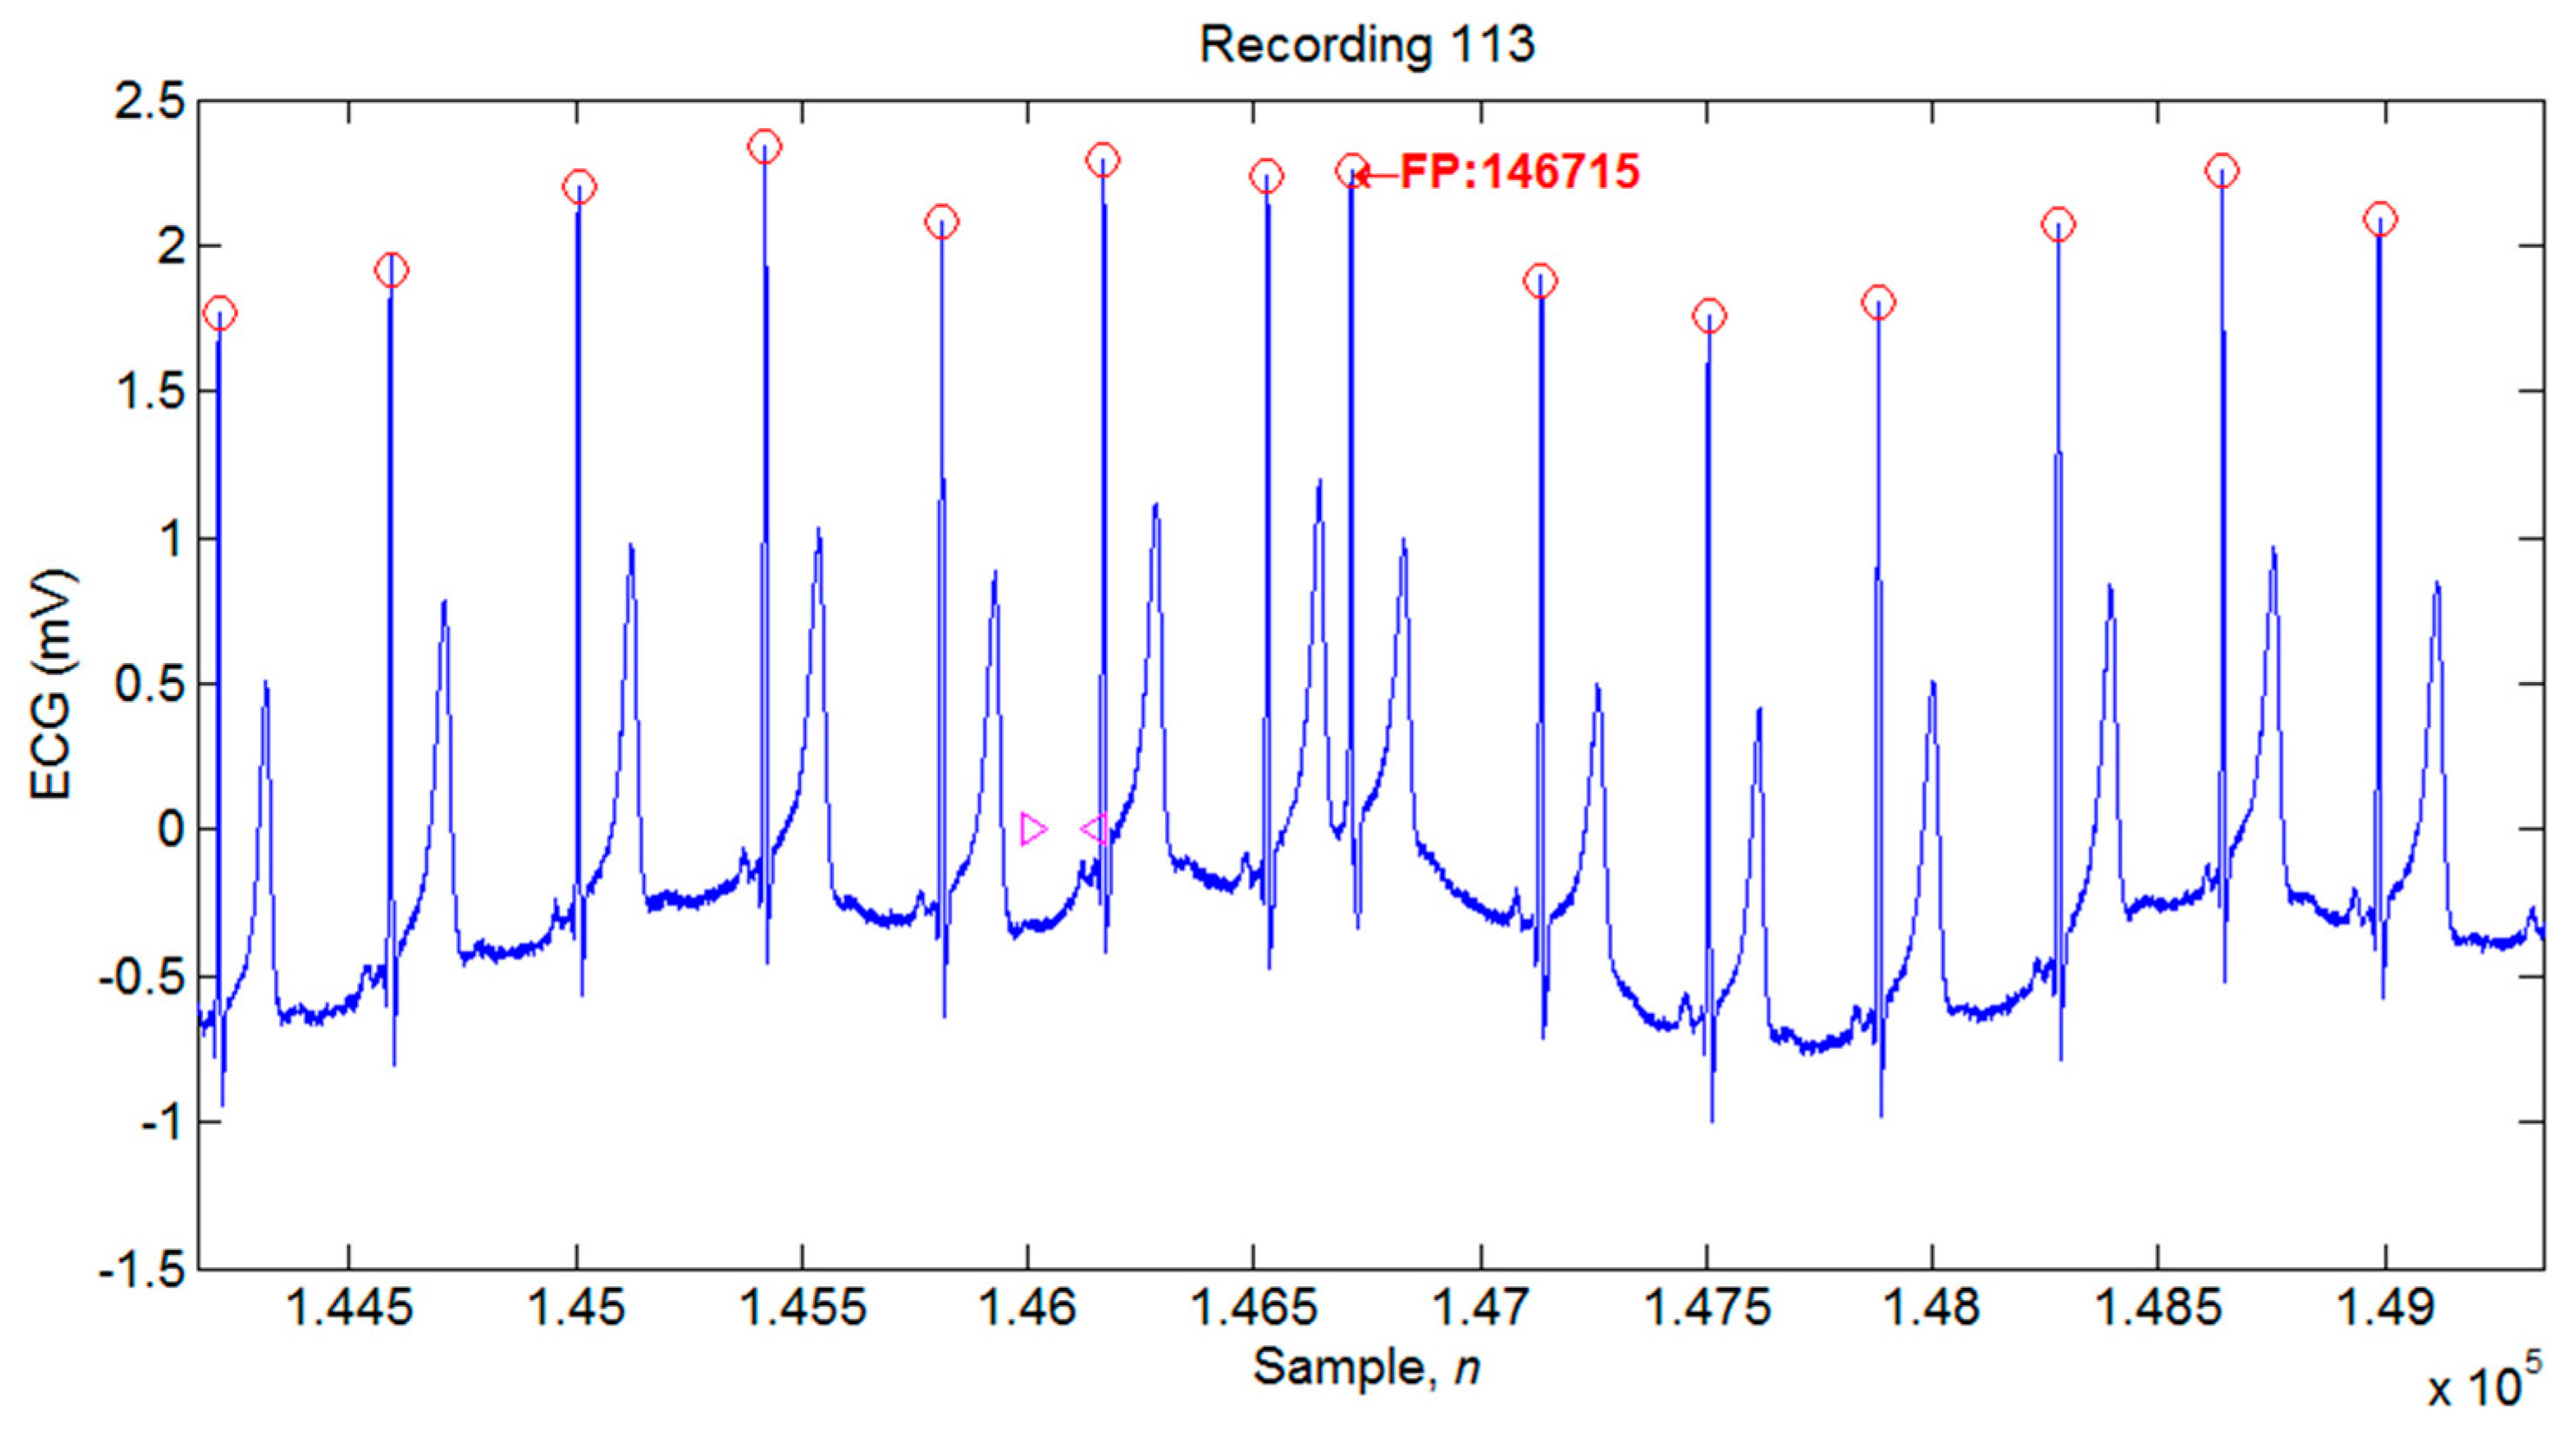
4.1. Illustrations of the Identifications of QRS Peaks
4.2. Performance Evaluation of the Proposed QRS Peak Detection System and Comparison with the Previous Studies
4.3. Limitations of the Proposed Algorithm
5. Conclusions
Author Contributions
Funding
Conflicts of Interest
References
- Christov, I.I. Real time electrocardiogram QRS detection using combined adaptive threshold. Biomed. Eng. Online 2004, 3, 1–9. [Google Scholar] [CrossRef]
- Pan, J.; Tompkins, W.J. A real-time QRS detection algorithm. IEEE Trans. Biomed. Eng. 1985, 32, 230–236. [Google Scholar] [CrossRef] [PubMed]
- Manikandan, M.S.; Soman, K.P. A novel method for detecting R-peaks in electrocardiogram (ECG) signal. Biomed. Signal Process. Control 2012, 7, 118–128. [Google Scholar] [CrossRef]
- Slimane, Z.E.H.; Nait-Ali, A. QRS complex detection using empirical mode decomposition. Digit. Signal Process. 2010, 20, 1221–1228. [Google Scholar] [CrossRef]
- Chen, C.L.; Chuang, C.T. A QRS detection and R point recognition method for wearable single-lead ECG devices. Sensors 2017, 17, 1969. [Google Scholar] [CrossRef]
- Castells-Rufas, D.; Carrabina, J. Simple real-time QRS detector with the MaMeMi filter. Biomed. Signal Process. Control 2015, 21, 137–145. [Google Scholar] [CrossRef]
- Phukpattaranont, P. QRS detection algorithm based on the quadratic filter. Expert Syst. Appl. 2015, 42, 4867–4877. [Google Scholar] [CrossRef]
- Sharma, L.D.; Sunkaria, R.K. A robust QRS detection using novel pre-processing techniques and kurtosis based enhanced efficiency. Measurement 2016, 87, 194–204. [Google Scholar] [CrossRef]
- Choi, S.; Adnane, M.; Lee, G.J.; Jang, H.; Jiang, Z.; Park, H.K. Development of ECG beat segmentation method by combining lowpass filter and irregular RR interval checkup strategy. Expert Syst. Appl. 2010, 37, 5208–5218. [Google Scholar] [CrossRef]
- Abibullaev, B.; Seo, H.D. A new QRS detection method using wavelets and artificial neural networks. J. Med. Syst. 2011, 35, 683–691. [Google Scholar] [CrossRef]
- Karimipour, A.; Homaeinezhad, M.R. Real-time electrocardiogram P-QRS-T detection–delineation algorithm based on quality-supported analysis of characteristic templates. Comput. Biol. Med. 2014, 52, 153–165. [Google Scholar] [CrossRef]
- Merah, M.; Abdelmalik, T.A.; Larbi, B.H. R-peaks detection based on stationary wavelet transform. Comput. Methods Progr. Biomed. 2015, 121, 149–160. [Google Scholar] [CrossRef]
- Farashi, S. A multiresolution time-dependent entropy method for QRS complex detection. Biomed. Signal Process. Control 2016, 24, 63–71. [Google Scholar] [CrossRef]
- Berwal, D.; Kumar, A.; Kumar, Y. Design of high performance QRS complex detector for wearable healthcare devices using biorthogonal spline wavelet transform. ISA Trans. 2018, 81, 222–230. [Google Scholar] [CrossRef]
- Zhang, F.; Lian, Y. QRS detection based on morphological filter and energy envelope for applications in body sensor networks. J. Signal Process. Syst. 2011, 64, 187–194. [Google Scholar]
- Arbateni, K.; Bennia, A. Sigmoidal radial basis function ANN for QRS complex detection. Neurocomputing 2014, 145, 438–450. [Google Scholar] [CrossRef]
- Yazdani, S.; Vesin, J.M. Extraction of QRS fiducial points from the ECG using adaptive mathematical morphology. Digit. Signal Process. 2016, 56, 100–109. [Google Scholar] [CrossRef]
- Zidelmal, Z.; Amirou, A.; Adnane, M.; Belouchrani, A. QRS detection based on wavelet coefficients. Comput. Methods Progr. Biomed. 2012, 107, 490–496. [Google Scholar] [CrossRef]
- Bouaziz, F.; Boutana, D.; Benidir, M. Multiresolution wavelet-based QRS complex detection algorithm suited to several abnormal morphologies. IET Signal Process. 2014, 8, 774–782. [Google Scholar] [CrossRef]
- Kohler, B.U.; Hennig, C.; Orglmeister, R. The principles of software QRS detection. IEEE Eng. Med. Biol. Mag. 2002, 21, 42–57. [Google Scholar] [CrossRef]
- Goldberger, A.L.; Amaral, L.A.N.; Glass, L.; Hausdorff, J.M.; Ivanov, P.C.; Mark, R.G.; Mietus, J.E.; Moody, G.B.; Peng, C.K.; Stanley, H.E. PhysioBank, PhysioToolkit, and PhysioNet: Components of a New Research Resource for Complex Physiologic Signals. Circulation 2000, 101, e215–e220. [Google Scholar] [CrossRef] [PubMed]
- de Chazal, P.; O’Dwyer, M.; Reilly, R.B. Automatic classification of heartbeats using ECG morphology and heartbeat interval features. IEEE Trans. Biomed. Eng. 2004, 51, 1196–1206. [Google Scholar] [CrossRef] [PubMed]
- Unser, M. Ten good reasons for using spline wavelets. In Proceedings of the SPIE Conference on Mathematical Imaging: Wavelet Applications in Signal and Image Processing V, San Diego, CA, USA, 6–9 August 1997; Volume 3169, pp. 422–431. [Google Scholar]
- Mallat, S.G. A theory for multiresolution signal decomposition: The wavelet representation. IEEE Trans. Pattern Anal. Mach. Intell. 1989, 11, 674–693. [Google Scholar] [CrossRef]


| No. | Total Beats | TP | FN | FP | FP+FN | Se (%) | +P (%) | DER (%) |
|---|---|---|---|---|---|---|---|---|
| 100 | 2273 | 2273 | 0 | 0 | 0 | 100 | 100 | 0 |
| 101 | 1865 | 1865 | 0 | 0 | 0 | 100 | 100 | 0 |
| 102 | 2187 | 2187 | 0 | 0 | 0 | 100 | 100 | 0 |
| 103 | 2084 | 2084 | 0 | 0 | 0 | 100 | 100 | 0 |
| 104 | 2229 | 2228 | 1 | 1 | 2 | 99.96 | 99.96 | 0.09 |
| 105 | 2572 | 2568 | 4 | 27 | 31 | 99.84 | 98.96 | 1.21 |
| 106 | 2027 | 2022 | 5 | 0 | 5 | 99.75 | 100 | 0.25 |
| 107 | 2137 | 2136 | 1 | 0 | 1 | 99.95 | 100 | 0.05 |
| 108 | 1763 | 1750 | 13 | 10 | 23 | 99.26 | 99.43 | 1.3 |
| 109 | 2532 | 2532 | 0 | 0 | 0 | 100 | 100 | 0 |
| 111 | 2124 | 2123 | 1 | 0 | 1 | 99.95 | 100 | 0.05 |
| 112 | 2539 | 2539 | 0 | 0 | 0 | 100 | 100 | 0 |
| 113 | 1789 | 1789 | 0 | 6 | 6 | 100 | 99.67 | 0.34 |
| 114 | 1879 | 1871 | 8 | 1 | 9 | 99.57 | 99.95 | 0.48 |
| 115 | 1953 | 1953 | 0 | 0 | 0 | 100 | 100 | 0 |
| 116 | 2412 | 2392 | 20 | 0 | 20 | 99.17 | 100 | 0.83 |
| 117 | 1535 | 1535 | 0 | 0 | 0 | 100 | 100 | 0 |
| 118 | 2278 | 2278 | 0 | 0 | 0 | 100 | 100 | 0 |
| 119 | 1987 | 1987 | 0 | 0 | 0 | 100 | 100 | 0 |
| 121 | 1863 | 1862 | 1 | 0 | 1 | 99.95 | 100 | 0.05 |
| 122 | 2476 | 2476 | 0 | 0 | 0 | 100 | 100 | 0 |
| 123 | 1518 | 1518 | 0 | 0 | 0 | 100 | 100 | 0 |
| 124 | 1619 | 1619 | 0 | 0 | 0 | 100 | 100 | 0 |
| 200 | 2601 | 2596 | 5 | 2 | 7 | 99.81 | 99.92 | 0.27 |
| 201 | 1963 | 1961 | 2 | 6 | 8 | 99.9 | 99.69 | 0.41 |
| 202 | 2136 | 2133 | 3 | 0 | 3 | 99.86 | 100 | 0.14 |
| 203 | 2980 | 2947 | 33 | 13 | 46 | 98.89 | 99.56 | 1.54 |
| 205 | 2656 | 2650 | 6 | 0 | 6 | 99.77 | 100 | 0.23 |
| 207 | 1860 | 1842 | 18 | 1 | 19 | 99.03 | 99.95 | 1.02 |
| 208 | 2955 | 2939 | 16 | 2 | 18 | 99.46 | 99.93 | 0.61 |
| 209 | 3005 | 3003 | 2 | 0 | 2 | 99.93 | 100 | 0.07 |
| 210 | 2650 | 2642 | 8 | 4 | 12 | 99.7 | 99.85 | 0.45 |
| 212 | 2748 | 2748 | 0 | 0 | 0 | 100 | 100 | 0 |
| 213 | 3251 | 3251 | 0 | 0 | 0 | 100 | 100 | 0 |
| 214 | 2262 | 2259 | 3 | 1 | 4 | 99.87 | 99.96 | 0.18 |
| 215 | 3363 | 3362 | 1 | 0 | 1 | 99.97 | 100 | 0.03 |
| 217 | 2208 | 2201 | 7 | 3 | 10 | 99.68 | 99.86 | 0.45 |
| 219 | 2154 | 2154 | 0 | 0 | 0 | 100 | 100 | 0 |
| 220 | 2048 | 2048 | 0 | 0 | 0 | 100 | 100 | 0 |
| 221 | 2427 | 2425 | 2 | 0 | 2 | 99.92 | 100 | 0.08 |
| 222 | 2483 | 2481 | 2 | 1 | 3 | 99.92 | 99.96 | 0.12 |
| 223 | 2605 | 2602 | 3 | 0 | 3 | 99.88 | 100 | 0.12 |
| 228 | 2053 | 2040 | 13 | 8 | 21 | 99.37 | 99.61 | 1.02 |
| 230 | 2256 | 2256 | 0 | 1 | 1 | 100 | 99.96 | 0.04 |
| 231 | 1571 | 1571 | 0 | 0 | 0 | 100 | 100 | 0 |
| 232 | 1780 | 1780 | 0 | 4 | 4 | 100 | 99.78 | 0.22 |
| 233 | 3079 | 3077 | 2 | 0 | 2 | 99.94 | 100 | 0.06 |
| 234 | 2753 | 2753 | 0 | 0 | 0 | 100 | 100 | 0 |
| Total | 109,488 | 109,308 | 180 | 91 | 271 | 99.84 | 99.92 | 0.25 |
| Methods | TP | FN | FP | FP+FN | DER% | Se% | +P% |
|---|---|---|---|---|---|---|---|
| Wavelet-Based Methods | |||||||
| Proposed | 109,308 | 180 | 91 | 271 | 0.25 | 99.84 | 99.92 |
| Zidelmal et al., 2012 [18] | 109,101 | 393 | 193 | 586 | 0.54 | 99.64 | 99.82 |
| Bouaziz et al., 2014 [19] | 109,354 | 140 | 232 | 372 | 0.34 | 99.87 | 99.79 |
| Merah et al., 2015 [12] | 109,316 | 178 | 126 | 304 | 0.28 | 99.84 | 99.88 |
| Berwal et al., 2018 [14] | 3186 | 22 | 26 | 48 | 1.49 | 99.31 | 99.19 |
| Non-Wavelet-Based Methods | |||||||
| Christov, 2004 [1] | 109,615 | 240 | 239 | 479 | 0.44 | 99.78 | 99.78 |
| Manikandan and Soman, 2012 [3] | 109,417 | 79 | 140 | 219 | 0.20 | 99.93 | 99.87 |
| Karimipour and Homaeinezhad, 2014 [11] | 115,945 | 192 | 308 | 500 | 0.43 | 99.81 | 99.70 |
| Castells-Rufas and Carrabina, 2015 [6] | 108,880 | 614 | 353 | 967 | 0.88 | 99.43 | 99.67 |
| Phukpattaranont, 2015 [7] | 109,281 | 202 | 210 | 412 | 0.38 | 99.82 | 99.81 |
| Farashi, 2016 [13] | 109,692 | 273 | 163 | 436 | 0.40 | 99.75 | 99.85 |
| Sharma and Sunkaria, 2016 [8] | 108,979 | 509 | 428 | 937 | 0.93 | 99.50 | 99.56 |
| Yazdani and Vesin, 2016 [17] | 109,357 | 137 | 108 | 245 | 0.22 | 99.87 | 99.90 |
| Chen and Chuang, 2017, [5] | 109,250 | 193 | 203 | 396 | 0.36 | 99.82 | 99.81 |
© 2019 by the authors. Licensee MDPI, Basel, Switzerland. This article is an open access article distributed under the terms and conditions of the Creative Commons Attribution (CC BY) license (http://creativecommons.org/licenses/by/4.0/).
Share and Cite
Lin, C.-C.; Chang, H.-Y.; Huang, Y.-H.; Yeh, C.-Y. A Novel Wavelet-Based Algorithm for Detection of QRS Complex. Appl. Sci. 2019, 9, 2142. https://doi.org/10.3390/app9102142
Lin C-C, Chang H-Y, Huang Y-H, Yeh C-Y. A Novel Wavelet-Based Algorithm for Detection of QRS Complex. Applied Sciences. 2019; 9(10):2142. https://doi.org/10.3390/app9102142
Chicago/Turabian StyleLin, Chun-Cheng, Hung-Yu Chang, Yan-Hua Huang, and Cheng-Yu Yeh. 2019. "A Novel Wavelet-Based Algorithm for Detection of QRS Complex" Applied Sciences 9, no. 10: 2142. https://doi.org/10.3390/app9102142
APA StyleLin, C.-C., Chang, H.-Y., Huang, Y.-H., & Yeh, C.-Y. (2019). A Novel Wavelet-Based Algorithm for Detection of QRS Complex. Applied Sciences, 9(10), 2142. https://doi.org/10.3390/app9102142