Abstract
Wind power generation output is highly uncertain, since it entirely depends on intermittent environmental factors. This has brought a serious problem to the power industry regarding the management of power grids containing a significant penetration of wind power. Therefore, a highly accurate wind power forecast is very useful for operating these power grids effectively and sustainably. In this study, a new dual-step integrated machine learning (ML) model based on the hybridization of wavelet transform (WT), ant colony optimization algorithm (ACO), and feedforward artificial neural network (FFANN) is devised for a 24 h-ahead wind energy generation forecast. The devised model consists of dual steps. The first step uses environmental factors (weather variables) to estimate wind speed at the installation point of the wind generation system. The second step fits the wind farm actual generation with the actual wind speed observation at the location of the farm. The predicted future speed in the first step is later given to the second step to estimate the future generation of the farm. The devised method achieves significantly acceptable and promising forecast accuracy. The forecast accuracy of the devised method is evaluated through several criteria and compared with other ML based models and persistence based reference models. The daily mean absolute percentage error (MAPE), the normalized mean absolute error (NMAE), and the forecast skill (FS) values achieved by the devised method are 4.67%, 0.82%, and 56.22%, respectively. The devised model outperforms all the evaluated models with respect to various performance criteria.
1. Introduction
Installation of renewable energy—predominantly wind energy—has received a great deal of attention globally due to several environmental protocols agreed upon by almost all countries as the primary directives of the United Nation (UN). This is due the fact that wind power generation is a zero-carbon generation method, is accessible everywhere, requires a smaller installation space, etc. Moreover, the advent of power electronics and the associated control technology has further accelerated the rapid deployment of wind generation systems globally.
Wind energy is a promising source of energy for the future generation smart grid. This is mainly due to the cleanness and the wide availability of wind energy. The recent and rapid development of power electronic converter technology is the other main reason for the promising integration of wind energy in the future smart grid.
Although wind power generation has significant environmental advantages and is a promising source of energy for the future, its uncertainty due to intermittency of weather variables makes it worth less than the conventional generation sources. This is because the generation power uncertainty causes large problems with power grid stability and control.
However, this problem is not unmanageable. To harness the benefit and increase the competitiveness of wind energy, an enhanced forecast of wind generation is essential. An accurate wind power forecast enhances control, stability, sustainability, and flexibility of electricity grids with a large proportion of wind generation. Accurate forecasts allow the various stakeholders involved in the power industry to make better decisions regarding power system investment, planning, operation, management, economics, market, strategy, risk analysis, etc. Thus, accurate 24 h-ahead (called short-term) prediction of wind generation plays a key role in the power systems containing a huge penetration of wind energy.
Plenty of approaches and enabling tools have been implemented in the last few years to forecast wind speed and the associated energy output. These methods are grouped as statistical, physical, and time-series methodologies according to the estimation approaches the techniques use [1]. A number of research groups nowadays use the integration of statistical and physical approaches to find improved hybrid approaches that can be used for a longer horizon of forecast. In the hybrid approaches, the statistical approaches play auxiliary roles on the forecast input dataset gathered by the physical approaches.
Although these two approaches have become very common for wind power prediction (WPP) [2,3], as mentioned above, the hybridization of statistical and physical techniques has become widely implementable and more effective [4,5]. Additionally, several correlation-based methods have been devised for wind energy prediction for obtaining lower forecast accuracy [6]. Contrarily, via time and the emergence of higher-level mathematical programming tools [such as artificial intelligence (AI), machine learning (ML), and deep learning (DL)], further innovative approaches have been devised for WPP. Namely, neural networks [7,8,9], neural networks with Gaussian approximation and Bayesian training [10], neural networks with wavelet transform (WT) [11], fuzzy system-based techniques [5,12], Kalman filter [13], support vectors [14], and neural networks combined with fuzzy logic system [15] were devised for WPP.
From the aforementioned previous works on WPP, the ML or the AI based methods have given better forecast accuracy over the other approaches. However, most of these methods have only used the wind power generation historical measurement records and did not consider environmental factors (weather variable forecast values) while developing the forecast models. These methods are faced with major problems when the historical wind power measurement dataset has skipped or provides erroneous entries, and they are consequently incapable of giving accurate predictions.
Deeper review of the prior studies on WPP new prediction approaches are still in demand to enhance accuracy and maintain consistency of forecasts while keeping an acceptable computational time. This purpose inspired the implementation of integrated and dual-step WPP models based on various ML techniques. These models use both statistical (wind energy measurement values) and physical (weather information) datasets to implement improved WPPs. Namely, dual-step WPP based on the adaptive neuro-fuzzy inference system (ANFIS) [16], the hybrid particle swarm optimization (PSO)-artificial neural network (ANN) [17], the hybrid genetic algorithm (GA)-ANN [18], and the hybrid Hilbert-Huang transform (HHT)-GA-ANN [19] have been applied for WPP using historical wind energy dataset, wind speed actual observation, and meteorological forecasts. In addition, dual-stage game theory-based ML approaches have been applied for demand response management in the context of a smart grid [20,21]. These methods have achieved very acceptable prediction accuracy and suggested innovative techniques of treating skipped wind farm power records. However, the prediction accuracies obtained by these methods are not quite enough and can be further improved. The improvement can be achieved by employing more robust and global optimization techniques for training and obtaining the best parameter sets of the forecast engines and by applying more suitable feature extraction algorithms and reconfiguring the forecast engines, as proposed in this paper. Some of the dual-step ML methods are also computationally exhaustive [20,21] for wind power forecasting problem.
In this study, a new, effective, and computationally simple dual-step 24 h-ahead WPP integrated ML model consisting of WT, ant colony optimization algorithm (ACO), and feedfoward artificial neural network (FFANN) is devised. The devised model trains with datasets from wind farm actual power generation and numerical weather prediction (NWP).
The devised dual-step integrated WT-ACO-FFANN WPP model is compared with persistence, dual-step BP-FFANN, dual-step GA-FFANN, and dual-step PSO-FFANN based WPP models to validate its suitability regarding prediction accuracy and running time performances.
The key aims of this study are outlined as follows:
- (1)
- Provide a new and effective dual-step integrated ML model for 24 h-ahead WPP considering wind farm power generation and weather forecast datasets;
- (2)
- Improve forecast accuracy, validated through performance comparison with persistence-based reference models and other ML based models;
- (3)
- Recommend practical insights for WPP problems involving training datasets with skipped entries.
The remaining sections of the paper are outlined as follows. Section 2 provides the devised dual-step WPP model. Section 3 presents the depiction and the preparation of the forecast inputs. The WT-ACO-FFANN configuration for WPP and the theory and mathematical modeling of WT, ACO, and FFANN are described in Section 4. Section 5 defines the various criteria employed for estimating the effectiveness of the devised technique. The experimental outcomes and validations for the investigated operational wind generation system are discussed in Section 6. The study is finally summarized in Section 7.
2. Devised 24 h-Ahead Prediction Approach
The devised WPP technique is based on the integration of WT, ACO, and FFANN. The WT is employed to extract the most important and healthy time subseries (data elements) from the target variable (wind power) original data time series. That means WT is applied in this paper to expand the initial target data into subseries. Using the target data subseries instead of the original data series increases the forecast accuracy of the devised WPP method. Therefore, the target data subseries is employed as the training target for the FFANN model at the second stage. That means the second stage FFANN models the existing affiliation between the wind speed actual measurement data at the farm spot and the wind generation actual measurement data subseries (obtained from the WT decomposition), while the first stage FFANN models the existing affiliation between the weather variables and the actual wind speed measurement.
Hence, through data-driven training of the FFANN models in these two stages, a trained wind power forecast model is obtained. The future (forecasted) weather variables from NWP models (weather stations) are given to the first-stage trained model to estimate the looming wind speed at the farm spot. This forecasted speed in the initial step is then given to the second step trained model to estimate the future wind generation subseries. The ACO algorithm is applied for the FFANN model in each stage of the devised approach for finding the global best values of the FFANN connecting weights. The ACO algorithm searches the optimal values of the FFANN weight parameters to ensure that the possible lowest error of the wind generation forecast is achieved. Finally, the desired wind generation forecast is found using the inverse WT of the obtained future wind power subseries.
The devised dual-step WPP approach in this paper is shown schematically in Figure 1. As aforementioned, the ACO-FFANN at the first step is implemented to estimate the farm spot and the turbine hub elevation. In this step, a predictor set consisting of historical weather forecasts as the input and prior wind speed actual record as the target are employed to train the FFANN model. In the second step, the WT-ACO-FFANN is implemented to fit the wind speed versus power relationship using actual measurement data. Then, the estimated speed by the ACO-FFANN in the first step is given to the WT-ACO-FFANN in the second step to estimate the wind generation for the time ahead.
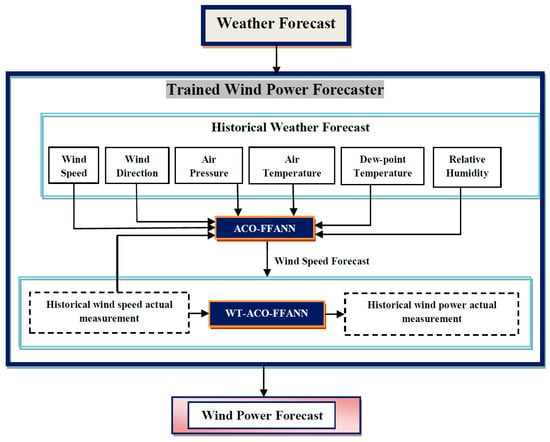
Figure 1.
Dual-step wind power prediction approach based on hybrid wavelet transform (WT)-ant colony optimization algorithm (ACO)-feedfoward artificial neural network (FFANN).
3. Data Sources and Treatments
In this section, the main data sources and types used to construct the proposed wind power forecasting model are discussed. The relevant data treatment techniques used in the forecasting process are also presented in this section.
3.1. Wind Farm Actual Power Generation Data
Wind generation systems have a Supervisory Control and Data Acquisition (SCADA) center that archives the generated power and the status of the wind turbines in a fixed time interval (usually 1 min, 10 min, 15 min, or 1 h resolutions). The SCADA is computer software that can be run on a single computer if the wind farm is a smaller size and contains a smaller number of wind turbines located in the same or nearby locations. However, it can be run in a distributed framework if the wind farm has a large capacity and contains a huge number of turbines dispersed in various locations. The SCADA system enables wind farm operators to supervise and regulate remote operations and turbines online. In this paper, the SCADA system of an operational microgrid wind generation system in Beijing, China is examined. The generation system is rated at 2500 kW. In this work, the wind generation data are a vector consisting of the wind generation historical archives for three years (2014–2016) with 10-min resolution. The two-year (2014–2015) data are employed for the forecast model training and validation, while the remaining one-year (2016) data are utilized for the mode testing or forecast. The wind generation data are achieved based on the local time zone, which is China standard time (CST) [CST = Coordinated Universal Time (UTC) + 08:00].
3.2. Environmental (Weather) Data
Weather data play the major role in the devised WPP approach. Several techniques exist for obtaining weather data at specific sites and resolutions; for example, through observation, data-mining, and NWP. Observation is the most reliable technique but is not usually feasible and accessible. Data-mining is comparatively malleable but incapable of downscaling. NWP uses energy conservation principles to obtain the weather information and is able to downscale the weather data to a desired point in space. The accuracy of the weather data source highly influences the accuracy of WPPs.
There are various types of NWP models, for instance, Consortium for Small-scale Modeling (COSMO), weather research and forecast (WRF), Regional atmospheric modeling system (RAMS), and Mesoscale Meteorological Model, version 5 (MM5) [22,23,24,25]. In this paper, weather information (forecast) from the WRF model is used. The weather forecast is downscaled for the location of the farm and the hub elevation.
The weather information used is a matrix where the rows represent the samples and the columns represent each weather variable. Six selected weather attributes (wind speed, wind direction, pressure, temperature, dew point, and humidity) recorded for three years (2014–2016) with 15-min resolution are used. The two-year (2014–2015) weather data are used for the wind power forecast model training and validation, while the remaining one-year (2016) weather data are employed to test the model. The weather variables are selected due to their high correlation with wind energy. The WRF weather data are achieved based on the UTC time, which lags 8 h from the CST.
3.3. Data Treatment
Here, the input data are treated with various methodologies in order to obtain useable and synchronized forms of all the data. The data treatment stage is performed before the WT transformation and the FFANN model training steps are executed. The following are the data treatment techniques employed in this paper [19].
(1) Both the 10-min resolution actual measurement data and the 15-min resolution weather data are changed into hourly-average data to form a complete one-hour resolution data;
for the wind speed and power actual measurements,
for the weather forecast information.
Here, x10-min(t), x15-min(t), and xhourly(t) are the 10-min resolution wind energy generation data, the 15-min resolution weather data, and the hourly resolution values, respectively.
(2) The WRF weather archives are converted from the UTC to the CST (data timestamp synchronization);
Here, xCST(t) and xUTC(t) are hourly weather data in CST and UTC, respectively.
(3) Skipped raw data are replaced by an equivalent data generated by the following expression:
Here, xi denotes the value at the ith timestamp, and μ1 and μ2 are weight coefficients (0.5 is used in this work). xi−24 and xi+24 are the values at similar hours on the prior day and the following day, respectively.
4. Devised Configuration for the Integrated WT-ACO-FFANN Based ML Forecast Model
Here, the configuration of the proposed integrated wind power forecasting model is discussed. The working principles and the mathematical modeling of each of the constitute algorithms in the integrated model are also presented in this section.
4.1. Wavelet Transform (WT)
The amplitude of the energy output of wind turbines alternates in each timestamp. Deeper investigation of the wind power generation data shows that it has non-stationary and non-linear behaviors. This makes the data more complex for understanding and simplification, as there might be several noise (unimportant) components superimposed. The direct use of this raw data for prediction model training input may compromise the quality of forecasts. This calls for the use of some sort of mechanism for extracting the most important and well-behaving features from the original (raw) dataset, as proposed in this work.
Wavelet transform (WT) decomposes the forecast model target variable dataset into a group of subseries. It extracts a new set of features from the original target variable. The resulting new features provide enhanced performance compared to the original target feature. Therefore, using the new features derived from the WT decomposition instead of the original target variable (wind generation) definitely enhances the performance of the wind generation forecast.
The main reason for the enhanced performance of the new data features obtained from the WT decomposition is due to the data filtering capability of the WT.
There are two types of wavelet transform. They are continuous wavelet transform (C-WT) and discrete wavelet transform (D-WT). The C-WT, of a signal h(x) with reference to a mother wavelet , is formulated below [26].
Here, p is the wavelet scaling parameter that regulates the scattering of the wavelet, and q is the wavelet transformation parameter that determines the center of the wavelet. The D-WT, , is as precise as the C-WT but more efficiently powerful [27]. D-WT is formulated as follows.
Here, T is the size of h(t), p and q are functions of the integral values r and s (i.e., p = 2r, q = s2r), and t is a discretized time.
Mallat et al. [28] developed a very quick and efficient D-WT algorithm relying on the four fundamental filter types. Multi-resolution using the Mallat decomposition and reconstruction techniques is a way to obtain “approximation” and “detail” components of a particular signal. Through sequential decomposition of the approximation, a multistep ranked decomposition is achieved. That means the initial given signal is decomposed to reduced resolution sub-signals. Figure 2 shows the flowchart of the multistep WT decomposition process.
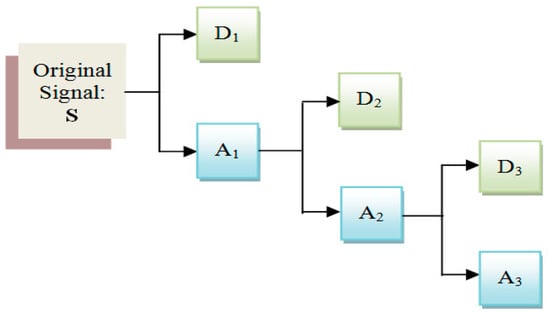
Figure 2.
Multistep WT decomposition.
In this paper, a Daubechies order 4 (Db4) wavelet function is employed as the mother wavelet . Db4 compromises evenness versus wavelength to provide a relevant feature for WPP. Db4 based WTs have been implemented by prior researchers for electricity demand prediction [26,27], electricity price prediction [29], and solar power forecasting [30]. Moreover, three decomposition stages are employed, as in [29,30], since this can represent the target variable (wind power) data series in a precise and sensible manner.
4.2. Ant Colony Optimization (ACO)
ACO is a probabilistic algorithm to solve optimization cost functions that are able to be represented for searching better paths via graphs. ACO is widely applied in computer science and operations research. Its development was motivated by the behavior of ants searching for the optimal path of a food location. The pheromone-based information exchange method of real ants is generally the major modeling framework of ACO [31]. Artificial ants represent heuristic optimization techniques motivated by the action of biological ants. Hybridizations of artificial ants and search methods has become an optional technique for several optimization works containing some kind of graph, for instance, vehicle and internet routing.
ACO is a class of AI-based metaheuristic optimization algorithms established based on the behavior of colonies of biological ants [32]. Artificial ants are the simulating agents that trace the best solutions through the exploration of a parameter domain consisting of all possible solutions. Biological ants excrete pheromones communicating with each other for food when discovering their surroundings. The artificial ants in ACO likewise save their locations and the excellence of their solutions; thus, in future search steps, additional ants discover improved solutions [33].
To increase the forecasting performance of wind power prediction models, the ACO is employed to search the global best parameter set of the models. Specifically, in this work, the ACO technique is employed to find the optimal parameters (neuron connection weights) of the FFANN wind power forecasting model.
The ACO algorithm builds a full-directed graph via n FFANN model parameters. Initially, m ants are arbitrarily positioned in n parameter nodes (locations). The record list recordk saves the nodes that the ants have moved to, and recordk is set for each ant k. The pheromone concentration ξij(0) at each side is initially set at 0. The ant chooses the following node according to the pheromone concentration at each side. The probability that the ant travels from parameter i to parameter j at the t step can be expressed as follows.
Here, ηij is a heuristic message that is normally calculated as ; where dij is the Euclidean distance between two parameters, ξij(t) is the pheromone concentration on the route from parameter i to parameter j at the t step of the ACO running, and α and β are the message heuristic coefficient and the anticipation heuristic coefficient that are employed to allocate the weights for the heuristic message and the pheromone concentration. When the ant finishes its travel, the message (information) concentration on each route is modified as follows.
Here, p (0, 1] is a weight coefficient, which is called the pheromone evaporation ratio. is the pheromone improvement of the route between parameter i and parameter j while traveling, and it is described as follows.
Here, Q is a fixed-term known as pheromone intensity, and Lk is the route distance of the kth ant in the travel. The ACO algorithm converges when all the ants arrive at a similar solution.
Figure 3 shows the flowchart of the ACO.
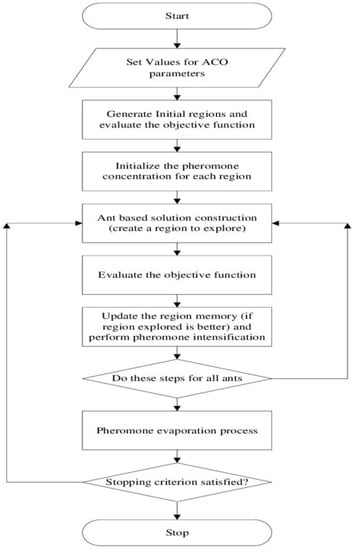
Figure 3.
Flowchart of the ACO algorithm.
The ACO algorithm parameters and their values employed in this paper are provided in Table 1.

Table 1.
ACO parameters and their values.
4.3. Feedforward Artificial Neural Network (FFANN)
ANN is a robust data processing (regression or classification) model, which is able to capture an existing complex relationship within a dataset. ANN can quickly learn the behavior of the data and acquire knowledge from them. The development of the ANN model was motivated by the method the human nervous system, specially the brain, employs to process facts. The important characteristic of the ANN is its unique configuration for data manipulation. It consists of plenty of information manipulating constituents known as neurons, which are configured in various hierarchical layers. The layers are input, hidden, and output layers. The neurons making up the input, hidden, output layers are respectively called input, hidden, and output neurons. Neurons are connected through certain scaled connections. The neuron connecting scales are known as weights. The neurons in ANN operate in combination to solve a given real-world problem (fitting, approximation, regression, pattern recognition, classification, etc.) [19,34,35].
ANN learns about the environment (data behavior) through examples or experiences as human beings do. ANNs are implemented to solve a given problem or application via a learning or training procedure. Training a human brain is performed via sufficiently updating activities or rules of the synaptic networks among neurons in the brain nervous system. The same is done for training the ANN neurons. ANNs learn by updating the connection weights among the neurons.
There are different types of ANNs based on the configuration (connection arrangement) of the neurons and the flow of information. ANNs can be categorized as feedforward artificial neural network (static network) and recurrent artificial neural network (dynamic network). The FFANNs have no feedback components and hold no delays. In FFANN, information flows right from inputs to output in the forward direction. The model output is computed right from the input employing the feedforward connection weights, while in the recurrent neural network models, the output relies not only on the present inputs to the model but also on the present or the prior input, output, or state of the model. Although they are effective for high dimensions and very complex problems, the recurrent neural networks are complex for implementation and can be computationally exhaustive. On the other hand, FFANNs are easy to implement, fast, and very effective for reduced-dimension data processing problems such as forecasting.
While developing a FFANN model for solving a specific problem, the quantity of the hidden layer neurons should be chosen properly and with great care. Nevertheless, there exists no clear technique for optimal sizing of the amount of neurons at hidden layers. In this study, we determine the quantity of hidden neurons through extensive and continuous experimentation, which is called the empirical parametrization process. Various configurations of FFANN with plenty of neurons at the hidden layer are examined. The best FFANN model configuration is selected using the root mean squared error (RMSE) measure between the model output value and the target real value. The selected configuration type and parameters values of the FFANN model for the proposed WPP problem in this paper are given in Table 2.

Table 2.
Parameters of FFANN.
The chosen FFANN model configuration for the proposed WPP task in this paper is depicted schematically in Figure 4. The corresponding parameter values of the model are presented in Table 2.
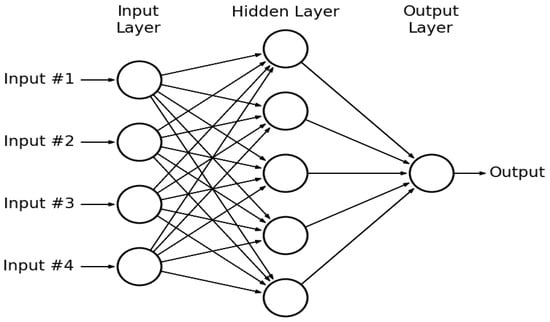
Figure 4.
Structure of FFANN.
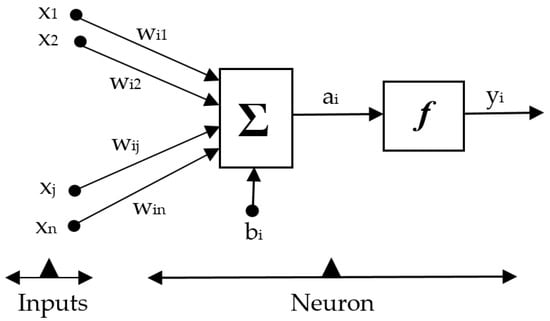
Figure 5.
Mathematical model of a neuron of FFANN.
In Figure 5, the xs are the inputs to the ith neuron, yi is the result, wij is a connecting weight, bi is a bias quantity (usually constant), and fi is called the activation function. The activation function carries out a major task during the FFANN model training. It controls the behavior of the neurons’ output. Based on Figure 5, the FFANN neuron output can be formulated as follows.
Normally, FFANN is developed using the back propagation (BP) training technique. In the BP learning of the FFANN, the neuron connecting weights are adjusted by employing the BP algorithm over the given input/output dataset. This greatly helps the FFANN model to learn the behavior of the data very quickly. While running to find the values of the FFANN weight parameters during the training process, the BP executes a gradient descent inside the solution domain in the direction of the global least value. Although the BP training technique needs less computation time, it may be stuck by suboptimal (local) solutions and is therefore not capable of reaching a global (system-level) optimal solution. Hence, the BP training of the FFANN model does not guarantee reliable wind power forecasting accuracy throughout the entire forecasting horizon and scenario.
This paper uses the ACO algorithm for the FFANN training. Hence, the ACO training of the FFANN model results in global optimal values for the FFANN connection weights, which correspond to a higher wind power forecasting accuracy.
The ACO optimization technique is computationally simple and convergent for a given configuration of the FFANN model. In this work, the FFANN model weights are implemented as parameters of the ACO. The mean squared error (MSE) between the FFANN result and the real observation is formulated as the cost (fitness) function of the ACO algorithm. The goal of the devised strategy is to obtain the smallest value of this fitness function. This procedure iterates until the prediction error achieves the intended level.
The dual-step integrated ML algorithm employed to implement the devised WPP is discussed stepwise in Appendix A.
5. Prediction Performance Evaluation
The following formulated criteria are employed to quantify the performance of the devised dual-step integrated ML based WPP model.
• Mean absolute percentage error (MAPE):
where and are the real and the prediction values of the power at hour h, respectively, and N is the forecasting horizon.
• Root mean squared error (RMSE):
• Normalized mean absolute error (NMAE):
where Pmax is the peak generation capacity of the wind generation system, which is 2500 kW in this paper.
• Error Variance:
The inconsistency of the WPP method after development is an index of the stochasticity of the method and is estimated by calculating the variance of the forecasting error. The prediction is considered to be highly accurate or certain if the result of the variance is lower [19]. Using Equation (11), daily error variance is expressed as:
• Forecast skill (FS):
The FS measure calculates the worth of the WPP models by referring the prediction error to the persistence output. For 24 h-ahead WPPs, the persistence outputs can be defined as:
The FS is estimated based on the relation of the RMSEs of forecast methods with reference to the persistence method [19,36], and it is given as follows.
6. Experimental Results and Discussion
In this work, the dual-step WT-ACO-FFANN integrated ML method is implemented for 24-ahead WPP of a real wind generation system in Beijing, China. The actual measurement of the power generation of the system is used for the forecast model construction. The wind farm has an installed capacity of 2500 kW.
A two-year (2014–2015) historical dataset of meteorological forecast, wind speed, and power real observations are employed for the forecast model training and validation; 85% of the dataset is employed for the model training, while the remaining 15% is utilized for validation. The data points are grouped either to the training or the validation dataset using a random selection mechanism.
The forecast performance of the devised model is tested using a one-year (2016) testing dataset. The prediction test results are demonstrated for one representative day from each season of the testing year and for the complete testing year on a monthly basis at the end. The four testing days are selected randomly to reveal the wind power generation actual scenario and the irregular accuracy distribution at different time frames in the testing year. The forecasts are presented in one-hour resolutions.
The forecasts by the proposed dual-step WT-ACO-FFANN integrated ML method are depicted in Figure 6, Figure 7, Figure 8 and Figure 9 for winter, spring, summer, and fall testing days, respectively. The figures show the wind power generation actual measurements from the SCADA versus the predicted power by the devised technique.
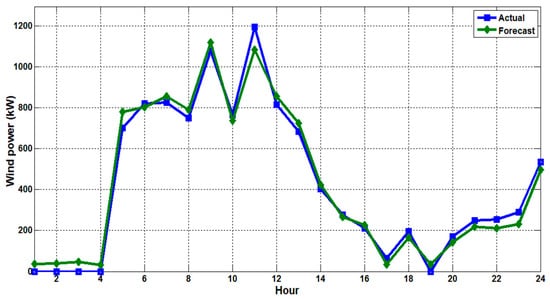
Figure 6.
Real versus forecasted wind power for a winter day (4 January 2016).
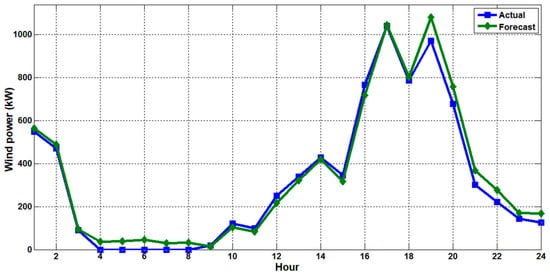
Figure 7.
Real versus forecasted wind power for a spring day (5 April 2016).
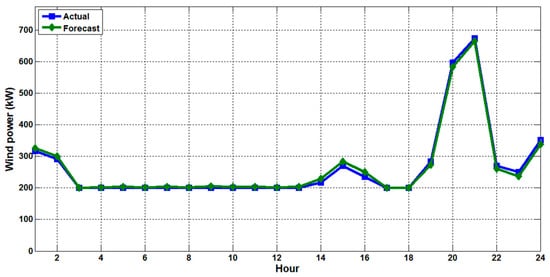
Figure 8.
Real versus forecasted wind power for a summer day (21 July 2016).
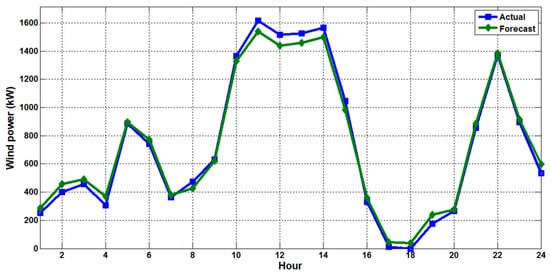
Figure 9.
Real versus forecasted wind power for a fall day (11 October 2016).
As illustrated in Figure 6, Figure 7, Figure 8 and Figure 9, the power forecast results by the devised method are quite similar to the actual wind power archived by the SCADA. They follow the trends of the actual records with smaller gaps or errors in between.
Table 3 provides the values of the criteria employed to estimate the performance of the proposed dual-step WT-ACO-FFANN integrated ML method for WPP.

Table 3.
Accuracy of the wind power forecasts by the proposed dual-step WT-ACO-FFANN integrated machine learning (ML) method.
Table 4 presents the comparison of the MAPEs obtained by the devised dual-step WT-ACO-FFANN method and four other methods—persistence, dual-step BP-FFANN, dual-step GA-FFANN, and dual-step PSO-FFANN methods. The devised method achieves improved accuracy with a mean MAPE value of 4.67% for 24 h-ahead forecast. The devised method’s mean MAPE improvements over the other four methods are 58.89%, 38.95%, 31.82%, and 22.30%, respectively.

Table 4.
Comparison of MAPE results (%) by various wind power prediction (WPP) methods.
Table 5 gives the comparison of the NMAEs achieved by the devised dual-step WT-ACO-FFANN method and the other four methods.

Table 5.
Comparison of normalized mean absolute error (NMAE) results (%) by various WPP methods.
Regarding the NMAE criterion values presented in Table 5, the devised dual-step WT-ACO-FFANN WPP method achieves the lowest average error value, which equals 0.82% of the wind farm maximum capacity. This a very acceptable value in the current research scope of WPP, which verifies the effectiveness of the devised WPP method in this work.
The hourly WPP absolute errors normalized by the wind farm maximum power (2500 kW) for all the evaluated methods are displayed in Figure 10, Figure 11, Figure 12 and Figure 13 for winter, spring, summer, and fall forecast test days, respectively. It is illustrated in the figures that the devised dual-step WT-ACO-FFANN WPP method achieves the lowest absolute error values over the other methods in most of the day hours.
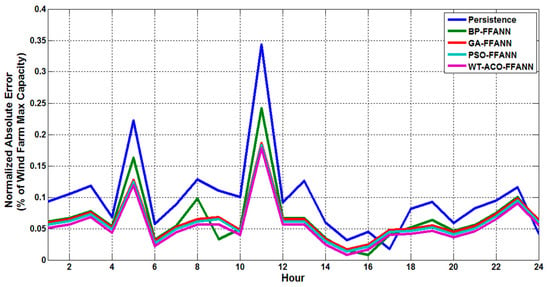
Figure 10.
Hourly absolute errors for a winter day (4 January 2016).
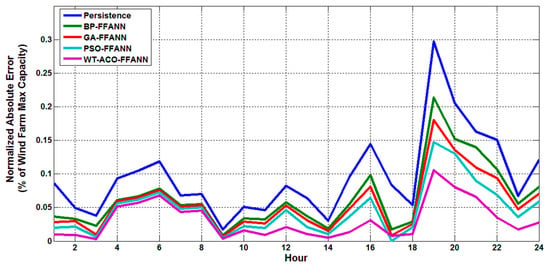
Figure 11.
Hourly absolute errors for a spring day (5 April 2016).
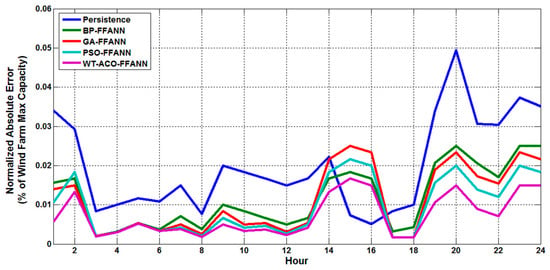
Figure 12.
Hourly absolute errors for a summer day (21 July 2016).
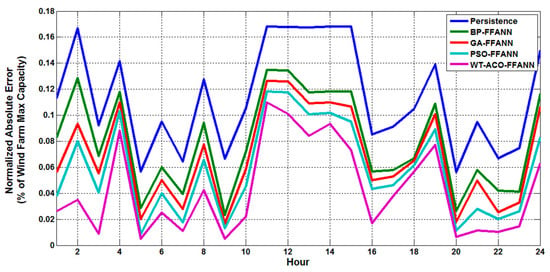
Figure 13.
Hourly absolute errors for a fall day (11 October 2016).
Beyond the MAPE and the NMAE criteria, the invariability of WPP results is a key indicator of the prediction performance of WPP methods. Table 6 provides the comparison of the devised dual-step WT-ACO-FFANN WPP method and the other four methods with respect to the variance of the forecast error.

Table 6.
Comparison of forecast error variance by various WPP methods.
As presented in Table 6, the average variance of the forecast error achieved by the devised WT-ACO-FFANN WPP method is the smallest one, revealing the lowest variability of forecasts. The devised method’s average error variance improvements over the other four methods are 75.44%, 57.58%, 39.13%, and 30%, respectively.
The FS is also a key index for performance comparison among various WPP methods. It indicates the merit of a WPP technique by evaluating its accuracy values with reference to a persistence prediction. Table 7 gives the comparison of the devised WT-ACO-FFANN WPP method and the other four methods regarding the FS index.

Table 7.
Comparison of forecast skill (FS) results (%) by various WPP methods.
As given in Table 7, the devised WT-ACO-FFANN WPP method achieves an improved FS for all the test days. This further verifies the enhanced quality of the WPP method devised in this paper.
For a broader performance comparison of the various WPP methods evaluated in this paper, the values of the accuracy criteria for the complete testing year (2016) are provided hereafter, in Table 8.

Table 8.
Comparison of MAPE results (%) by various WPP methods for complete one-year (2016) testing dataset.
As verified by the annual MAPE results in Table 8, the MAPE values are almost similar (even better in some of the months) to the values obtained for the individual testing days in the respective seasons, which shows the consistency and the robust prediction performance of the devised WPP technique in this work. Above all, the devised technique gives an improved annual MAPE over the other four examined methods.
In summary, the devised dual-step WT-ACO-FFANN integrated ML WPP method achieves improved 24 h-ahead wind power forecast results. It outperforms the other four evaluated WPP methods with respect to MAPE, NMAE, variance, and FS performance indicators. Moreover, the average computation time (excluding training and validation times) to generate the 24 h-ahead forecasts from the trained model is about 10 s using the neural network toolbox of MATLAB software (version R2018b) on a computer with Intel core i5-5200CPU, 2.20 GHz processor, and 4 GB random access memory (RAM). Thus, the devised method is new and effective for a 24 h-ahead WPP.
7. Conclusions
In this work, a new dual-step integrated machine learning method is devised for 24 h-ahead wind power forecasting using wind power generation actual measurements and weather forecast datasets. The devised technique is based on the hybridization of WT, ACO, and FFANN. The fundamental prediction engine is the FFANN. The WT is employed to extract the healthy and the important elements of the wind power raw data for improved forecast. The ACO algorithm is employed to find the best (optimal) values of the FFANN weight parameters for better forecast accuracy. The devised prediction method comprises two successive steps. In the first step, the ACO-FFANN is developed to estimate wind speed at the generation system spot and the hub elevation. In this step, historical weather variables as inputs and wind speed actual observation as the target are utilized to train the FFANN using the ACO parameter optimization process. In the second step, the WT-ACO-FFANN is implemented to fit the wind speed actual measurement with the wind power actual measurement. Later, the future speed by the ACO-FFANN in the initial step is given to the modeled WT-ACO-FFANN in the second step to predict the future wind generation subseries. The final generation power forecast is then produced by applying the inverse WT on the obtained subseries data. Two-year (2014–2015) historical weather data and wind speed and power actual measurement data are utilized to develop the forecaster. The developed forecaster performance is tested using one-year (2016) out-of-sample data. The devised method can be retrained when new training datasets exist in a rolling way. The application of the devised technique for 24 h-ahead wind power prediction is new and effective and achieves improved accuracy values. The daily mean MAPE, NMAE, and FS values achieved by the devised method are 4.67%, 0.82%, and 56.22%, respectively. The devised method’s mean MAPE improvements over the other four methods (persistence, dual-step BP-FFANN, dual-step GA-FFANN, and dual-step PSO-FFANN) are 58.89%, 38.95%, 31.82%, and 22.30%, respectively. The devised method’s average error variance improvements over the other four methods are 75.44%, 57.58%, 39.13%, and 30%, respectively. The devised method outperforms the other four evaluated methods, and the 24 h-ahead forecast execution time is shorter than 10 s. Therefore, the demonstrated experimental outcomes verify the effectiveness of the devised method for 24 h-ahead wind generation forecast. The obtained short-term wind power forecast results can be used as input information for energy management systems, demand response control, scheduling centers, dispatching centers, and other operational control units of a power system or a smart grid containing high penetration of wind power generation.
Author Contributions
Y.-J.M. and M.-Y.Z. gathered the prediction model input dataset, examined the dataset, and proposed and implemented the prediction algorithm.
Funding
This research was funded by the National Natural Science Foundation Project of China, 61473094.
Acknowledgments
The School of Elect. Info. Eng. of Guangdong University of Petrochemical Technology, China supported this work financially and technically.
Conflicts of Interest
The authors state no conflict of interest.
Nomenclature
| AI | Artificial Intelligence |
| ANFIS | Adaptive neuro fuzzy inference system |
| ANN | Artificial Neural Network |
| ACO | Ant colony optimization |
| BP | Back Propagation |
| CST | China standard time |
| CPU | Central processing unit |
| C-WT | Continuous wavelet transform |
| Db | Daubechies |
| DL | Deep learning |
| D-WT | Discrete wavelet transform |
| FFANN | Feedforward Artificial Neural Network |
| FS | Forecast skill |
| GA | Genetic algorithm |
| GB | Gigabyte |
| GHz | Gigahertz |
| GMT | Greenwich Mean Time |
| HHT | Hilbert-Huang transform |
| kW | kilowatts |
| MAPE | Mean absolute percentage error |
| ML | Machine learning |
| MSE | Mean squared error |
| RMSE | Mean squared error |
| NMAE | Normalized mean absolute error |
| NWP | Numerical weather prediction |
| PSO | Particle swarm optimization |
| RAM | Random access memory |
| RMSE | Root mean squared error |
| RES | Renewable energy source |
| s | Second |
| SCADA | Supervisory control and data acquisition |
| UTC | Coordinated universal time |
| UN | United Nation |
| WPP | Wind power prediction |
| WRF | Weather Research and Forecast |
| WT | Wavelet transform |
Appendix A
Devised dual-step integrated ML Algorithm A1 for WPP.
| Algorithm A1. The Devised WPP Approach |
|
References
- Jeremie, J.; Nils, S.; George, N.K. Probabilistic short-term wind power forecasting for the optimal management of wind generation. IEEE Lausanne Power Tech. 2007, 15, 683–688. [Google Scholar]
- Alexandre, C.; Antonio, C.; Jorge, N.; Gil, L.; Henrik, M.; Everaldo, F. A review on the young history of the wind power short-term prediction. Renew. Sustain. Energy Rev. 2008, 12, 1725–1744. [Google Scholar]
- Ma, L.; Luan, S.; Jiang, C.; Liu, H.; Zhang, Y. A review on the forecasting of wind speed and generated power. Renew. Sustain. Energy Rev. 2009, 13, 915–920. [Google Scholar]
- Landberg, L. Short-term prediction of the power production from wind farms. J. Wind Eng. Ind. Aerodyn. 1999, 80, 207–220. [Google Scholar] [CrossRef]
- Damousis, I.G.; Alexiadis, M.C.; Theocharis, J.B.; Dokopoulos, P.S. A fuzzy model for wind speed prediction and power generation in wind parks using spatial correlation. IEEE Trans. Energy Convers. 2004, 19, 352–361. [Google Scholar] [CrossRef]
- Barbounis, T.G.; Theocharis, J.B. A locally recurrent fuzzy neural network with application to the wind speed prediction using spatial correlation. Neurocomputing 2007, 70, 1525–1542. [Google Scholar] [CrossRef]
- Tesfaye, A.; Zhang, J.H.; Zheng, D.H.; Shiferaw, D. Short-Term Wind Power Forecasting Using Artificial Neural Networks for Resource Scheduling in Microgrids. Int. J. Sci. Eng. Appl. 2016, 5. [Google Scholar] [CrossRef]
- Palomares-Salas, J.C.; De La Rosa, J.J.G.; Ramiro, J.G.; Melgar, J.; Aguera, A.; Moreno, A. ARIMA vs. Neural networks for wind speed forecasting. In Proceedings of the 2009 IEEE International Conference on Computational Intelligence for Measurement Systems and Applications, Hong Kong, China, 11–13 May 2009; pp. 129–133. [Google Scholar]
- Li, S.; Wunsch, D.C.; O’Hair, E.A.; Giesselmann, M.G. Using neural networks to estimate wind turbine power generation. IEEE Trans. Energy Convers. 2001, 16, 276–282. [Google Scholar]
- Blonbou, R. Very short-term wind power forecasting with neural networks and adaptive Bayesian learning. Renew. Energy 2011, 36, 1118–1124. [Google Scholar] [CrossRef]
- Catalao, J.P.S.; Pousinho, H.M.I.; Mendes, V.M.F. Short-term wind power forecasting in Portugal by neural networks and wavelet transform. Renew. Energy 2011, 36, 1245–1251. [Google Scholar] [CrossRef]
- Sideratos, G.; Hatziargyriou, N. Using radial basis neural networks to estimate wind power production. In Proceedings of the 2007 IEEE Power Engineering Society General Meeting, Tampa, FL, USA, 24–28 June 2007; pp. 1–7. [Google Scholar]
- Louka, P.; Galanis, G.; Siebert, N.; Kariniotakis, G.; Katsafados, P.; Pytharoulis, I.; Kallos, G. Improvements in wind speed forecasts for wind power prediction purposes using Kalman filtering. J. Wind Eng. Indust. Aerodyn. 2008, 96, 2348–2362. [Google Scholar] [CrossRef]
- Du, Y.; Lu, J.P.; Li, Q.; Deng, Y.L. Short-term wind speed forecasting of wind farm based on least square-support vector machine. Power Syst. Technol. 2008, 32, 62–66. [Google Scholar]
- Pousinho, H.M.I.; Mendes, V.M.F.; Catalão, J.P.S. Neuro-Fuzzy Approach to Forecast Wind Power in Portugal. In Proceedings of the International Conference on Renewable Energies and Power Qualit (ICREPQ’10), Granada, Spain, 23–25 March 2010. [Google Scholar]
- Zheng, D.; Eseye, A.T.; Zhang, J.; Li, H. Short-term Wind Power Forecasting Using a Double-stage Hierarchical ANFIS Approach for Energy Management in Microgrids. Prot. Control Mod. Power Syst. 2017, 2, 13. [Google Scholar] [CrossRef]
- Eseye, A.T.; Zhang, J.; Zheng, D.; Li, H.; Jingfu, G. A Double-stage Hierarchical Hybrid PSO-ANN Model for Short-term Wind Power Prediction. In Proceedings of the 2017 IEEE 2nd International Conference on Cloud Computing and Big Data Analysis (ICCCBDA), Chengdu, China, 28–30 April 2017. [Google Scholar]
- Eseye, A.T.; Zhang, J.; Zheng, D.; Ma, H.; Jingfu, G. Short-term Wind Power Forecasting Using a Double-stage Hierarchical Hybrid GA-ANN Approach. In Proceedings of the 2017 IEEE 2nd International Conference on Big Data Analysis (ICBDA), Beijing, China, 10–12 March 2017. [Google Scholar]
- Zheng, D.; Shi, M.; Wang, Y.; Eseye, A.T.; Zhang, J. Day-Ahead Wind Power Forecasting Using a Two-Stage Hybrid Modeling Approach Based on SCADA and Meteorological Information, and Evaluating the Impact of Input-Data Dependency on Forecasting Accuracy. Energies 2017, 10, 1988. [Google Scholar] [CrossRef]
- Apostolopoulos, P.A.; Tsiropoulou, E.E.; Papavassiliou, S. Demand Response Management in Smart Grid Networks: A Two-Stage Game-Theoretic Learning-Based Approach. Mob. Netw. Appl. 2018. [Google Scholar] [CrossRef]
- Chai, B.; Chen, J.; Yang, Z.; Zhang, Y. Demand Response Management with Multiple Utility Companies: A Two-Level Game Approach. IEEE Trans. Smart Grid 2014, 5, 722–731. [Google Scholar] [CrossRef]
- Sanchez, I. Short-term prediction of wind energy production. Int. J. Forecast. 2006, 22, 43–56. [Google Scholar] [CrossRef]
- Negnevitsky, M.; Johnson, P.; Santoso, S. Short term Wind Power Forecasting using hybrid intelligent systems. In Proceedings of the 2007 IEEE Power Engineering Society General Meeting, Tampa, FL, USA, 24–28 June 2007; pp. 1–4. [Google Scholar]
- Jursa, R. Wind Power Prediction with Different Artificial Intelligence Models; EWEC: Milan, Italy, 2007. [Google Scholar]
- Fan, S.; Liao, J.R.; Yokoyama, R.; Chen, L.; Lee, W.-J. Forecasting the Wind Generation Using A Two-stage Hybrid Network Based on Meteorological Information. IEEE Trans. Energy Convers. 2009, 24, 474–482. [Google Scholar] [CrossRef]
- Amjady, N.; Keynia, F. Short-term load forecasting of power systems by combination of wavelet transform and neuro-evolutionary algorithm. Energy 2009, 34, 46–57. [Google Scholar] [CrossRef]
- Reis, A.J.R.; da Silva, A.P.A. Feature extraction via multiresolution analysis for short-term load forecasting. IEEE Trans. Power Syst. 2005, 20, 189–198. [Google Scholar]
- Mallat, S. A theory for multiresolution signal decomposition—The wavelet representation. IEEE Trans. Pattern Anal. Mach. Intell. 1989, 11, 674–693. [Google Scholar] [CrossRef]
- Amjady, N.; Keynia, F. Day ahead price forecasting of electricity markets by a mixed data model and hybrid forecast method. Int. J. Electr. Power Energy Syst. 2008, 30, 533–546. [Google Scholar] [CrossRef]
- Eseye, A.T.; Zhang, J.; Zheng, D. Short-term Photovoltaic Solar Power Forecasting Using a Hybrid Wavelet-PSO-SVM Model Based on SCADA and Meteorological Information. Renew. Energy 2018, 118, 357–367. [Google Scholar] [CrossRef]
- Nicolas, M.; Frédéric, G.; Patrick, S. Artificial Ants; Wiley-ISTE: Hoboken, NJ, USA, 2010; ISBN 978-1-84821-194-0. [Google Scholar]
- Dorigo, M.; Gambardella, L.M. Learning Approach to the Traveling Salesman Problem. IEEE Trans. Evol. Comput. 1997, 1, 214. [Google Scholar] [CrossRef]
- Dorigo, M.; Birattari, M. Ant Colony Optimization; MIT Press: Cambridge, MA, USA, 2004; ISBN 0-262-04219-3. [Google Scholar]
- Lopez-Guede, J.M.; Ramos, J.A.; Zulueta, E.; Fernandez-Gamiz, U.; Azkune, G. Dual model oriented modeling of monocrystalline PV modules based on artificial neuronal networks. Int. J. Hydrog. Energy 2017, 42, 18103–18120. [Google Scholar] [CrossRef]
- Lopez-Guede, J.M.; Ramos, J.A.; Zulueta, E.; Fernandez-Gamiz, U.; Oterino, F. Systematic modeling of photovoltaic modules based on artificial neural networks. Int. J. Hydrog. Energy 2016, 41, 12672–12687. [Google Scholar] [CrossRef]
- Coimbra, C.; Kleissl, J.; Marquez, R. Overview of solar forecasting methods and a metric for accuracy evaluation. In Solar Resource Assessment and Forecasting; Kleissl, J., Ed.; Elsevier: Waltham, MA, USA, 2013. [Google Scholar]
© 2019 by the authors. Licensee MDPI, Basel, Switzerland. This article is an open access article distributed under the terms and conditions of the Creative Commons Attribution (CC BY) license (http://creativecommons.org/licenses/by/4.0/).