Article

The Impact of Demand Response Programs on Reducing the Emissions and Cost of A Neighborhood Home Microgrid

by
Mohammad Hossein Fouladfar
1,
Abdolah Loni
2,
Mahsa Bagheri Tookanlou
2,
Mousa Marzband
2,
Radu Godina
3,
Ameena Al-Sumaiti
4 and
Edris Pouresmaeil
5,*
1
Department of Electrical Engineering, Science and Research of Bushehr Branch, Islamic Azad University, 75461 Bushehr, Iran
2
Department of Maths, Physics and Electrical Engineering, Faculty of Engineering and Environment, Northumbria University Newcastle, Newcastle upon Tyne NE1 8ST, UK
3
UNIDEMI, Department of Mechanical and Industrial Engineering, Faculty of Science and Technology (FCT), Universidade NOVA de Lisboa, 2829-516 Caparica, Portugal
4
Department of Electrical and Computer Engineering, Khalifa University, 51133 Abu Dhabi, UAE
5
Department of Electrical Engineering and Automation, Aalto University, 02150 Espoo, Finland
*
Author to whom correspondence should be addressed.
Appl. Sci. 2019, 9(10), 2097; https://doi.org/10.3390/app9102097
Submission received: 25 February 2019 / Revised: 13 May 2019 / Accepted: 15 May 2019 / Published: 21 May 2019
(This article belongs to the Special Issue Sustainable Energy Systems: Optimization and Efficiency)

Abstract

:
The desire to increase energy efficiency and reliability of power grids, along with the need for reducing carbon emissions has led to increasing the utilization of Home Micro-grids (H-MGs). In this context, the issue of economic emission dispatch is worthy of consideration, with a view to controlling generation costs and reducing environmental pollution. This paper presents a multi-objective energy management system, with a structure based on demand response (DR) and dynamic pricing (DP). The proposed energy management system (EMS), in addition to decreasing the market clearing price (MCP) and increasing producer profits, has focused on reducing the level of generation units emissions, as well as enhancing utilization of renewable energy units through the DR programs. As a consequence of the nonlinear and discrete nature of the H-MGs, metaheuristic algorithms are applied to find the best possible solution. Moreover, due to the presence of generation units, the Taguchi orthogonal array testing (TOAT) method has been utilized to investigate the uncertainty regarding generation units. In the problem being considered, each H-MG interacts with each other and can negotiate based on their own strategies (reduction of cost or pollution). The obtained results indicate the efficiency of the proposed algorithm, a decrease in emissions and an increase in the profit achieved by each H-MG, by 37% and 10%, respectively.

1. Introduction

In recent years, along with the growth of global demand for electricity, concerns over the growing levels of air pollution and greenhouse gases, and, consequently, the causal link to health issues and global warming have increased considerably. Such concerns resulting from international agreements, such as the Paris Climate Accord of 2016, have led to the promotion and rapid growth in the use of renewable energy devices, especially in the electricity sector. This growth has benefited from the improvement of cost-oriented competitiveness of innovative technologies, groundbreaking, committed policies and better access to financing sources. In addition, issues around energy security, environmental concerns, and an increase of energy demand in developing countries and emerging economies, as well as the need for access to new energies, have also played a part in growing the sector [1,2,3]. To this end, it is vital to design a comprehensive model to reduce the costs regarding consumers and producers, as well as lessening the greenhouse gases emission. In fact, an appropriate demand response (DR) model as the most cost-effective and reliable solution can simultaneously reduce the total costs and air pollution, by changing the customers’ power consumption and increasing the participation of renewable resources in H-MGs energy consumption. The DR programs are mainly divided into two distinct categories:
  • Time-based programs are generally utilized to usage over broad blocks of hours. Time-base programs methodologies include Time of Use (TOU), Real-time Pricing (RTP), Critical Peak Pricing (CPP), Critical Peak Rebates (CPR), etc.
  • Incentive-based programs encourage the consumers to alter their energy consumption by proposing the incentives programs offered by the energy provider. The methods include Direct Load Control (DLC), Interruptible/curtail able service (I/C), Emergency Demand Response Program (EDRP), Ancillary Service Markets (A/S), etc.
In the following, a brief overview of literature, and then the flaws of existing solutions and the value proposition of the proposed model are described.
H-MGs, based on renewable technologies, include distributed energy resources, renewable sources, and ES system; the latter can work in two interconnected or detached modes [4,5,6]. Combining H-MGs together to create a local structure allows each H-MG to form a coalition and thereby share the power demand and supply in a co-ordinated manner [7,8,9,10]. This coalition will increase the productivity of renewable equipment along with load response, reliability and, most importantly, energy independence, all of which ultimately reduce the production of pollutants derived from generation units based on fossil fuels [11]. Although electrical energy management strategies with distributed energy resources and ES system at the H-MG level have been extensively studied, there are few studies about neighboring and the local interactions. In [12,13,14,15], the authors proposed a novel approach regarding local energy interactions for the distribution system in which prosumers are persuaded by different balancing premiums to balance their electricity in a local community. Price-responsive generation and demand of an individual prosumer are affected by his/her attitudes and inherent characteristics. In [16,17], EMS based on distributed energy resource is considered, however there is no energy exchange between H-MGs, and consumers of any H-MG are not able to access the sources of other H-MGs. In the present study, H-MGs can share their electrical/thermal power surplus/shortage with other H-MGs, thereby allowing the exchange of power. Each of the H-MGs that have surplus power can display the amount of power along with the price it is willing to accept, offering it for sale among other market players in load energy market. Alternatively, each H-MG that is experiencing a lack of power can make the other players in the load energy market aware of the amount of power required along with the price that it is willing to pay. Finally, according to the bids offered by each of the market players, the exchange takes place. Along with attention to generation, the demand side needs to be considered. DR attempts to achieve a balance between generation and consumption by limiting selection of the loads on the system to which power is provided [18,19,20]. It plays a significant role in the effective shift of loads having a certain performance. Due to insufficient attention to DR in residential buildings, M. Pipattanasomporn and Rahman [21] focused on using DR in residential sectors. This paper, while demonstrating DR’s effectiveness in controlling and managing the performance of electrical appliances, has shown that DR is a function of the level of comfort and convenience experienced by subscribers. In addition, S. Althaher and Member [22], while indicating the impact of DR on reducing subscriber costs, could prevent the emergence of new peak pricing. Moreover, this work considers a local structure combined with controllable consumers, and attempts to reduce peak demand by the DR strategy. However, it does not provide any solution for calculating the MCP [23,24]. Although the DP scheme applied in [25] has managed to maximize the profit of existing agents, such as consumers, by PSO algorithm, the issue of emission reduction has not been investigated. Moreover, the conducted research in [26] shows that utilizing an appropriate DR with a Nash–Stackelberg game approach have led to reaching more utilities for end-users/consumers. In [27,28], a multi-agent system has been presented to evaluate optimal residential DR implementation in a distribution network, in which the main stakeholders including electric vehicles, homes owners, household appliances, and power market are modeled by heterogeneous home agents and a retailer agent. However, the multi-carrier energy system and pollution have not been modeled in this paper. In [28,29,30], a novel home energy management system and a sustainable day-ahead scheduling are presented that enable the residential customers to execute demand response programs autonomously. It eventually leads to reaching an acceptable level of consumers’ power consumption and H-MGs costs reduction. In [31,32], the authors recommended the use of incentive-based payments as price offer packages to implement DR programs. Results of the simulation have considered in three different cases for the optimization of operational costs and total emissions of micro-grid without the involvement of DR. In [33,34,35], an optimization strategy for the economic operation of a micro-grid considering DR programs in different scenarios is presented, and it is intended for the aim of minimizing the operating cost of the micro-grid and maximizing the efficiency of renewable energy utilization. In addition, a multi-time electricity price response model based on user behavior and satisfaction is established, and the core value of the model ia to describe the mechanism and effect of participation in electricity price demand response. In [36,37], the applied DR in a multi-carrier energy system (thermal and electrical) leads to decreasing the emission, but the parameters of MCP and DP are in considered in the model. In addition, in [38,39,40], respectively, a DR solution to economic operation issues of grid-connected micro-grid and optimal renewable planning model in conjunction with DR are presented.
To summarize, the following shortcomings can be identified in the existing literature related to the DR schemes including DRP, DRE, and DRPE in the neighborhood H-MG.
  • There is no framework for exchanging power between H-MGs in [16,17].
  • At times when H-MGs have a power shortage, the conditions for purchasing energy from other H-MGs having power surplus are not available [16,17].
  • No MCP calculation based on the retail electricity pricing and market bids are presented in [22,23,31,32,33,36].
  • The examination of DR’s impact on pollution resulting from generation units and full capabilities of distributed energy resources has not been performed [7,8,9,10,18,19,20,21,25,26,27,29,30,37].
  • No mathematical modeling of DR schemes based on DRE, DRP, and DRPE in an efficient manner, simultaneously, has been implemented [7,8,9,10,18,19,20,21,22,26].
  • No simultaneous optimization of a multi-carrier energy system including thermal and electrical energies is used [13,14,27,29,30,31,32,33,34,38,39].
In this paper, an EMS has been proposed based on pollution and cost reduction of neighborhood H-MGs. In the proposed algorithm, each H-MG can form a coalition with each other and cooperatively exchange power. Depending on the objective functions of each H-MG, they can share their power and price with other players on the market, based on their DP strategies. The presence of ES and Electric Vehicle (EV), while enhancing reliability, allows the H-MGs to have a significant impact on emission reduction, in addition to maintaining their independence. EMS has tried to achieve its goals by means of a DR strategy applied at three levels: DRP, DRE and, DRPE. It should be noted that the DR schemes applied in this paper belong to the time-based programs.
The major contributions of this paper can be summarized as follows:
  • It provides a comprehensive and flexible DR strategies based on price, emission, and price-emission. By DRP, DRE, and DRPE, the H-MGs’ owners are able to choose dynamically the most appropriate DR programs based on their appliances situations.
  • It proposes a multi-objective EMS based on optimization methods and DR strategy to enhance energy independence, decrease air pollution and costs for subscribers, as well as gaining more productivity of non-dispatchable units.
  • It provides a solution to achieve the collective consumers’ payoffs, despite the presence of players with different levels of ownership and goals.
The remainder of this paper is organized as follows: In Section 2, we briefly describe the general idea. In this section, the network under study and the primary assumptions are specified. Then, in Section 3, the structure of the proposed algorithm is presented. In Section 4, the mathematical formulation of problem is introduced. Finally, in Section 5, the results obtained from the proposed approach are shown, and conclusions are given.

2. Description of General Idea

As shown in Figure 1, the case study is a neighborhood grid consisting of several H-MGs, and each H-MG comprises non-responsive load and Distributed Energy Resources (DERs) including responsive load demand, Energy Storage (ES), dispatchable unit, and non-dispatchable unit. Each H-MG must first respond to its loads according to the non-dispatchable units output, and, ultimately, if it has a deficit in electrical/thermal power, it will be compensated by obtaining power from other H-MGs or vendors. On the other hand, if it has an excess in power generation, the H-MG sells the surplus to other H-MGs or purchasers. Therefore, each player must make a comparison between the prices offered by other H-MGs and retailers to select the optimal price offer for this competition. Producers and consumers have their own goals, buying and selling, accordingly. Therefore, each manufacturer is seeking to raise its profits by selling the highest amount of power produced to other H-MGs and retailers. On the other hand, each consumer tries to buy low-cost products to reduce their own outlay. Furthermore, since ER is the main objective of the strategies being presented in this paper, each H-MG should, if faced with a lack of power generation, firstly detect its deficiency through the ES, and then determine whether the existing dispatchable units violate the pollution indicators. Finally, it should solve the problem of power shortage according to the DR constraints and through the use of dispatchable units. Ultimately, power shortage will be mitigated by purchasing from other H-MGs and retailers. To meet the ER objective function, each of the H-MGs that are lacking in power should first provide their own deficiency from surplus generation of other H-MGs.

3. The Structure of Proposed Algorithm

In this paper, a multi-objective EMS based on optimization methods and DR strategy is proposed to enhance energy independence, decrease air pollution and costs for subscribers while improving their comfort and convenience, and gain more productivity of non-dispatchable units. As shown in Figure 2, the proposed structure consists of TOAT units to estimate the uncertainty regarding input data including solar irradiation, system sell price, system buy price, and MCP. The structure of EMS-DR is multi-level and therefore it is possible to find optimal points for satisfying the objective function of the problem using meta-heuristic algorithms including BAT [41], DE [42], and PSO [43]. With its DR strategy applied at different levels, EMS has focused on ER and lowered consumer spending. The purpose of this paper is not to evaluate the methods of comparative optimization, but to implement different optimization methods to identify the comparative strengths and weaknesses of the approaches. In addition, depending on the benefits and detriments of each of these techniques, optimization methods may be identified. In other words, in this paper, rather than proposing a completely new method, the author’s aim is to show that, for different criteria and taking into account a specific objective function for each of the players, users of the proposed structure can make the correct decision in choosing a method.

3.1. EMS-DR Unit

Creating a balance between supply and demand, dropping the courier and reducing the costs by shifting the power from the expensive periods to cheaper periods, are some of the most important effects of DR that the proposed EMS has been able to take advantage of. In this paper, it is assumed that the consumers and H-MGs have already agreed on a short/long-term contract with an energy provider or utility grid, therefore any discussion revolving around the contracts and intellectual property is beyond the scope of this paper. In addition, in this paper, it is not directly investigated the discussion of DR schemes benefits for the consumer, however, it emphasizes the positive impact of DR programs on decreasing H-MG emissions and increasing H-MGs profits derived from following the DR schemes. Prior to explaining each DR program, it should be mentioned that each DR scheme including EMS-DRP, EMS-DRE, and EMS-DRPE are applied just for an H-MG throughout the paper. Demand response based on price (EMS-DRP), demand response based on emission (EMS-DRE), and demand response based on emission and price (EMS-DRPE) are used for H-MG#A, H-MG#B, and H-MG#C, respectively. The proposed EMS algorithm has used DR at three levels, described as follows:
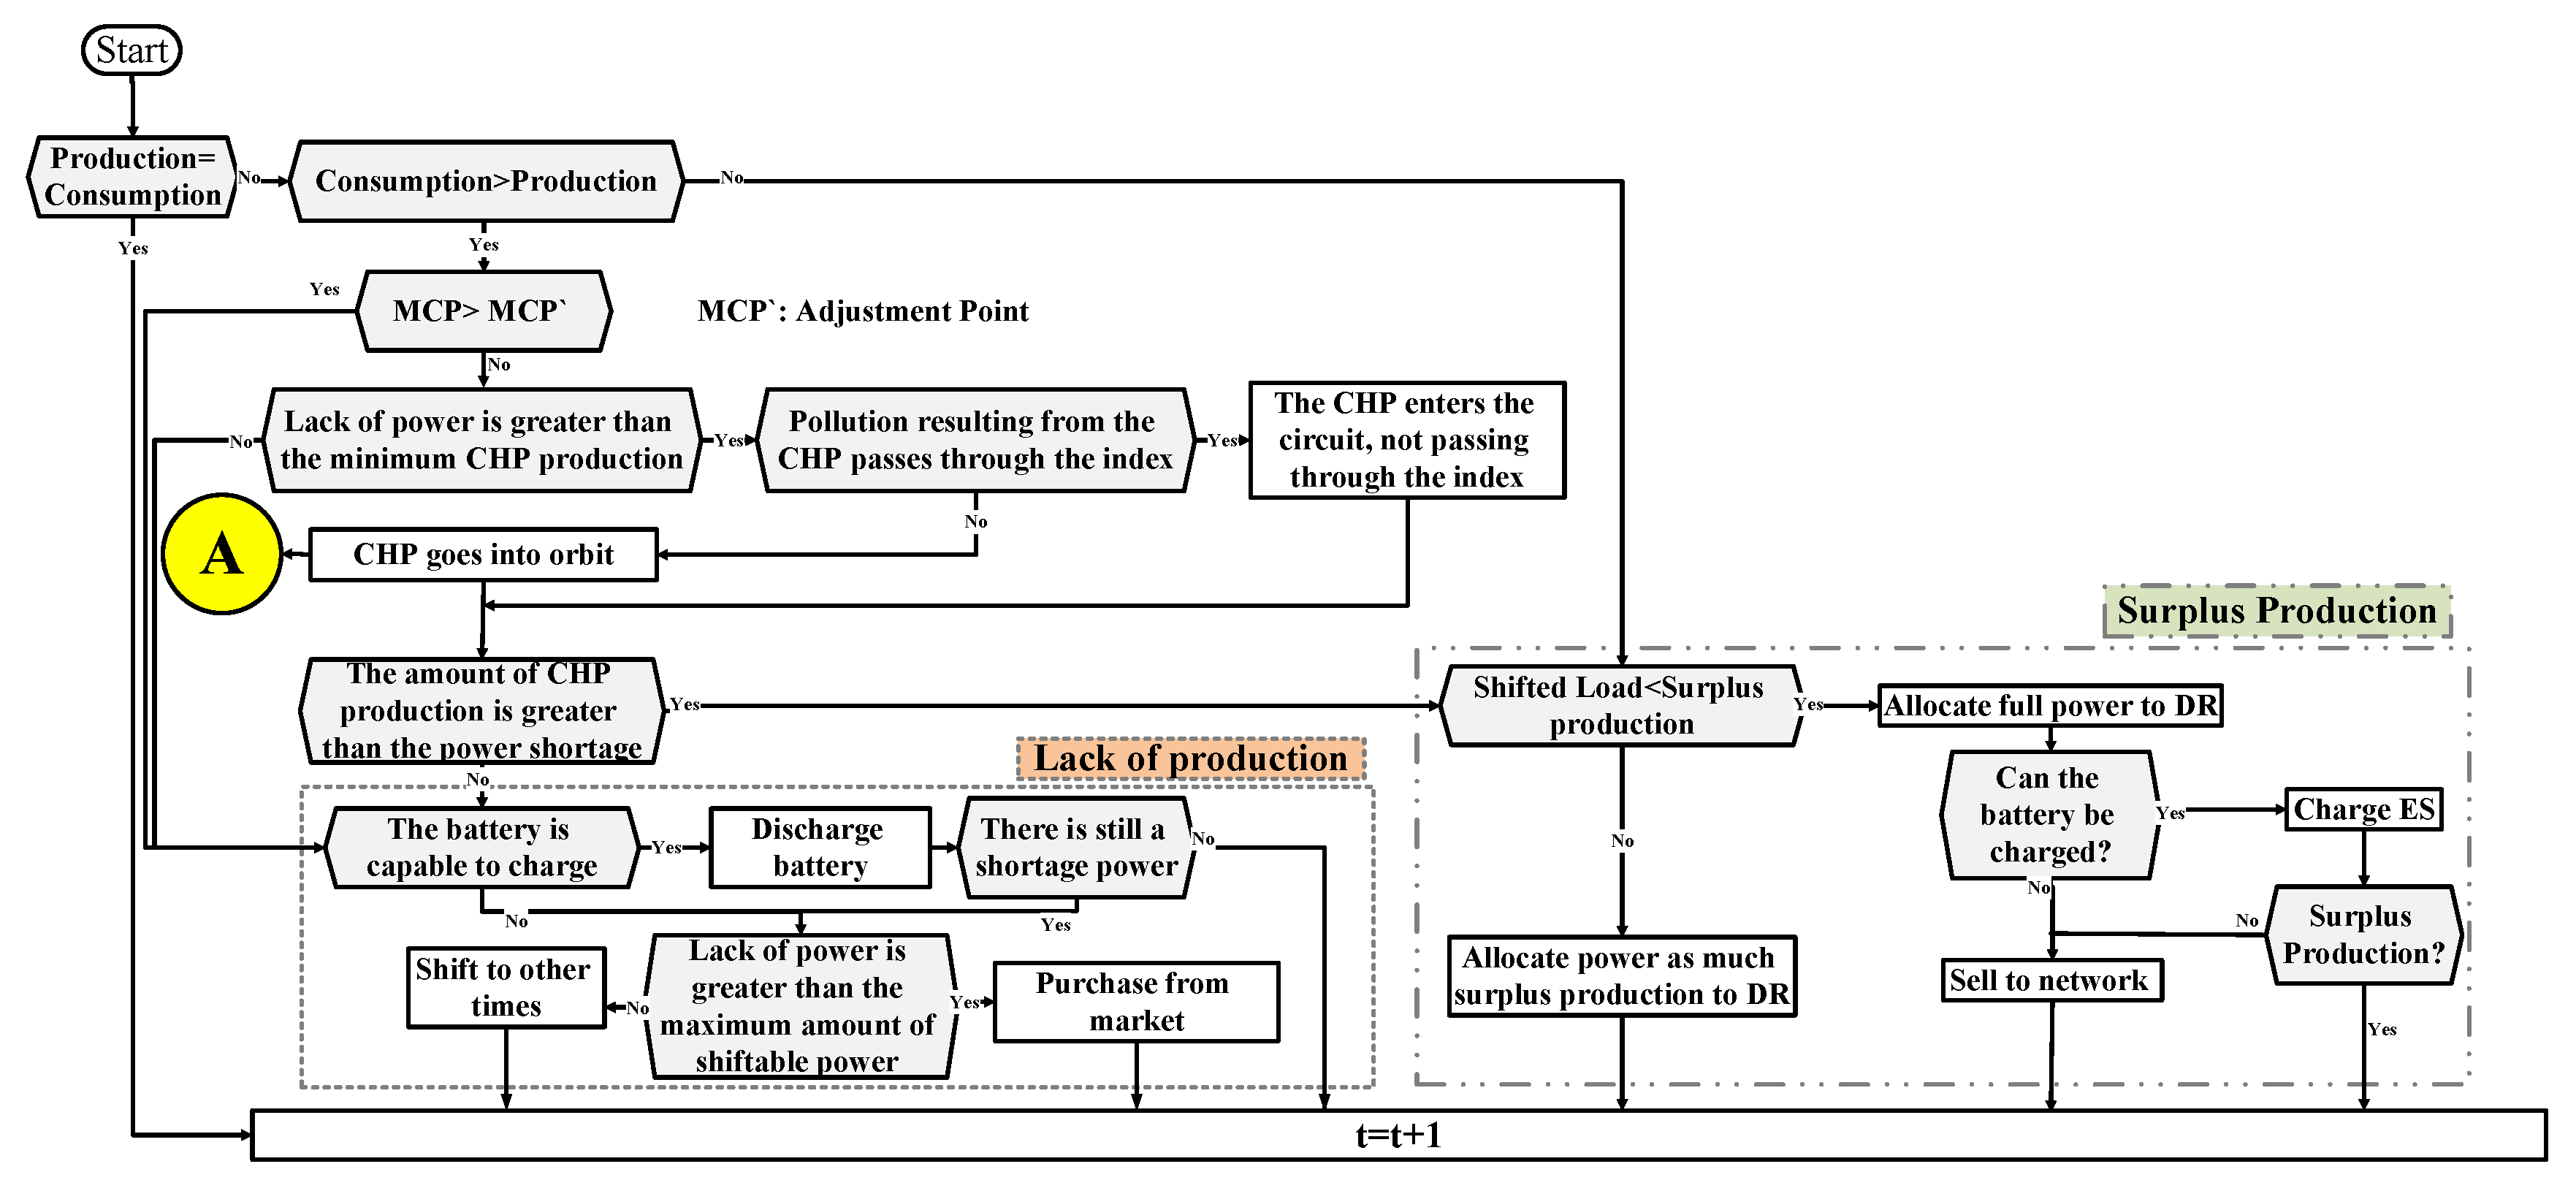
  • EMS-DRP: At this level of EMS, cost reduction has been considered through the power demand shift. According to Figure 3, each H-MG must first respond to its power demand through embedded non-dispatchable units. If power demand is lower than power generation by non-dispatchable units and the power shortage is higher than the minimum CHP generation, then CHP goes into orbit. Two things happen in this case: (i) due to CHP, the power shortage will be lost and a surplus of power generation will occur; or (ii) the shortage of generation will continue to be less intense. If there is still a shortage of generation, ES will be discharged according to ES capacity and constraints. If there is still a problem with power dissipation in the ES, then according to the DR constraints, power shortages are shifted to other time when the cost of power is cheaper. It should be noted that the EMS only can shift a certain amount of power to future periods, otherwise it would have to generate a power loss through load energy market. In this case, the purchase priority is with other H-MG neighbors, followed by the retailer, due to the fact that H-MGs are able to accrue the profit whilst the lack of purchasing from retailers also reduces the pollution caused by traditional electricity generation systems.
    With these interpretations, if the CHP enters the circuit and the power generation surplus occurs, the EMS can charge ES according to the constraints of the issue, and respond to the DR whilst selling its excess power in load energy market, which is the priority of purchasing with Other H-MGs and then retailers. For this purpose, H-MGs should position their pre-bid price at a level that is lower than the retailers offer. Flowcharts of the electrical sections are shown in Figure 3a. As depicted in Figure 3b, DR is not considered in the thermal sector. In the thermal sector, in the first place, TSP and CHP have an obligation to respond to the thermal loads. If there is a lack of thermal power, since there is no emission constraint on H-MG #A, then GB enters the circuit and responds to loads.
  • EMS-DRE: In this section, EMS has focused its efforts on reducing pollution using DR. Emax is introduced as a pollution indicator. In more detail, let Y be a finite set of random variable regarding the pollution of a large-scale power network (Emission of Electricity Consumption in UK Power System [44]) with finite outcomes y 1 , y 2 , , y n . Hence, Emax equals E [ Y ] representing the expected value of Y. As shown in Figure 4a, if the need for using CHP arises, it must first be checked that the amount of power shortage is higher than the minimum CHP generation power, and then check whether the CHP inflow circuit exceeds the Emax pollution index. If it passes through Emax, the algorithm allows benefiting the CHP only to the extent that it does not violate Emax. Considering this important constraint, and with the entrance of CHP to the orbits, the reduction of the power shortage or surplus of power generation occurs, with the algorithm continuing to function as in the previous section. In the thermal sector, although DR is not taken into account, considering that the DR applied in H-MG #B tries to reduce pollution, and with making the use of GB, the pollution will increase, therefore GB enters the circuit with limitations. As shown in Figure 4b, GB can only generate thermal power just insofar as it does not exceed the Emax index.
  • EMS-DRPE: In this section, the proposed algorithm controls both price and pollution using DR. For this purpose, the “adjustment point” is considered for the price of power to serve as an indicator of demand shifts. At each time interval, the MCP value, with due consideration given to uncertainty, is first examined. If the MCP value is higher compared to the adjustment point, and provided the ES has a discharge capability, it discharges the ES algorithm. Furthermore, if there is still a power shortage, it will transfer part of the load according to the defined constraints in proportion to the generation state of the non-dispatchable units and loads. However, if the MCP value is small, and the power shortage is greater than the minimum CHP generation, the algorithm will measure the pollution condition in proportion to Emax. If the amount of pollution resulting from the entrance of CHP to the circuit is less than Emax, an excess in power generation or reduction of power shortage occurs, in accordance with the situation, as in the previous sections of the algorithm. It should be noted that, if, as a result of the entrance of CHP to circuit, the pollution breaks out of Emax, an algorithm that is less than or equal to Emax will allow CHP to operate. Figure 5 shows the EMS-DRPE electric flow chart section. It should be remarked that the thermal section of H-MG #C is quite similar to the H-MG #B.

3.2. MCP Unit

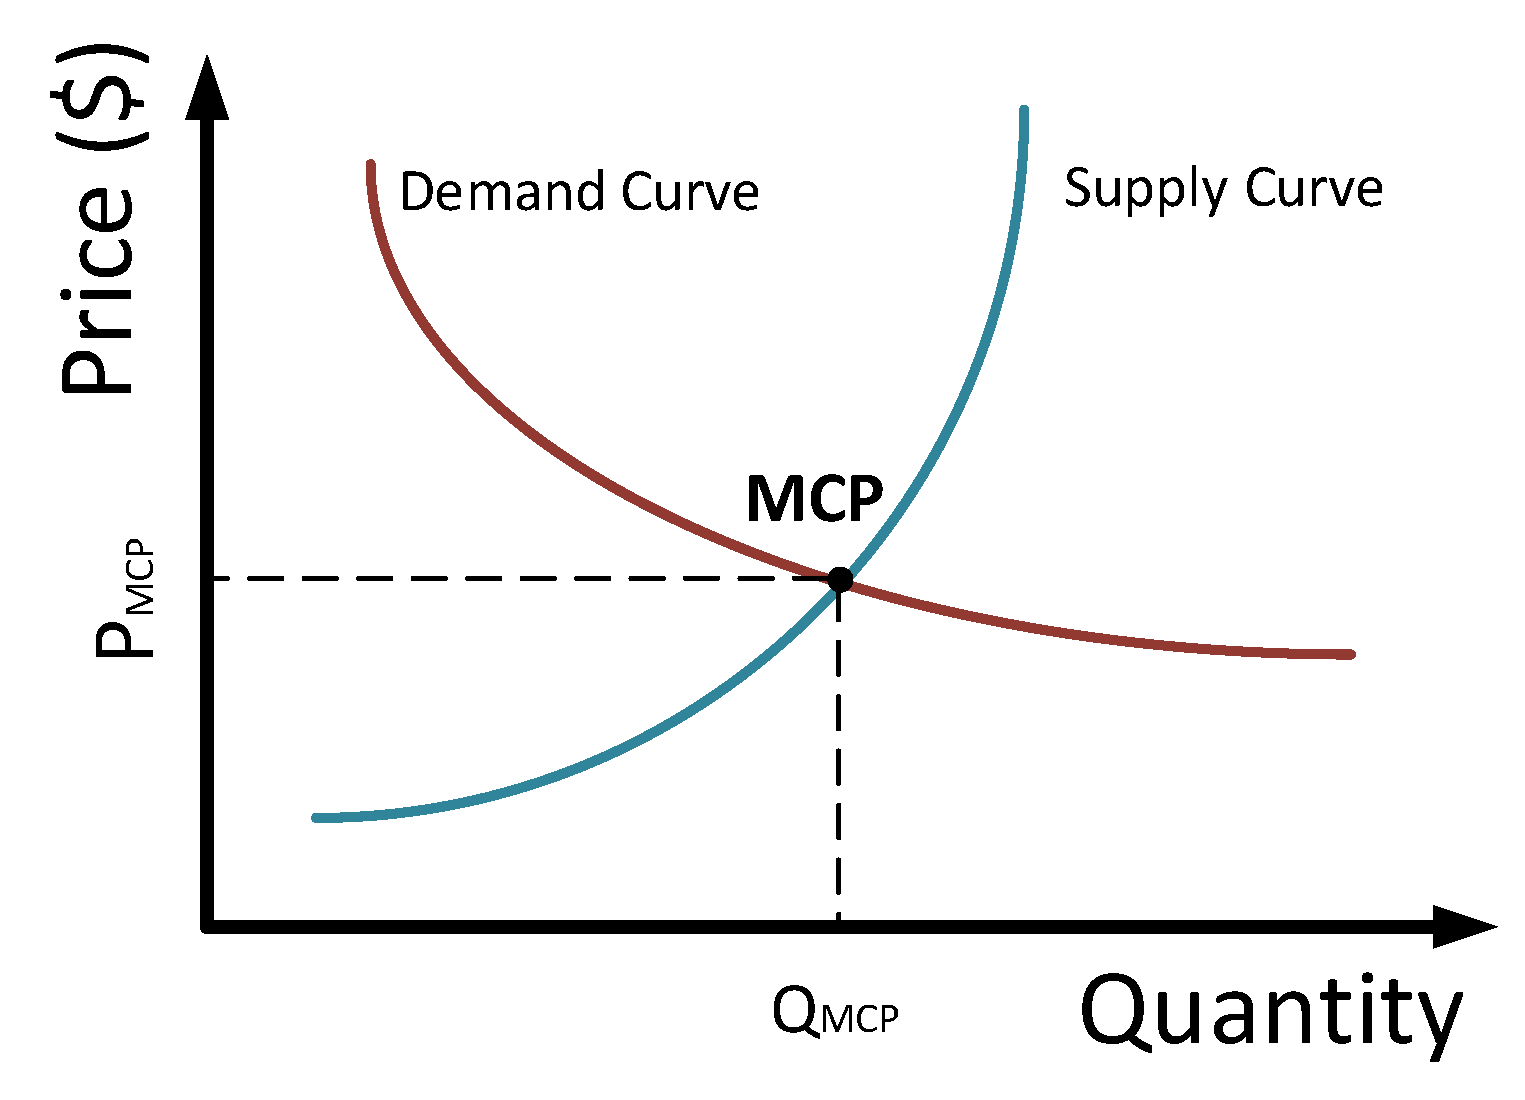
In this unit, information about electrical/thermal power and price offers for each of them is extracted by the DP strategy. DP enables the optimum price point to be obtained. As shown in Figure 6, supply and demand curves of a good intersect at one point, which is an optimal MCP point. In this paper, the predicted MCP is extracted from [45,46].

3.3. Taguchi Orthogonal Array Testing (TOAT) Unit

Due to the availability of renewable energy, H-MGs will reduce air pollution, in addition to power demanded from the grid. However, the inherent uncertain nature of these devices is a major challenge. Since sunlight is not permanently available and depends on the atmospheric conditions, it is very difficult to predict exactly how much power a H-MG produces. On the other hand, sudden changes in power demand overnight are also associated with uncertainty. In this paper, the problem of uncertainty has been investigated using TOAT. The high speed of the calculation is unique to the TOAT. Detailed descriptions of how the operation and uncertainty calculations are formulated are outside the scope of this paper, and the reader is referred to the following sources for further information [47].

4. Mathematical Implementation of the Problem

In this section, the problem formulation is presented by the key factors in market structure based on transitional energy. This framework is simply extensible to other distribution systems with high levels of customer participation.

4.1. Objective Functions of the Participants in MO-TE

The defined objective functions are based on maximizing H-MGs’ and retailers’ profits and minimizing the consumers costs and pollution. In more details, there are five objective functions as a multi-objective problem concerning total profit of Micro-grid (Equation (1)), profit of retailer (Equation (2)), the costs of H-MGs as Equation (3), the pollution function as Equation (4), and, finally, the costs of emitting the pollution as Equation (5), which is derived from consuming the thermal power.
M a x h n i j ( U h , e , j n + U h , e , n E S d + U h , h t , i n + U h , h t , n T E S d C O h , h t , i n C O t , h , n T E S c h C O h , e , n E S c h C O h , e , j n ) × Δ h
M a x h n U h , e , n R e t d C O h , e , n R e t c h × Δ h
M i n h n k c C O h , h t , n k + C O h , e , n c × Δ h
M i n h n i E h , n i R e t + E h , n i C H P + E h , n i G B × Δ h
M i n h n i C O h , E , i R e t + C O h , E , i C H P + C O h , F , i C H P + C O h , E , i G B + C O h , F , i G B × Δ h
where U h , e j , n , U h , h t i , n , respectively, are the electrical and thermal utility/income caused by distributed energy resources j and i in H-MG n. Moreover, U h , e E S d , i , U h , h t T E S d , i , respectively, are the income resulting from electrical and thermal discharges of ES and Thermal Energy Storage (TES) regarding H-MG n at time h. U t , e R e t d , i , C O t , e R e t c h , i , respectively, are income/cost caused by selling/purchasing the electricity from/to retailer in H-MG n. In addition, C O h , h k , n , C O h , e c , n are, respectively, electricity costs concerned to k and c consumer in H-MG n. In addition, E h , n i indicates the pollution caused by retailers and CHP and GB. C O h , F , C O h , n i , respectively, represent the cost of fuel and pollution.

4.2. Technical and Economical Constraints

Total electrical and thermal equilibrium
n j P h , e , j n + P h , e , n E S d + ( 1 m h R e t ) . P h , e , n R e t d = n c P h , e , n c + P h , e , n E S c h + m h R e t . P h , e , n R e t c h
n i P h , h t , n i + P h , h t , n T E S d = n l P h , h t , n k + P h , h t , n T E S c h
Equations (6) and (7) represent the total power generated by electrical/thermal generators during each time interval; this quantity must be equal to the total demand of the electrical/thermal consumers.
Retailer constraints
Equation (8) shows the cost resulting from electrical power purchased from the retailer to the H-MG n, while Equation (9) presents the lower and upper bounds of retailers offer price for purchasing power to the H-MG n.
C O h , e , n R e t d = π h , e , n R e t d × P h , e , n R e t d
0 π h , e , n R e t d λ h S B P
In addition, Equation (10) is the revenue resulting from selling electrical power from the H-MG n to the retailer, whereas Equation (11) shows the price bid range for sales of power by the retailer to H-MG n.
U h , e , n R e t c h = π h , n R e t c h × P h , e , n R e t c h
0 π h , n R e t c h λ h , e S S P
Equations (12) and (13) show the exchanged power constraints between H-MG n and retailer. In addition, Equation (14) represents the binary decision variable for the retailer.
P h , e , n R e t c h m h R e t × P ^ R e t
P h , e , n R e t d 1 m h R e t × P ^ R e t
P ^ R e t P h , e , n E S P + P h , e , n C H P + P h , e , n E S d
Equations (15) and (16), respectively, are the function regarding the pollution of the retailer and the cost of pollution causing by purchasing from retailers. In Equation (15), d E i is the retailers’ pollution factor, which belongs to closed interval [0,1].
E h , i R e t = d E i . P h , i R e t
C O h , i E , R e t = α i R e t × E h , i R e t × Δ h
In Equation (16), α is calculated from the relations in Equations (17) and (18). The coefficient of price fine (i.e., Max-Max type) equals the ratio of maximum fuel cost to the maximum emitted pollution level. This coefficient, compared to other coefficients, leads to more pollution reduction. Meanwhile, the Min-Max price is equal to the ratio of the minimum fuel cost to the maximum amount of pollution released. This type of fine coefficient will minimize the cost of fuel compared to other fines.
α M a x M a x , j i = π F × P ^ j i E h , j i | P ^ j i
α M i n M a x , j i = π F × P ˇ j i E h , j i | P ^ j i
H-MG n constraints
ES and TES constraints in H-MG n
C O h , e , n E S c h = π h , e , n E S c h × P h , e , n E S c h
0 π h , e , n E S c h λ h , e M C P
U h , e , n E S d = π h , e , n E S d × P h , e , n E S d
0 π h , e , n E S d λ h , e M C P
The cost of charging ES is obtained from Equation (19), where C O h , e , n E S c h , U h , e , n E S , π h , e , n E S c h , and π h , e , n E S d , respectively, show the cost, revenue (utility), and price bid resulting from buying/selling electrical power by ES in H-MG n. Equations (23)–(25) present ES maximum and minimum charge/discharge in H-MG n. Equations (26) and (27) are the charge/discharge maximum limits for the energy in Equation (28).
E ˇ N n E S E N h , e , n E S E ^ N n E S
P h , e , n E S d P ^ n E S d × m h , n E S , P h , e , n E S d 0
P h , e , n E S c h P ^ h , e , n E S c h × m h , n E S , P h , e , n E S c h 0
P h , e , n E S d × Δ h E N h 1 E S E ˇ N E S , n
P h , e , n E S c h × Δ h E ^ N i E S E N h 1 , n E S
E N h , e , n E S = E N h 1 , n E S + P h 1 , i E S c h P h 1 , n E S d × Δ h
Equation (29) depicts the cost resulting from buying thermal power by TES in the charging mode, while Equation (30) is the price bid interval for buying thermal power by TES.
C O h , h t , n T E S c h = π h , h t , n T E S c h × P h , h t , n T E S c h
0 π h , e , n T E S c h m a x π h , h t , n H H W , π h , h t , n T D
In addition, U h , h t , n T E S d in Equation (31) is the revenue resulting from sales of thermal power generated by TES in the discharging mode and π h , h t , n T E S d in Equation (32) is the price bid variations range for selling thermal power by TES.
U h , h t , n T E S d = π h , h t , n T E S d × P h , h t , n T E S d
0 π h , h t , n T E S c h m i n m a x π h , h t , n C H P , π h , h t , n G B , π h , h t , n T S P
In Equations (33)–(35), TES maximum and minimum charge/discharge limitations are shown.
E ˇ N n T E S E N h , h t , n T E S E ^ N n T E S
P h , h t , n T E S d P ^ h , h t , n T E S d × m h , n T E S , P h , n T E S d 0
P h , h t , n T E S c h P ^ h , h t , n T E S c h , P h , h t , n T E S c h 0
Equations (36) and (37) show the maximum discharge/charge limits for the energy in TES, while Equation (38) presents the energy equilibrium in TES.
P h , h t , n T E S d × Δ h ( E N h 1 , n T E S E ˇ N n T E S )
P h , h t , n T E S c h × Δ h E ^ N n T E S E N h 1 , n T E S
E N h , n T E S = E N h 1 , n T E S + P h 1 , n T E S c h P h 1 , n T E S d × Δ h
EV constraints in H-MG n
i f m h , n E V = 1 P ˇ n E V c h P h , e , n E V c h P ^ n E V c h
Equation (39) illustrates that if m h , n E V = 1 , then the battery can be charged between P ˇ n E V c h a n d P ^ h , e , n E V c h , as the lower and upper bounds, respectively. Equation (40) states that S O C h , n E V of the automobile battery during each time interval related to H-MG n, must be less than its maximum value. It should be noted that Equation (41) is the automobile battery power balance constraint. If the EV is unplugged or once S O C h , n E V has reached to the highest value, the charging process will be finished. In addition, Equation (42) indicates that, when the battery has been fully charged, no power is required to charge.
S O C h , n E V S O C ^ n E V
S O C h , n E V = S O C h 1 , n E V P h , e , n E V c h × Δ h E T o t , n E V
S O C h , n E V = S O C ^ n E V m h , n E V = 0 P h , e , n E V c h = 0
Equation (43) is the cost of buying electrical power while Equation (44) indicates the offer price range for power bought by EV.
C O h , e , n E V c h = π h , e , n E V c h × P h , e , n E V c h
0 π h , e , n E V c h λ h , e M C P
ESP constraints in H-MG n
The ESP generated power limitation is as shown in Equation (45).
P ˇ n E S P P h , e , n E S P P ^ n E S P
Equation (46) shows the revenue as a result of the electrical power generated by ESP, whereas Equation (47) shows the price bid range for power sold by ESP.
U h , e , n E S P = π h , e , n E V c h × P h , e , n E S P
0 π h , e , n E S P λ h , e M C P
TSP constraints in H-MG n
Equation (48) shows the generated thermal power income of Thermal Solar Panel (TSP), and Equation (49) shows the range of price bid for power sold by TSP.
U h , h t , n T S P = π h , h t , n T S P × P h , h t , n T S P
0 π h , h t , n T S P m i n ( π h , h t , n T E S d , π h , h t , n C H P , π h , h t , n G B )
CHP constraints in H-MG n
Equations (50)–(52) presents the power generation limitation for the CHP.
P ˇ n C H P P h , e , n C H P P ^ n C H P
P h , e , n C H P = F U h , n C H P × ξ e 1 , n C H P + ξ e 2 , n C H P
P h , e , n C H P = ξ e 1 , n C H P × P h , h t , n C H P ξ h t , n C H P + ξ e 2 , n C H P
Equation (53) is the cost as a result of power generation by CHP. Equation (54) shows the price bid range for power generated by CHP. In addition, Equations (55) and (56) state the revenue resulting from selling electrical and thermal powers generated by the CHP.
C O h , n C H P = n g p h × F U h , n C H P
C O h , n C H P π h , n C H P = 2 × C O h , n C H P
U h , e , n C H P = π h , e , n C H P × P h , e , n C H P
U h , h t , n C H P = π h , h t , n C H P × P h , h t , n C H P
Equations (57)–(59), respectively, are the CHP pollution function, the cost of pollution causing by purchasing from CHP and the cost of the fuel consumed.
E h , i C H P = ψ 1 E i × ( P h , i C H P ) 2 + ψ 2 E i × ( P h , i C H P ) + ψ 3 E i , ( ψ 1 , ψ 2 , ψ 3 ) E i [ 0 , 1 ]
C O h E , C H P = α i C H P × E h , i C H P × Δ h
C O h , F , i C H P = π F × P h , i C H P × Δ h
GB constraints in H-MG n
The limit of the power generated by GB is shown in Equation (60).
0 P h , h t , n G B P ¯ h , h t , n G B
Equation (61) shows the cost resulting from thermal power generated by GB while Equation (62) presents the amount of fuel consumed using GB and Equation (63) determines the price bid range for selling power through GB.
C O h , h t , n G B = n g p h × F U h , n G B
F U h , n G B = P h , h t , n G B ξ h t G B
C O h , h t , n G B π h , h t , n G B 2 × C O h , h t , n G B
The revenue resulting from thermal power sold by GB is shown in Equation (64).
U h , h t , n G B = π h , h t , n G B × P h , h t , n G B
Equations (65)–(67), respectively, are the functions regarding GB pollution, the cost of pollution causing by purchasing from GB, and the cost of fuel consumed.
E h , i G B = ψ 1 E i × ( P h , i G B ) 2 + ψ 2 E i × ( P h , i G B ) + ψ 3 E i , ( ψ 1 , ψ 2 , ψ 3 ) E i ϵ R +
C O h E , G B = α i G B × E h , i G B × Δ h
C O h , F , i G B = π F × P h , i G B × Δ h
Consumer constraints
DR constraints
Equation (68) shows that the amount of shift-able power must be less than or equal to the difference between the total consumed power and the total generated power. The linear inequality in Equation (69) indicates the amount of available power that can be allocated to the DR. Equations (70) and (71) show that the DR limit between two consecutive intervals must not exceed a certain value.
P h , n D R d ( P h , n T G P P h , n T C P ) . ( m h , n D R d )
P h , n D R c h ( P h , n T G P P h , n T C P ) . ( 1 m h , n D R d )
P h , n D R c h ( j ε × P h , n g ) . ( 1 m h , n D R d )
j h P h , n D R c h P h 1 , n D R c h j h
The appliances of H-MGs in each time interval h are divided into two divisions, namely essential as non-shift-able (NSH), and shift-able. Let ϑ T o t , n = [ P n , h A P P ( γ ) ] be the total load of H-MG n, at time h. In addition, A P P ( γ ) is γ th appliance and A P P ( N S H ) is the set of all N S H (non-shiftable) appliances. Equation (72) denotes the total load demanded/produced of H-MG n at time h.
P n , h A P P ( γ ) = n τ n , h A P P ( γ ) + P n , h A P P ( N S H )
In Equation (73), P O n , h A P P ( γ ) is expressed as demand position vector of load A P P ( γ ) of H-MG n at time h. If P O n , h A P P ( γ ) = 0 , the A P P ( γ ) has been shifted to another time, otherwise it equals 1.
τ n , h A P P ( γ ) = P O n , h A P P ( γ ) × P n , h A P P ( γ )
For each H-MG n at time h, DR constraints consist of three divisions, namely DRP, DRE, and DRPE constraints, which are described in Equations (74), (75), and (76), respectively.
D R P n , h = n A P P ( γ ) π n , h A P P ( γ ) × P n , h A P P ( γ )
D R E n , h = n Ω E n , h Ω
D R P E n , h = e x p ( δ 1 . D R P 2 + δ 2 . D R E 2 ) 1 / 2 , δ 1 + δ 2 = 1 , δ 1 , 2 [ 0 , 1 ]
ATL and AEL constraints
Equations (77) and (78) are the costs resulting from electric and thermal power purchased by AEL and ATL. In addition, Equations (79) and (80) present the price bid interval for power purchased by AEL and ATL.
C O h , h t , n A E L = π h , h t , n A E L × P h , h t , n A E L
C O h , h t , n A T L = π h , h t , n A T L × P h , h t , n A T L
λ h , e M C P π h , e , n A E L 2 × λ h , e M C P
m a x ( π h , h t , n T E S d , π h , h t , n C H P , π h , h t , n G B , π h , h t , n T S P ) π h , h t , n A T L 2 × m a x ( π h , h t , n T E S d , π h , h t , n C H P , π h , h t , n G B , π h , h t , n T S P )
TD constraints
Equation (81) is the cost of thermal power bought by Thermal Dump (TD) while Equation (82) states the offer price range for power bought by TD.
C O h , h t , n T D = π h , h t , n T D × P h , h t , n T D
0 π h , h t , n T D m i n ( π h , h t , n T E S d , π h , h t , n C H P , π h , h t , n G B , π h , h t , n T S P )
REF constraints
Equations (83)–(87) state the modeling of REF. When the temperature lies between two minimum and maximum amount, T ˇ n R E F T h , n R E F T n R E F ^ , the refrigerator stays in off mode. Hence, the temperature increases because the compressor of refrigerator is working (Equation (84)).
m h , n R E F = 0 ; T ˇ n R E F T h , n R E F T n R E F ^ ; m h , n R E F = 1 ; O t h e r w i s e
m h , n R E F = 1 P h , e , n R E F = P ^ n R E F T h , n R E F = T h 1 , n R E F T n R E F
m h , n R E F = 0 P h , e , n R E F = 0 T h , n R E F = T h 1 , n R E F + T n R E F
C O h , e , n R E F = π h , e , n R E F × P h , e , n R E F
0 π h , e , n R E F λ h , e M C P
DW constraints
The modeling of DW are presented in Equations (88)–(91). In addition, Equations (90) and (91), respectively, show the cost resulting from buying power by DW and the price bid interval for buying power.
i f m h , n D W = 1 P h , e , n D W = P ^ n D W D T h , n D W = T h 1 , n D W + 1
i f D T h , n D W = D T ^ n D W P h , e , n D W = 0 m h , n D W = 0
C O h , h t , n D W = π h , e , n D W × P h , e , n D W
0 π h , e , n D W λ h , e M C P
HHW constraints
The modeling of HHW are presented in Equations (92)–(96). When the HHW temperature lies between the lower and upper bounds, T ˇ n H H W T h , n H H W T ^ n H H W , the HHW stays in off mode. Therefore, the temperature decreases due to the heat generation (Equation (93)).
m h , n H H W = 0 ; T ˇ n H H W T h , n H H W T ^ n H H W m h , n H H W = 1 ; O t h e r w i s e
m h , n H H W = 1 P h , e , n H H W = P ^ n H H W T h , n H H W = T h 1 , n H H W + T n I N C
m h , n H H W = 0 P h , e , n H H W = 0 T h , n H H W = T h 1 , n H H W T n I N C
C O h , h t , n H H W = π h , h t , n H H W × P h , h t , n H H W
0 π h , h t , n H H W m a x ( π h , h t , n T E S d , π h , h t , n T S P π h , h t , n C H P π h , h t , n G B )

5. Results and Discussion

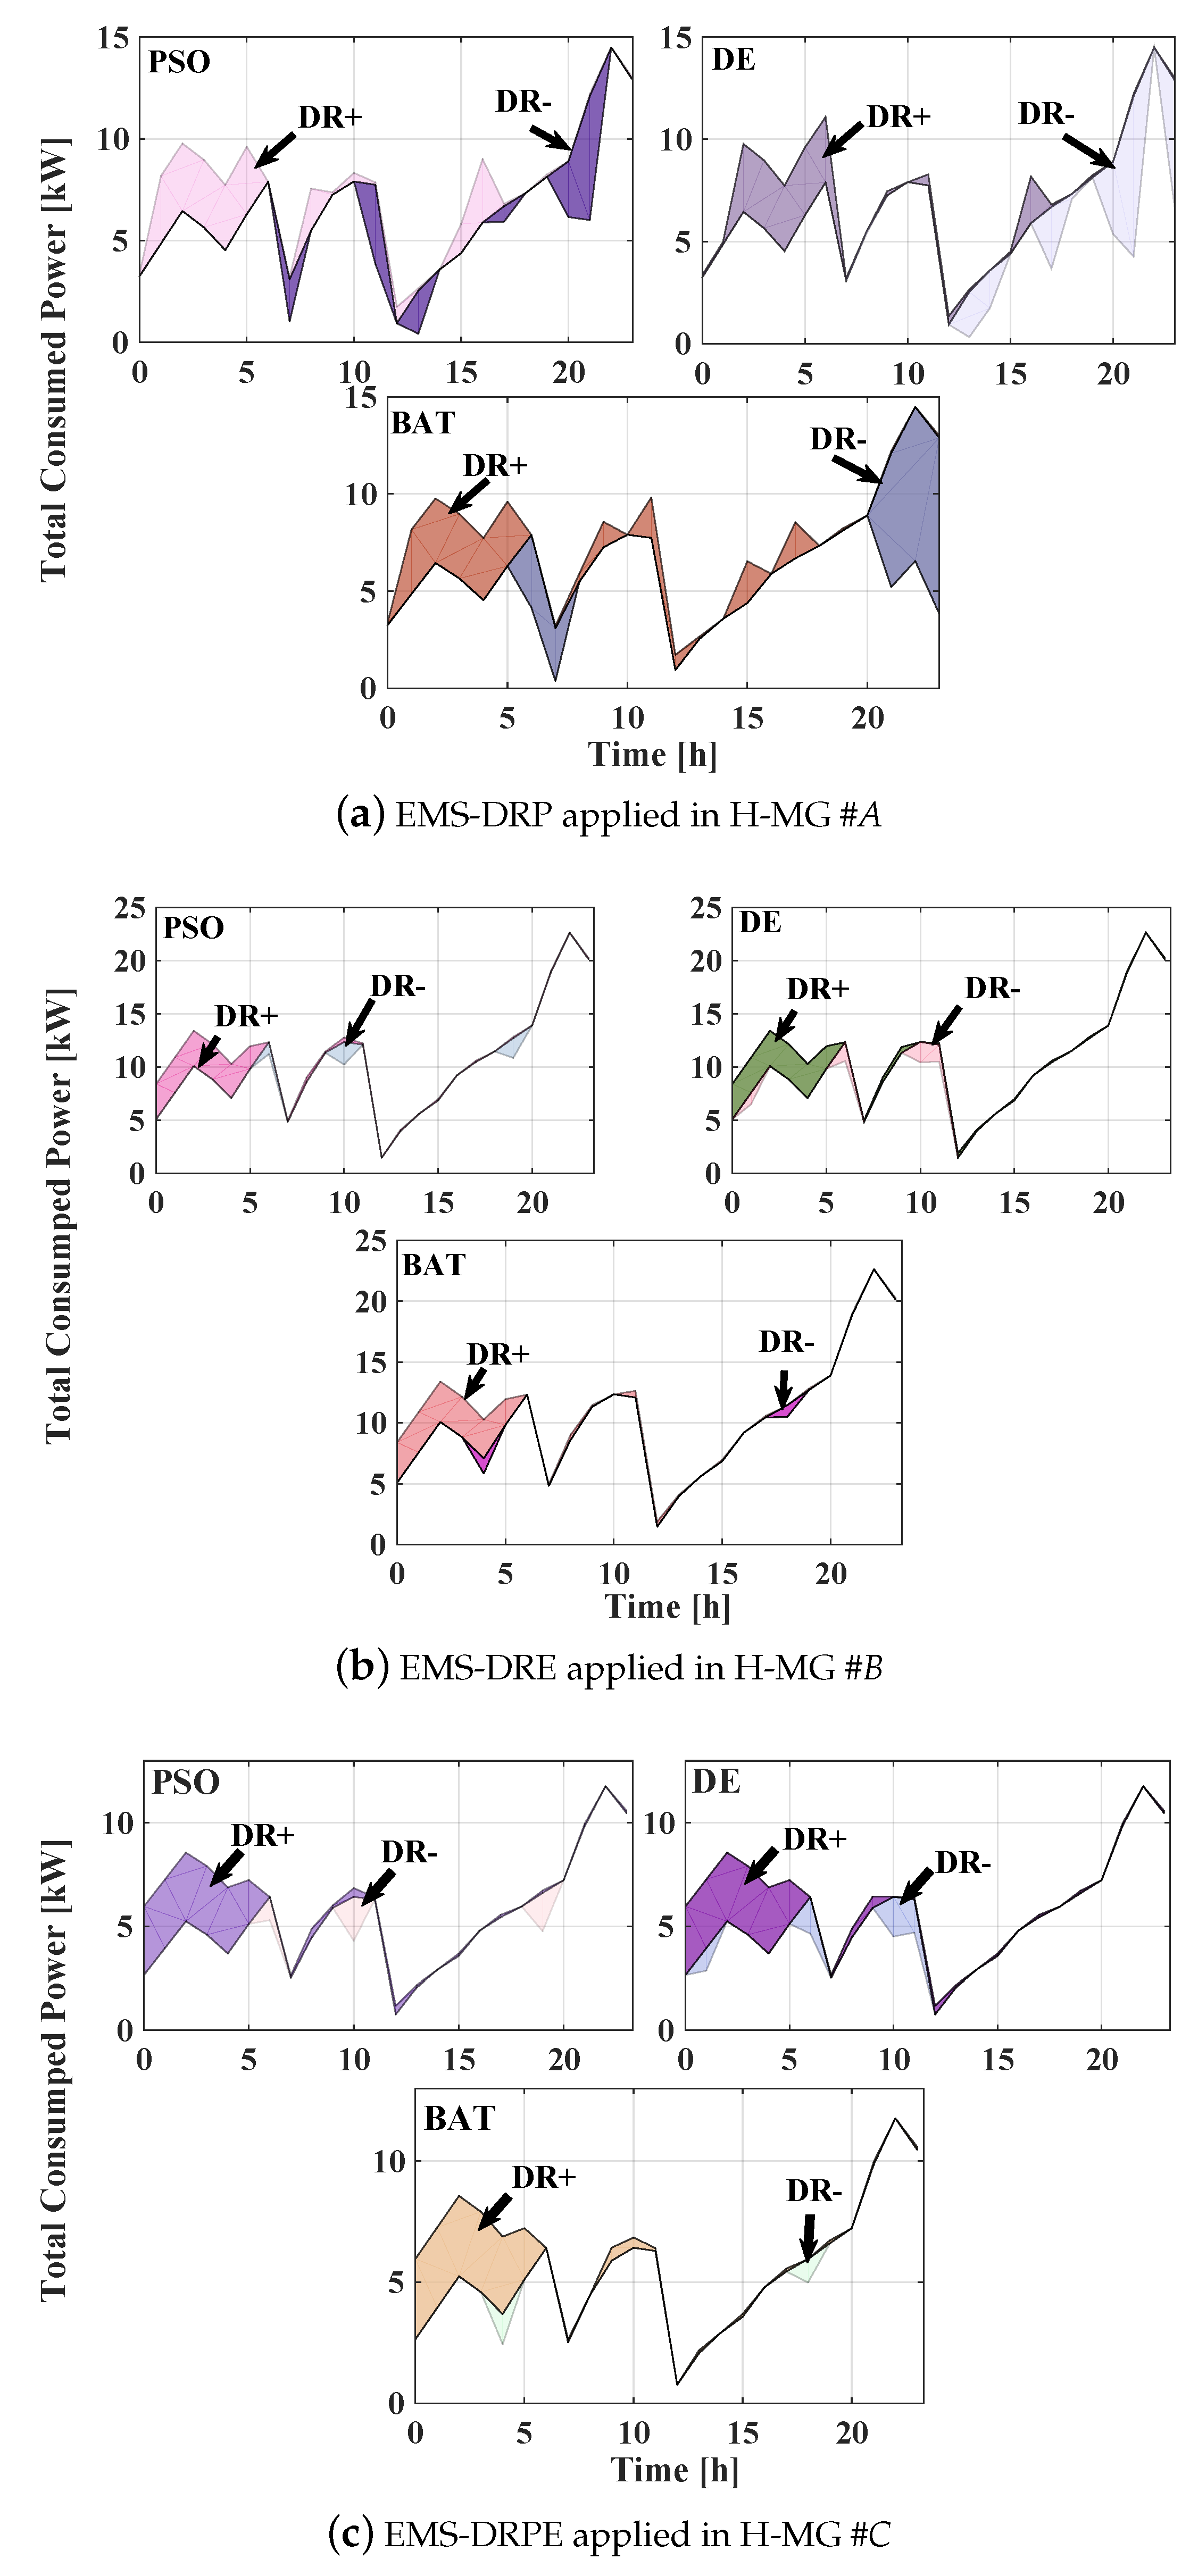
Computer simulations were carried out using the MATLAB software environment running on a personal computer with a 2.5 GHz CPU with 8.0 Gigabytes of memory to perform the multi-objective problem linked with MATLAB tools as a support to coordinate the execution of these problems, store data and make the graphical representation. The simulated period was 24-h. In this study, the defined objective function for all optimization methods was the same and the performance of all proposed optimization methods, in responding to specified objective functions for all players, were investigated. It should be noted that the amount of power produced and consumed by renewable generators and each H-MG, respectively, were not the same. Therefore, comparing the results per each H-MG was not possible due to the amount of power consumption, power generated, and several variables being different per each H-MG. As shown in Figure 7a, the peak value is shifted to non-peak intervals using the BAT method in H-MG #A. Since in H-MG #A, DR is based on price, it is expected that the highest D R + and DR- occur in this H-MG. As ahown in Figure 7a, the highest D R + and DR- values among H-MGs belong to H-MG #A, so that comparing H-MG #A with H-MG #B and H-MG #C reveals a shift in the cost of power from expensive 17% to relatively cheaper 12%, a reduction of 5%. In general, H-MG #A has the best performance in D R + and D R regarding the BAT method. However, the lowest DR- content in the H-MG#A has been attributed to the PSO method, which indicates the low efficacy of this method in the power demand shift from a high-cost period to a much lower price range.
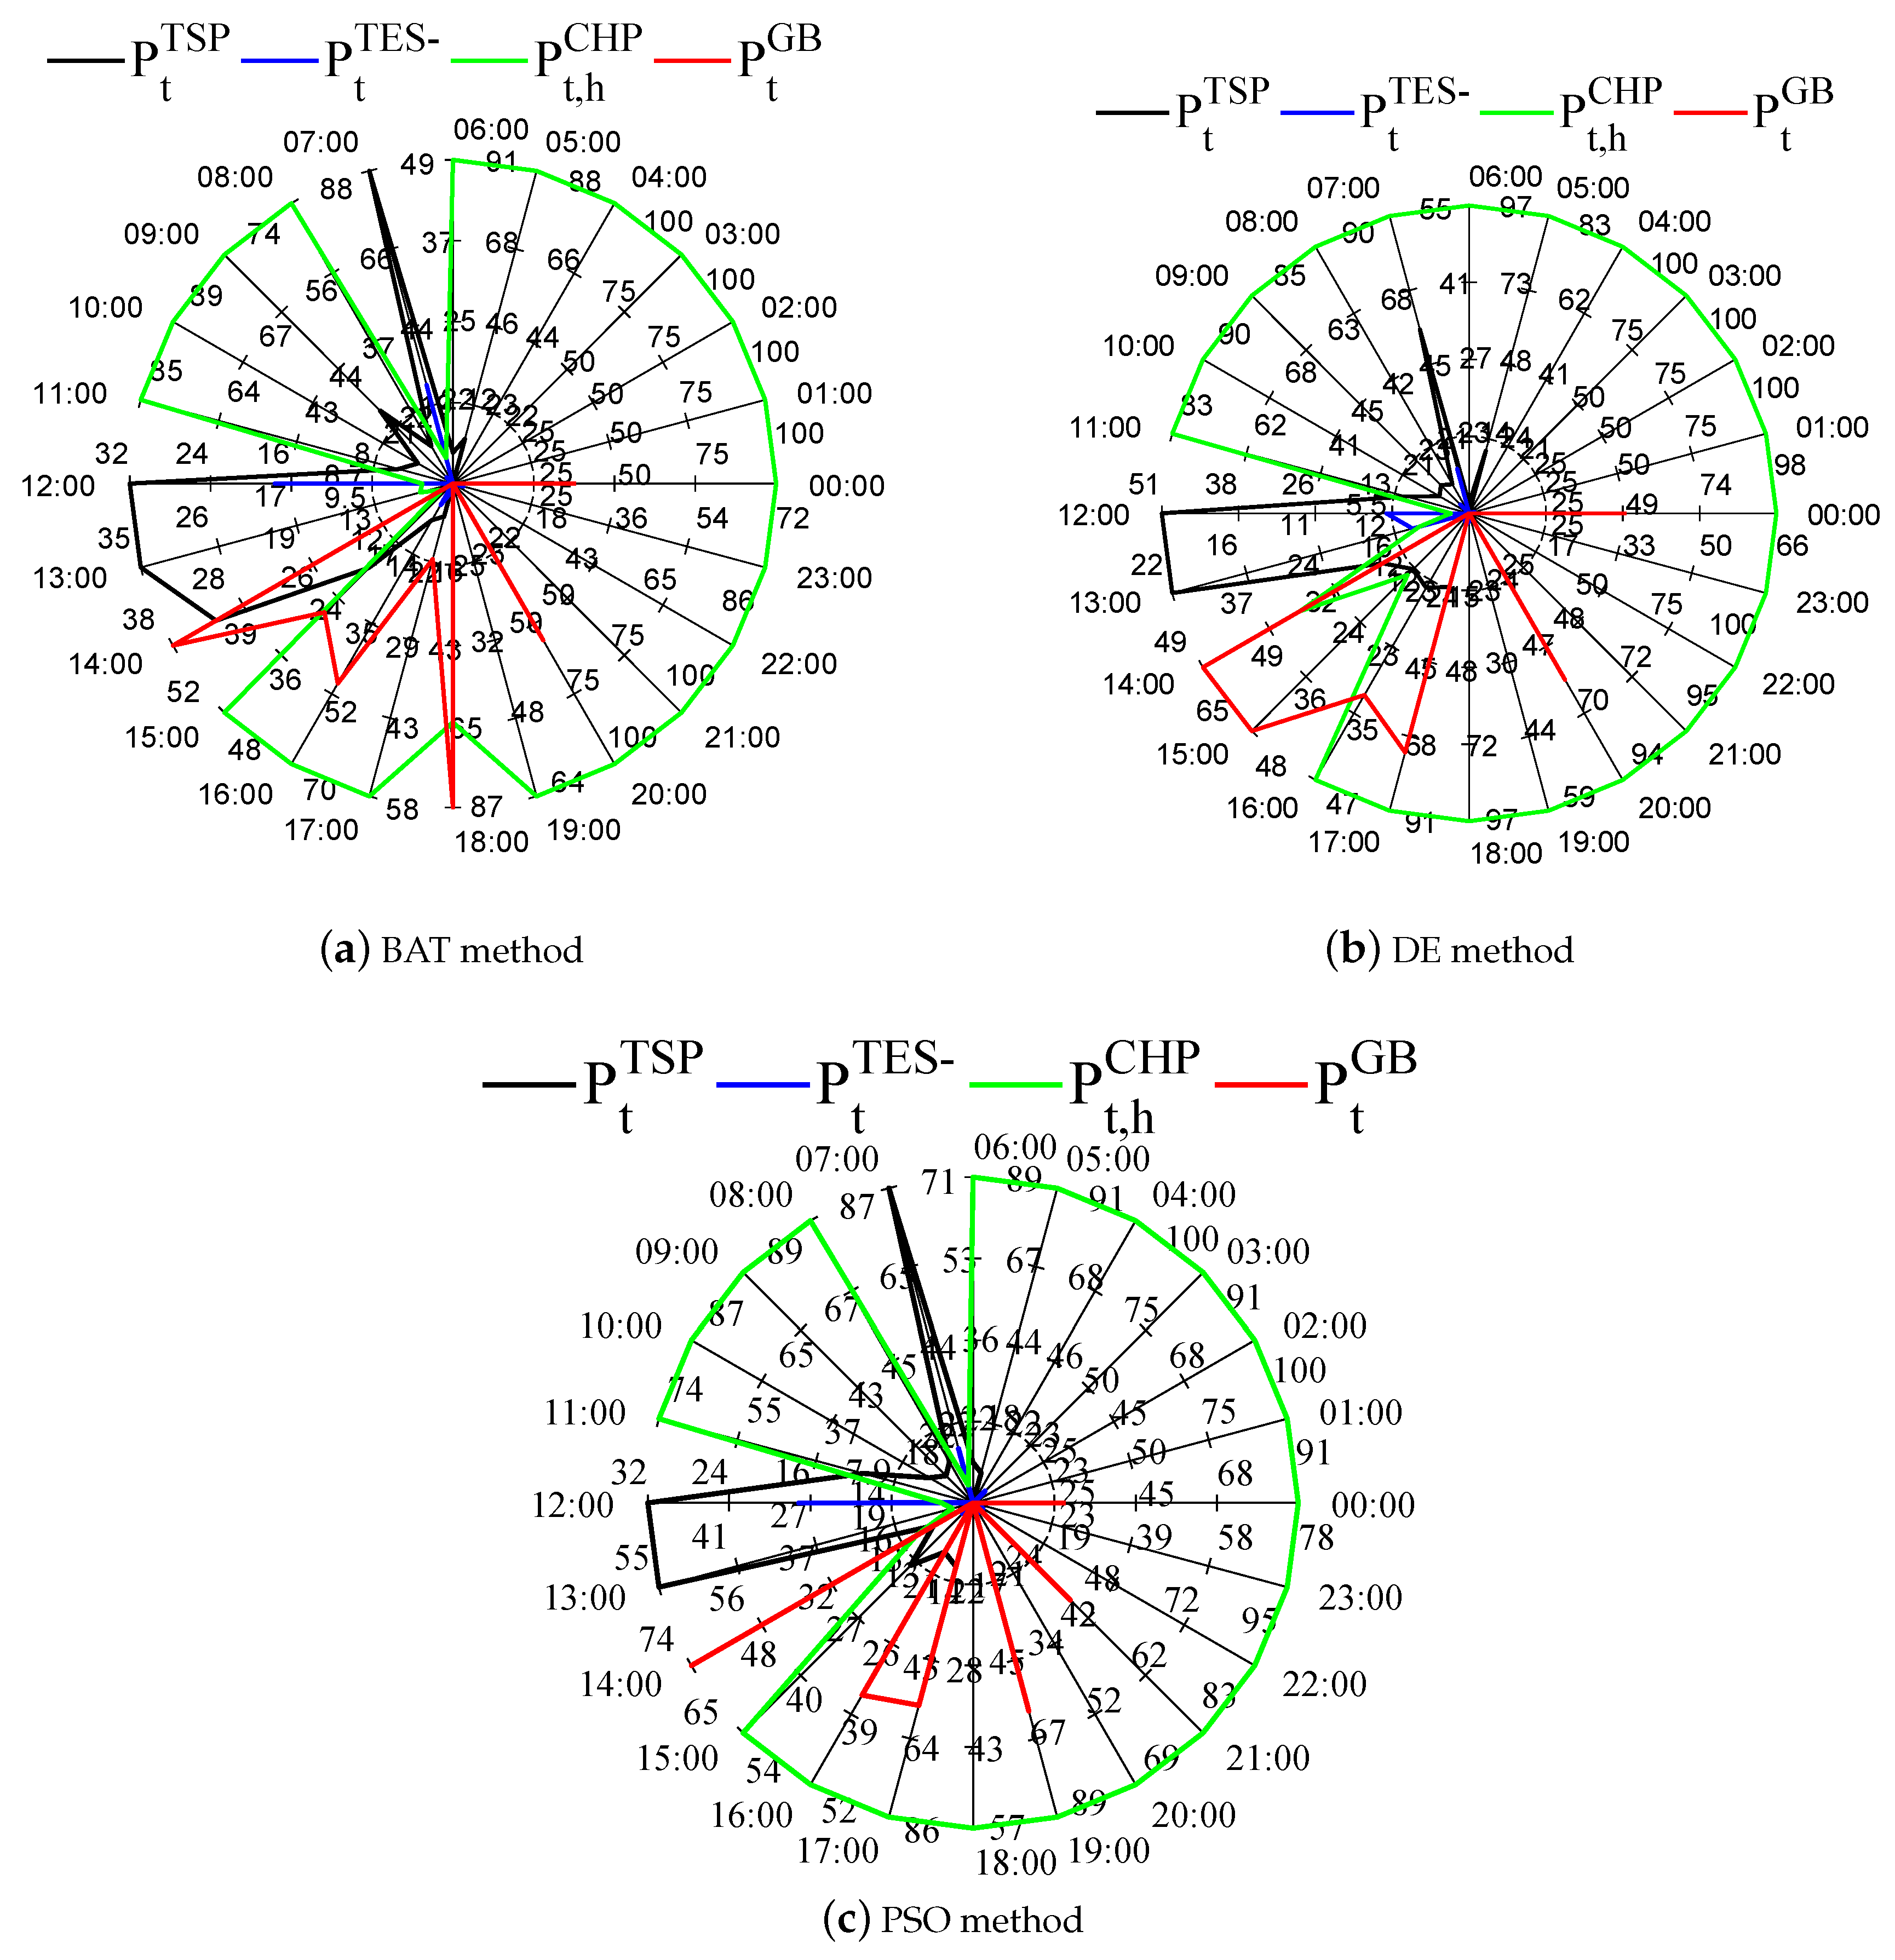
In H-MG #B, the two methods of BAT and DE have the same performance at D R + . However, in DR-, the sum of both methods was not as large as the DR- in PSO method. The PSO method with a 52% power demand shift has shown the strongest tendency for power demand shifts. In H-MG #C, where DR is based on price and pollution levels, all three methods contribute the same amount in D R + . However, the DE method, with a 50% contribution in the power demand shift, has been able to capture a high percentage of DR. The percentage of electrical power generated by each of the optimization methods is in accordance with Figure 8. Evidently, each of the optimization methods has used existing resources in proportion to their power demand, with CHP playing a very significant role. It should be noted that, despite the different generation rates of each H-MG, in general, the balance of power generated in each H-MG should be considered independently, and also in the entirety of the case study. As shown in Figure 8, optimization algorithms have used most of the ESP generation corresponding to the highest sun exposure times, which has helped considerably in reducing the level of air pollution. Furthermore, the highest level of generation has been related to CHP, whose main reason is to maintain the energy independence of each of the H-MGs. One of the major goals of the optimization techniques is to allow H-MGs to independently produce and supply their power requirements while meeting all constraints.
As can be seen, the grid also plays a significant role in providing the generation powers. Consistently maintaining the energy independency in H-MGs is of great importance, but due to pollution constraints, optimization methods based upon selecting the minimum amount of pollution generated between the grid and CHP, have selected Grid to provide their required power. This is illustrated in Figure 9. As shown in several intervals, both CHP and the grid, have provided power for H-MGs, due to pollution constraints. CHPs can only produce enough power to meet the requirement of not exceeding the pollutant index. Therefore, the algorithm evaluates the amount of power required by H-MG and the amount of power generated by power purchases from the grid to purchase power from the network. The percentage of thermal power generated by each of the optimization methods is in accordance with Figure 9. In this section, similar to the electrical sector, the thermal equilibrium of each H-MG, as well as the set of H-MGs, must be met by implemented optimization algorithms. As seen, GB has entered the service at times when the amount of TSP generation has been decreased and a growth in the load has occurred. Of course, the maintenance of GBs is subject to compliance with the pollution constraints, since GB can only generate heat to a degree that does not rule out the pollution index.
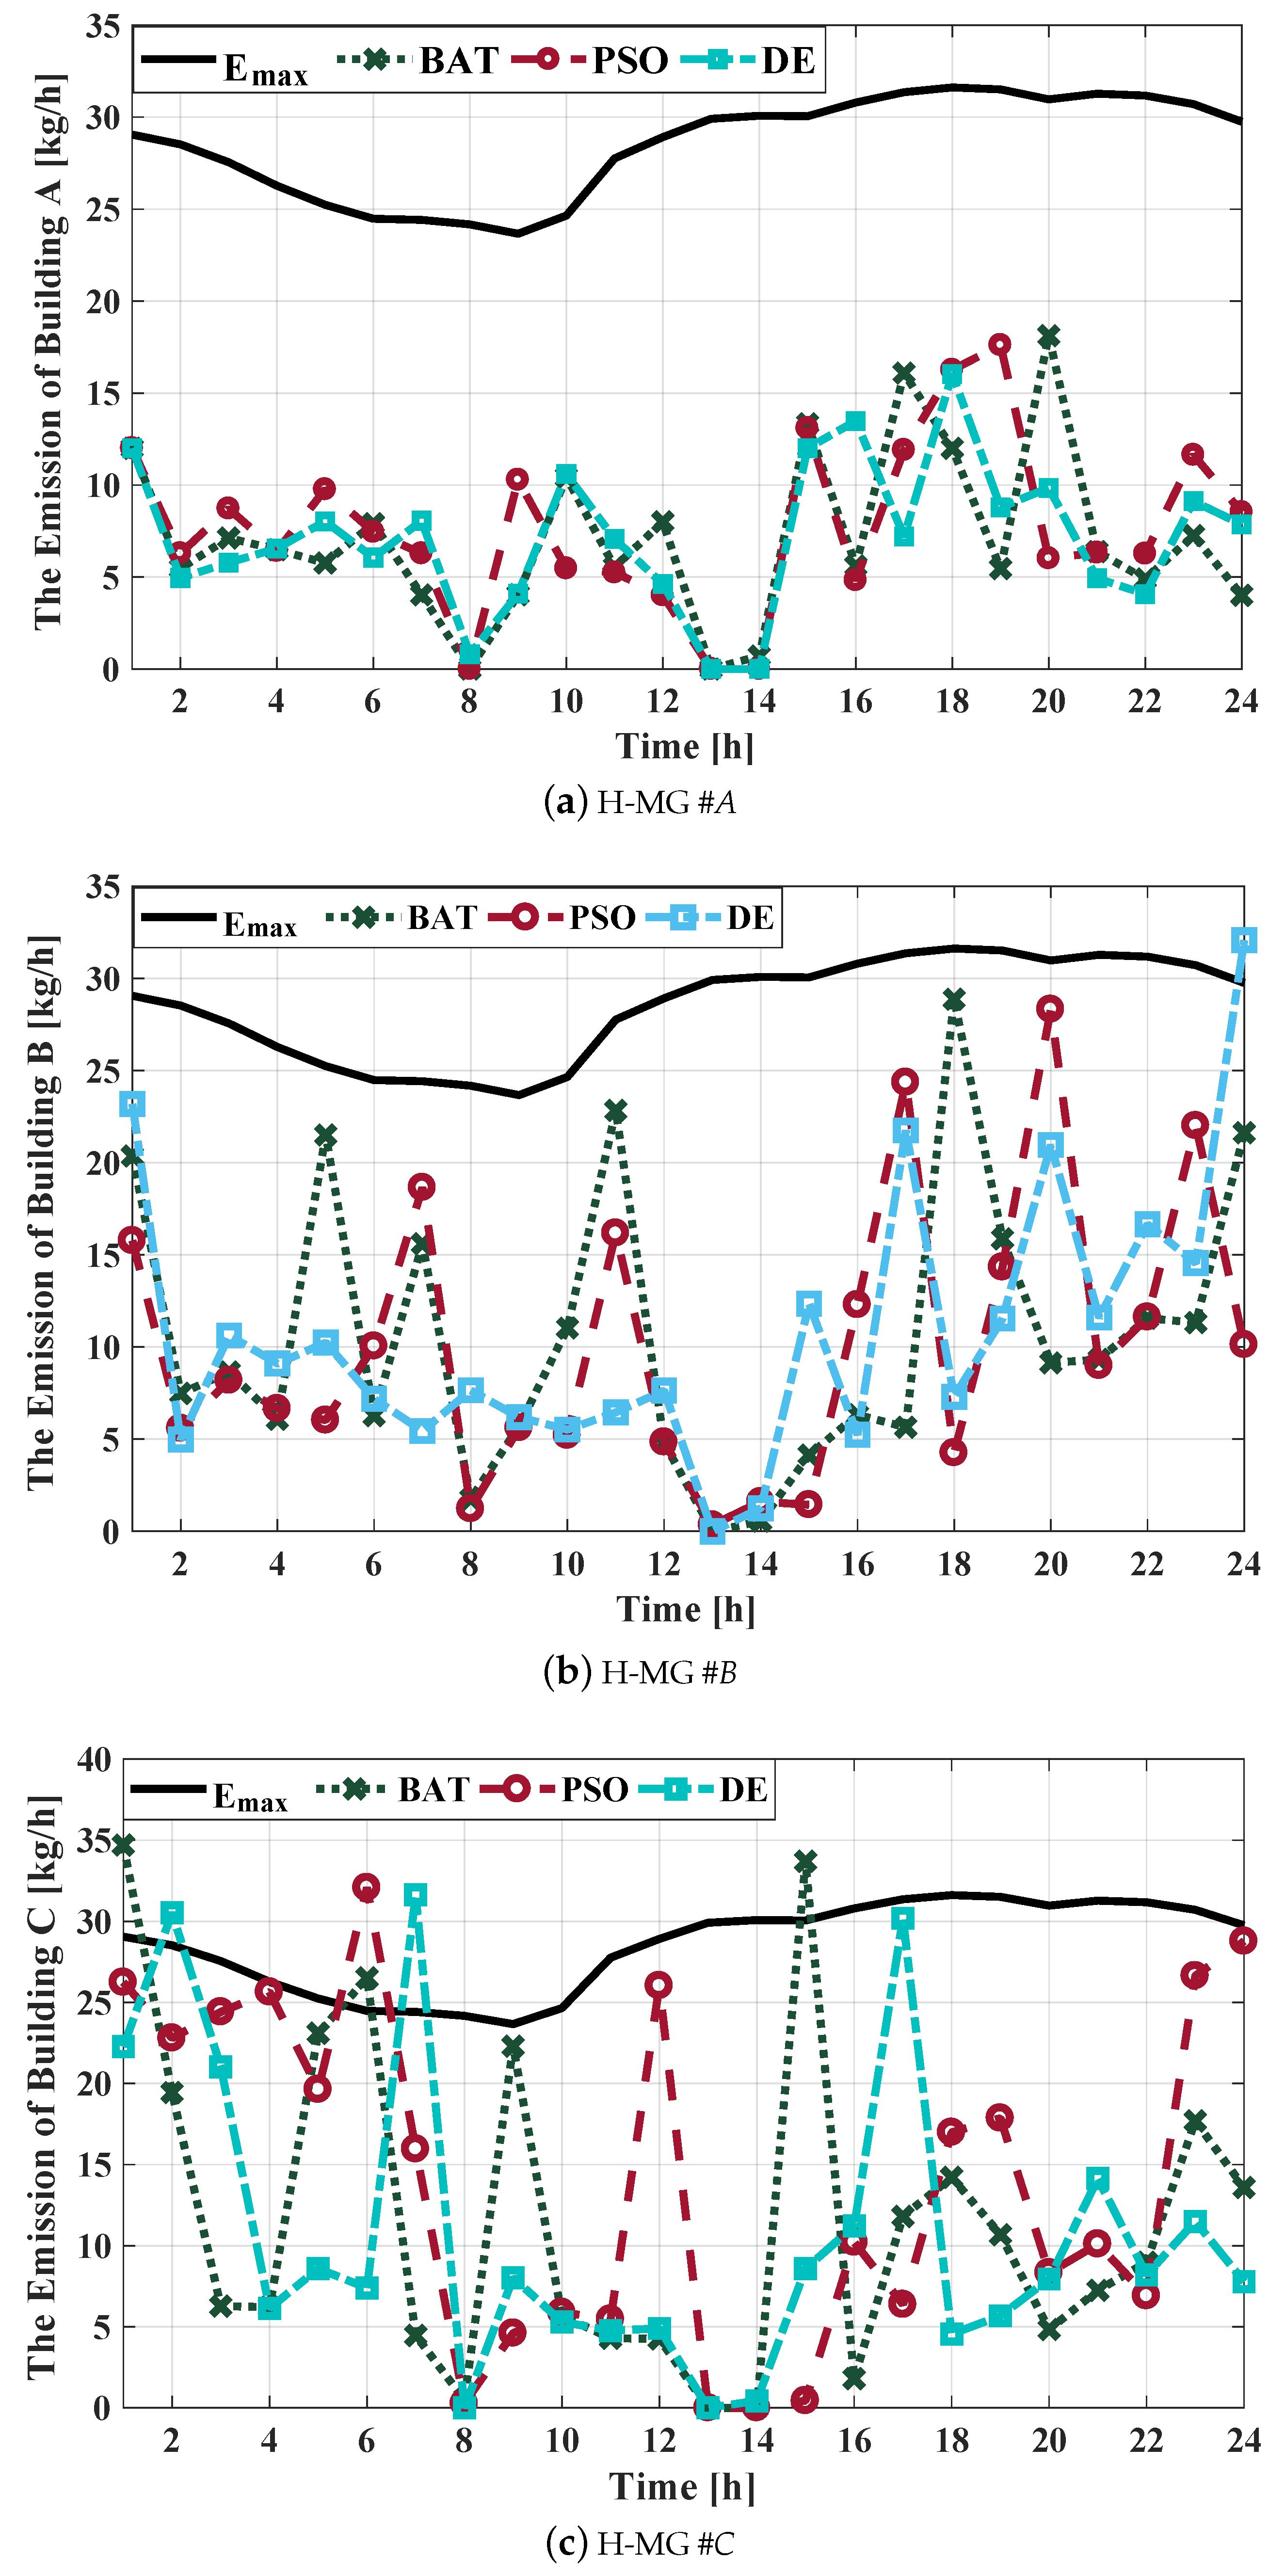
The process of reducing air pollution by each of the PSO, BAT and DE methods is shown in Figure 10. As can be seen, in more than 90% of the intervals, the proposed algorithm succeeds in reducing pollution. In H-MG #A, DR has been based on price. In this section, the algorithm is only required to shift the power to cheaper times. In H-MG #A, the best performance has been to reduce the pollution associated with the DE method, but, since the maximum MCP price has been between 16:00 and 22:00, the algorithm should reduce the power demand surplus. Consequently, the algorithm in this interval should not buy the power from the network whilst using the least amount from CHP and GB. Therefore, considering Figure 10a, it is evident that the PSO method has had the best performance in this interval. The algorithm has been able to reduce pollution by a reduction in the use of CHP and GB compared to the pollution index of 73%.
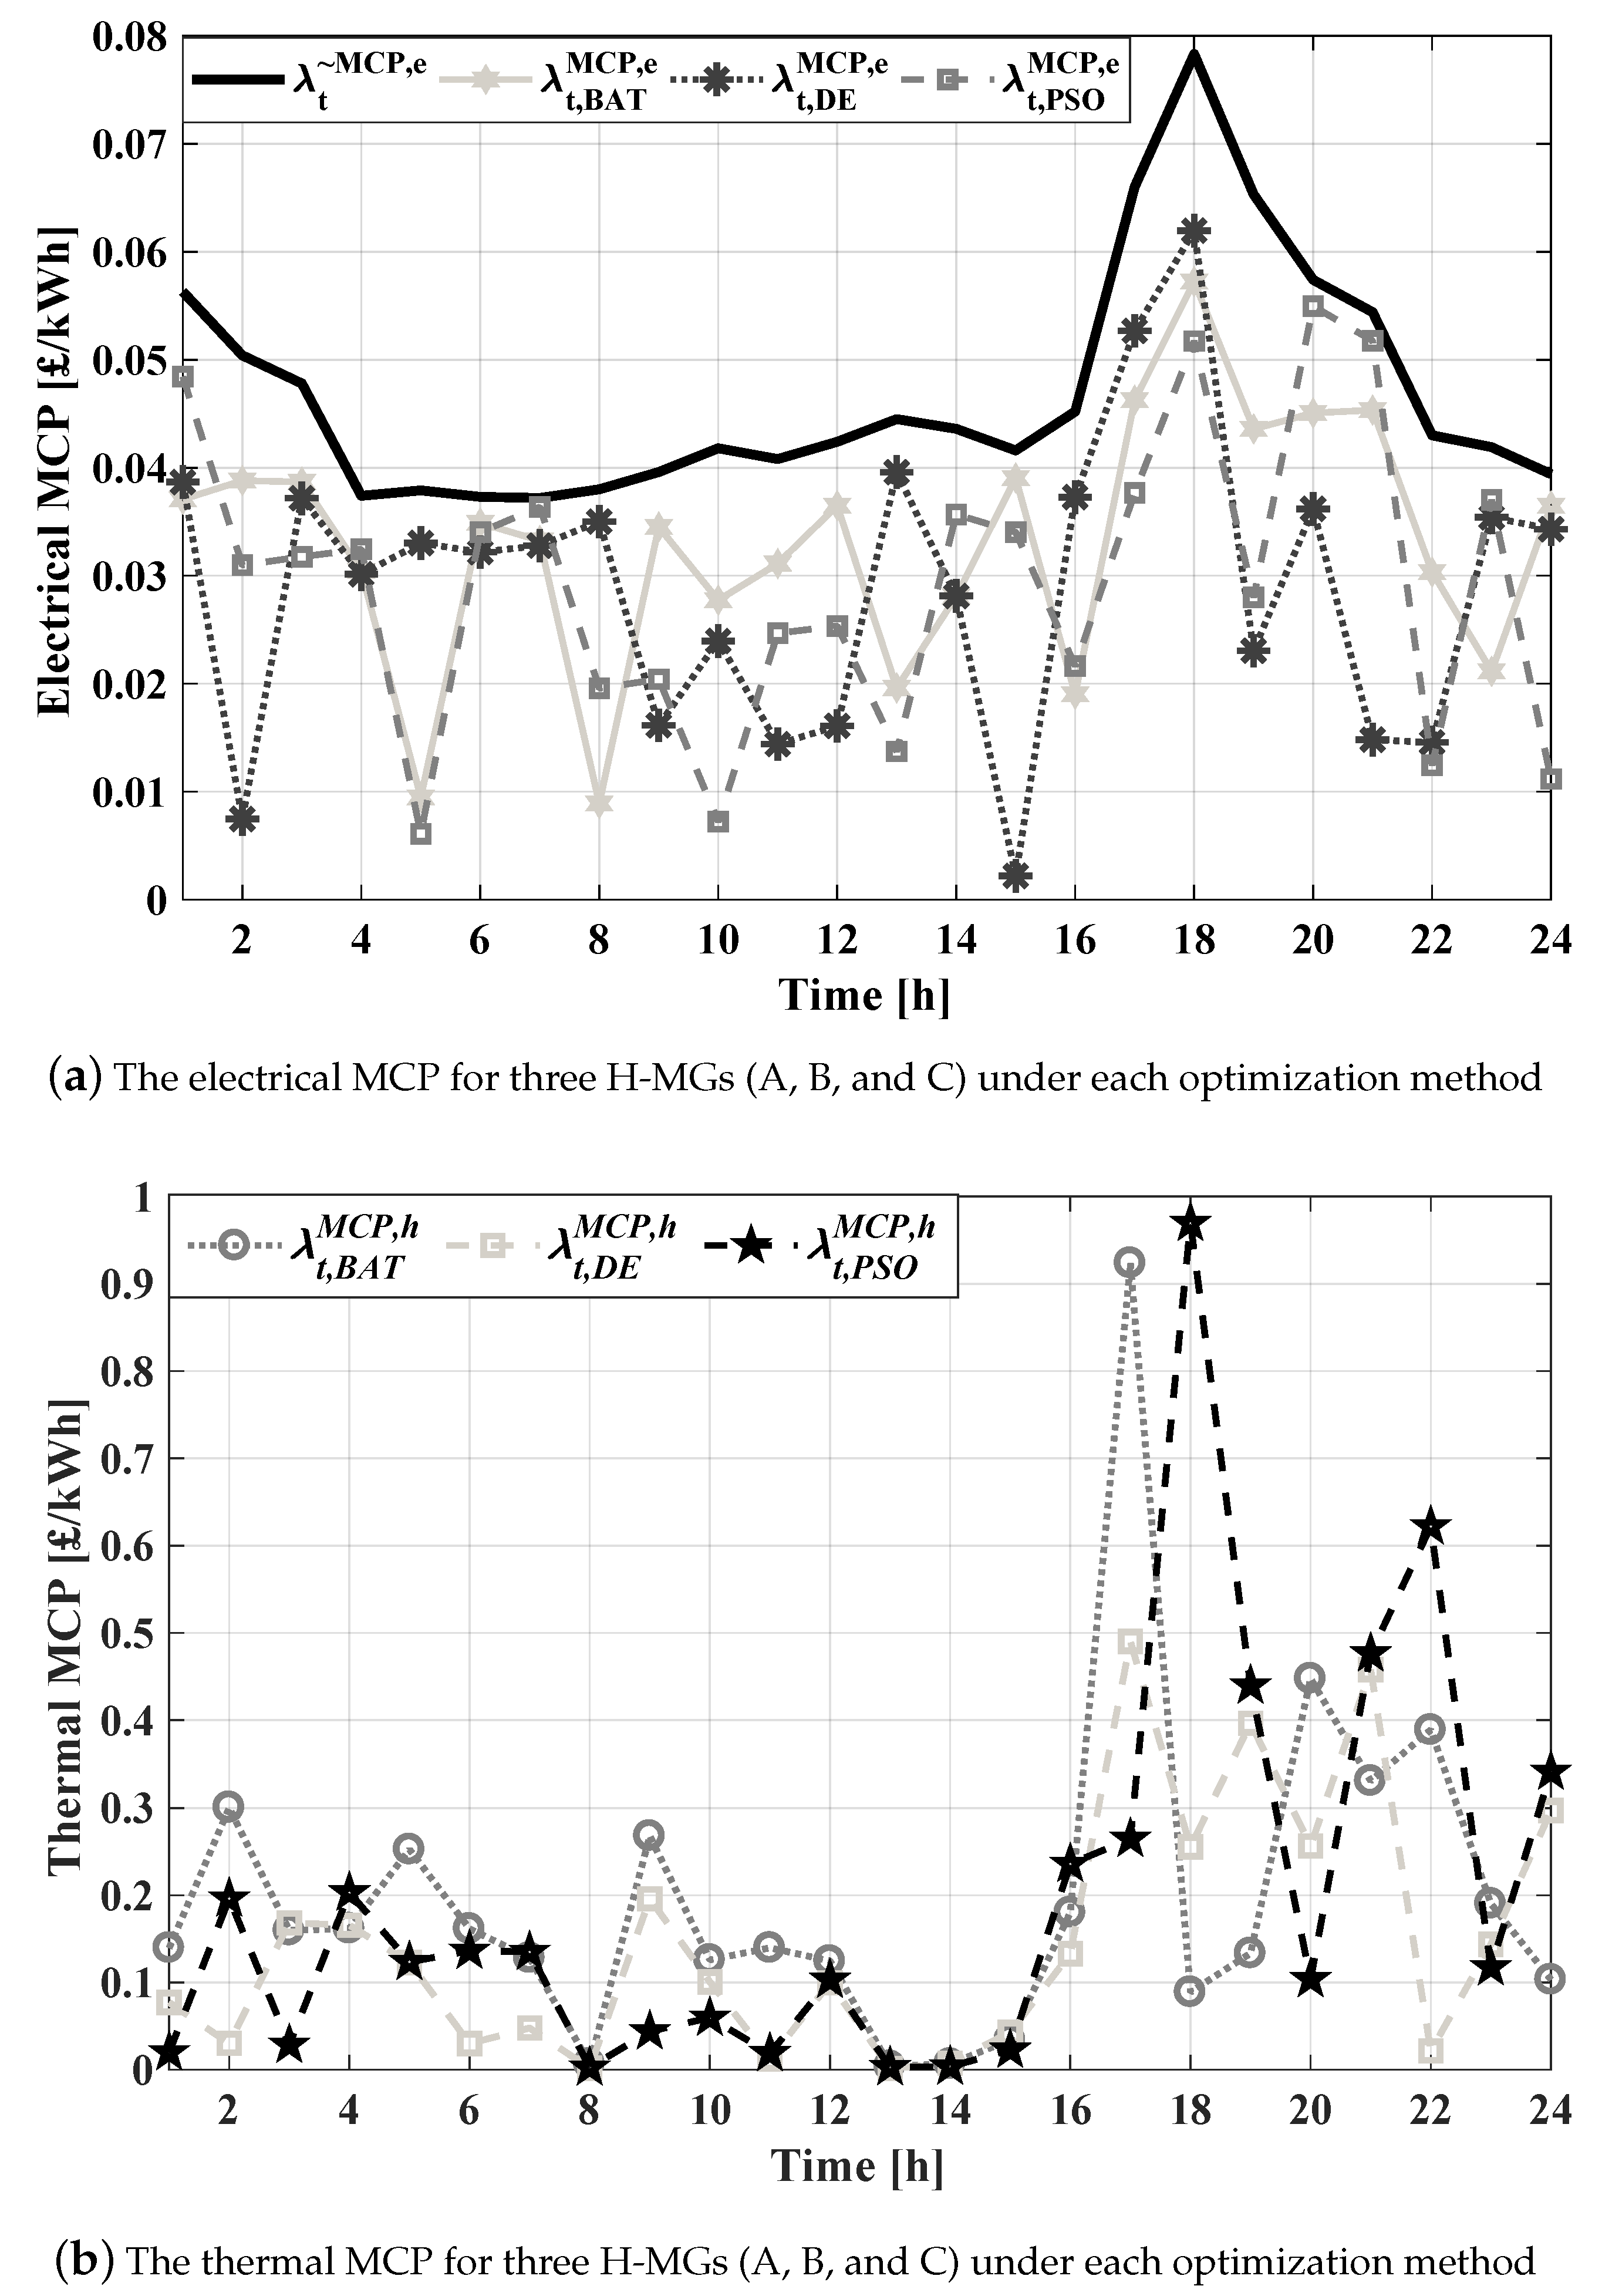
In H-MG #B, DR is programmed based on pollution. In this H-MG, the algorithm allows CHP and GB to reach orbit so that the pollution index is not compromised. Despite the fact that all methods managed to reduce the pollution level to below 100%, the PSO method had the best performance in ER, which had a 64% reduction compared to Emax. The reason why the H-MG #B was less successful than the H-MG #A in the ER was that there was a 35% increase in load in the building B, and the algorithm had to use the maximum CHP and GB (taking into account the constraints). In H-MG #C, DR has been set based on price and pollution. In this H-MG, pollution was reduced over 87% of the timeframe. In this H-MG algorithm, in addition to a considerable reduction in costs (as shown in Figure 11, there has also been success in reducing pollution. In this building, the best performance is related to the DE method, which has been able to reduce pollution by about 60%, relative to the air pollution index. In general, the DE method has the best performance in terms of pollution reduction, whereas the PSO method has the weakest performance. The electrical and thermal MCP values obtained from the simulation using various methods are shown in Figure 11a,b respectively. For better analysis, the 24-h simulation interval is divided into four 6-h intervals. As shown in Figure 11a, all of the optimization methods have succeeded in reducing the MCP, so that for all time periods, the calculated MCP was lower than the MCP prediction. According to Figure 11a, in the first time interval (00:00–06:00), the best performance has been achieved by the DE method. In this interval, the BAT method has had a weaker performance than the other two methods. The DE method compared with predicted BAT and MCP resulted in 5% and 33% reduction of MCP, respectively. In the second period (18:00–12:00), the best performance was related to the PSO method. In this interval, the lowest MCP reduction was related to the BAT method. The PSO method has a better performance than that of the BAT, which yielded 22%. In addition, the PSO approach compared to the MCP prediction has a 44% decline. In the third period (12:00–18:00), the PSO method has been able to maintain the MCP minimization trend, which is 12% higher than the DE method, which has the lowest reduction, and 39% better than the MCP prediction.
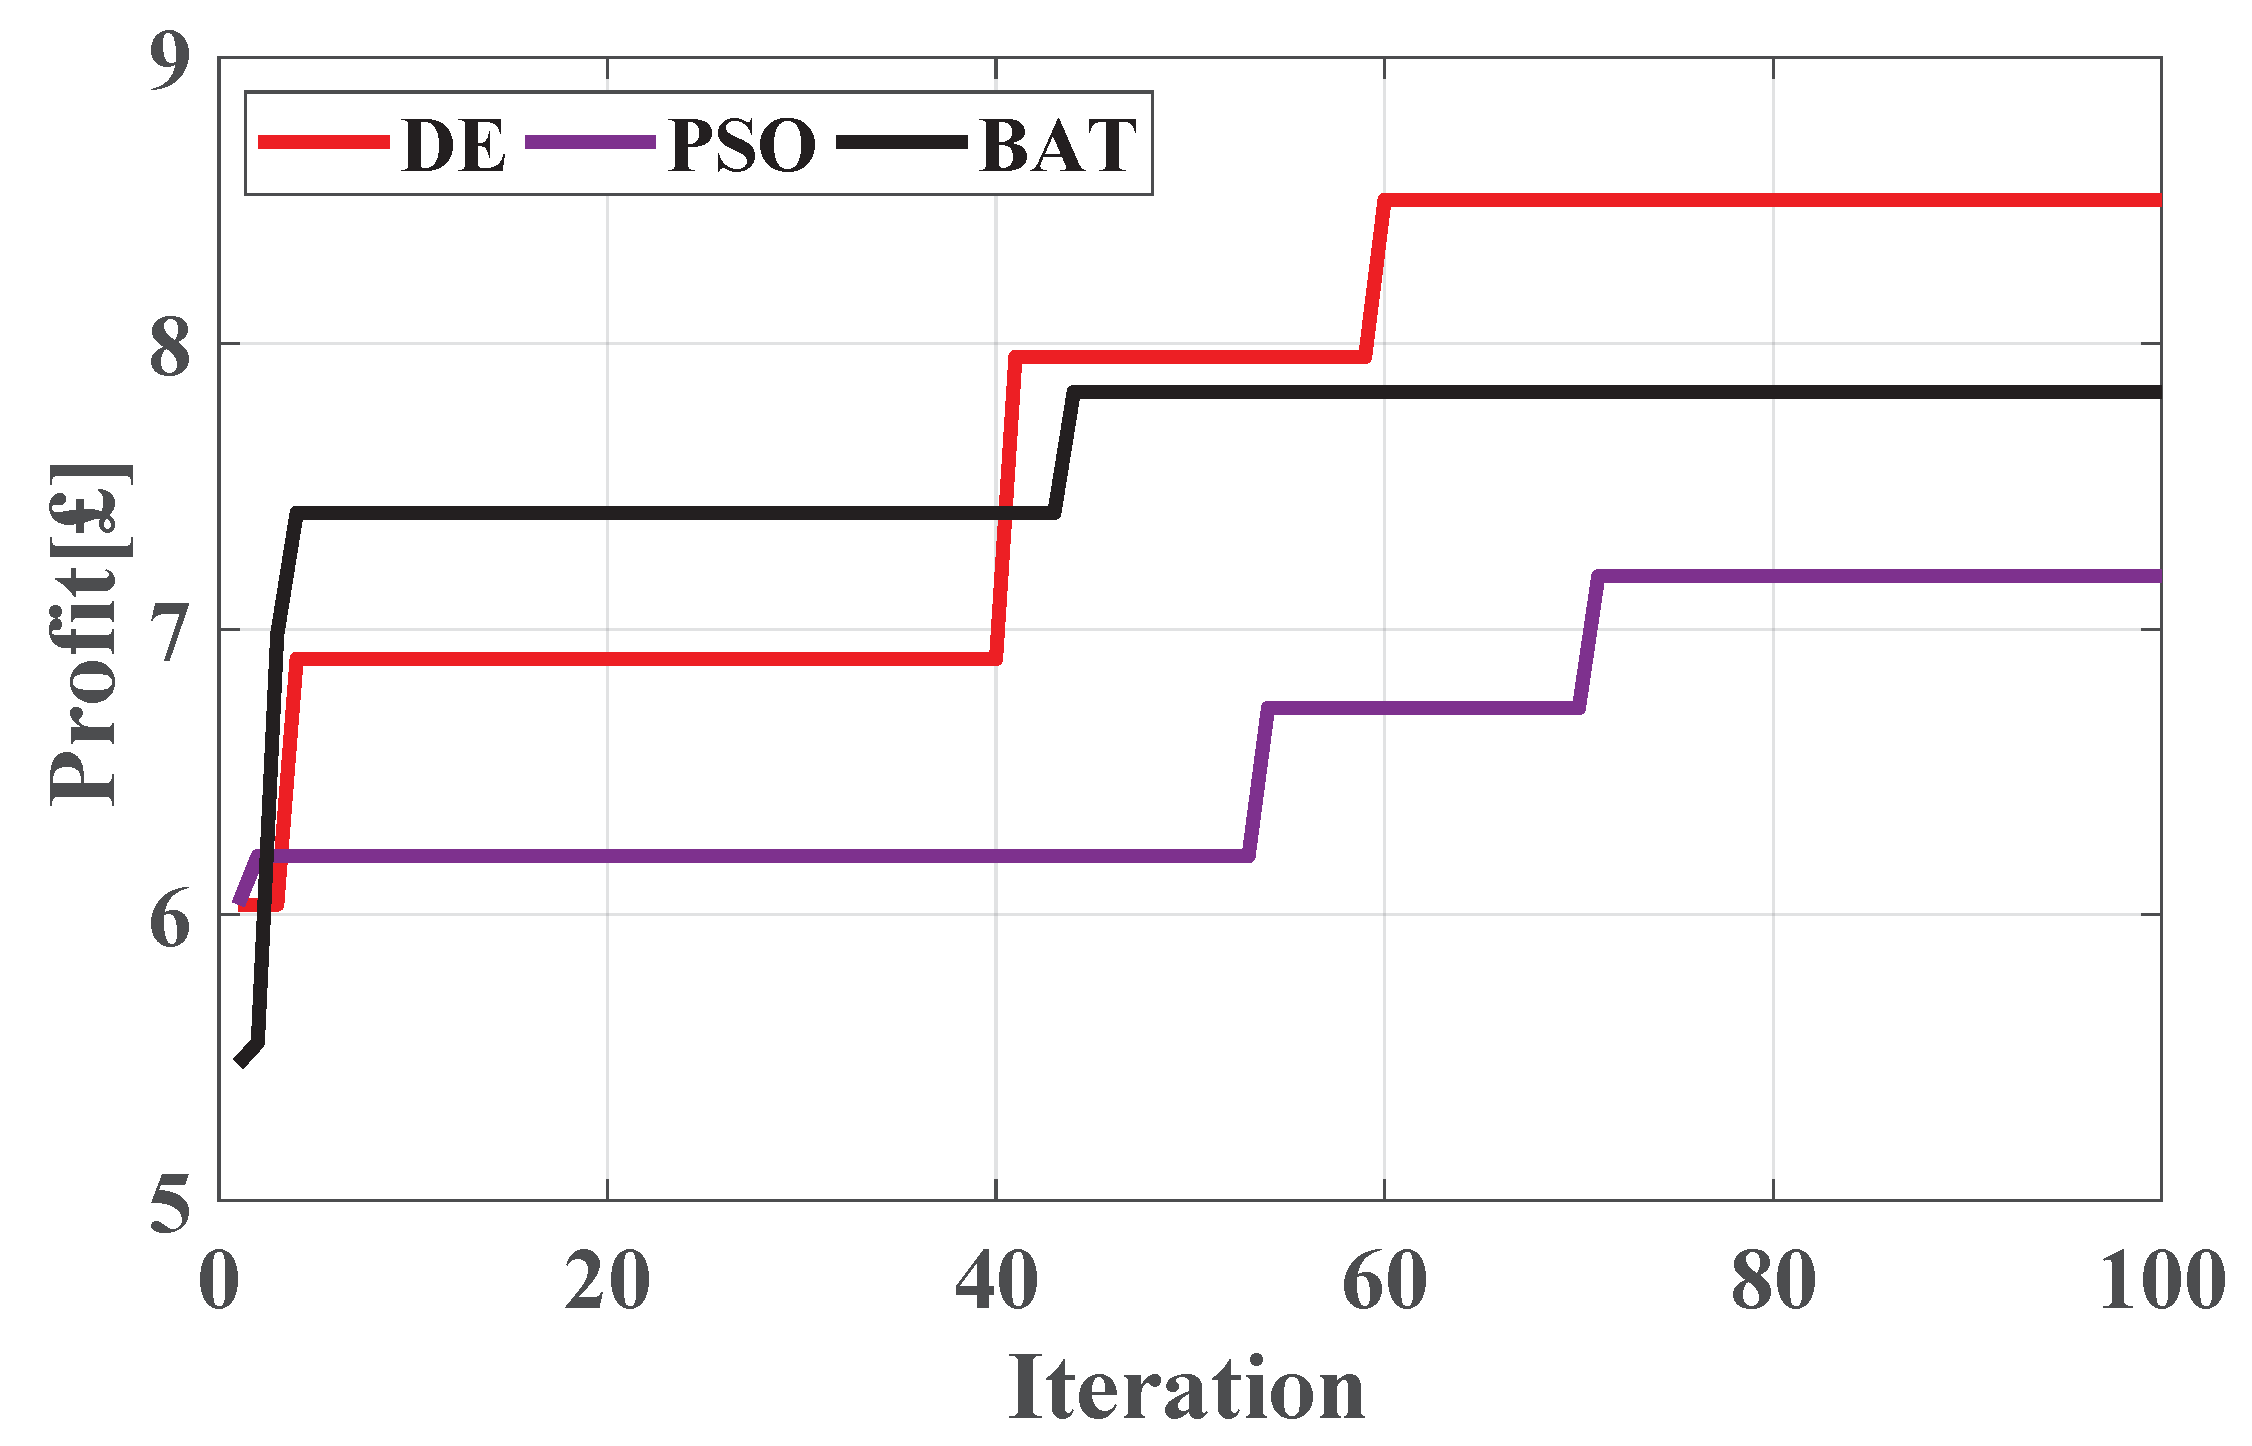
In the last period (from 18:00–24:00), the best performance was related to DE. In this range, DE has shown the best performance while the BAT has the weakest performance. DE was 28% and 47% lower than predicted by BAT and MCP, respectively. In general, the PSO and DE methods, with less than 2% difference in performance, have displayed the best results while BAT yielded the weakest. Thermal MCP is shown in Figure 11b. As seen in the first interval, the DE method had the best performance compared to PSO and BAT, so that the DE method was 49% better than the PSO, the latter having the weakest performance. In the second interval, the best performance was related to the BAT method and the weakest associated with the PSO, with a functional difference of about 55%. In the third period, the weakest and strongest performances were related to the BAT and DE methods, respectively. During this time interval, the DE method has shown 38% better performance than the BAT. In the last interval, i.e., the fourth interval, as in the previous interval, the strongest and weakest methods were DE and BAT, respectively. In this range, the DE method is 25% better than BAT. In general, as shown in Figure 11b, the best performance for decreasing the thermal MCP was related to the DE method. The convergence characteristics of the proposed algorithms were compared with each other, as demonstrated in Figure 12. As shown in this figure, each algorithm was executed for 100 iterations as an accuracy validation criterion. This figure indicates that the proposed algorithm based on the BAT method outperforms the other optimization techniques in convergence speed; however, the proposed algorithm based on DE method achieved a better performance from optimality of objective function point of view. The obtained maximum profit for DE and BAT methods are £8.5 and £7.8, with the corresponding CPU times of 8.085 s and 7.96 s, respectively. According to the results in Figure 11a,b, the most successful method for reducing electric and thermal MCP is the DE method. According to the use of several optimization methods, the standard deviation, minimum and maximum profits and average price of each method (in 50 epochs) are shown separately in Table 1.

6. Conclusions

In this paper, the DR algorithm has been proposed to reduce the costs of H-MGs, reducing air pollution and optimizing the use of electrical/thermal resources available in H-MGs. The timing of household appliances and electrical machinery is also included by considering both the technical and economic constraints. The DR-based structure was followed by demand side management, peak demand/load reduction, lowering market price and reducing air pollution. In addition, using optimization methods, an attempt has been made to optimize the objective functions of each H-MG. The indicated results and proposed structure capabilities were compared to input parameter changes using several methods. In this paper, each H-MG can form a coalition with each other, negotiating with each other in a way that satisfies its objective functions, including reducing/increasing their costs/profits, along with supplying the demand. The results show that DR, with optimal control of ES and RES, reduced the greenhouse gases emission by almost 37% and increased the total profit of H-MGs by 10%. It is easy to use the proposed algorithm for various structures with different objective functions, as well as a diverse range of generation and consumption devices. Application-wise, according to the kind of home appliances (thermal or electrical), the smart buildings, H-MGs owners and tenants can contract with an energy provider or utility grid for which scheme they want to purchase. To this end, the energy providers try to provide incentive programs to make the consumers interested (for example, the consumers by participating in DR programs, and as a result by changing their consumption pattern, help the energy provider to control total demand, thus consumers can reduce their bill). This study can be extended in the following ways: (1) evaluating other schemes of DR because the consumers feel more comfortable with the incentive-based programs; (2) mechanism design for the coalition formation between rational agents and generation units (DGs); (3) proposing the competitive approaches to model the interaction between the agents in the electricity market; (4) calculation of tax based on CO 2 (Carbon Tax); and (5) the impact of occurring faults in energy management system.

Author Contributions

All persons who meet authorship criteria are listed as authors, and all authors certify that they have participated sufficiently in the work to take public responsibility for the content, including participation in the concept, design, analysis, writing, or revision of the manuscript. Furthermore, each author certifies that this material or similar material has not been and will not be submitted to or published in any other publication before its appearance in the Applied Sciences, MDPI. All in all, the contribution of all authors is almost equal.

Funding

This research received no external funding.

Acknowledgments

Radu Godina would like to acknowledge financial support from Fundação para a Ciência e Tecnologia (grant UID/EMS/00667/2019).
The work is partially supported by the RDF studentship, the UoA12 flexible fund at the E&E faculty in Northumbria University, and the NSFC.

Conflicts of Interest

The authors declare no conflict of interest.

Nomenclature

Acronyms
AELAggregated electrical load
ATLAggregated thermal load
CHPCombine heat and power
DEDifferential evolution algorithm
DRDemand respond
DR+, DR-Amount of responsive load demand that goes/comes to/from other time period
DPDynamic Pricing
DWDish washer
DTDuration Time
DRPDemand response based on price
DREDemand response based on emission
DRPEDemand response based on price and emission
ESEnergy storage
ESPElectrical solar panel
EMSEnergy management system
EMS-DREnergy management system based on Demand respond
EMS-DRPThe EMS Algorithm Including DR based on Price
EMS-DRPEThe EMS Algorithm Including DR based on Price and Emission
ENEnergy
EVElectric vehicle
GBGas boiler
HHWHeat and hot water
H-MGHome Microgrid
MCPMarket clearing price
PSOParticle swarm optimization
REFRefrigerator
RETRetailer
SBPSystem buy price
SSPSystem sell price
SOCState of charge
TDThermal dump
TESThermal energy storage
TSPThermal solar panel
TOATTaguchi Orthogonal Array Testing
TotTotal
Indices
e/ht/h/n/E/Felectricity/heat/time interval [1,2,...,24]/H-MG number, n { 1 , 2 , , g } /Emission/Fuel
i { CHP , GB , TSP } thermal distributed energy resources
j { ESP , CHP } electrical distributed energy resources
c { DW , EV , REF , AEL } electrical consumers
k { HHW , ATL , TD } thermal consumers
Ω { CHP , GB , Retailer } Producers that emit pollution
Constant   Values
S ˇ O C m , S ^ O C m , P ˇ m , P ^ m minimum/maximum values of SOC/power during m charging and discharging mode,  m { E S d , E S c h , E V d , E V c h , T E S d , T E S c h }
T o E m total value of m energy capacity
T ^ f , T ˇ f maximum/minimum of f temperature,  f { REF , HHW }
T 0 , T R E D , T I N C initial temperature/the amount of temperature reduction each time the REF compressor is turned on/the amount of temperature increase each time HHW is turned on
P ˇ e / h t , i , P ^ e / h t , i minimum/maximum values of electrical thermal power i
ξ e / h t , i electrical and thermal efficiencies i
F U h C H P , ξ e C H P , and ξ h C H P Fuel, electrical, and thermal efficiency of the CHP
T ^ H H W , T ˇ H H W maximum/minimum values of temperature
E ^ m , E ˇ m maximum/minimum values of energy in m
π ^ p b , π ˇ p b maximum/minimum values of pb price bids
pb { i , j , c , l }
n g p h natural gas price
Decision   Variables
m h R E T , m h E S , m h T E S , m h D R binary variable of retailer, electrical energy storage, thermal energy storage, demand response
P h , e , c , P h , h t , k electrical/thermal power consumed by l/c at time h
P h t , e , i , P h t , e , j electrical/thermal power generated by j/i at time h
COCost resulting from buying energy
uUtility (profit) resulting from selling energy
π h t , e p b , π h t , h t p b electrical/thermal price bids by pb at time h
P h , e , n R E T c h , P h , e , n R E T d the electric power sold/bought by H-MG n to/from the retailer
λ h M C P MCP prediction value during each time interval h (£/kWh)
λ h , W M C P market clearing price by using the optimization method of W = { B A T , D E , P S O } (£/kWh)

References

  1. The Renewable Energy Policy Network for the 21st Century; Renewables Global Status Report. Available online: http://www.ren21.net/status-of-renewables/global-status-report/ (accessed on 31 July 2019).
  2. Tabar, V.S.; Jirdehi, M.A.; Hemmati, R. Sustainable planning of hybrid microgrid towards minimizing environmental pollution, operational cost and frequency fluctuations. J. Clean. Prod. 2018, 203, 1187–1200. [Google Scholar] [CrossRef]
  3. Shamshirband, M.; Salehi, J.; Gazijahani, F.S. Decentralized trading of plug-in electric vehicle aggregation agents for optimal energy management of smart renewable penetrated microgrids with the aim of CO2 emission reduction. J. Clean. Prod. 2018, 200, 622–640. [Google Scholar] [CrossRef]
  4. Dong, G.; Chen, Z. Data Driven Energy Management in a Home Microgrid Based on Bayesian Optimal Algorithm. IEEE Trans. Ind. Inform. 2018, 15, 869–877. [Google Scholar] [CrossRef]
  5. Hidalgo-Rodríguez, D.I.; Myrzik, J. Optimal Operation of Interconnected Home-Microgrids with Flexible Thermal Loads: A Comparison of Decentralized, Centralized, and Hierarchical-Distributed Model Predictive Control. In Proceedings of the 2018 Power Systems Computation Conference (PSCC), Dublin, Ireland, 11–15 June 2018; pp. 1–7. [Google Scholar]
  6. Ganji, M.; Shahidehpour, M. Development of a residential microgrid using home energy management systems. In Application of Smart Grid Technologies; Elsevier: Amsterdam, The Netherlands, 2018; pp. 173–192. [Google Scholar]
  7. Marzband, M.; Azarinejadian, F.; Savaghebi, M.; Pouresmaeil, E.; Guerrero, J.M.; Lightbody, G. Smart transactive energy framework in grid-connected multiple home microgrids under independent and coalition operations. Renew. Energy 2018, 126, 95–106. [Google Scholar] [CrossRef]
  8. El Amine, D.O.; Boumhidi, J. Multi agent system based on law of gravity and fuzzy logic for coalition formation in multi micro-grids environment. J. Ambient Intell. Humaniz. Comput. 2018, 9, 337–349. [Google Scholar] [CrossRef]
  9. Thakur, S.; Breslin, J.G. Peer to Peer Energy Trade Among Microgrids Using Blockchain Based Distributed Coalition Formation Method. Technol. Econ. Smart Grids Sustain. Energy 2018, 3, 5. [Google Scholar] [CrossRef] [Green Version]
  10. Yasir, M.; Purvis, M.; Purvis, M.; Savarimuthu, B.T.R. Complementary-based coalition formation for energy microgrids. Comput. Intell. 2018, 34, 679–712. [Google Scholar] [CrossRef]
  11. Aghdam, F.H.; Ghaemi, S.; Kalantari, N.T. Evaluation of loss minimization on the energy management of multi-microgrid based smart distribution network in the presence of emission constraints and clean productions. J. Clean. Prod. 2018, 196, 185–201. [Google Scholar] [CrossRef]
  12. Cai, Y.; Huang, T.; Bompard, E.; Cao, Y.; Li, Y. Self-Sustainable Community of Electricity Prosumers in the Emerging Distribution System. IEEE Trans. Smart Grid 2017, 8, 2207–2216. [Google Scholar] [CrossRef]
  13. Marzband, M.; Fouladfar, M.H.; Akorede, M.F.; Lightbody, G.; Pouresmaeil, E. Framework for smart transactive energy in home-microgrids considering coalition formation and demand side management. Sustain. Cities Soc. 2018, 40, 136–154. [Google Scholar] [CrossRef]
  14. Marzband, M.; Javadi, M.; Pourmousavi, S.A.; Lightbody, G. An advanced retail electricity market for active distribution systems and home microgrid interoperability based on game theory. Electr. Power Syst. Res. 2018, 157, 187–199. [Google Scholar] [CrossRef]
  15. Loni, A.; Parand, F.A. A survey of game theory approach in smart grid with emphasis on cooperative games. In Proceedings of the 2017 IEEE International Conference on Smart Grid and Smart Cities (ICSGSC), Singapore, 23–26 July 2017; pp. 237–242. [Google Scholar] [CrossRef]
  16. Kahrobaee, S.; Rajabzadeh, R.A.; Soh, L.K.S.; Asgarpoor, S. A multiagent modeling and investigation of smart homes with power generation, storage, and trading features. IEEE Trans. Smart Grid 2013, 3, 659–668. [Google Scholar] [CrossRef]
  17. Atzeni, I.; Ordonez, L.G.; Scutari, G.; Palomar, D.P.; Fonollosa, J.R. Demand-Side Management via Distributed Energy Generation and Storage Optimization. IEEE Trans. Smart Grid 2013, 4, 866–876. [Google Scholar] [CrossRef]
  18. Jin, M.; Feng, W.; Marnay, C.; Spanos, C. Microgrid to enable optimal distributed energy retail and end-user demand response. Appl. Energy 2018, 210, 1321–1335. [Google Scholar] [CrossRef] [Green Version]
  19. Neves, D.; Pina, A.; Silva, C.A. Assessment of the potential use of demand response in DHW systems on isolated microgrids. Renew. Energy 2018, 115, 989–998. [Google Scholar] [CrossRef]
  20. Kalavani, F.; Mohammadi-Ivatloo, B.; Zare, K. Optimal stochastic scheduling of cryogenic energy storage with wind power in the presence of a demand response program. Renew. Energy 2019, 130, 268–280. [Google Scholar] [CrossRef]
  21. Pipattanasomporn, M.; Kuzlu, M.; Rahman, S. An Algorithm for Intelligent Home Energy Management and Demand Response Analysis. IEEE Trans. 2012, 4, 659–668. [Google Scholar] [CrossRef]
  22. Althaher, S.; Mancarella, P.; Mutale, J. Management System Under Dynamic Pricing. IEEE Trans Smart Grid 2015, 6, 1874–1883. [Google Scholar] [CrossRef]
  23. Kim, B.; Lavrova, O. Two hierarchy (home and local) smart grid optimization by using demand response scheduling. In Proceedings of the 2013 IEEE PES Conference on Innovative Smart Grid Technologies (ISGT Latin America), Sao Paulo, Brazil, 15–17 April 2013. [Google Scholar]
  24. Al-Sumaiti, A.; Salama, M.; El Moursi, M.; Alsumaiti, T.; Marzband, M. Enabling Electricity Access: A Comprehensive Energy Efficient Approach Mitigating Climate/Weather Variability-Part II. IET Gener. Transm. Distrib. 2019. [Google Scholar] [CrossRef]
  25. Hassan, M.A.S.; Chen, M.; Lin, H.; Ahmed, M.H.; Khan, M.Z.; Chughtai, G.R. Optimization modeling for dynamic price based demand response in microgrids. J. Clean. Prod. 2019, 222, 231–241. [Google Scholar] [CrossRef]
  26. Lu, Q.; Lü, S.; Leng, Y. A Nash-Stackelberg game approach in regional energy market considering users’ integrated demand response. Energy 2019, 175, 456–470. [Google Scholar] [CrossRef]
  27. Wang, Z.; Paranjape, R. Optimal Residential Demand Response for Multiple Heterogeneous Homes With Real-Time Price Prediction in a Multiagent Framework. IEEE Trans. Smart Grid 2017, 8, 1173–1184. [Google Scholar] [CrossRef]
  28. Valinejad, J.; Marzband, M.; Funsho Akorede, M.; Elliott, I.; Godina, R.; Matias, J.C.D.O.; Pouresmaeil, E. Long-Term Decision on Wind Investment with Considering Different Load Ranges of Power Plant for Sustainable Electricity Energy Market. Sustainability 2018, 10, 3811. [Google Scholar] [CrossRef]
  29. Shakeri, M.; Shayestegan, M.; Abunima, H.; Reza, S.S.; Akhtaruzzaman, M.; Alamoud, A.; Sopian, K.; Amin, N. An intelligent system architecture in home energy management systems (HEMS) for efficient demand response in smart grid. Energy Build. 2017, 138, 154–164. [Google Scholar] [CrossRef]
  30. Marzband, M.; Alavi, H.; Ghazimirsaeid, S.S.; Uppal, H.; Fernando, T. Optimal energy management system based on stochastic approach for a home Microgrid with integrated responsive load demand and energy storage. Sustain. Cities Soc. 2017, 28, 256–264. [Google Scholar] [CrossRef]
  31. Aghajani, G.; Shayanfar, H.; Shayeghi, H. Demand side management in a smart micro-grid in the presence of renewable generation and demand response. Energy 2017, 126, 622–637. [Google Scholar] [CrossRef]
  32. Valinejad, J.; Firouzifar, S.; Marzband, M.; Al-Sumaiti, A.S. Reconsidering insulation coordination and simulation under the effect of pollution due to climate change. Int. Trans. Electr. Energy Syst. 2018, 28, 2595. [Google Scholar] [CrossRef]
  33. Wang, Y.; Huang, Y.; Wang, Y.; Yu, H.; Li, R.; Song, S. Energy Management for Smart Multi-Energy Complementary Micro-Grid in the Presence of Demand Response. Energies 2018, 11, 974. [Google Scholar] [CrossRef]
  34. Najafi, A.; Marzband, M.; Mohamadi-Ivatloo, B.; Contreras, J.; Pourakbari-Kasmaei, M.; Lehtonen, M.; Godina, R. Uncertainty-Based Models for Optimal Management of Energy Hubs Considering Demand Response. Energies 2019, 12, 1413. [Google Scholar] [CrossRef]
  35. Javadi, M.; Marzband, M.; Funsho Akorede, M.; Godina, R.; Saad Al-Sumaiti, A.; Pouresmaeil, E. A Centralized Smart Decision-Making Hierarchical Interactive Architecture for Multiple Home Microgrids in Retail Electricity Market. Energies 2018, 11, 3144. [Google Scholar] [CrossRef]
  36. Li, W.; Li, T.; Wang, H.; Dong, J.; Li, Y.; Cui, D.; Ge, W.; Yang, J.; Onyeka Okoye, M. Optimal Dispatch Model Considering Environmental Cost Based on Combined Heat and Power with Thermal Energy Storage and Demand Response. Energies 2019, 12, 817. [Google Scholar] [CrossRef]
  37. Mirzaei, M.A.; Yazdankhah, A.S.; Mohammadi-Ivatloo, B.; Marzband, M.; Shafie-khah, M.; Catalão, J.P. Stochastic network-constrained co-optimization of energy and reserve products in renewable energy integrated power and gas networks with energy storage system. J. Clean. Prod. 2019, 223, 747–758. [Google Scholar] [CrossRef] [Green Version]
  38. Nwulu, N.I.; Xia, X. Optimal dispatch for a microgrid incorporating renewables and demand response. Renew. Energy 2017, 101, 16–28. [Google Scholar] [CrossRef]
  39. Behboodi, S.; Chassin, D.P.; Crawford, C.; Djilali, N. Renewable resources portfolio optimization in the presence of demand response. Appl. Energy 2016, 162, 139–148. [Google Scholar] [CrossRef] [Green Version]
  40. Ghasemi, G.; Noorollahi, Y.; Alavi, H.; Marzband, M.; Shahbazi, M. Theoretical and technical potential evaluation of solar power generation in Iran. Renew. Energy 2019, 138, 1250–1261. [Google Scholar] [CrossRef] [Green Version]
  41. Al-Betar, M.A.; Awadallah, M.A. Island bat algorithm for optimization. Expert Syst. Appl. 2018, 107, 126–145. [Google Scholar] [CrossRef]
  42. Najari, S.; Gróf, G.; Saeidi, S.; Gallucci, F. Modeling and optimization of hydrogenation of CO2: Estimation of kinetic parameters via Artificial Bee Colony (ABC) and Differential Evolution (DE) algorithms. Int. J. Hydrogen Energy 2019, 44, 4630–4649. [Google Scholar] [CrossRef]
  43. Hossain, M.A.; Pota, H.R.; Squartini, S.; Abdou, A.F. Modified PSO algorithm for real-time energy management in grid-connected microgrids. Renew. Energy 2019, 136, 746–757. [Google Scholar] [CrossRef]
  44. Live CO2 Emissions of Electricity Consumption. Available online: www.electricitymap.org (accessed on 31 July 2018).
  45. Day Ahead Energy Market. Available online: http://www.pjm.com/markets-and-operations/energy/day-ahead.aspx (accessed on 24 September 2018).
  46. Marzband, M.; Sumper, A.; Ruiz-Álvarez, A.; Domínguez-García, J.L.; Tomoiagă, B. Experimental evaluation of a real time energy management system for stand-alone microgrids in day-ahead markets. Appl. Energy 2013, 106, 365–376. [Google Scholar] [CrossRef]
  47. Marzband, M.; Javadi, M.; Domínguez-García, J.L.; Moghaddam, M.M. Non-cooperative game theory based energy management systems for energy district in the retail market considering DER uncertainties. IET Gener. Transm. Distrib. 2016, 10, 2999–3009. [Google Scholar] [CrossRef]
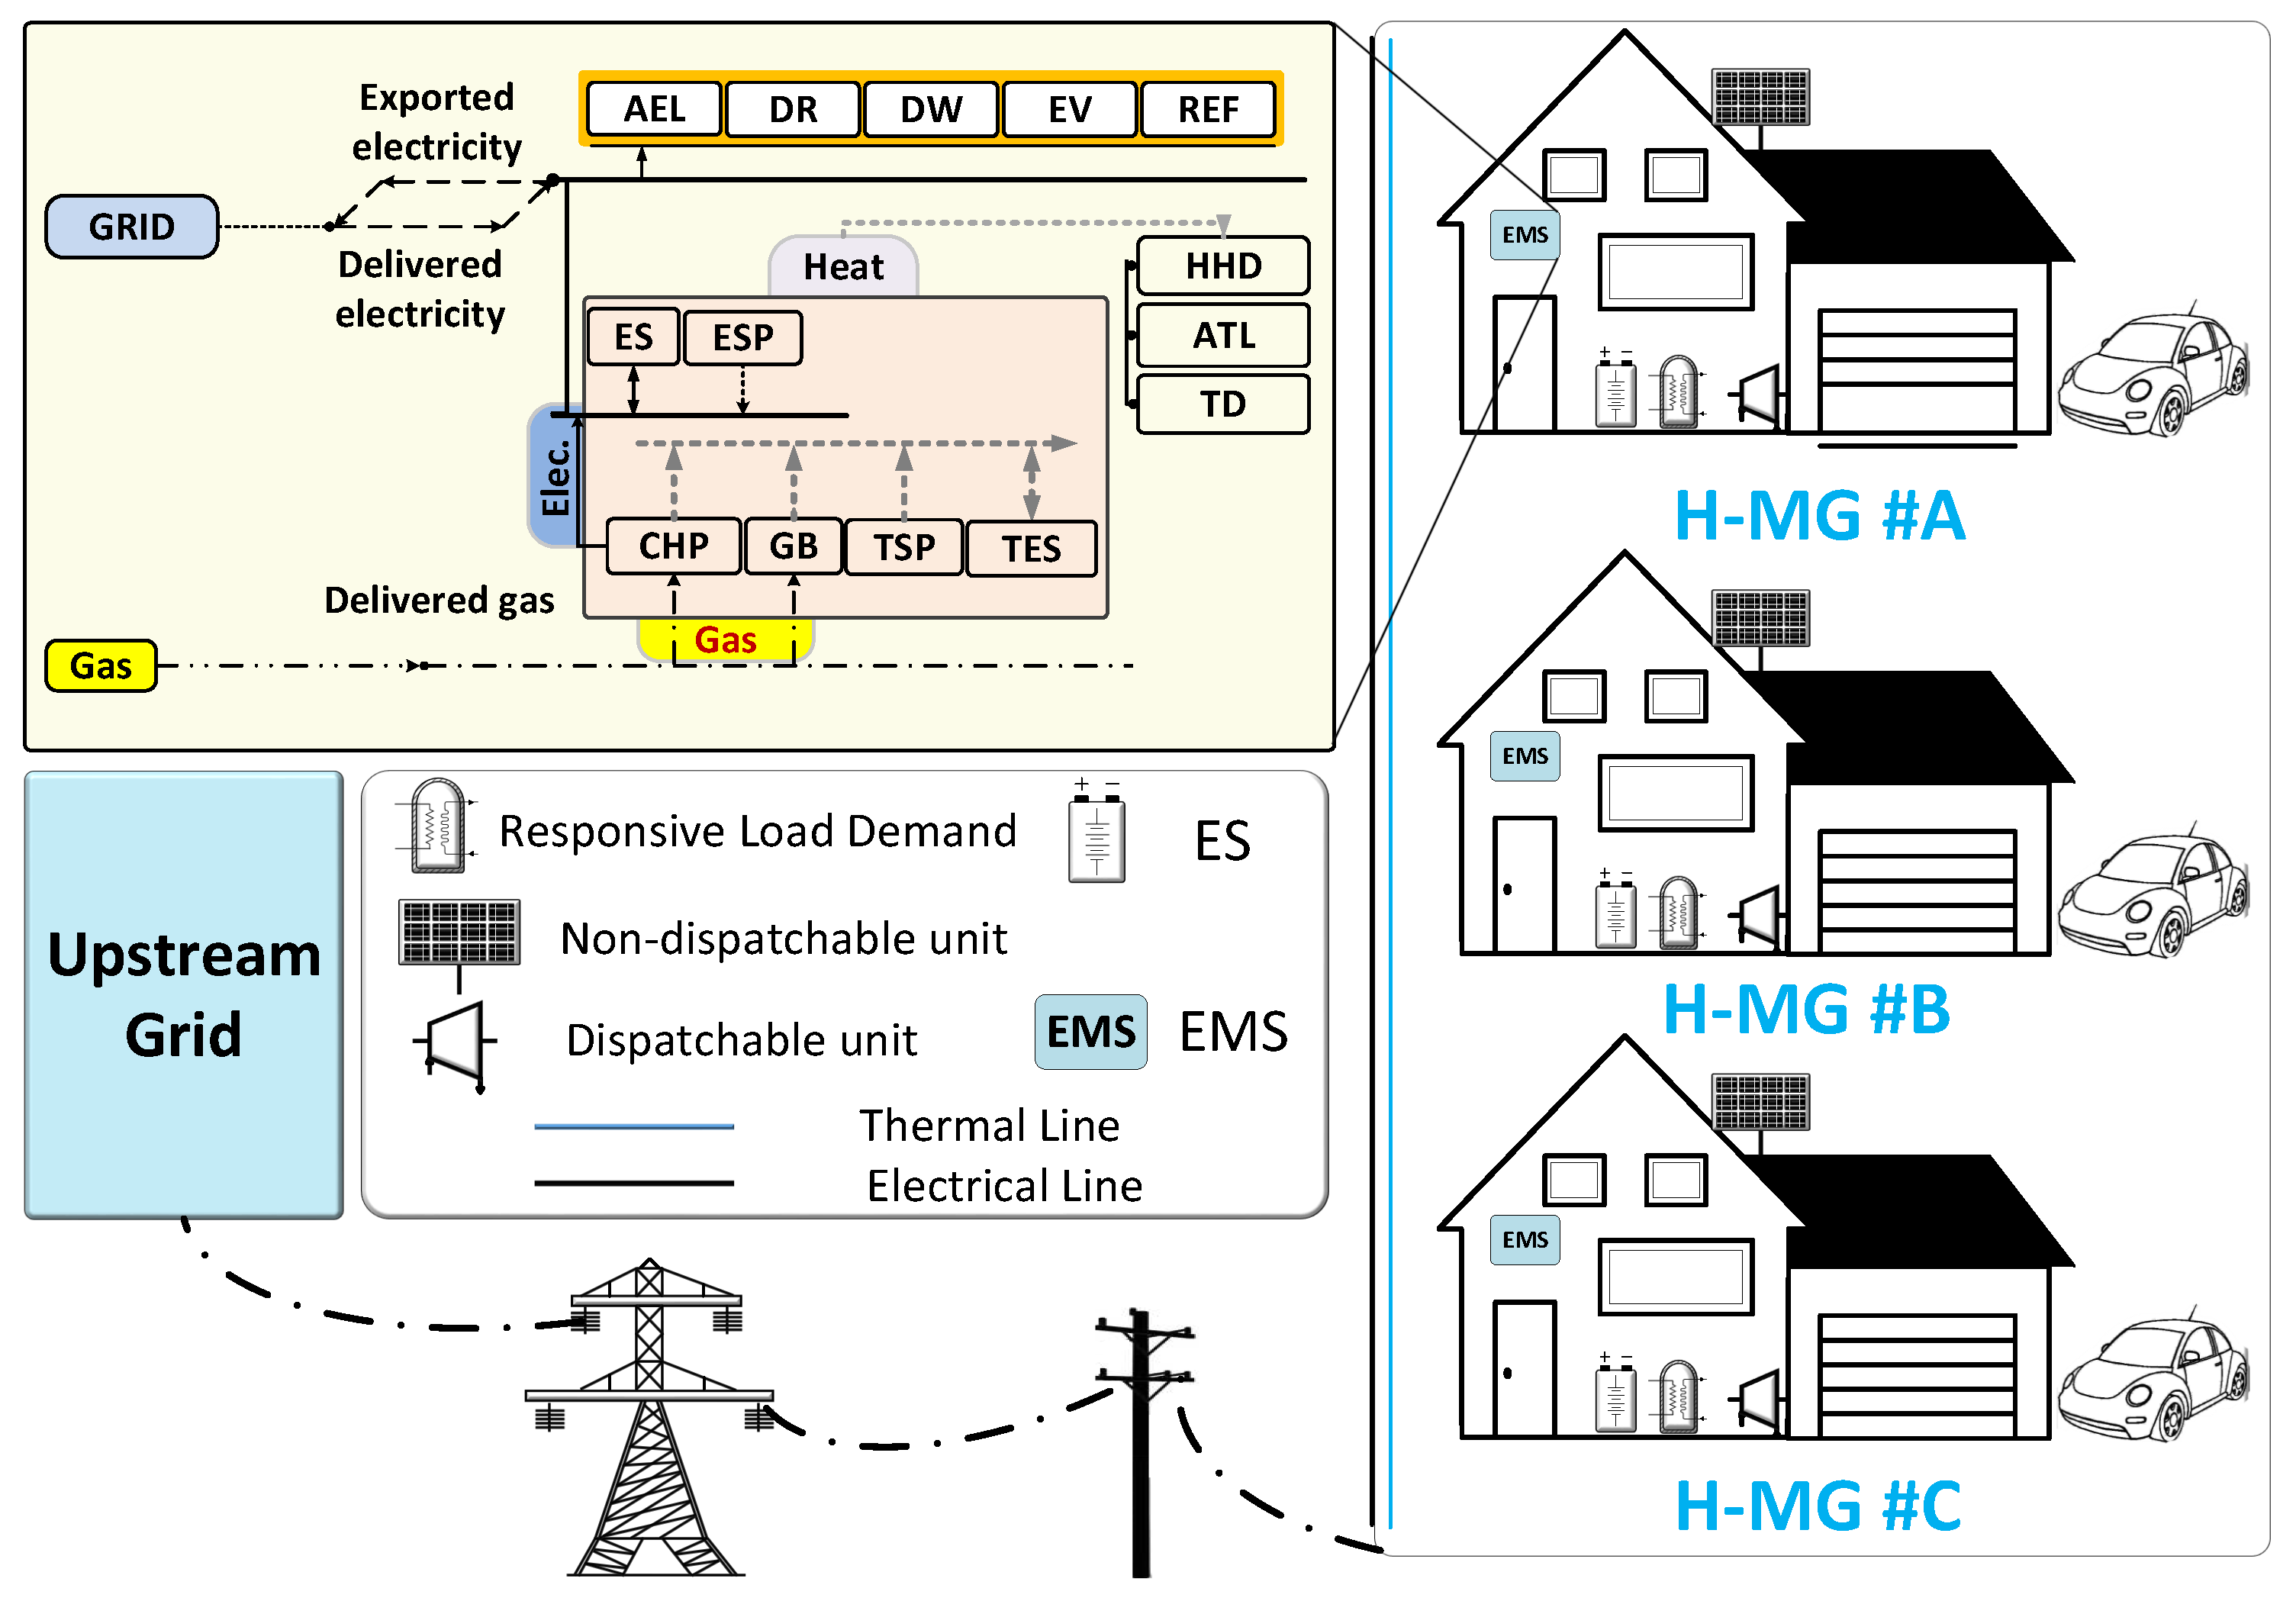
Figure 1. A schematic of the general idea.
Applsci 09 02097 g001
Figure 2. Flowchart of the proposed algorithm.
Applsci 09 02097 g002
Figure 3. Flowchart of EMS-DRP.
Applsci 09 02097 g003
Figure 4. Flowchart of EMS-DRE (Electrical and Thermal Sections).
Applsci 09 02097 g004
Figure 5. Flowchart of EMS-DRPE (Electrical Section).
Applsci 09 02097 g005
Figure 6. The schematic diagram of Market Clearing Price (MCP).
Applsci 09 02097 g006
Figure 7. Load Demand Profile Consumed in: (a) H-MG #A; (b) H-MG #B; and (c) H-MG #C.
Applsci 09 02097 g007
Figure 8. Percentage of electrical power produced by the implemented methods.
Applsci 09 02097 g008
Figure 9. Percentage of thermal power produced by the implemented methods.
Applsci 09 02097 g009
Figure 10. Air pollution in H-MGs.
Applsci 09 02097 g010
Figure 11. Electrical/thermalMCPprofile at a time intervalunder 24-hoperationbydifferent optimizationmethods.
Applsci 09 02097 g011
Figure 12. Convergence characteristics of the proposed algorithms.
Applsci 09 02097 g012
Table 1. Comparison of deviation, average and minimum cost between applied optimization methods.
MethodNumber of RunMinimum ProfitMaximum ProfitAverege ProfitStandard Deviation
DE1006.038.507.850.77
BAT1005.407.807.710.33
PSO1006.037.186.540.43