Article

Vibration Control of an Aero Pipeline System with Active Constraint Layer Damping Treatment

1
School of Mechanical Engineering, Dalian University of Technology, Dalian 116024, China
2
School of Electromechanical and Automotive Engineering, Yantai University, Yantai 264005, China
*
Author to whom correspondence should be addressed.
Appl. Sci. 2019, 9(10), 2094; https://doi.org/10.3390/app9102094
Submission received: 30 March 2019 / Revised: 11 May 2019 / Accepted: 17 May 2019 / Published: 21 May 2019

Abstract

:
In this paper, vibration control of an aero pipeline system using active constrained layer damping treatment has been investigated in terms of the vibration and stress distribution. A three-dimensional finite element model of such a pipeline with active constrained layer damping (ACLD) patches is developed. The transfer of the driving force under harmonic voltage is analyzed based on the finite element model. The vibration control of the pipeline with active constrained layer damping treatment under different voltages is computed to analyze the influence of control parameters and structural parameters on the control effect. An experiment platform is developed to validate the above relations. Results show that the performance of the active constrained layer damping treatment is affected by the elastic modulus and thickness of the viscoelastic layer, control voltage and structure size. The performance increases significantly with the rising of the control voltage and cover area of ACLD patches among these parameters.

Graphical Abstract

1. Introduction

Pipeline systems are widely used in engineering fields and play an important role in energy transmission in civil and military industries. The system is mainly composed of structural parts such as the pipeline body, joint, sealing element, clamp, valve and so on. Due to the installation requirements of different industrial equipment, the arrangement of the pipeline system has strict limitations. Therefore, higher requirements are placed on the stability and reliability of the piping system to avoid failure.
Pipeline vibrations are a major problem that needs to be faced to improve the pipeline’s stability and reliability. The excitations of vibration mainly come from: the actuator in the hydraulic system, pulsation excitation of the fluid output by the pump, and pulsation shock caused by movement of components such as valves. When the excitation frequency is close to the modal frequency of the pipeline, resonation of pipeline occurs, causing damage and failure.
For a long time, pipeline system failures caused by vibrations have been very common and the economic losses caused have also been enormous. The main pipeline failures are: burst, collision, wear, joint loose, clamp failure, ferrule crack and so on. For example, oil leakage, joints and seal failures often occur in the hydraulic pipeline systems of engineering machinery; bursts and valve damage often occur in marine hydraulic systems; collisions, clamp failure and ferrule crack often occur in aviation hydraulic piping systems. These failures not only cause equipment damage and major safety accidents, but also cause great safety hazards for equipment users. Therefore, it is necessary to effectively control the vibrations of a pipeline system.
Much research on the vibration mechanism of pipelines has been carried out by scholars. It is generally believed that the main causes of pipeline vibration are complex coupled vibration of hydraulic fluid and the coupled effect of components and substance in hydraulic systems. The vibration control of a pipeline is used to control the path of vibration transmission and dissipate the vibration energy of the system [1,2,3,4,5,6]. This field has been utilized by some researchers. Vibration control can be divided into passive control and active control on the basis of the mechanism.
Passive vibration control mainly includes measures of changing the ratio of the external excitation frequency and the modal frequency of the pipeline, increasing the structural damping, shifting the resonance frequency of a pipeline and dissipating the vibration energy. The traditional passive control method was to deploy a number of inertial attachments [7]. Some researchers [8,9,10] developed the emerging pounding tuned mass damper (PTMD) technology and explored its application with various materials. Experimental results demonstrate that the single-sided PTMD was a cost-effective method for efficiently and passively mitigating the vibration of suspended piping systems compared with the traditional tuned mass damper (TMD). Passive vibration control has the advantages of a clear damping mechanism, simple structure, no energy input and being easy to implement. However, its control frequency range is narrow, and it can only effectively control high-order vibration frequency [11]. The effect on low-frequency vibration is satisfactory. The control parameters cannot change with the excitation environment effectively, so the passive control effect is limited.
Active vibration control of the pipeline generally needs to collect the vibration signal of the pipeline system through the sensors, then transmits the signal to the upper computer and obtains the control signal through a certain control algorithm [12,13]. In the end, the control signal is applied on the actuation component to control the vibration of the pipeline system. The existing active control methods of pipelines mainly include: (1) controlling the pressure pulsation amplitude inside the pipeline system through active control components. (2) controlling the vibration of the pipeline through the active control components. The research on the control method of ACLD structure is still insufficient. The control methods used by most researchers are PD control and simple LQC control. PD control is too simple, and simple LQC control is difficult to make optimal in practical applications due to various conditions [14,15,16]. The existing active vibration control on different objects [17,18,19,20,21] has a better control effect on low frequency, strong adaptability to the external environment, and can automatically follow the change of vibration characteristics [22]. The design flexibility is great, but the closed-loop control system has many links, and the stability of the system needs to be further improved.
In recent years, some scholars have proposed a new active control method, that is, the active constraint layer damping (ACLD) treatment. The mechanism of this method is: (1) Actively adjusting the damping characteristic of the substrate through the active constraint layer damping. When the substrate vibrates, the viscoelastic damping layer takes shear deformation and dissipates the vibration energy. Meanwhile the deformation of the active constraint layer increases the shear deformation of the viscoelastic layer to improve the energy dissipation of vibration. (2) The active constraint layer damping treatment has a similar damping effect as an active damping control system. Due to the active control strategy, the ACLD structure not only greatly reduces the weight of the system, but also effectively enhances the dissipation of vibration energy. Some scholars [23,24,25] have analyzed the effectiveness of ACLD in vibration control from a structural perspective. Application of ACLD treatment on vibration control of different objects is also a major research area [26,27]. These studies showed that: (1) ACLD can effectively suppress the vibration of the controlled structure; (2) the ACLD structure can suppress the vibration level of the passive structure more effectively than the pure passive damping structure; (3) The active control part of the ACLD structure is capable of adaptively adjusting the structural damping, while the passive control part can increase the gain and phase margin of the control system. However, existing research focused mainly on the damping mechanism of ACLD and its application on plates and cylindrical shells. Research about ACLD treatment and the influence of its control parameters in pipeline vibration control, especially in the field of aero pipeline system is less common.
In this paper, a method of applying ACLD to vibration control of aero pipeline is proposed based on the vibration and stress distribution. The driving force transmission characteristics under different voltages were analyzed. The numerical calculation of the vibration control of the pipeline with ACLD patches under different voltages is carried out. The effectiveness of the proposed method on vibration control is verified, and the influence of control parameters and structural parameters on the vibration control effect is analyzed. The vibration control platform was built, and the voltage negative feedback control software and vibration monitoring software were developed. The influence of structure parameters and control parameters on the damping effect shows that the ACLD treatment has a favorable damping effect on the vibration of pipelines.

2. Materials and Methods

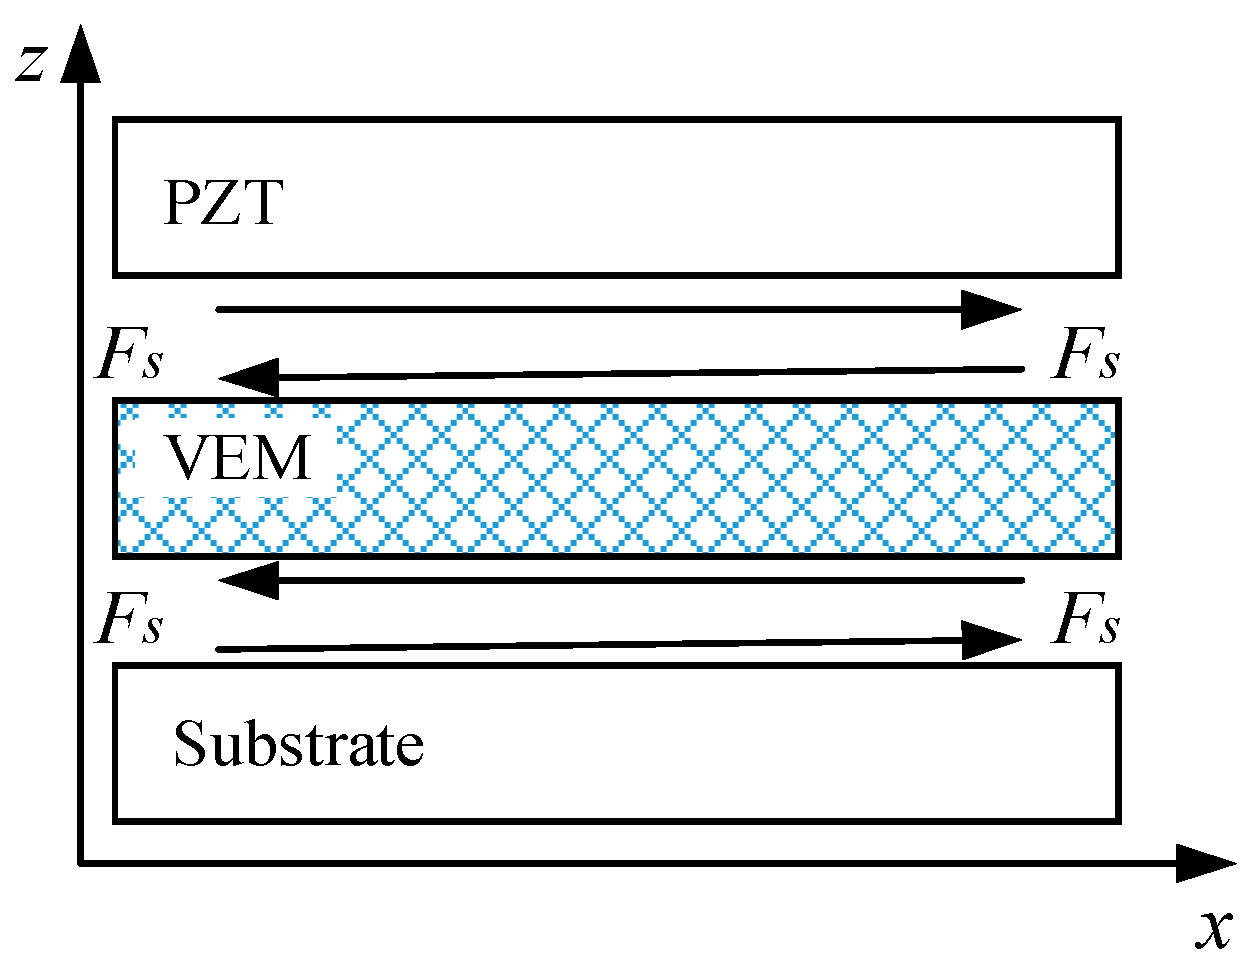
2.1. Theoretical Modeling of Active Constraint Layer Damping

When establishing the model of driving force between layers of ACLD, the force between the active constraint layer and the pipeline is concentrated at both ends of the active constraining layer according to the assumptions of the point-force model proposed by Crawley [28]. The driving force of the active constraint layer is transmitted to the substrate through the points on the edges of the two ends and the viscoelastic layer.
When a harmonic voltage is applied to the active constraint layer, the active constraint layer adhered to the surface of the pipeline generates strain due to the inverse piezoelectric effect, thereby generating stress and transmitting it to the pipeline through the viscoelastic layer in the form of shear force. Thus, the influence on the pipeline can be expressed by an equivalent pair of balanced forces and couples at the midpoint of the section of the pipeline. The driving force schematic of the active constraint layer has been shown in Figure 1 and Figure 2. PZT is the piezoelectric transducer and VEM is the viscous-elastic material. F s is a pair of balance force between two layers. T 1 is the tension along the x axis. σ 1 and M 1 are the stress and internal forces of the pipeline, respectively.
The relationship of stress and strain on the viscoelastic layer can be expressed as:
τ = G γ = G u ( x , t ) h ,
where τ is the shear stress between the active constraint layer and the viscoelastic layer; G is the shear modulus of the viscoelastic layer, which satisfies G = E / [ 2 ( 1 + ν ) ] ; E is the elastic modulus of viscoelastic layer; ν is the Poisson’s ratio for viscoelastic layer; γ is the tangent strain of viscoelastic layer; h is the thickness of the viscoelastic layer.
When a harmonic voltage is applied to the active constrained layer, the stress analysis of the active constrained layer is conducted using the infinitesimal ( d x ). According to the theory of elastic dynamics, the dynamic equation is established:
T 1 x + τ h = ρ p 2 u ( x , t ) t 2 .
The stress which active constraint layer acts on the matrix and T 1 are the force and reaction force. ρ p is the density of the piezoelectric ceramics. Therefore, according to the second type of piezoelectric equation, it can be deduced that:
c 11 e 2 u ( x , t ) x 2 + G u ( x , t ) h h p = ρ p 2 u ( x , t ) t 2 ,
where c 11 e is the elastic stiffness constant, h p is the thickness of PZT.
The rearranged equation can be expressed as:
2 u ( x , t ) t 2 λ 2 2 u ( x , t ) x 2 ξ 2 u ( x , t ) = 0 ,
where λ = c 11 e / ρ p , ξ = G / ρ P h h p .
When active constraint layer is stimulated by voltage U = U 0 sin ( ω t ) , the analytic solution of the above kinetic equations can be expressed as:
u 0 = C 1 cos ( β x ) + C 2 sin ( β x ) ,
where
β = ω 2 + ξ 2 λ = ρ p h h p ω 2 + G c 11 e h h p .
Under the action of a simple harmonic AC voltage, the displacement of the active constraint layer attached to the surface of the substrate is as follows:
u ( x , t ) = Δ l β sec β l 2 sin ( β x ) sin ( ω t ) .
According to the second type of piezoelectric equation and the relation of stress and strain, it can be inferred that the stress distribution of the active constraint layer attached to the surface of the substrate is:
T 1 = c 11 e S 1 e 31 E 3 = c 11 e Δ l [ sec β l 2 cos ( β x ) 1 ] sin ( ω t ) .
According to the relation of stress and strain on the viscoelastic layer, the expression of the shear stress transmitted by the viscoelastic layer can be derived as:
τ = G γ = G Δ l sec β l 2 β h sin ( β x ) sin ( ω t ) .
Since the modeling is based on the point-force model assumption, the driving force of the active constraint layer is transmitted to the substrate through points on both edges. Therefore, the total shear force transmitted by the viscoelastic layer to the substrate is:
F s = G Δ l b β 2 h ( sec β l 2 1 ) sin ( ω t ) ,
where b is the width of the active constraint layer. When the excitation applied to the active constraint layer, the force between the active constraint layer and the structure is equivalent to the eccentric load on the surface of the substrate in the direction parallel with the axis, which causes the bending and deformation of the substrate.

2.2. Transform of Piezoelectric Parameters Matrix

The structural and performance parameters of each layer are shown in the Table 1 and Table 2 respectively. As shown in the Figure 3 arc piezoelectric ceramics are adopted to fit the pipeline well and polarized along the thickness.
The parameters of piezoelectric ceramics adopted in this paper are shown in Table 3.
The anisotropic stiffness matrix of the piezoelectric ceramics (polarized in Z direction) is as follows:
C = [ c 11 c 12 c 13 0 0 0 c 21 c 11 c 23 0 0 0 c 31 c 32 c 33 0 0 0 0 0 0 c 44 0 0 0 0 0 0 c 55 0 0 0 0 0 0 c 66 ] = [ 13.9 7.78 7.43 7.78 13.9 7.43 7.43 7.43 11.5 2.56 2.56 3.06 ] × 10 10
The electrical parameters of piezoelectric materials include: resistivity, dielectric constant and piezoelectric constants. The dielectric constants of piezoelectric materials used in this paper are as follows:
ε 11 s = ε 11 r s   ε 0 = 370 × 8.84 × 10 12 = 3.27 × 10 9 ,
ε 22 s = ε 22 r s   ε 0 = 370 × 8.84 × 10 12 = 3.27 × 10 9 ,
ε 33 s = ε 33 r s   ε 0 = 635 × 8.84 × 10 12 = 5.613 × 10 9 .
E-Type piezoelectric equation is adopted in the piezoelectric coupling analysis in this paper:
{ T = c E S e E D = e S + ε S E ,
where T is the mechanical stress, S is the mechanical strain, D is the electrical displacement, and E is the electric field intensity. Piezoelectric parameters e i j is used to calculate the e matrix, the parameters are entered as a datasheet, and the parameters in the matrix will change according to the different order of the polarization direction. The piezoelectric stress of piezoelectric ceramics adopted in this paper is as follows:
e = [ e 31 e 31 e 33 e 15 e 15 ] = [ 5.2 5.2 15.1 12.7 12.7 ] .
The arc piezoelectric material is polarized in radial direction, while the section of pipeline and piezoelectric materials are defined as X-Y plane when modeling. Therefore, the matrix needs to be transformed to the X-Direction polarized state. The final piezoelectric parameter matrix of the piezoelectric material is thus shown below.
Elastic constant matrix (X-Direction polarized):
C = [ c 33 c 13 c 13 0 0 0 c 13 c 11 c 12 0 0 0 c 13 c 12 c 11 0 0 0 0 0 0 c 44 0 0 0 0 0 0 c 66 0 0 0 0 0 0 c 44 ] = [ 11.5 7.43 7.43 7.43 13.9 7.78 7.43 7.78 13.9 2.56 3.06 2.56 ] × 10 10 .
Dielectric constant matrix (X-Direction polarized):
ε = ε 0 ε r = ε 0 [ ε r 33 ε r 11 ε r 11 ] = [ 5.61 3.27 3.27 ] × 10 9 .
Piezoelectric stress constant matrix (X-Direction polarized):
e = [ e 33 e 31 e 31 e 15 e 15 ] = [ 15.1 5.2 5.2 12.7 12.7 ] .

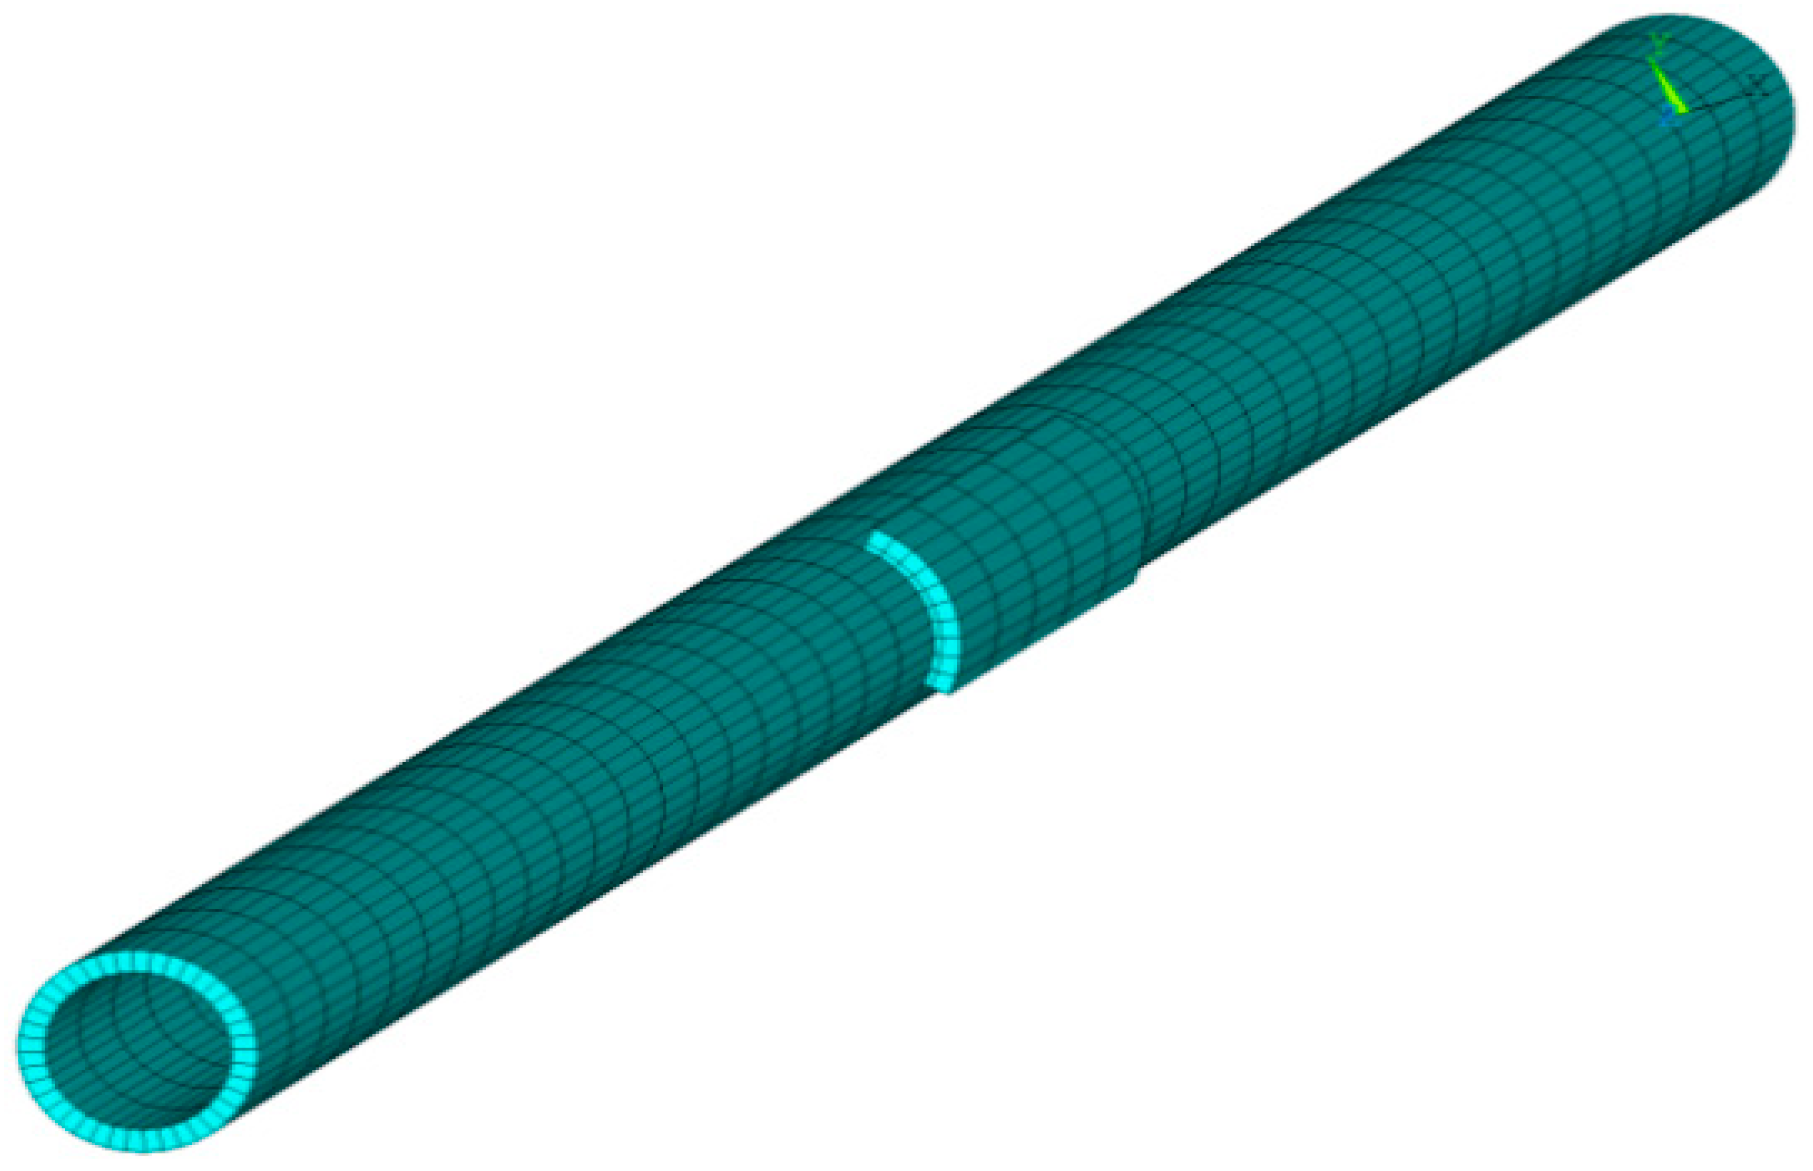
2.3. FEM Model of ACLD Patches

A pipeline with ACLD patch is modeled by the modeling sub-module in the preprocessing of ANSYS, and the three-dimensional model of each layer structure is obtained by the CYLIND command. The geometric model is shown in Figure 4. The uppermost layer is a piezoelectric constraint layer; the middle layer is a viscoelastic layer; and the third one is the upper surface of a pipeline. The properties of each layer are shown in Table 2.
The adjacent surfaces of each layer structure are bonded to make it a whole using the bonding command in ANSYS while giving different material properties to different bodies. The force and deformation transfer between the layers can correspond with the actual situation. The meshing method is carried out by sweeping command: the unit size is 0.001 mm. The finite element model shown in Figure 5 consists of 60,034 nodes and 18,013 units.
The viscoelastic layer and the pipeline are modeled using a Solid186 unit, which is a three-dimensional solid structure with 20 nodes (each node have three translational degrees of freedom UX, UY, UZ). Since the piezoelectric constraint layer is an electromechanical device, the unit type must support the piezoelectric coupling analysis. The unit types that support coupled field analysis in ANSYS are Plane13, Solid5, Solid98 and so on. The Solid5 unit can be used to analyze electric fields, magnetic fields, piezoelectric fields, structural fields, thermal fields and to form limited coupling between fields. The Solid5 unit has 8 nodes while each node has 6 degrees of freedom. In this research, 4 degrees of freedom are used, which are the translational degrees of freedom in the X, Y, and Z axis (UX, UY, UZ) and VOLT degree of freedom.
Fixed constraints are applied at both ends of the pipeline. The upper and lower surfaces of the piezoelectric constraint layer need to be applied with a voltage. Through the node coupling command, the minimum node number is obtained. Then a voltage of 50 V is applied on the node. The boundary conditions are shown in Figure 6 and Figure 7.
When the base of the installed pipeline vibrates, the vibration energy is transmitted to the pipeline through the support. When the vibration frequency of the base is close to the modal frequency of the pipeline, a large vibration of the tubular body is caused. The finite element analysis software is used to analyze the transient response of the pipeline with the ACLD patches at the root, and the response of the intermediate node of the pipeline is considered when different voltages are applied. The damping performance of the ACLD patches is investigated.
By using a sinusoidal excitation of the piping system and extracting its frequency domain response, the loss factor η or damping ratio ζ of the piping system can be identified using the half power bandwidth method. The structural damping of the pipeline can be regarded as Rayleigh damping,
C = α M + β K ,
where, α and β are the Rayleigh damping coefficients and meet the equation below with the damping ratio ζ of the pipeline.
α 2 × ω 0 + β ω 0 2 = ζ ,
The Rayleigh damping coefficient calculated by Equation (21) is: α = 14.903 , β = 2.4 × 10 6 .
The selected pipeline structural parameters and material parameters are as Table 1 and Table 3. The basic excitation is applied to the entire pipeline structure, using a constant acceleration amplitude excitation, a = 0.2 × g × sin ( 2 × π × 375 × t ) , the voltage on piezoelectric constraint layer is U = 0 V, and the pipeline is fixed at both ends to constrain all node degrees of the end face of the pipeline. The integral time step is Δ t = 0.000125 s . The first load is a step load, and the subsequent loads are gradient loads. The acceleration response curve of the node near the middle of the tube in the time domain is shown in Figure 8. The applied excitation frequency is close to the first-order natural frequency of the pipeline at the fixed boundary of both ends, thus resulting in the resonance of the pipeline.

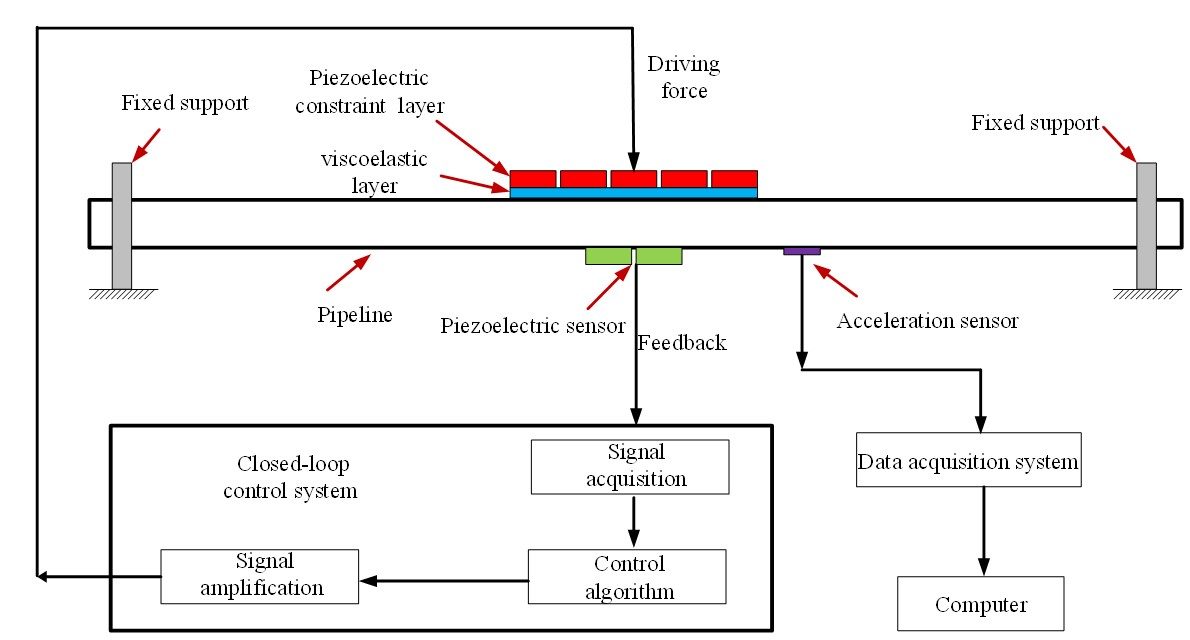
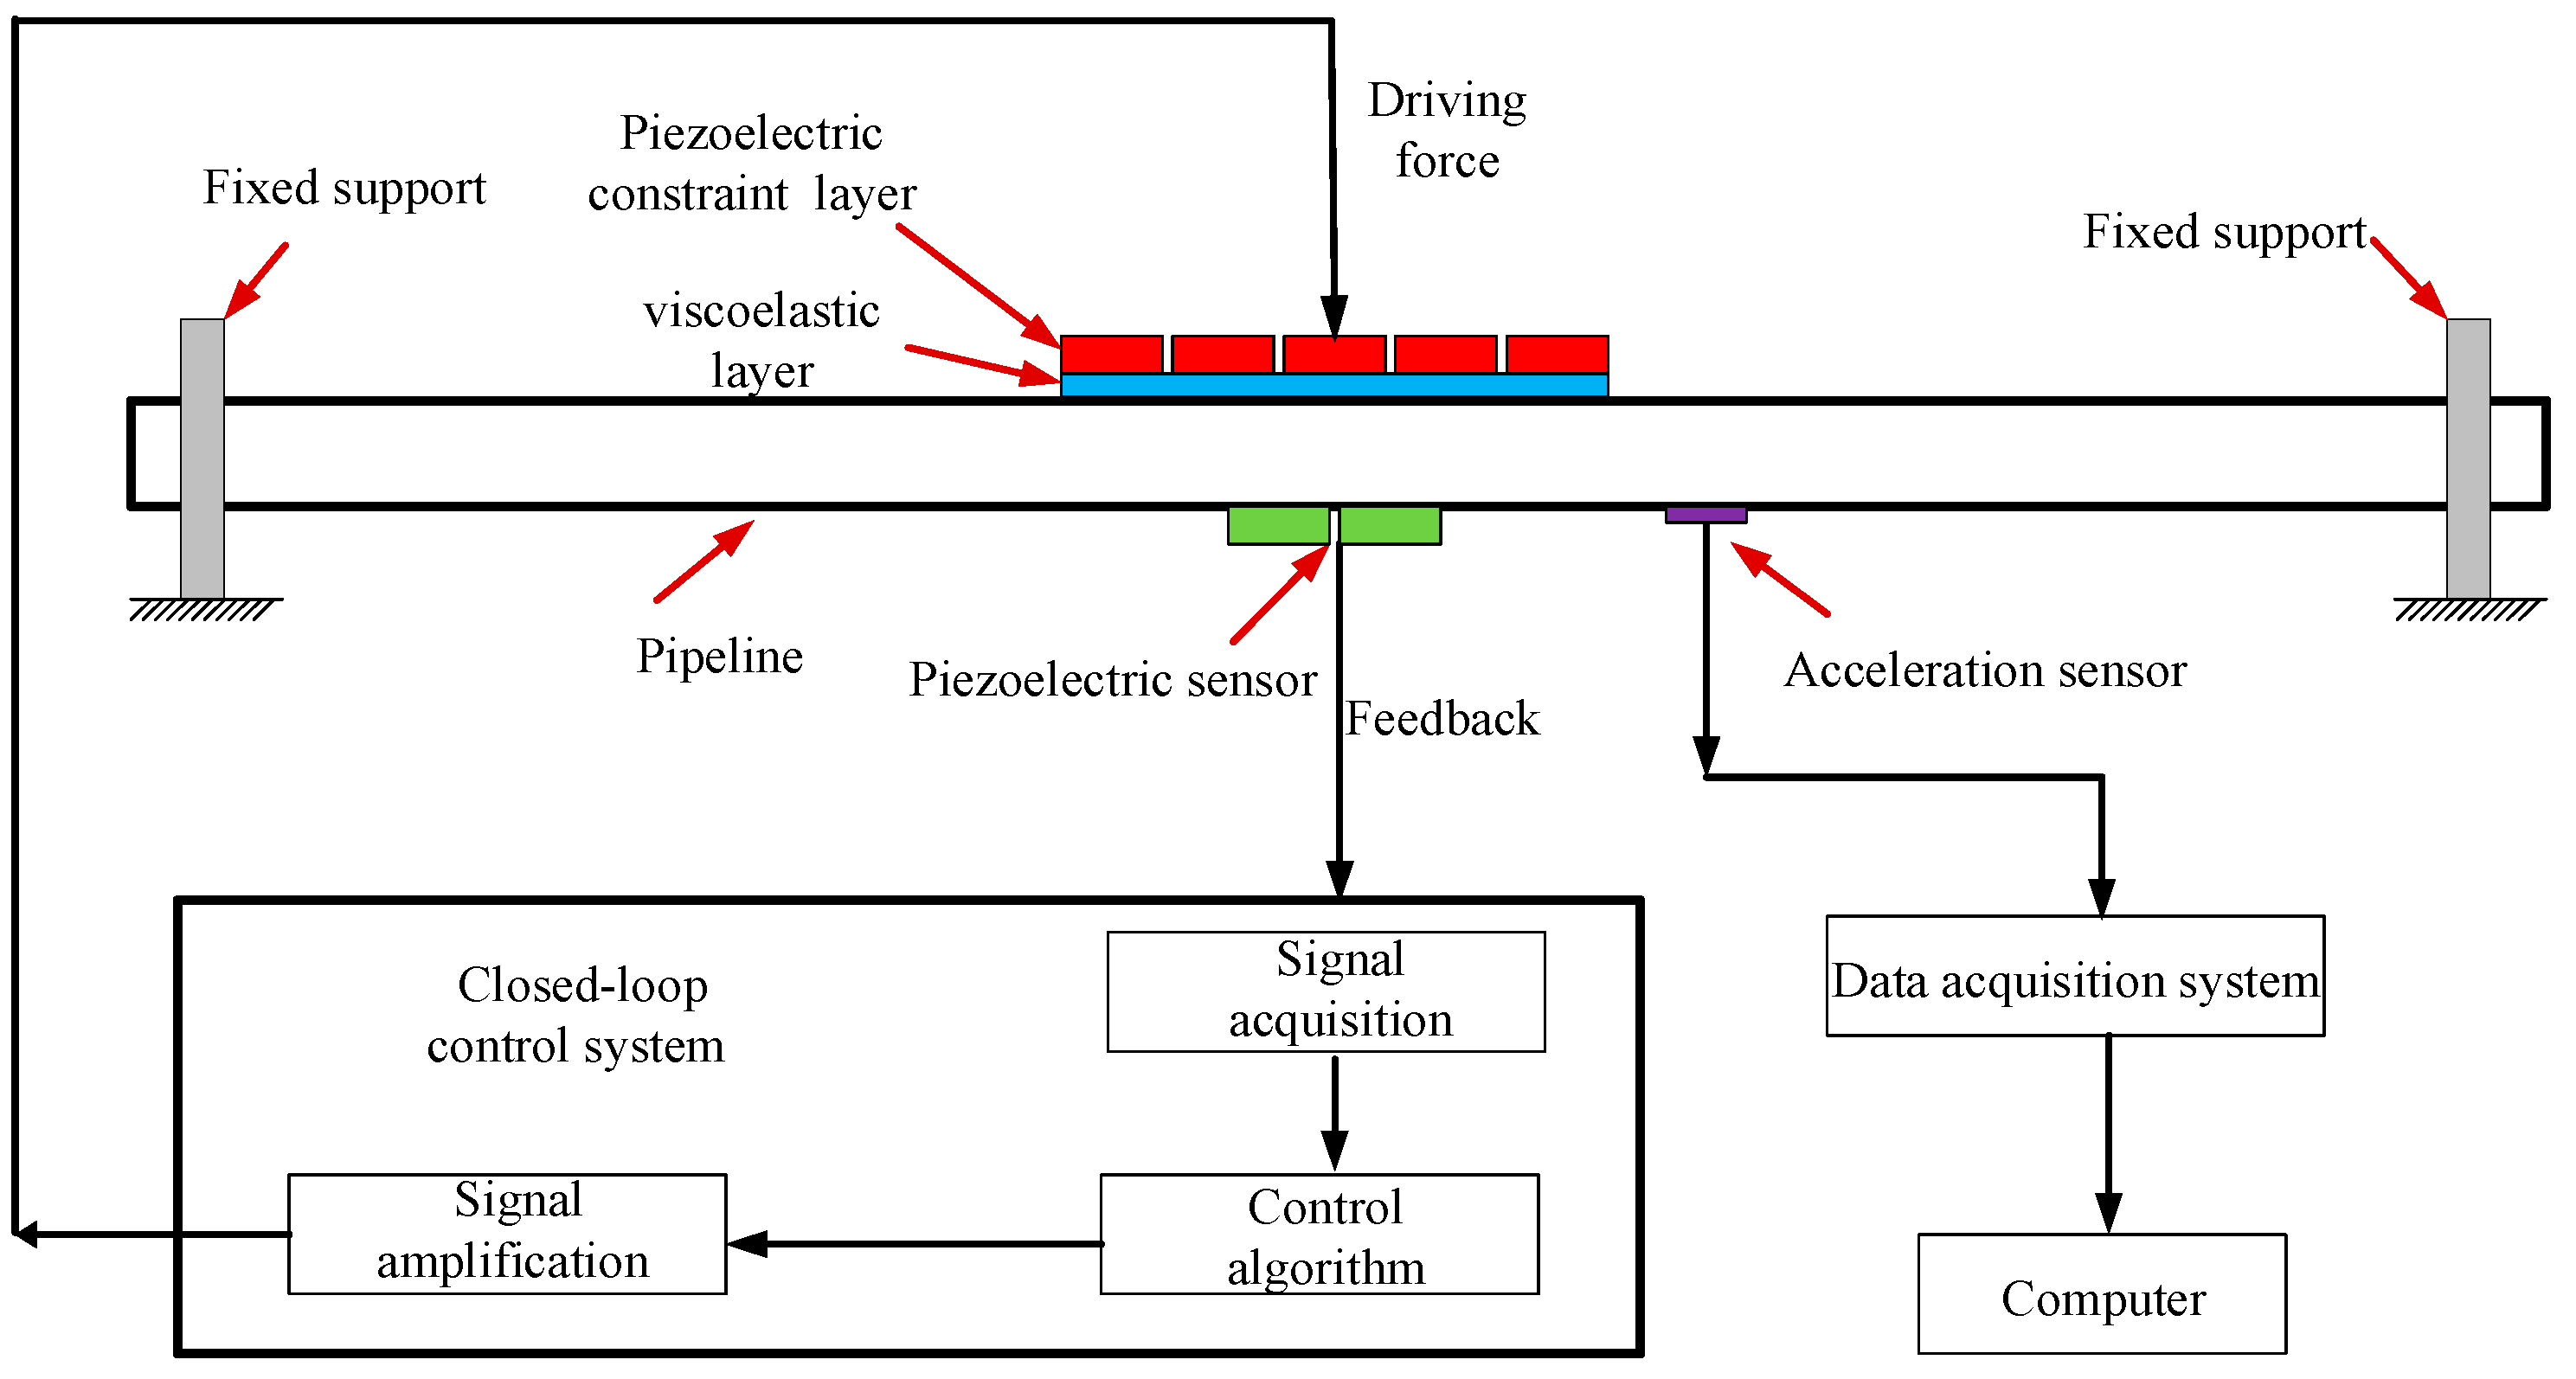
2.4. Experimental Validation of Active Constraint Layer Damping Treatment

The vibration control of the pipeline is implemented by the ACLD patches. The structural parameters and control parameters of the active constraint layer damping will significantly affect the vibration control effect. To verify the vibration damping performance of the active constraint layer damping, a vibration control platform is set up as shown in Figure 9. The control system mainly consists of a vibration control part and a vibration monitoring part.
A diagram of a vibration control platform for a pipeline with ACLD patches is shown in Figure 10.
The hardware of the vibration control platform mainly includes the following equipment:
  • Vibrostand: Provide a sinusoidal excitation for the pipeline. Output excitation frequency range: 5 to 5000 Hz.
  • Sensors: The sensors used in this paper include acceleration sensors and piezoelectric ceramic sensors.
  • Signal collector: (1) The voltage acquisition and output module comprise 16 voltage input channels and 2 output channels, wherein the input channel is used for feedback vibration response of the pipeline, the output channel is used for outputting control signals through the controller; (2) The acceleration acquisition module has 8 acceleration input channels to monitor the vibration of the pipeline.
  • Controller: The controller is used as a lower computer to run the control program. The input vibration signal is computed to obtain the control voltage signal. The controller is a National Instruments PXI controller.
  • Voltage amplifier: Amplify the control voltage signal outputted by the controller. The voltage amplification factor can be up to 15 times. The voltage signal input range is 0–10 V, and the no-load full-scale bandwidth is 1000 Hz.
The software the vibration control platform includes: vibration monitoring software and control software. The function of the vibration monitoring software is to collect, process, display and save the vibration response data of the pipeline. The vibration control software functions are: signal acquisition, signal filtering, signal processing, overload protection and signal output.
Vibration monitoring software mainly consists of channel parameter setting, acceleration data acquisition, strain data acquisition and data storage. The channel name, sensor sensitivity, and sampling frequency of the data acquisition need to be set in the channel parameter setting part. The data acquisition part displays the time and frequency domain of the collected data. The data storage part names and saves the collected data files. Hardware timing single-point sampling is used as the voltage sampling mode. The hardware timing single-point sampling enables continuous sampling or sample generation. Unbuffered hardware timing sampling can eliminate the time delay caused by data buffering.
The vibration control software mainly consists of channel parameter, sampling frequency setting, data filtering, control waveform adjustment, overload protection and data display. The voltage input/output channel name and the channel sampling frequency need to be set in the channel parameters setting part. Since the piezoelectric material is used as the sensor to collect the voltage, there is a common signal interference, so the collected data needs to be filtered. A waveform chart is set on the front panel to display the collected data.
As is shown in Figure 11, the ACLD patches is adhered to the middle and root surface of the pipeline, the piezoelectric sensor is adhered to the middle surface of the pipeline and is opposite to the ACLD patches. Two ends of the pipeline are clamped through the fixed support.

3. Results and Discussion

3.1. Influences on Shear Force Transmitted by Active Constraint Layer Damping

According to the theoretical model in Section 2.1, when the frequency of the voltage applied to the ACLD is 375 Hz, the influence curve of the control voltage and the shear modulus of viscoelastic layer on the shear force transmitted by viscoelastic layer is shown in Figure 12 and Figure 13. With the increase of the voltage amplitude and the shear modulus of the viscoelastic layer, the shear force transmitted by the viscoelastic layer increases linearly.
It can be derived from Equation (10) that the shear force F S transmitted by viscoelastic layer is related to the piezoelectric constant and size of the piezoelectric constraint layer. The driving force of the damping of the active constraint layer is affected by the elastic modulus of the viscoelastic layer and its thickness. Therefore, in the process of structural design, to improve the driving force of the active constraint layer damping, the width and length of the active constraint layer can be increased, the thickness of the viscoelastic layer should be reduced, and the shear modulus of the viscoelastic layer should be increased.

3.2. Results of the FEM-Based Damping Characteristics Analysis

A fixed constraint is applied at both ends of the finite element model of the active constrained layer damping pipeline, and all nodes on both sides are selected to constrain all degrees of freedom of the node. As shown in Table 4, through the modal analysis of the pipeline with ACLD treatment, the first three natural frequencies and mode of vibration of the pipeline are obtained. The first three modes of the pipeline of ACLD patches are bending, which is the same with for vibration mode of ordinary hydraulic pipelines.
Figure 14 shows the effect of shear modulus of different viscoelastic materials on the natural frequency and modal loss factor of the pipeline. The shear modulus of the viscoelastic layer varies in 10 5 10 10 . As can be seen from the figure, the natural frequency does not change with the change of the shear modulus; the loss factor varies greatly, especially the first and third orders. The loss factor shows a peak at 10 8 .
Figure 15 shows the effect of the viscoelastic layer thickness on the natural frequency and loss factor. As can be seen from the figure, as the thickness of the viscoelastic layer increases, the natural frequency changes a small amount. The first-order loss factor and the third-order loss factor of the pipeline both show a peak when the thickness of viscoelastic layer reaches 0.75 mm.

3.3. Results of the FEM-Based Control Parameters Analysis

When the first-order bending vibration occurs in the pipeline with fixed support at both ends, the stress on both ends of the pipeline is large, and failure will occur after a long period of time. Therefore, it is considered that the ACLD patches are adhered to the place where the stress at the root of the pipe reaches the maximum and its damping effect is evaluated. Different control voltages are applied on the piezoelectric constraint layer to compare the damping performance of the ACLD patches. A constant acceleration excitation of 0.2 g is applied on the pipeline, the acceleration response near the middle node of the pipeline is extracted, and the results are shown in Figure 16.
As can be seen from the above figure, when different control voltages are applied, the damping effect of the ACLD patches will change. With the increase of the control voltage, the damping effect becomes more obvious, as is shown in Table 5.
The above results show that with the increase of the control voltage, the acceleration response decreases gradually. When the control voltage reaches 50 V, the acceleration response value decreases by 56.93%; However, as the voltage increases, the acceleration response that can be reduced per unit voltage becomes smaller. That is, under certain conditions, the effect of ACLD patches on vibration reduction is limited.

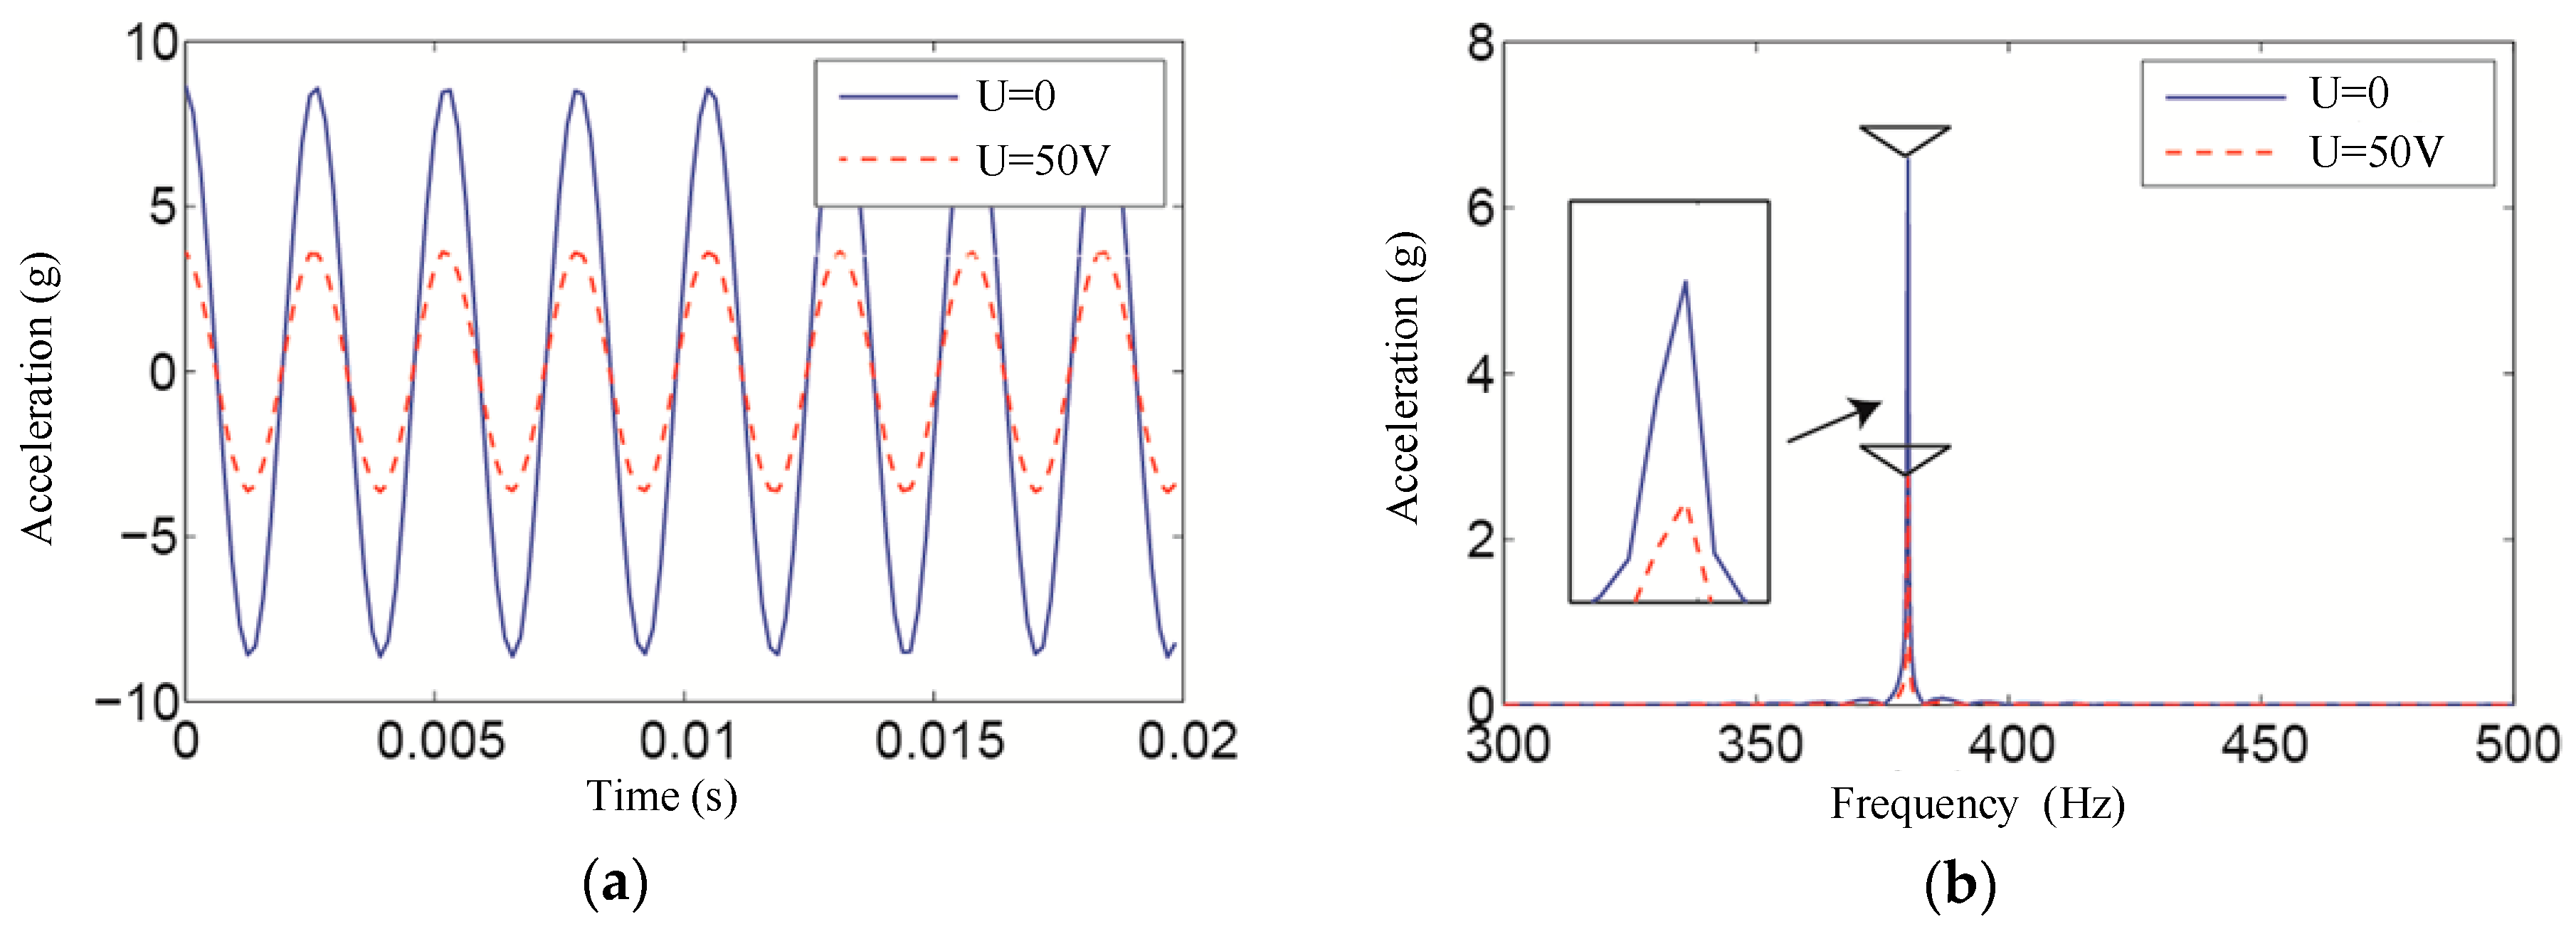
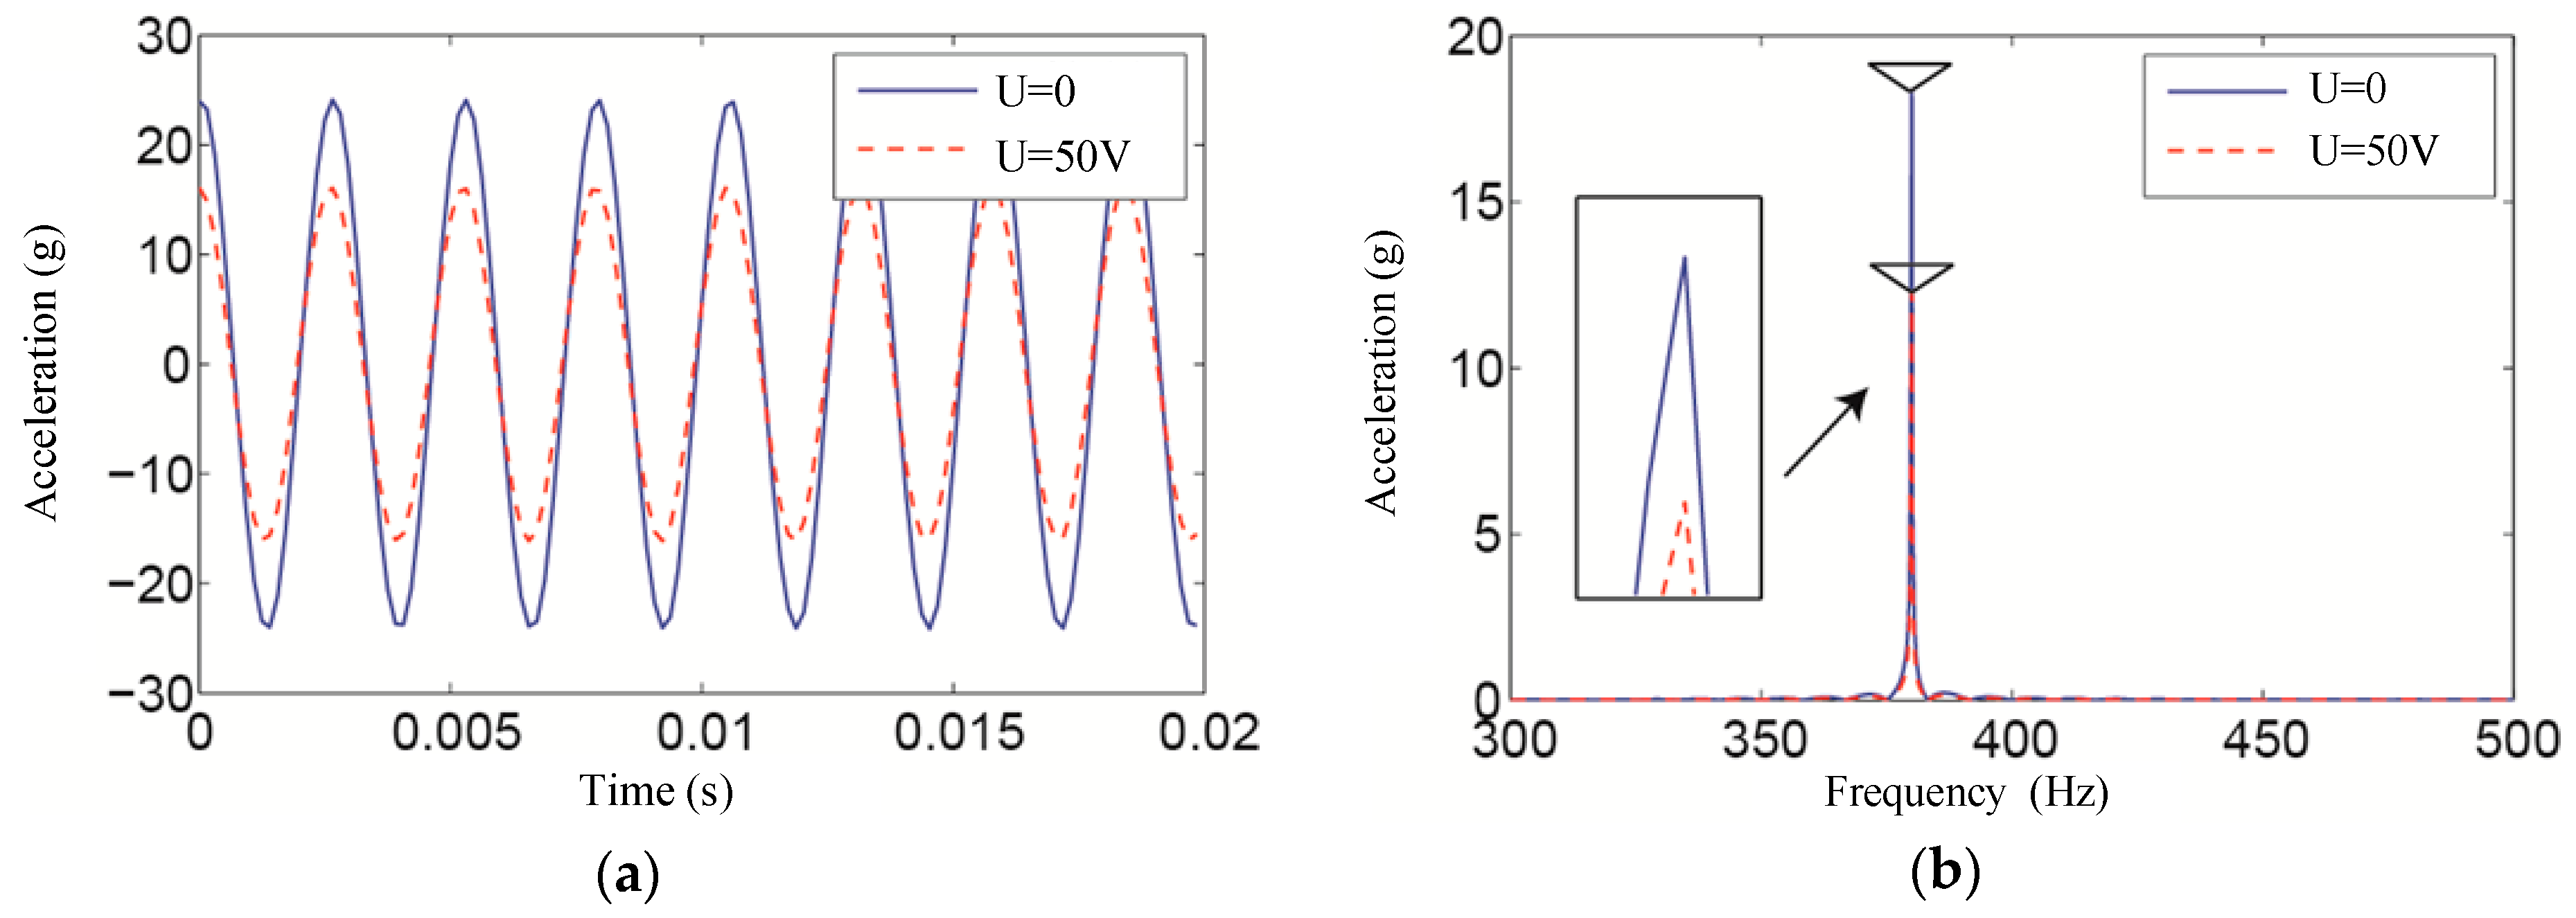
3.4. Measurement of Vibration Response under Different Excitations

Under the excitation of which the acceleration amplitudes are 0.1 g, 0.2 g and 0.3 g respectively, a control voltage of 50 V is applied to the surface of ACLD patches. The excitation frequency of the vibration is the first-order natural frequency of the pipeline. The vibration responses of the pipeline under different excitation is collected by an acceleration sensor and is shown in Figure 17, Figure 18 and Figure 19, respectively. The amplitude of acceleration responses under different excitations are shown in Table 6.
The vibration control responses of the pipeline under different excitations shows that as the amplitude of the excitation increases, the peak value of the resonance response of the pipeline gradually increases. When the same control voltage is applied to the surface of the ACLD patches, the vibration control effect is gradually reduced. When the excitation is 0.1 g, the resonance peak of the pipeline can be decreased by 58.14%. When the base excitation is 0.3 g, the resonance peak of the pipeline can be decreased by 33.19%. Therefore, it is necessary to realize that the damping effect of the ACLD patches is limited under certain conditions due to the limitation of the hardware and control strategy.
To investigate the influence of the piezoelectric material on the vibration control effect, a control voltage is applied to different numbers of piezoelectric ceramics. The excitation amplitude is 0.3 g and the amplitude of voltage is 50 V. The vibration control response curve shown in Figure 20 is obtained.
Figure 20 shows that under the different number of ACLD patches, the performance of vibration control is different. With the increase of the number of ACLD patches, the amplitude of vibration acceleration response decreases gradually.

4. Conclusions

Through experimentally and theoretically analysis, the following conclusions can be drawn:
(1)
The force analysis of the pipeline with ACLD patches under the harmonic voltage shows that the driving force is correlated with the piezoelectric constant of the active constraint layer, the control voltage, the shear modulus and thickness of the viscoelastic layer. The driving force transmitted by the viscoelastic layer increases as the shear modulus increases or the thickness decreases, but the modal loss factor of the system exhibits a peak when the shear modulus reaches 10 8 or the thickness reaches 0.75 mm for the VEM used in this research. Therefore, the optimal viscoelastic layer shear modulus and thickness can be selected to obtain the best performance of ACLD treatment.
(2)
Through the finite element analysis and experiment, the effectiveness of the ACLD patches for the vibration control of the pipeline is verified, and the damping effect reaches up to the highest being 58.14% when the amplitude of excitations is 0.1 g and decline with the growth of the excitation amplitude. The structure parameters and control parameters of the ACLD patches have a significant influence on the damping performance. The damping effect increases with the increase of the control voltage and coverage area.
(3)
Under the given excitation, it is effective to increase the coverage area of the ACLD patches and improve the amplitude of the control voltage to get a better vibration control effect. However, as the voltage increases, the acceleration response that can be reduced per unit voltage becomes smaller under the same excitation. Also, as the amplitude of the excitation increases, the control effect under the same voltage is gradually reduced. That is, under certain conditions, the effect of ACLD patches on vibration control is limited.
The research on the vibration control of aero pipeline system using ACLD treatment needs further study, mainly in the following aspects:
(1)
Due to limited time and energy, there is a lack of more in-depth research on research issues, and some theoretical and applied issues need further analysis. For example, the effects of pulsating pressure on vibration in actual conditions are not considered in the paper during the modeling and experimentation steps.
(2)
In the ACLD structure, the constitutive relationship of viscoelastic materials is greatly affected by the ambient temperature and vibration frequency. Therefore, the search for a reasonable description of the constitutive relationship of viscoelastic materials still needs to be studied.
(3)
The research on the control method of ACLD structure is still insufficient. The PID control currently used is too simple. Therefore, it is necessary to develop and study more suitable control methods, especially robust control, adaptive control and intelligent control, to overcome and solve the uncertainty and change affecting the model.

Author Contributions

Conceptualization, J.Z.; methodology, J.Z.; software, J.L.; validation, D.W., J.L. and P.G.; formal analysis, J.Z.; investigation, J.Z.; resources, Q.H.; data curation, Y.Y.; writing—original draft preparation, J.Z.; writing—review and editing, J.L. and P.G.; visualization, D.W.; supervision, Q.H.; project administration, P.G.; funding acquisition, P.G.

Funding

This research was funded by National Natural Science Foundation of China, Grant No. 51805462.

Conflicts of Interest

The authors declare no conflict of interest.

References

  1. Yu, D.; Païdoussis Michael, P.; Shen, H.; Wang, L. Dynamic stability of periodic pipes conveying fluid. J. Appl. Mech. 2014, 81, 8–11. [Google Scholar] [CrossRef]
  2. Liu, G.; Li, S.; Li, Y.; Chen, H. Vibration analysis of pipelines with arbitrary branches by absorbing transfer matrix method. J. Sound Vib. 2013, 332, 6519–6536. [Google Scholar] [CrossRef]
  3. Shen, H.; Wen, J.; Yu, D.; Wen, X. The vibrational properties of a periodic composite pipe in 3D space. J. Sound Vib. 2009, 328, 57–70. [Google Scholar] [CrossRef]
  4. Xu, Y.; Jiao, Z. Exact solution of axial liquid-pipe vibration with time-line interpolation. J. Fluids Struct. 2017, 70, 500–518. [Google Scholar] [CrossRef]
  5. Liu, W.; Liu, Y.; Yue, Z. Dynamic reliability of aircraft hydraulic pipelines under random pressure pulsation and vibration. Multidiscip. Model. Mater. Struct. 2010, 6, 493–507. [Google Scholar] [CrossRef]
  6. Lee, S.-H.; Jeong, W.-B. An efficient method to predict steady-state vibration of three-dimensional piping system conveying a pulsating fluid. J. Mech. Sci. Technol. 2012, 26, 2659–2667. [Google Scholar] [CrossRef]
  7. Sorokin, S.; Holst-Jensen, O. On Power Flow Suppression in Straight Elastic Pipes by Use of Equally Spaced Eccentric Inertial Attachments. J. Vib. Acoust. 2012, 134, 041003. [Google Scholar] [CrossRef]
  8. Tan, J.; Ho, S.M.; Zhang, P.; Jiang, J. Experimental Study on Vibration Control of Suspended Piping System by Single-Sided Pounding Tuned Mass Damper. Appl. Sci. 2019, 9, 285. [Google Scholar] [CrossRef]
  9. Tan, J.; Jiang, J.; Liu, M.; Feng, Q.; Zhang, P.; Ho, S.C.M. Implementation of Shape Memory Alloy Sponge as Energy Dissipating Material on Pounding Tuned Mass Damper: An Experimental Investigation. Appl. Sci. 2019, 9, 1079. [Google Scholar] [CrossRef]
  10. Zhang, P.; Patil, D.; Ho, S.C.M. Effect of Seawater Exposure on Impact Damping Behavior of Viscoelastic Material of Pounding Tuned Mass Damper (PTMD). Appl. Sci. 2019, 9, 632. [Google Scholar] [CrossRef]
  11. Wang, Z.; Chen, Z.; Gao, H.; Wang, H. Development of a self-powered magnetorheological damper system for cable vibration control. Appl. Sci. 2018, 8, 118. [Google Scholar] [CrossRef]
  12. Baz, A.M. Optimization of energy dissipation characteristics of active constrained layer damping. Smart Mater. Struct. 1997, 6, 360. [Google Scholar] [CrossRef]
  13. Tliba, S.; Abou-Kandil, H.; Prieur, C. Active vibration damping of a smart flexible structure using piezoelectric transducers: H_infinity design and experimental results. IFAC Proc. Vol. 2005, 38, 760–765. [Google Scholar] [CrossRef]
  14. Luo, Y.; Zhang, X.; Zhang, Y.; Qu, Y.; Xu, M.; Fu, K.; Ye, L. Active vibration control of a hoop truss structure with piezoelectric bending actuators based on a fuzzy logic algorithm. Smart Mater. Struct. 2018, 27, 085030. [Google Scholar]
  15. Yang, Q.; Lee, K.; Kim, B. Development of Multi-Staged Adaptive Filtering Algorithm for Periodic Structure-Based Active Vibration Control System. Appl. Sci. 2019, 9, 611. [Google Scholar] [CrossRef]
  16. Trikande, M.W.; Karve, N.K.; Raj, R.A.; Jagirdar, V.V.; Vasudevan, R. Semi-active vibration control of an 8x8 armored wheeled platform. J. Vib. Control 2018, 24, 283–302. [Google Scholar] [CrossRef]
  17. Owen, T.; Massimo, R.; Amr, B. Attenuation of wave propagation in fluid-loaded shells with periodic shunted piezoelectric rings. Smart Mater. Struct. 2005, 14, 594–604. [Google Scholar]
  18. El Harti, K.; Rahmoune, M.; Sanbi, M.; Saadani, R.; Bentaleb, M.; Rahmoune, M. Finite Element Model of Vibration Control for an Exponential Functionally Graded Timoshenko Beam with Distributed Piezoelectric Sensor/Actuator. Actuators 2019, 8, 19. [Google Scholar] [CrossRef]
  19. Herold, S.; Mayer, D. Adaptive Piezoelectric Absorber for Active Vibration Control. Actuators 2016, 5, 7. [Google Scholar] [CrossRef]
  20. Khan, A.; Kim, H.S. Active Vibration Control of a Piezo-Bonded Laminated Composite in the Presence of Sensor Partial Debonding and Structural Delaminations. Sensors 2019, 19, 540. [Google Scholar] [CrossRef]
  21. Her, S.-C.; Lin, C.-S. Vibration Analysis of Composite Laminate Plate Excited by Piezoelectric Actuators. Sensors 2013, 13, 2997–3013. [Google Scholar] [CrossRef] [Green Version]
  22. Zhong, B.; Deng, B.; Zhao, H. Simulation Model and Method for Active Torsional Vibration Control of an HEV. Appl. Sci. 2019, 9, 34. [Google Scholar] [CrossRef]
  23. Byungjun, K.; Emiliano, R.; Timothy, W.; Brian, M. Vibration control of beams and plates with hybrid active-passive constrained layer damping treatments. In Proceedings of the International Congress of Sound & Vibration, Athens, Greece, 10–14 July 2016. [Google Scholar]
  24. Kumar, N.; Singh, S.P. Vibration and damping characteristics of beams with active constrained layer treatments under parametric variations. Mater. Des. 2009, 30, 4162–4174. [Google Scholar] [CrossRef]
  25. Ray, M.C.; Reddy, J.N. Active damping of laminated cylindrical shells conveying fluid using 1-3 piezoelectric composites. Compos. Struct. 2013, 98, 261–271. [Google Scholar] [CrossRef]
  26. Kattimani, S.C.; Ray, M.C. Vibration control of multiferroic fibrous composite plates using active constrained layer damping. Mech. Syst. Signal Process. 2018, 106, 334–354. [Google Scholar] [CrossRef]
  27. Kumar, R.S.; Ray, M.C. Active control of geometrically nonlinear vibrations of doubly curved smart sandwich shells using 1–3 piezoelectric composites. Compos. Struct. 2013, 105, 173–187. [Google Scholar] [CrossRef]
  28. Crawley, E.F.; Luis, J.D. Use of piezoelectric actuator as elements of intelligent structures. AIAA J. 1987, 25, 1373–1385. [Google Scholar] [CrossRef]
Figure 1. Shear force transfer graph.
Applsci 09 02094 g001
Figure 2. Unit force diagram.
Applsci 09 02094 g002
Figure 3. Piezoelectric coefficient coordinate system.
Applsci 09 02094 g003
Figure 4. Pipeline with ACLD patch.
Applsci 09 02094 g004
Figure 5. Finite element model of active constrained layer damping pipeline.
Applsci 09 02094 g005
Figure 6. Fixed boundary.
Applsci 09 02094 g006
Figure 7. Voltage boundary.
Applsci 09 02094 g007
Figure 8. Acceleration response under excitation from base.
Applsci 09 02094 g008
Figure 9. Schematic diagram of vibration control platform for pipeline with ACLD patches.
Applsci 09 02094 g009
Figure 10. Diagram of experiment platform.
Applsci 09 02094 g010
Figure 11. Layout of ACLD patches.
Applsci 09 02094 g011
Figure 12. Influence of voltage on shear force.
Applsci 09 02094 g012
Figure 13. Influence of the shear modulus on shear force.
Applsci 09 02094 g013
Figure 14. Influence of shear modulus of viscoelastic layer on (a) modal frequency and (b) loss factor.
Applsci 09 02094 g014
Figure 15. Influence of thickness of viscoelastic layer on the (a) modal frequency and (b) loss factor.
Applsci 09 02094 g015
Figure 16. Vibration response in the (a) time domain and (b) frequency domain under different control voltages.
Applsci 09 02094 g016
Figure 17. Vibration response in the (a) time domain and (b) frequency domain under excitation of 0.1 g.
Applsci 09 02094 g017
Figure 18. Vibration response in the (a) time domain and (b) frequency domain under excitation of 0.2 g.
Applsci 09 02094 g018
Figure 19. Vibration response in the (a) time domain and (b) frequency domain under excitation of 0.3 g.
Applsci 09 02094 g019
Figure 20. Vibration response in the (a) time domain and (b) frequency domain with a different number of ACLD patches.
Applsci 09 02094 g020
Table 1. Geometric parameters of the pipeline with ACLD patches.
External Diameter (mm)Thickness (mm)Length (mm)Radian (rad)
Pipeline 181.5500 2 π
Viscoelastic layer18.520.26100 π / 2
Active constraint layer20.521100 π / 2
Table 2. Performance parameter of the pipeline with ACLD patches.
MaterialElasticity Modulus E (Pa)Poisson’s Ratio νDensity (kg/m3)
Pipeline 2.01 × 10 11 0.3 8.03 × 10 3
Viscoelastic layer 4.5 × 10 5 0.499980
Active constraint layer——0.37400
Table 3. Performance parameter of the piezoelectric confinement layer.
Piezoelectric Strain Constant ( × 10 12 C / N ) Elastic Constant ( m 2 / N ) Relative Dielectric Constant
d31d33d15 Y 11 E Y 33 E Y 55 E ε 33 T / ε 0
Active constraint layer186420660155.3252200
Table 4. Natural frequency of pipeline with ACLD patches.
Order of the ModalsFirstSecondThird
Natural frequency (Hz)375.81049.21967.3
Mode of vibrationBendingBendingBending
Table 5. Amplitude of acceleration response under different control voltages.
Control VoltagesAmplitude of Acceleration (g)Droop Rate (%)Droop in Per Unit Voltage (g/10 V)
0 V29.80NA
10 V26.0812.653.77
20 V22.4224.773.61
30 V19.0736.003.35
40 V16.1245.902.95
50 V13.8553.522.27
Table 6. Amplitude of the acceleration response under different excitations.
Amplitude of Excitations (g)Amplitude of Acceleration Before Vibration Control (g)Acceleration Amplitude After Vibration Control (g)Droop Rate
0.16.5812.75558.14%
0.213.267.51437.18%
0.318.3812.2833.19%

