Author Contributions
Conceptualization, X.W. and N.F.; methodology, N.F. and Z.S.; formal analysis, H.Y. and Y.S.; investigation, N.F. and Y.S.; resources, X.W.; data curation, N.F. and H.Y.; writing—original draft preparation, N.F. and L.Y.; writing—review and editing, N.F., X.W., H.Y. and Z.S.; visualization, N.F., X.W., H.Y. and L.Y.; supervision, X.W.; funding acquisition, X.W.
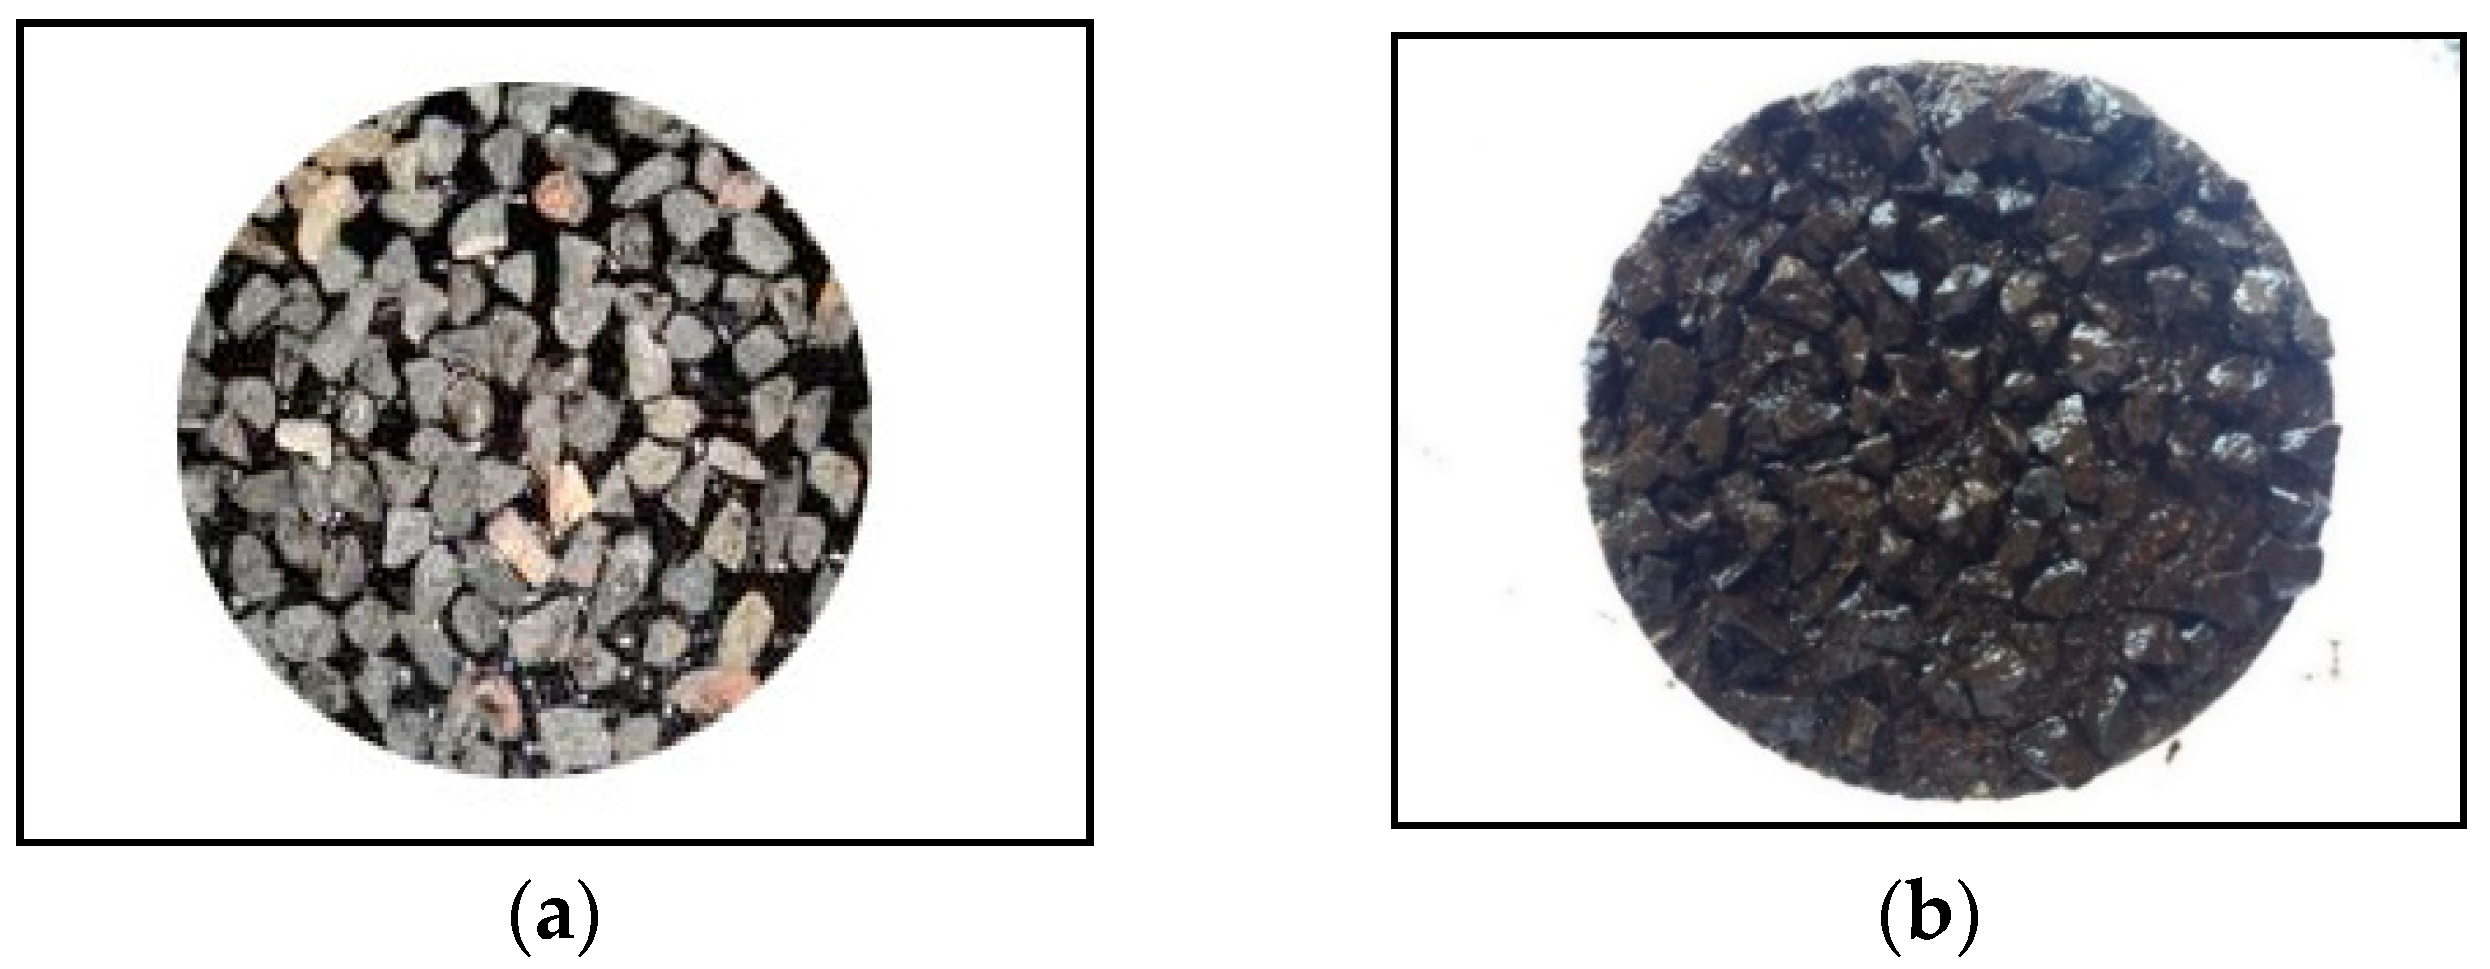
Figure 1.
The forming and testing process of shear samples with different spreading schemes: (a) the sample forming process of Spreading scheme A; (b) the sample forming process of Spreading scheme B; (c) the sample forming process of Spreading scheme C; and (d) the Shear test process.
Figure 1.
The forming and testing process of shear samples with different spreading schemes: (a) the sample forming process of Spreading scheme A; (b) the sample forming process of Spreading scheme B; (c) the sample forming process of Spreading scheme C; and (d) the Shear test process.
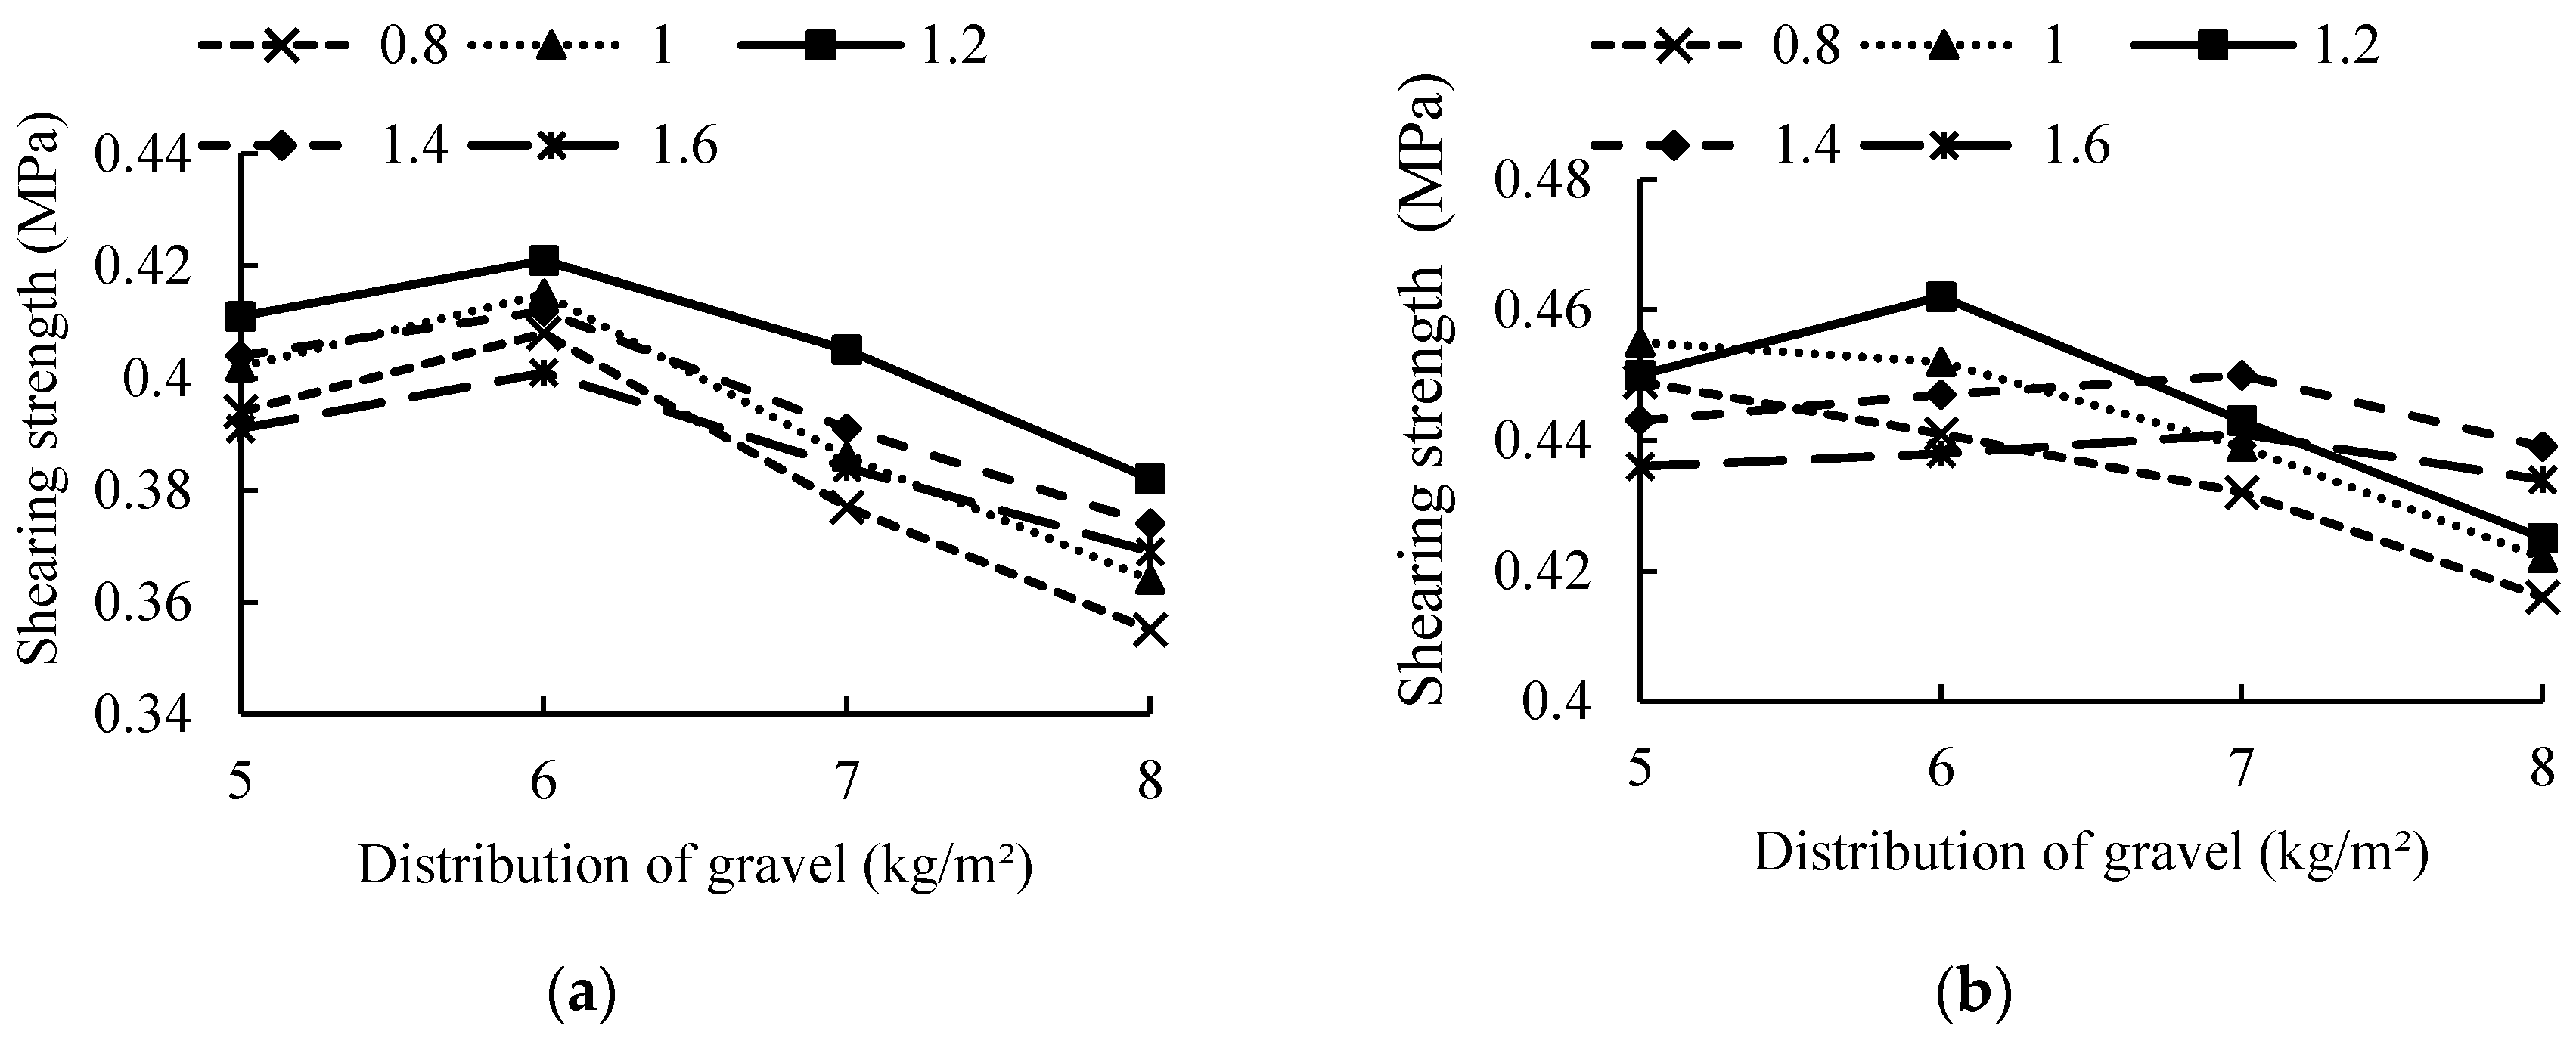
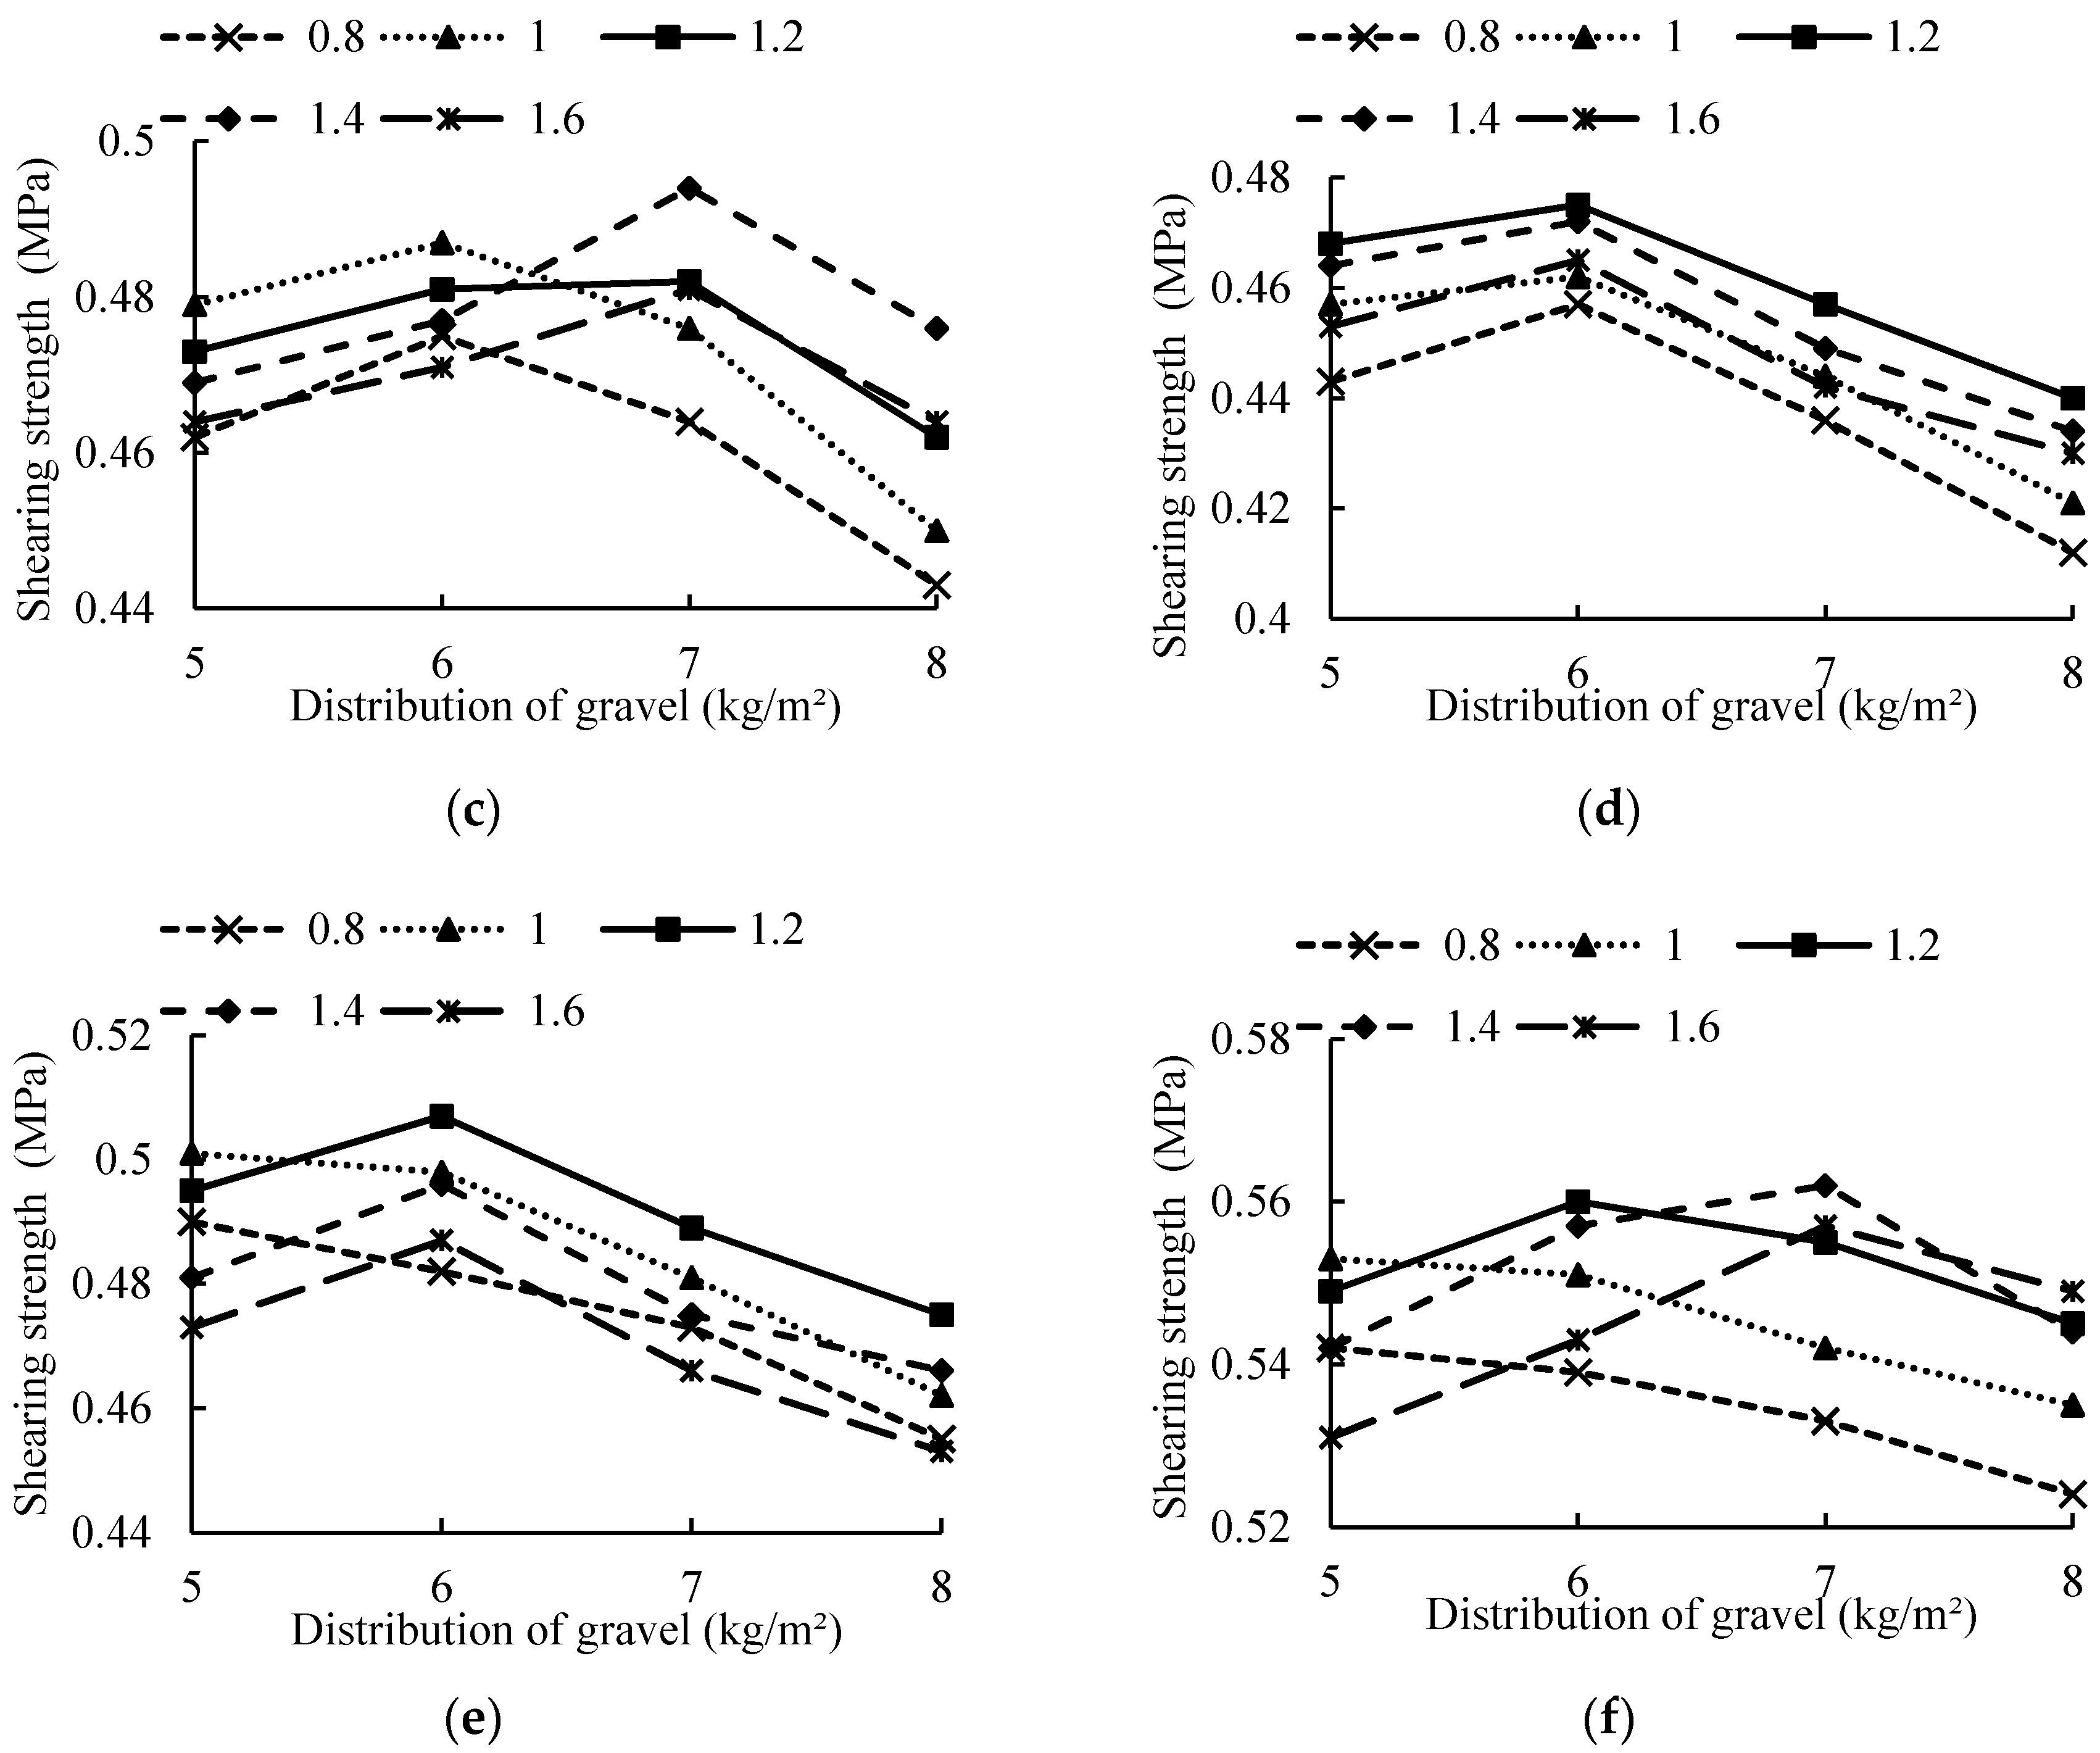
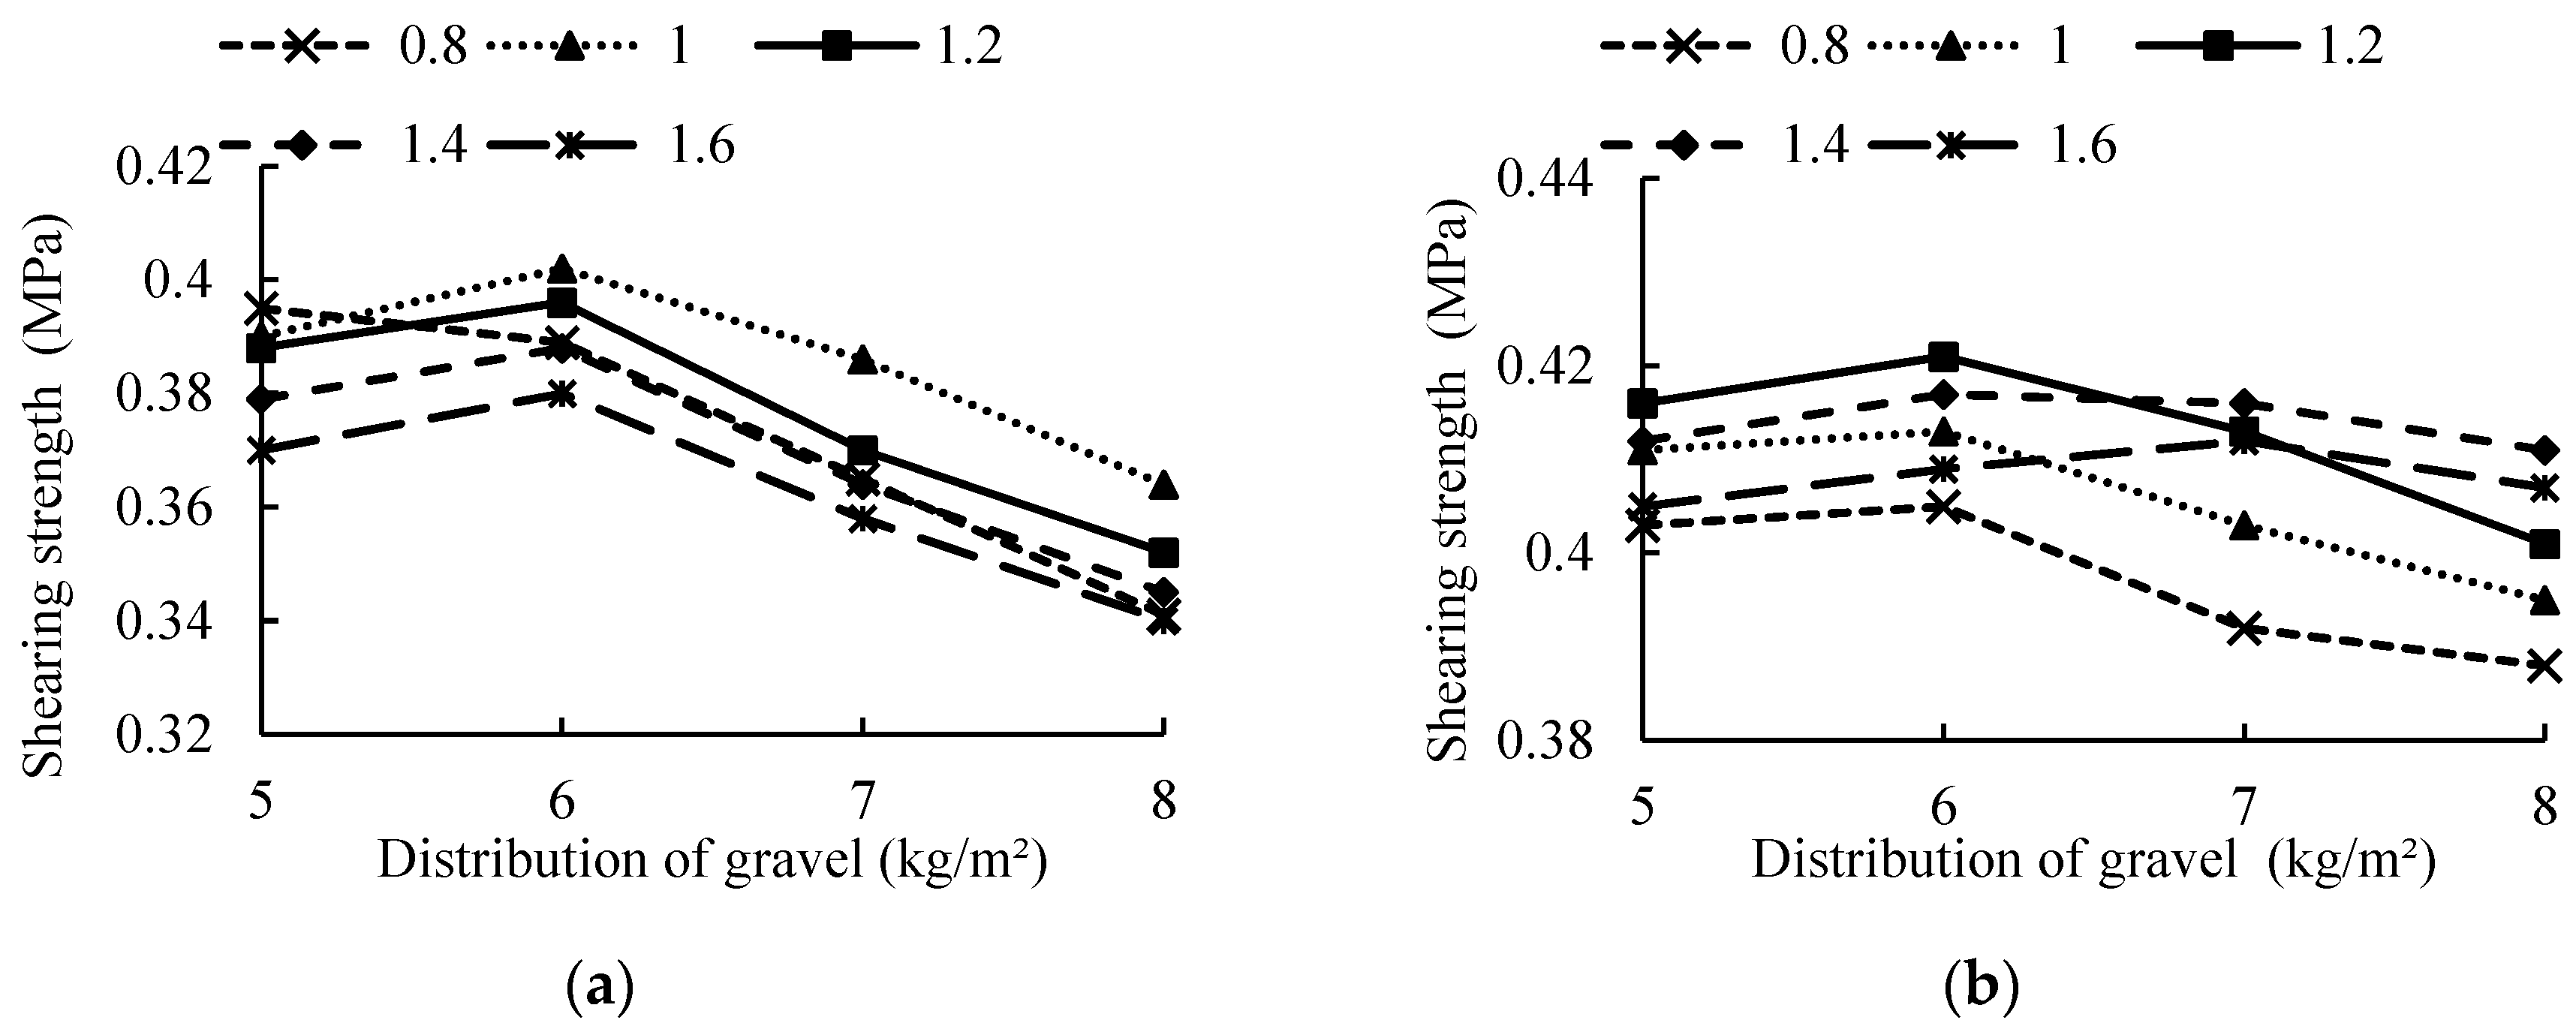
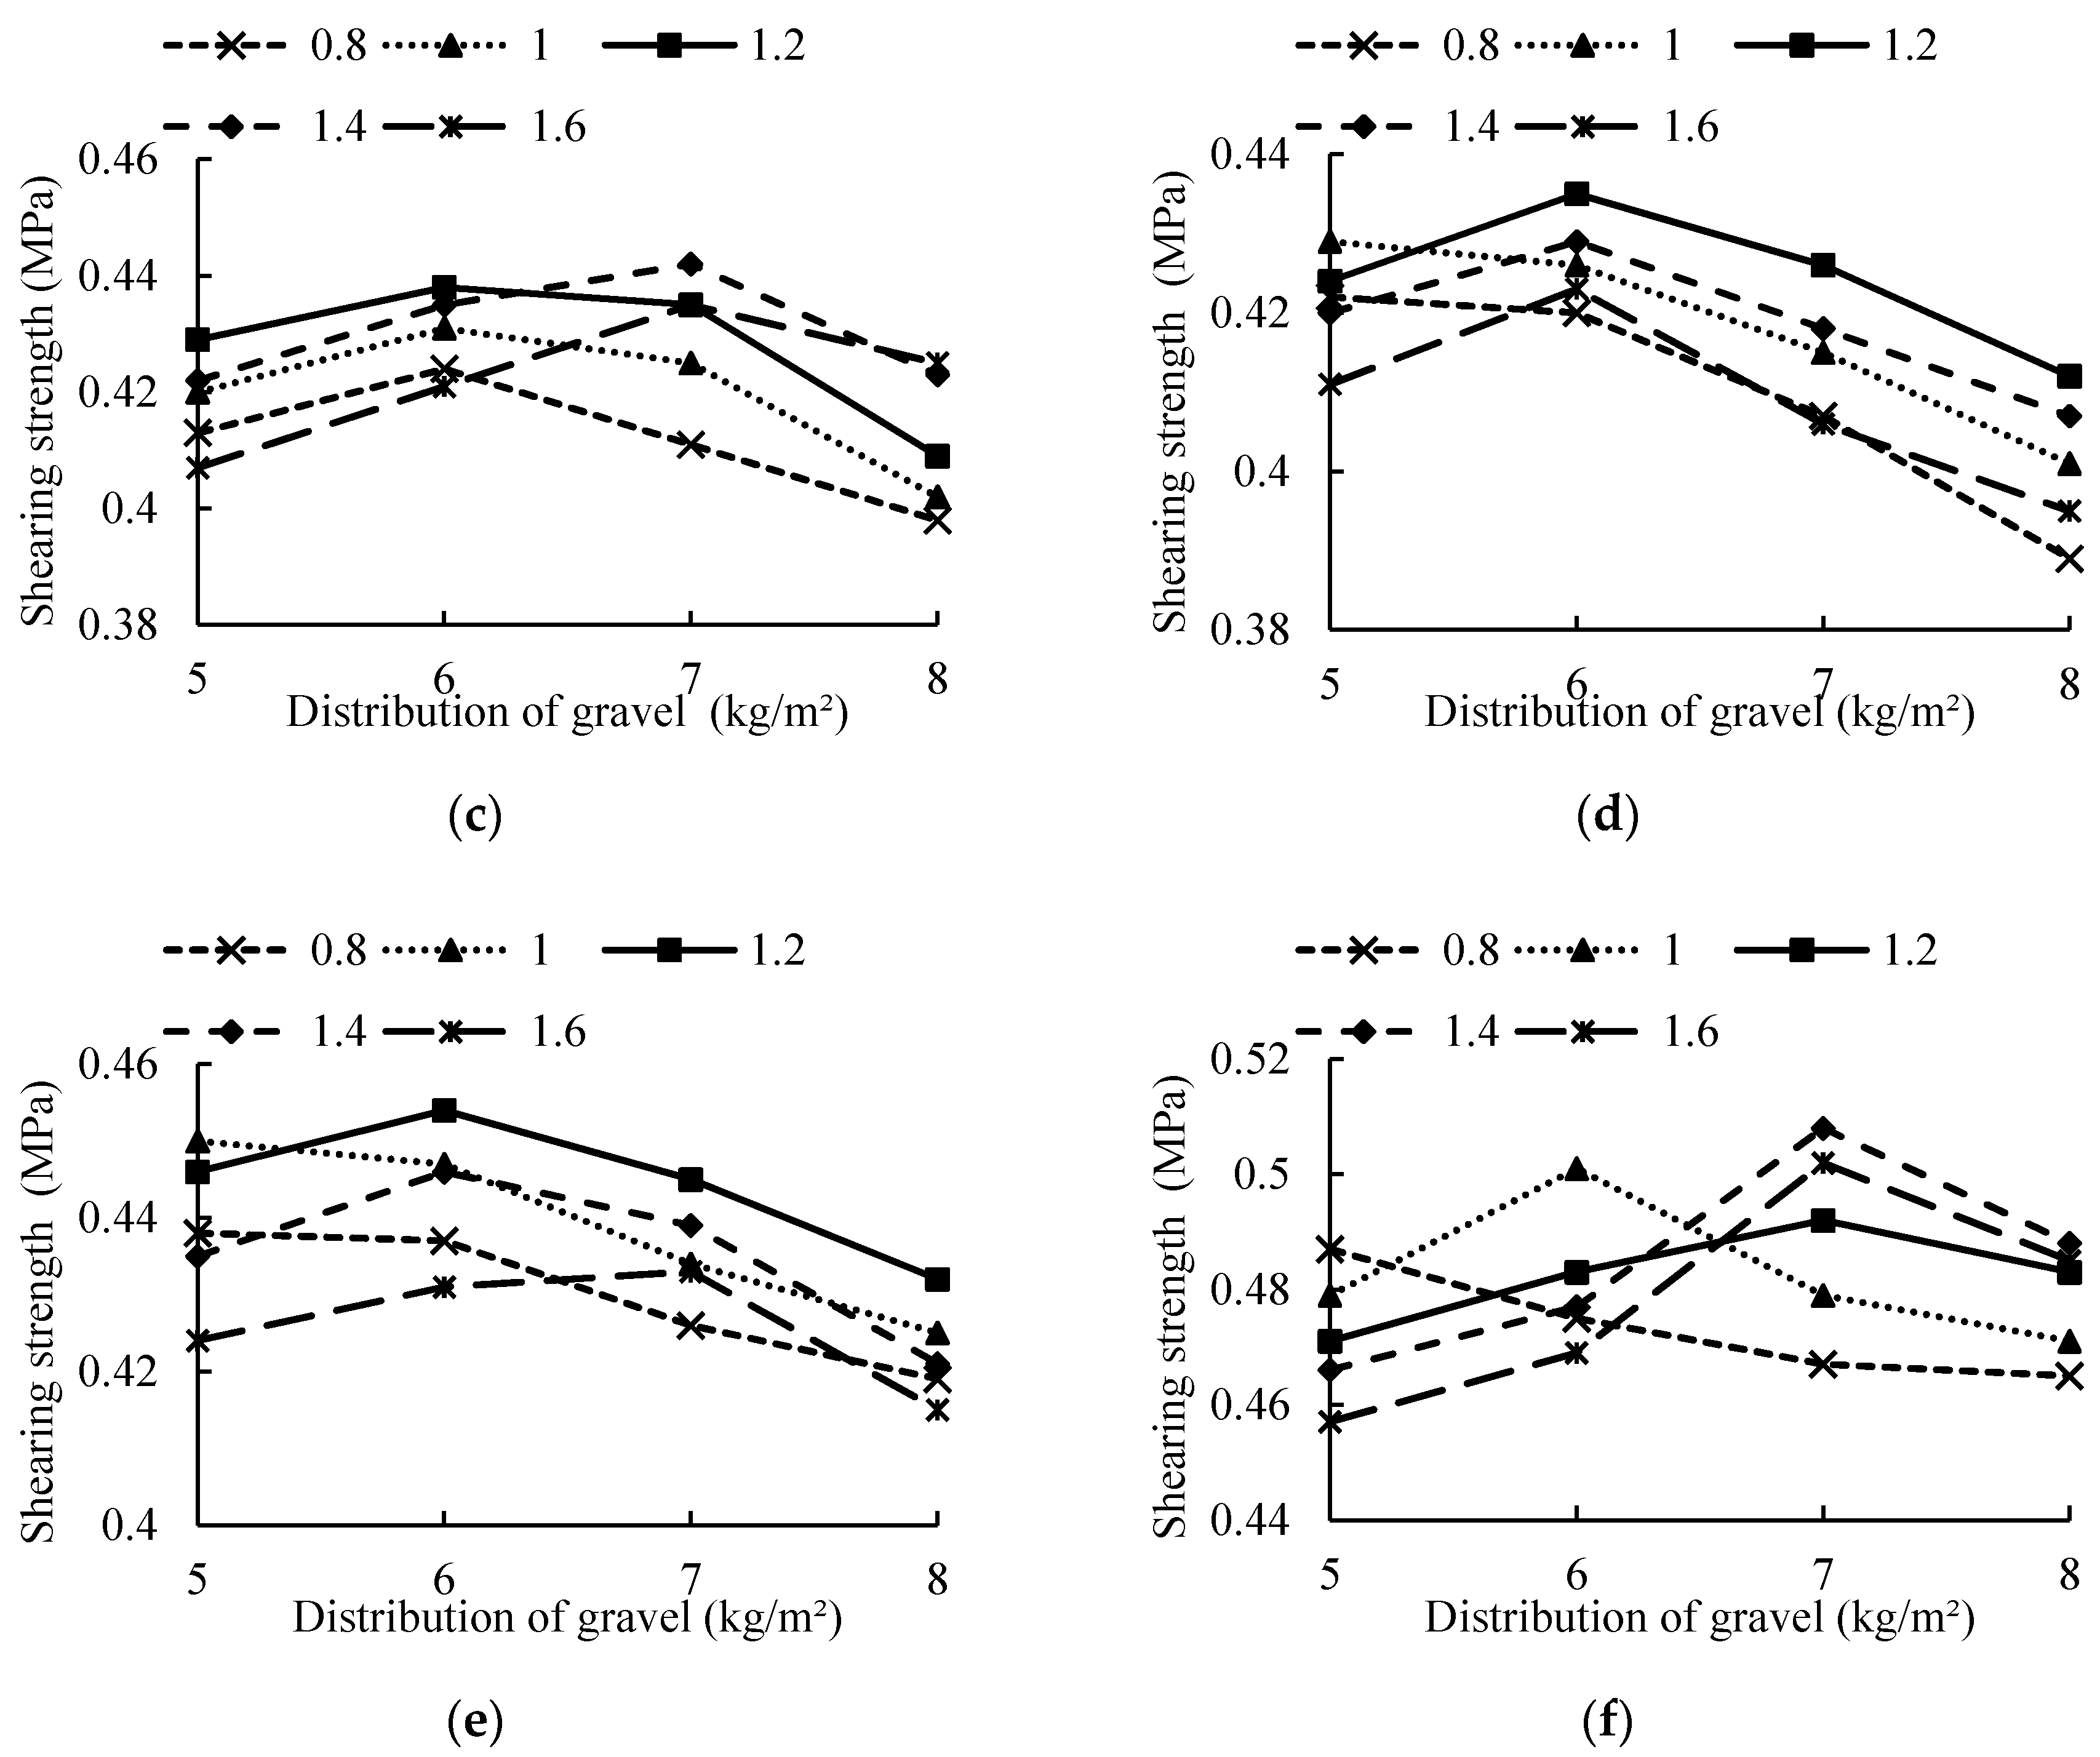
Figure 2.
Shear strength of SBS-modified emulsified asphalt with different spreading and disposal schemes: (a) Emu-A-brushed; (b) Emu-A-grooved; (c) Emu-A-exposed; (d) Emu-B-brushed; (e) Emu-B-grooved; (f) Emu-B-exposed.
Figure 2.
Shear strength of SBS-modified emulsified asphalt with different spreading and disposal schemes: (a) Emu-A-brushed; (b) Emu-A-grooved; (c) Emu-A-exposed; (d) Emu-B-brushed; (e) Emu-B-grooved; (f) Emu-B-exposed.
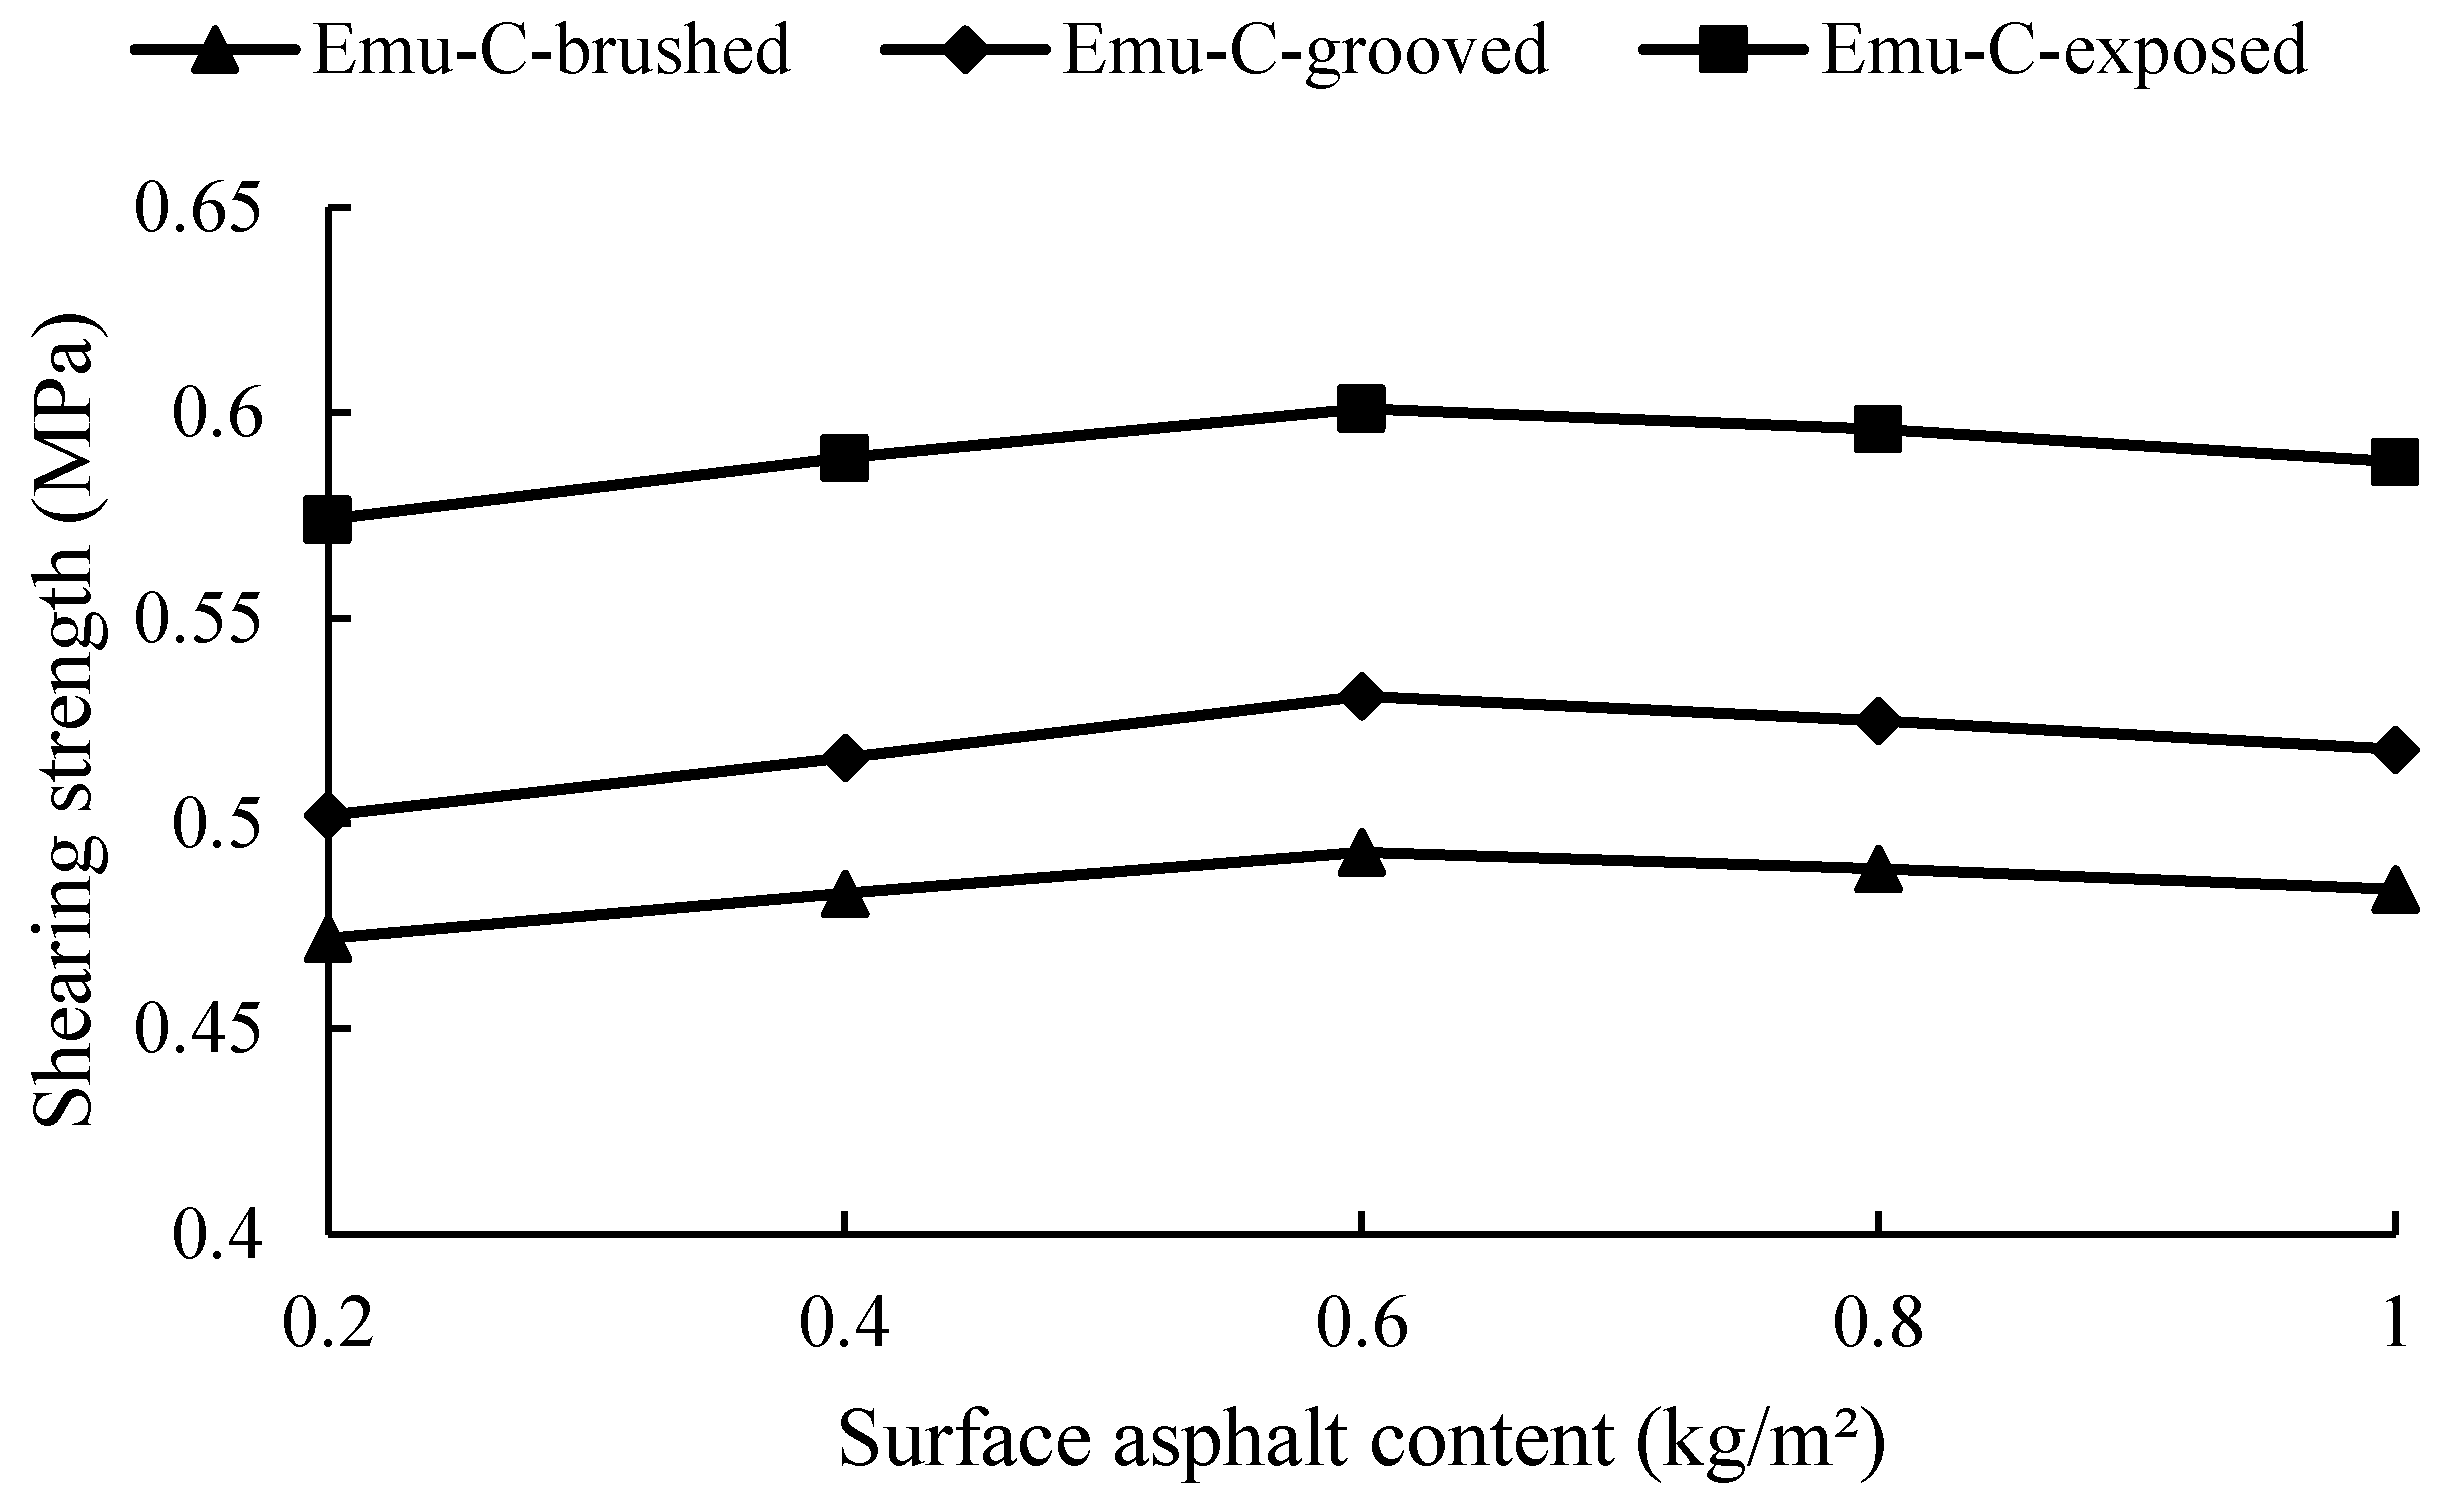
Figure 3.
Shear strength of SBS-modified emulsified asphalt under different upper layer asphalt content.
Figure 3.
Shear strength of SBS-modified emulsified asphalt under different upper layer asphalt content.
Figure 4.
Shear strength of 90 ordinary hot asphalt with different spreading and disposal schemes: (a) Ord-A-brushed; (b) Ord-A-grooved; (c) Ord-A-exposed; (d) Ord-B-brushed; (e) Ord-B-grooved; (f) Ord-B-exposed.
Figure 4.
Shear strength of 90 ordinary hot asphalt with different spreading and disposal schemes: (a) Ord-A-brushed; (b) Ord-A-grooved; (c) Ord-A-exposed; (d) Ord-B-brushed; (e) Ord-B-grooved; (f) Ord-B-exposed.
Figure 5.
Shear strength of 90 ordinary hot asphalt with different asphalt content in the upper layer.
Figure 5.
Shear strength of 90 ordinary hot asphalt with different asphalt content in the upper layer.
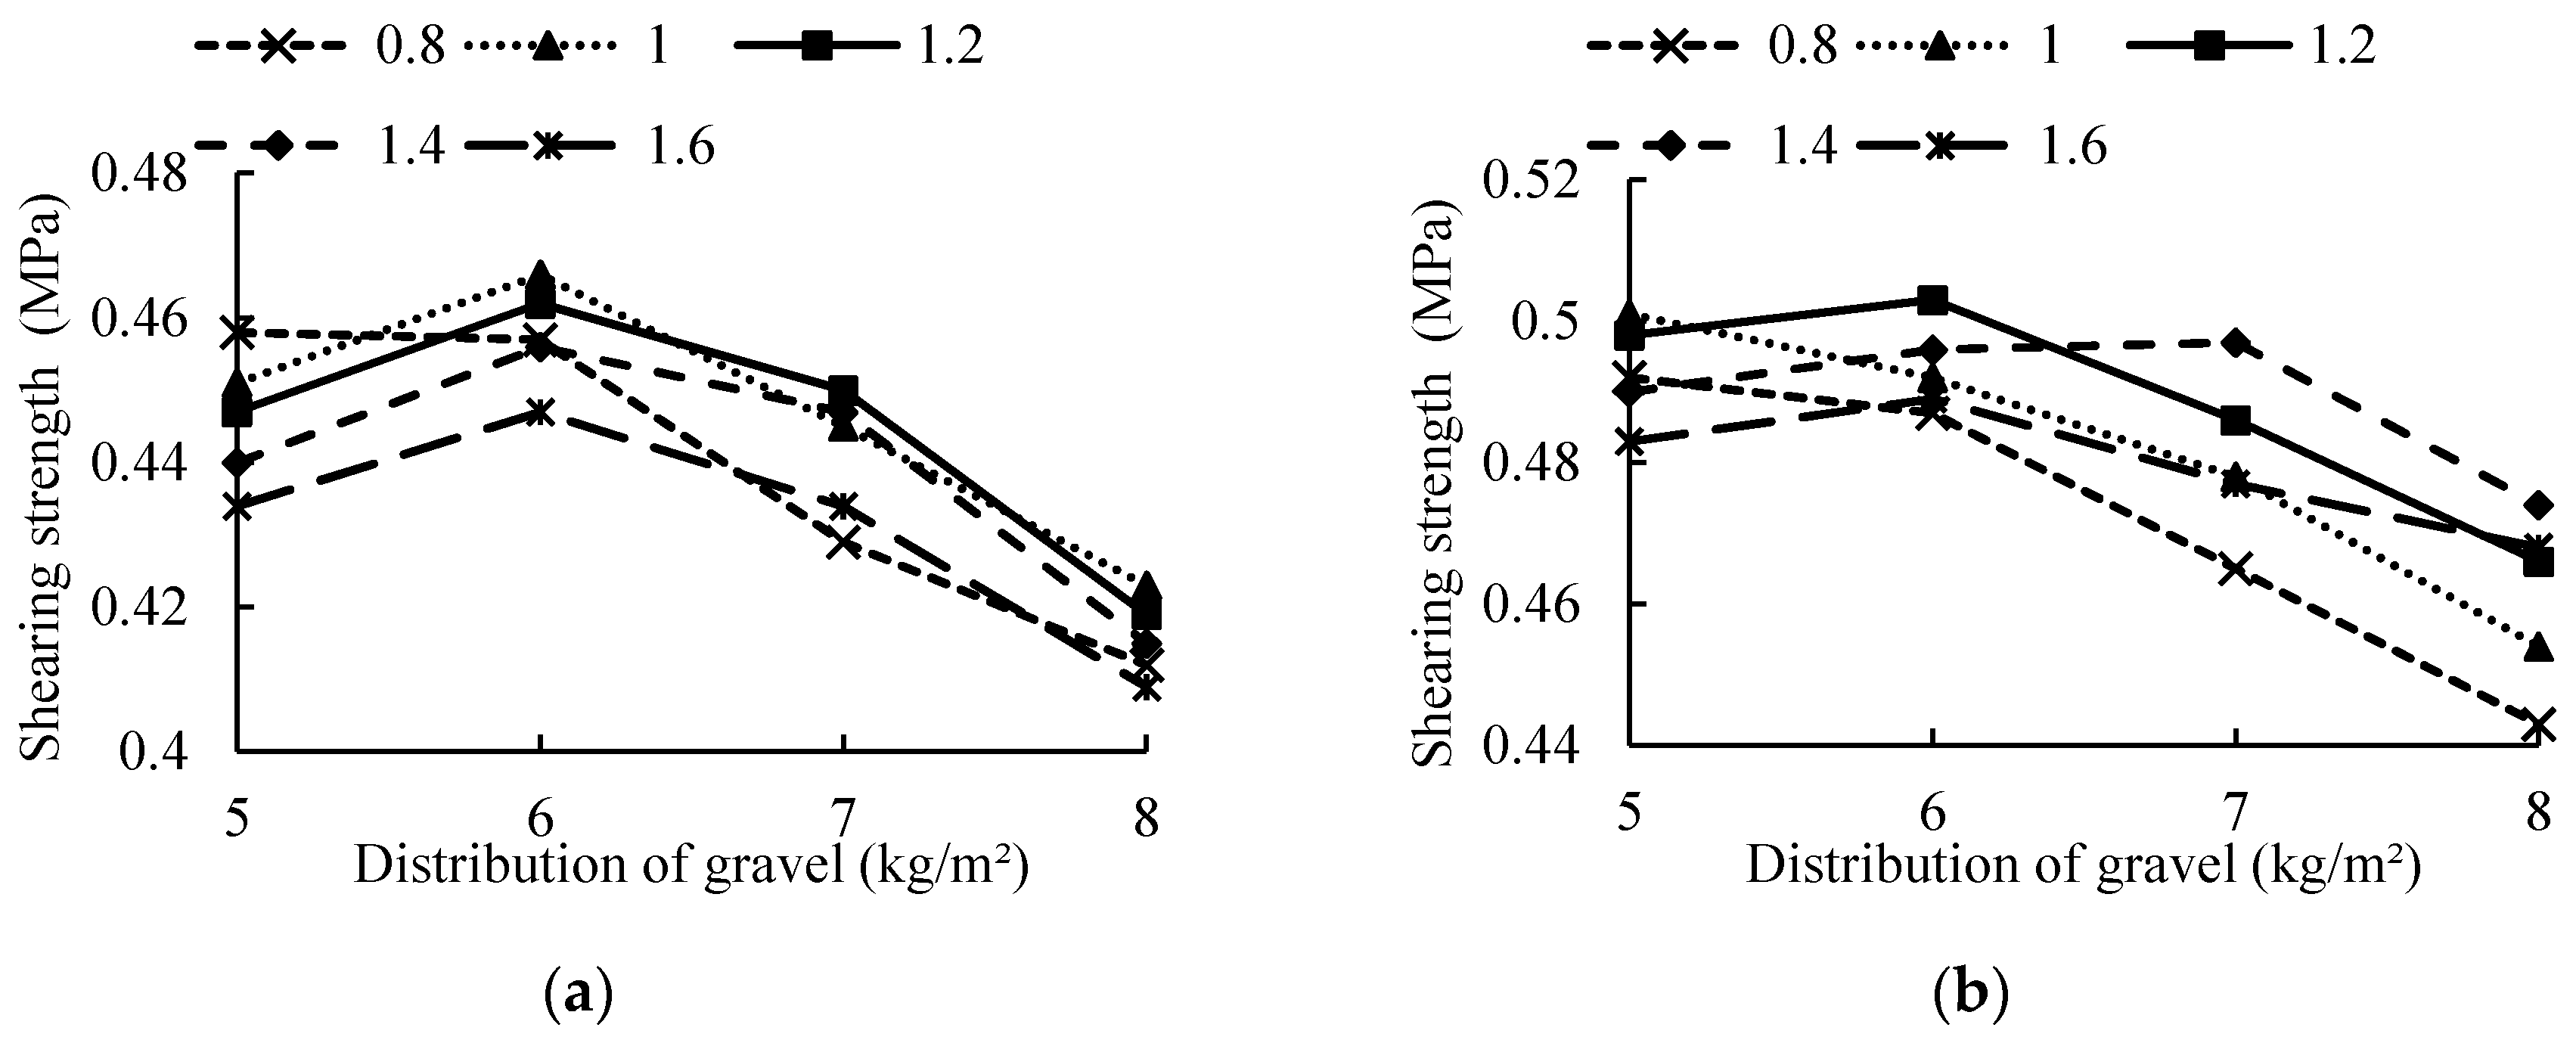
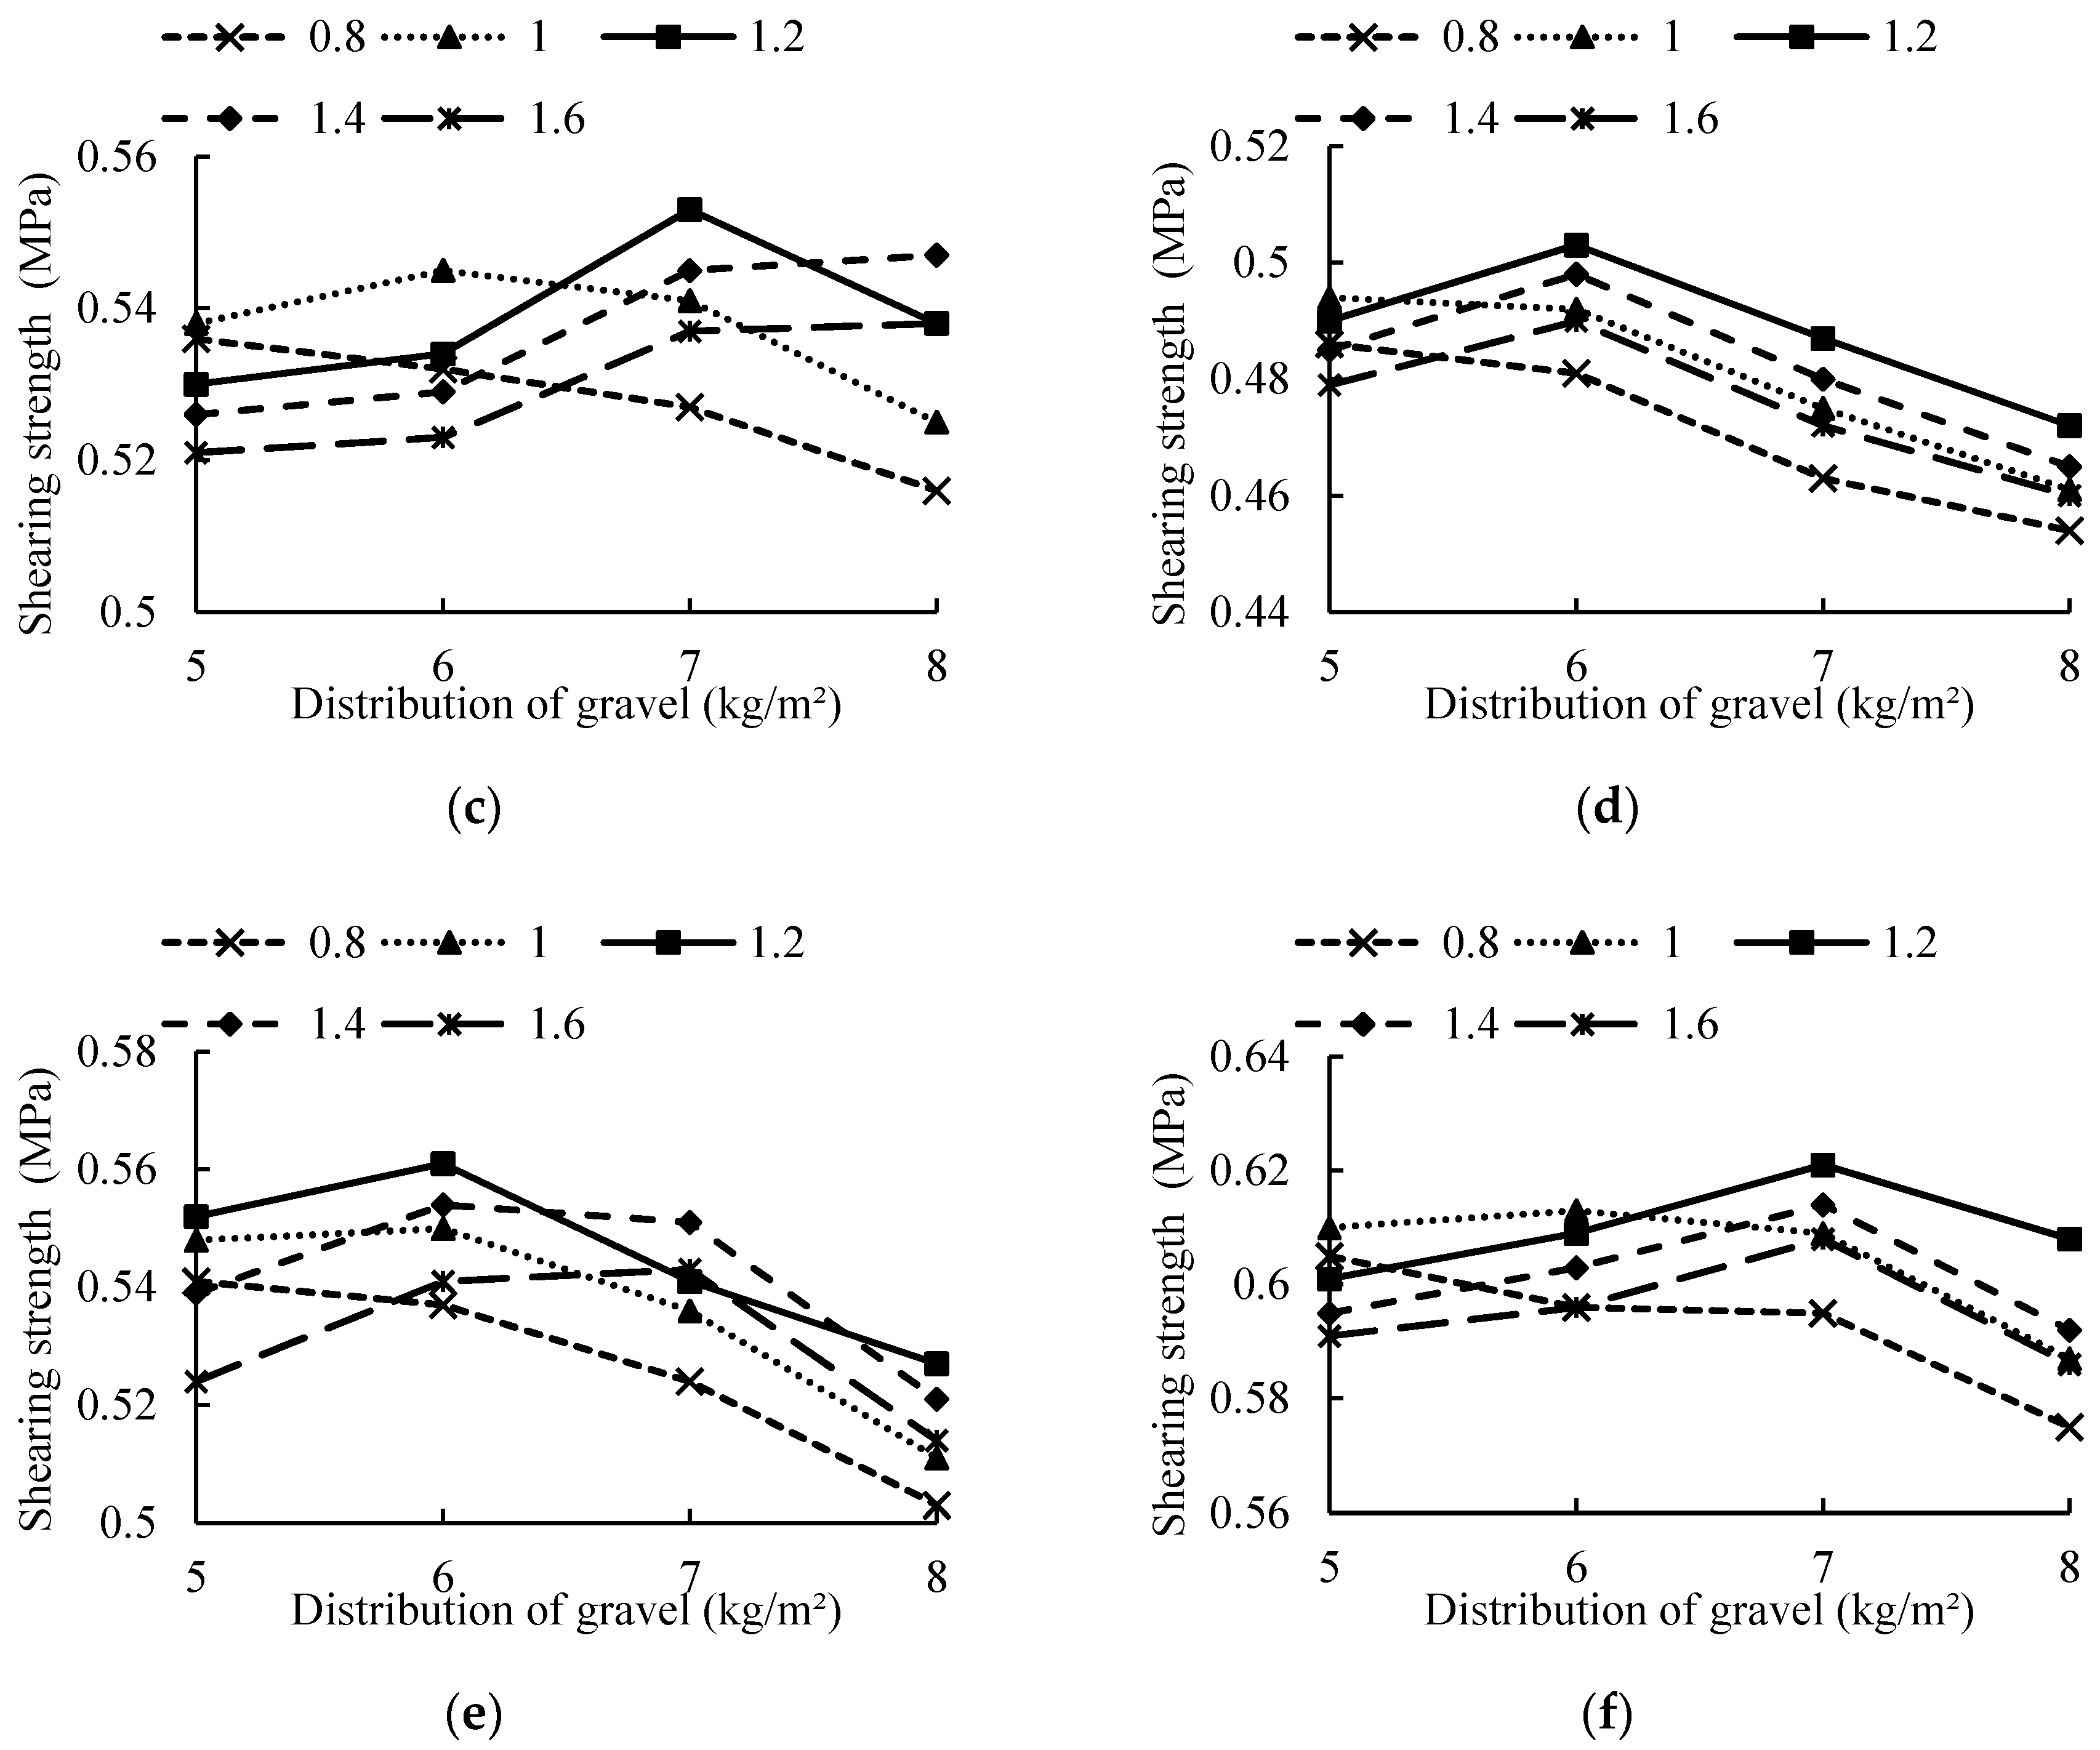
Figure 6.
Shear strength of SBS-modified asphalt with different spreading and disposal schemes: (a) Mod-A-brushed; (b) Mod-A-grooved; (c) Mod-A-exposed; (d) Mod-B-brushed; (e) Mod-B-grooved; (f) Mod-B-exposed.
Figure 6.
Shear strength of SBS-modified asphalt with different spreading and disposal schemes: (a) Mod-A-brushed; (b) Mod-A-grooved; (c) Mod-A-exposed; (d) Mod-B-brushed; (e) Mod-B-grooved; (f) Mod-B-exposed.
Figure 7.
Shear strength of SBS-modified asphalt under different upper layer asphalt content.
Figure 7.
Shear strength of SBS-modified asphalt under different upper layer asphalt content.
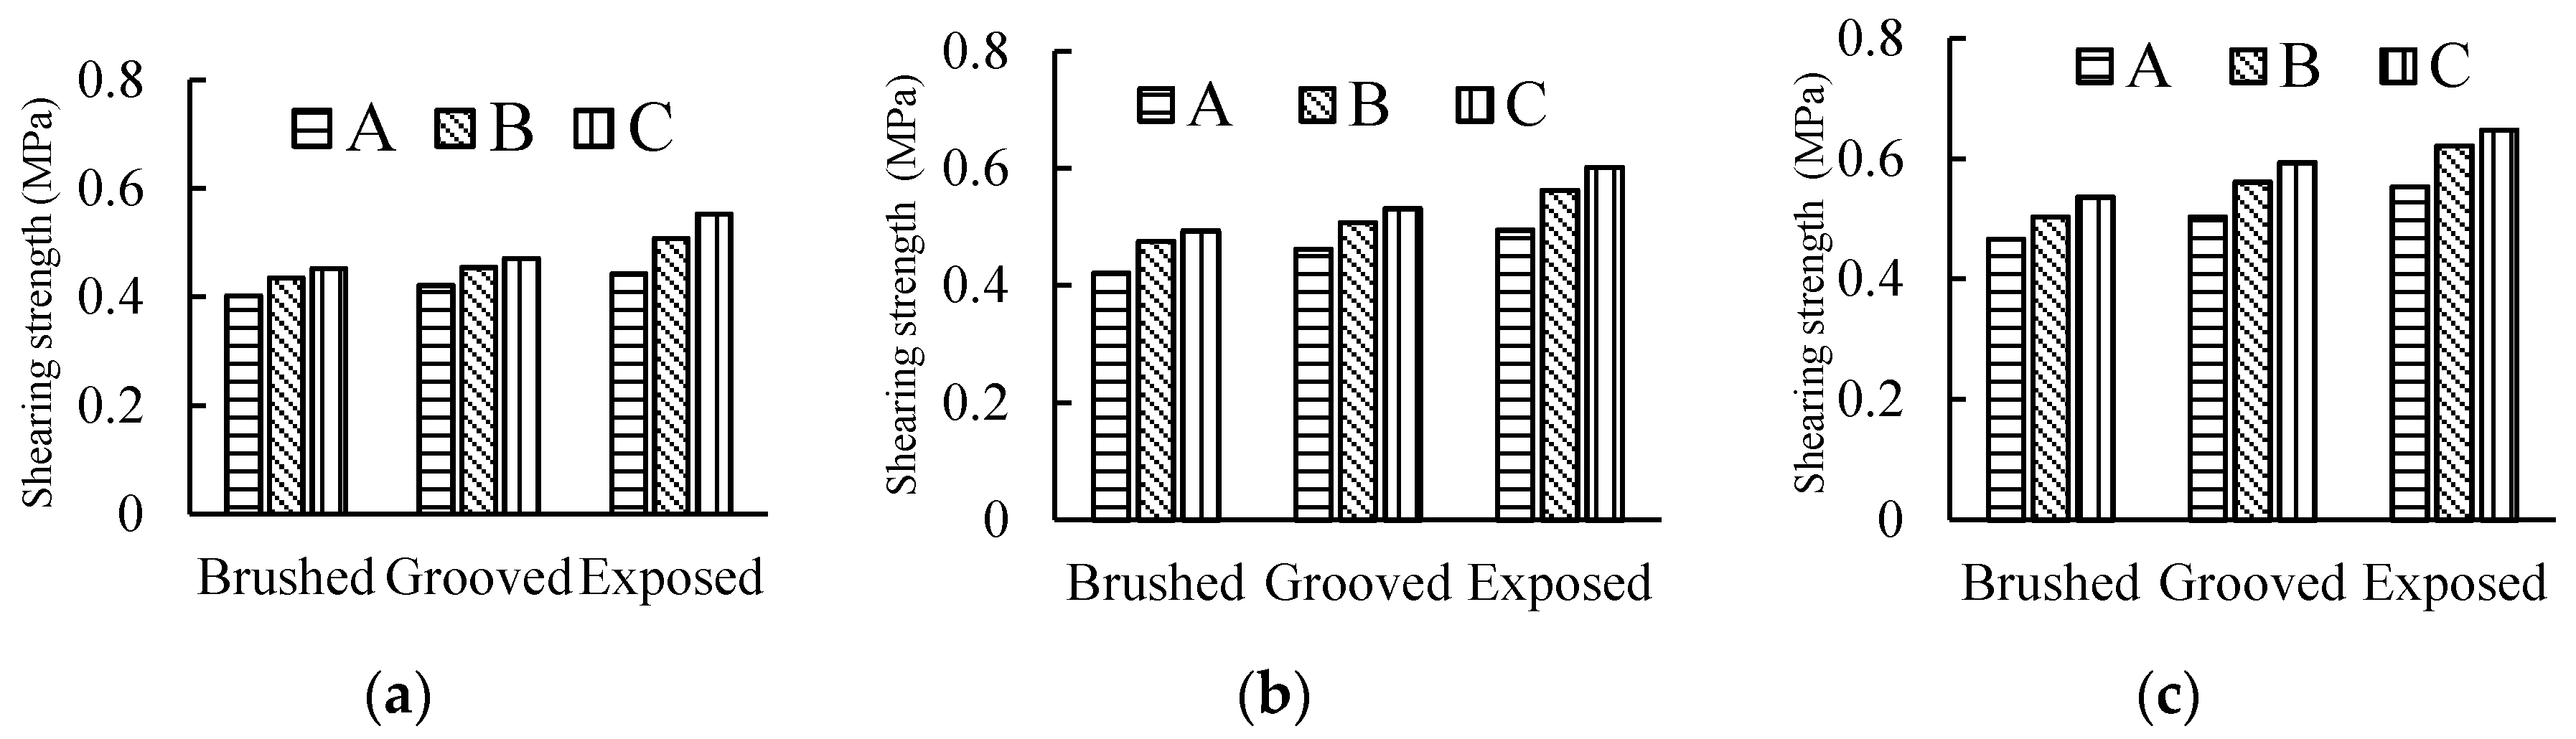
Figure 8.
Maximum shear strength of different cement slab surfaces and spreading schemes: (a) SBS-modified emulsified asphalt; (b) 90 ordinary hot asphalt; (c) SBS-modified asphalt.
Figure 8.
Maximum shear strength of different cement slab surfaces and spreading schemes: (a) SBS-modified emulsified asphalt; (b) 90 ordinary hot asphalt; (c) SBS-modified asphalt.
Figure 9.
The forming and testing process of fatigue samples: (a) electro-hydraulic servo fatigue testing machine; (b) the sample forming process; (c) direct shear test with vertical load.
Figure 9.
The forming and testing process of fatigue samples: (a) electro-hydraulic servo fatigue testing machine; (b) the sample forming process; (c) direct shear test with vertical load.
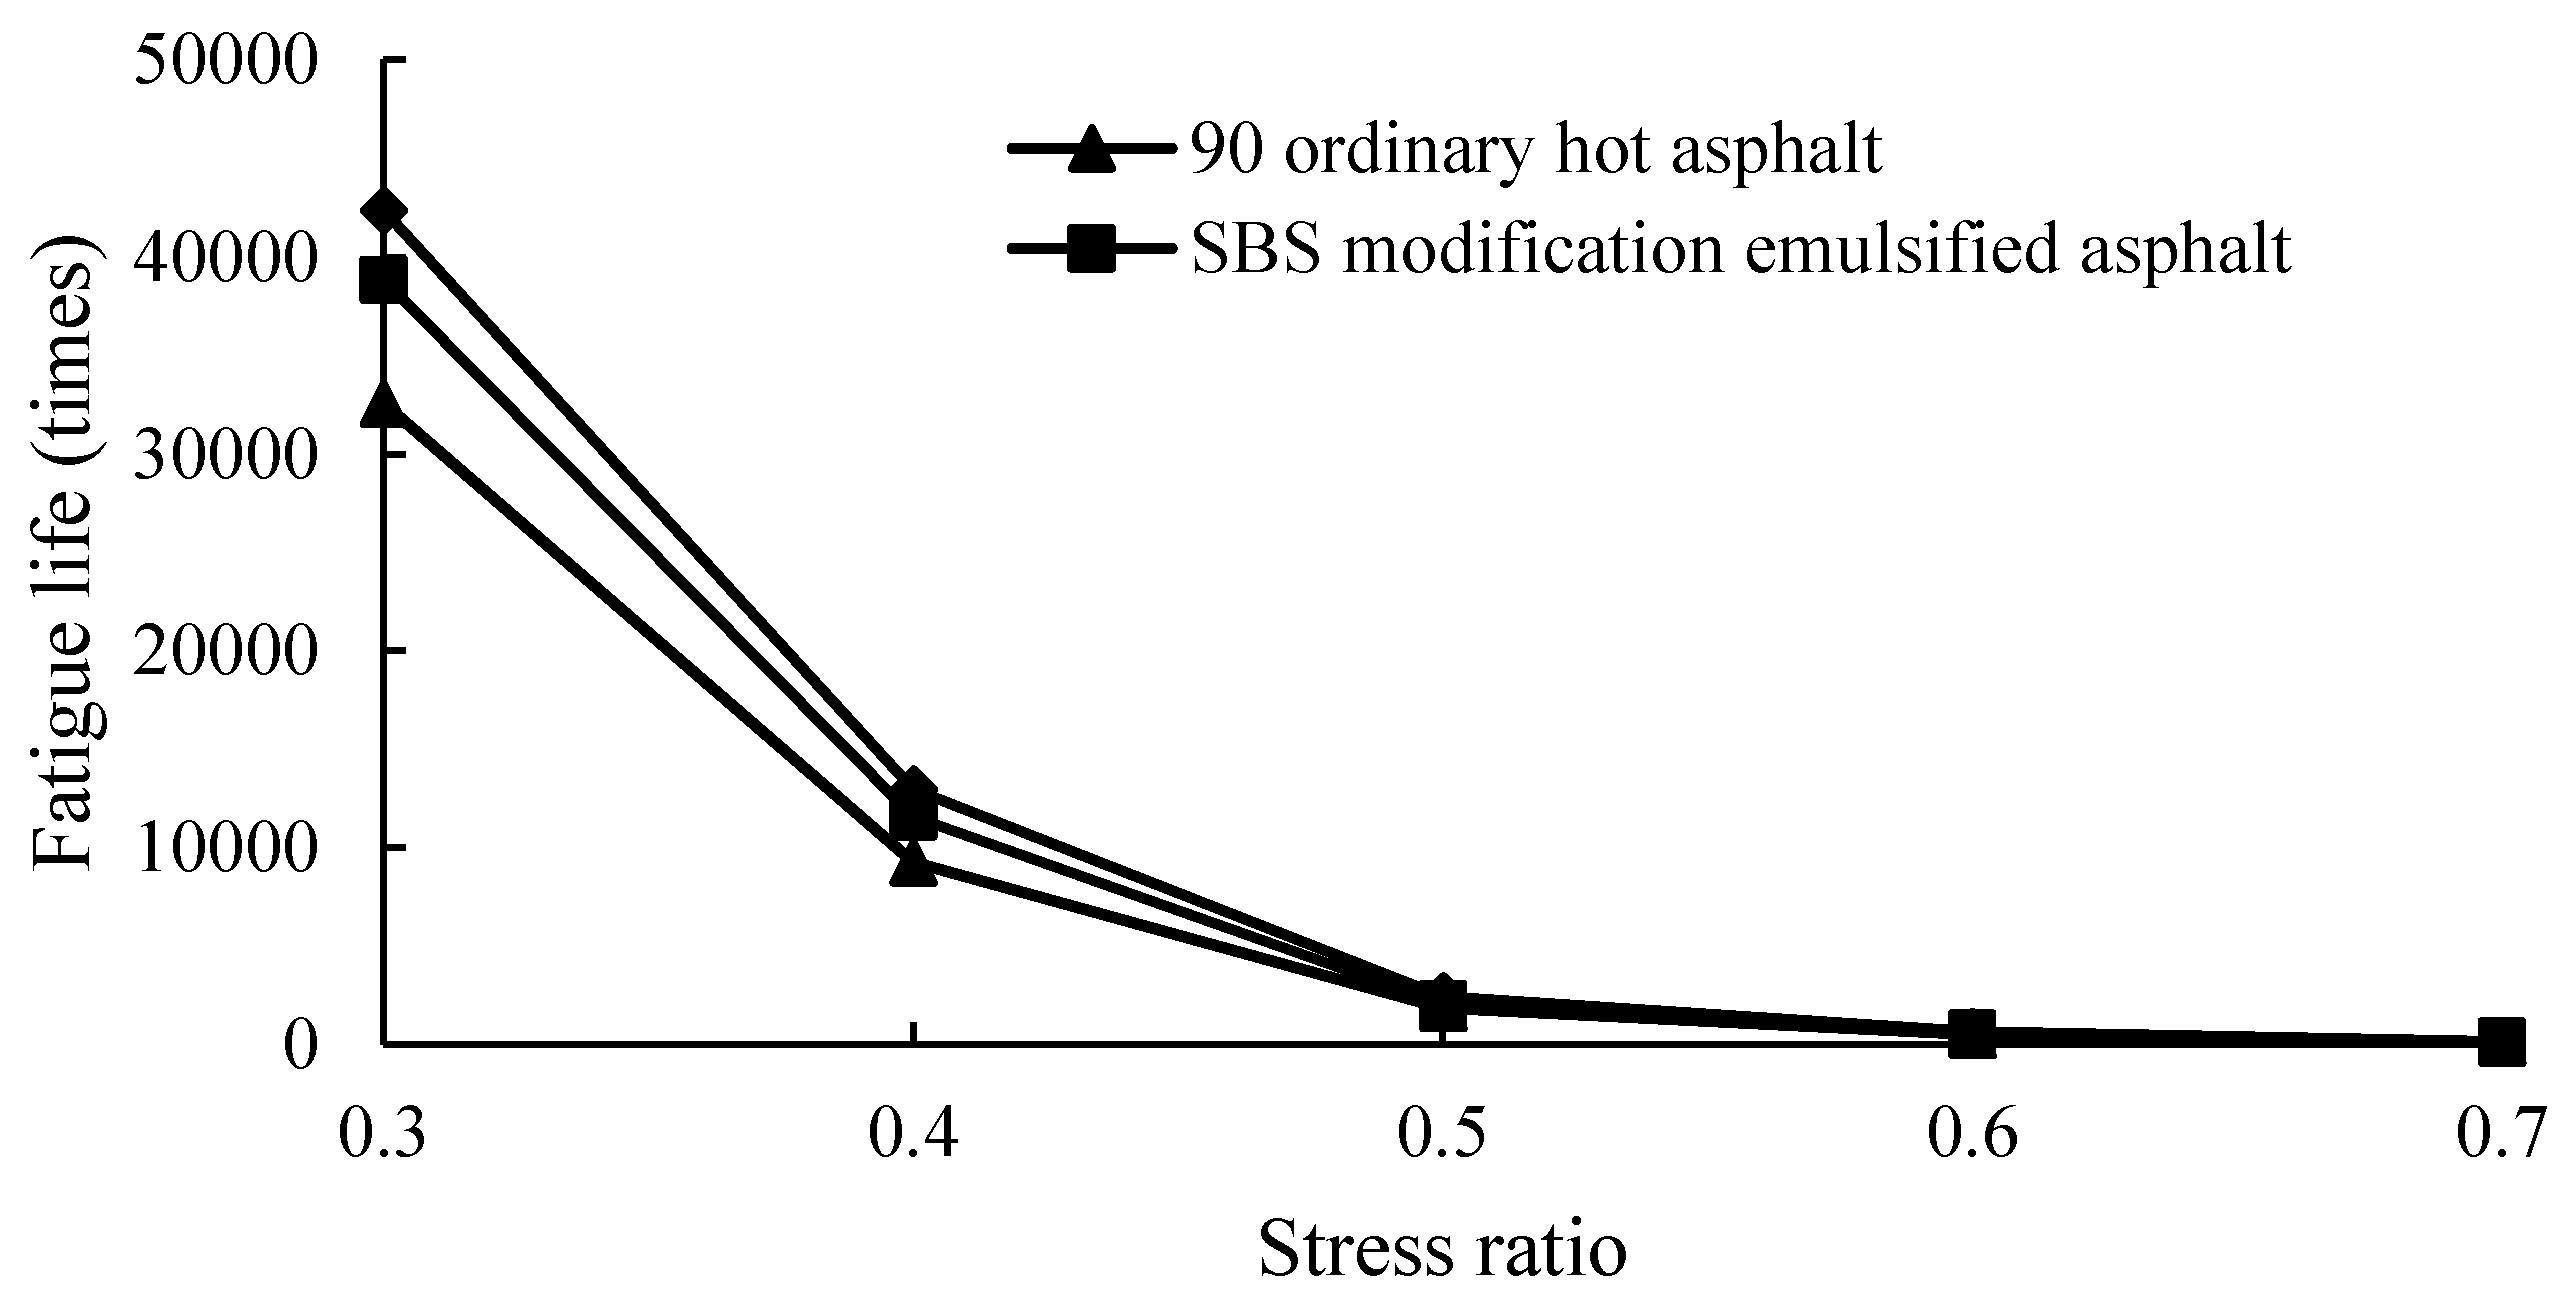
Figure 10.
Variation in fatigue life for different waterproof cohesive layer materials with different stress ratios (15 °C).
Figure 10.
Variation in fatigue life for different waterproof cohesive layer materials with different stress ratios (15 °C).
Figure 11.
Variation in fatigue life for different waterproof cohesive layer materials at different temperatures.
Figure 11.
Variation in fatigue life for different waterproof cohesive layer materials at different temperatures.
Figure 12.
Relationship between fatigue life and stress ratio for different waterproof cohesive layer materials.
Figure 12.
Relationship between fatigue life and stress ratio for different waterproof cohesive layer materials.
Table 1.
Composition of 27 test schemes.
Table 1.
Composition of 27 test schemes.
| Asphalt Type | Spreading Scheme | Disposal Scheme of Cement Slab Surface | Test Scheme |
|---|
| SBS-modified emulsified asphalt | A | brushed cement concrete | Emu-A-brushed |
| grooved cement concrete | Emu-A-grooved |
| exposed aggregate cement concrete | Emu-A-exposed |
| B | brushed cement concrete | Emu-B-brushed |
| grooved cement concrete | Emu-B-grooved |
| exposed aggregate cement concrete | Emu-B-exposed |
| C | brushed cement concrete | Emu-C-brushed |
| grooved cement concrete | Emu-C-grooved |
| exposed aggregate cement concrete | Emu-C-exposed |
| 90 ordinary hot asphalt | A | brushed cement concrete | Ord-A-brushed |
| grooved cement concrete | Ord-A-grooved |
| exposed aggregate cement concrete | Ord-A-exposed |
| B | brushed cement concrete | Ord-B-brushed |
| grooved cement concrete | Ord-B-grooved |
| exposed aggregate cement concrete | Ord-B-exposed |
| C | brushed cement concrete | Ord-C-brushed |
| grooved cement concrete | Ord-C-grooved |
| exposed aggregate cement concrete | Ord-C-exposed |
| SBS-modified asphalt | A | brushed cement concrete | Mod-A-brushed |
| grooved cement concrete | Mod-A-grooved |
| exposed aggregate cement concrete | Mod-A-exposed |
| B | brushed cement concrete | Mod-B-brushed |
| grooved cement concrete | Mod-B-grooved |
| exposed aggregate cement concrete | Mod-B-exposed |
| C | brushed cement concrete | Mod-C-brushed |
| grooved cement concrete | Mod-C-grooved |
| exposed aggregate cement concrete | Mod-C-exposed |
Table 2.
Technical indices of SBS-modified emulsified asphalt.
Table 2.
Technical indices of SBS-modified emulsified asphalt.
| Pilot Project | Unit | Testing Value | Standard |
|---|
| Emulsion stability velocity | — | Quick | Quick or median split |
| Particle charge | — | Cation (+) | Cation (+) |
| Weight of screen residue (1.18 mm) | % | 0.07 | ≤0.1 |
| Engler viscosity E25 | — | 6 | 1-10 |
| Asphalt standard viscosity C25 | S | 13 | 8-25 |
| Evaporation residue content | % | 54 | ≤50 |
| Penetration (100 g, 25 °C, 5 s) | 0.1 mm | 62 | 40–120 |
| Softening point | °C | 55.7 | ≤50 |
| Ductility (5 °C) | 0.1 mm | 37 | ≥20 |
| Solubility (TCE) | °C | 98.6 | ≥97.5 |
| Storage stability 1 d | % | 0.5 | 1 |
| Storage stability 5 d | % | 1.4 | 5 |
Table 3.
Technical indices of 90 ordinary hot asphalt.
Table 3.
Technical indices of 90 ordinary hot asphalt.
| Pilot Project | Unit | Testing Value | Standard |
|---|
| Penetration 25 °C, 100 g, 5 s | 0.1 mm | 95 | 80~100 |
| Penetration index (PI) | — | −1.04 | −1.5~+1.0 |
| Softening point TR&B | °C | 45.0 | ≥44 |
| Dynamic viscosity (60 °C) | Pa·s | 147 | ≥120 |
| Ductility(10 °C, 5 cm/min) | cm | / | / |
| Ductility(15 °C, 5 cm/min) | cm | >140 | ≥100 |
| Wax content | % | 1.2 | ≤2.2 |
| Flash point | °C | ≥230 | ≥245 |
| Solubility | % | 99.9 | ≥99.5 |
Table 4.
Technical indices of SBS-modified asphalt.
Table 4.
Technical indices of SBS-modified asphalt.
| Pilot Project | Unit | Testing Value | Standard |
|---|
| Penetration 25 °C, 100 g, 5 s | 0.1 mm | 71 | 60~80 |
| Penetration index (PI) | — | 0.057 | ≥−0.4 |
| Softening point TR&B | °C | 66 | ≥55 |
| Dynamic viscosity (135 °C) | Pa·s | 2.5 | ≤3 |
| Ductility (5 °C, 5 cm/min) | Cm | 42 | ≥30 |
| Flash point | °C | 265 | ≥230 |
| Solubility | % | 99.7 | ≥99 |
| Elastic recovery (25 °C) | % | 95 | ≥65 |
Table 5.
Mix proportion of cement concrete.
Table 5.
Mix proportion of cement concrete.
| Ingredient | Cement | Expansive Agent | Sand | Fine Aggregate | Coarse Aggregate | Water | Admixture | Steel Fiber |
|---|
| Proportion (kg/m3) | 440 | 38 | 761 | 404 | 605 | 172 | 5.736 | 50 |
Table 6.
Aggregate gradation.
Table 6.
Aggregate gradation.
| Type of the Mixture | Passing Percentage (%) | Optimum Asphalt Content |
|---|
| 19.0 | 16.0 | 13.2 | 9.5 | 4.75 | 2.36 | 1.18 | 0.6 | 0.3 | 0.15 | 0.075 |
|---|
| AC-13 | 100 | 100 | 92 | 70 | 40.3 | 31.5 | 25.4 | 19.2 | 12.7 | 9.2 | 5.9 | 4.9% |
Table 7.
Waterproof cohesive layer material quantity (kg/m2).
Table 7.
Waterproof cohesive layer material quantity (kg/m2).
| Material | Lower Asphalt | Stone | Surface Asphalt |
|---|
| SBS-modified emulsified asphalt | 1.4 | 7.0 | 0.6 |
| 90 ordinary hot asphalt | 1.4 | 7.0 | 0.4 |
| SBS-modified asphalt | 1.2 | 7.0 | 0.4 |
Table 8.
Shear strength of the waterproof cohesive layer in different interlayer bonding states.
Table 8.
Shear strength of the waterproof cohesive layer in different interlayer bonding states.
| Material | Shear Strength Value (MPa) | Maximum Shear Strength (kN) |
|---|
| SBS-modified emulsified asphalt | 1.112 | 8.5 |
| 90 ordinary hot asphalt | 1.035 | 7.8 |
| SBS-modified asphalt | 1.128 | 8.6 |
Table 9.
Shear fatigue equations for different waterproof cohesive layer materials.
Table 9.
Shear fatigue equations for different waterproof cohesive layer materials.
| Material | Shear Fatigue Equation | Prediction Model | Coefficient of Determination |
|---|
| SBS-modified emulsified asphalt | | | 0.982 |
| 90 ordinary hot asphalt | | | 0.980 |
| SBS-modified asphalt | | | 0.977 |
Table 10.
Temperature correction coefficient for the fatigue life model.
Table 10.
Temperature correction coefficient for the fatigue life model.
| Test Temperature (°C) | | |
|---|
| SBS-Modified Emulsified Asphalt | 90 Ordinary Hot Asphalt | SBS-Modified Asphalt |
|---|
| 15 | 1.00 | 1.000 | 1.000 | 1.000 |
| 20 | 1.33 | 0.732 | 0.707 | 0.739 |
| 25 | 1.67 | 0.581 | 0.545 | 0.576 |
| 30 | 2.00 | 0.471 | 0.448 | 0.479 |
| 35 | 2.33 | 0.400 | 0.360 | 0.406 |
| 40 | 2.67 | 0.339 | 0.305 | 0.353 |
| −1.10 | −1.20 | −1.06 |
Table 11.
Shear fatigue life prediction model for waterproof cohesive layer materials with temperature correction.
Table 11.
Shear fatigue life prediction model for waterproof cohesive layer materials with temperature correction.
| Material | Prediction Model |
|---|
| SBS-modified emulsified asphalt | |
| 90 ordinary hot asphalt | |
| SBS-modified asphalt | |
Table 12.
values for different bonding materials.
Table 12.
values for different bonding materials.
| Material | SBS-Modified Emulsified Asphalt | 90 Ordinary Hot Asphalt | SBS-Modified Asphalt |
|---|
| 6.704 | 6.675 | 6.719 |
| 3.55 | 3.54 | 3.56 |
Table 13.
Frequency data for air temperature distribution in Ulanchabu.
Table 13.
Frequency data for air temperature distribution in Ulanchabu.
| Temperature Range (°C) | −30 to −20 | −20 to −10 | −10 to 0 | 0 to 10 | 10 to 20 | 20 to 25 | 25 to 30 | 30 to 35 |
| Distribution Frequency | 0.04 | 0.14 | 0.21 | 0.25 | 0.19 | 0.09 | 0.06 | 0.02 |
Table 14.
Representative temperature distribution frequency between decks in Ulanchabu.
Table 14.
Representative temperature distribution frequency between decks in Ulanchabu.
| Interlayer Temperature (°C) | 11.8 | 16.4 | 23.2 | 27.8 | 32.3 |
| Distribution Frequency | 0.64 | 0.19 | 0.09 | 0.06 | 0.02 |
Table 15.
Equivalent temperatures of different waterproof cohesive layer material.
Table 15.
Equivalent temperatures of different waterproof cohesive layer material.
| Material | | |
|---|
| SBS-modified emulsified asphalt | 1.10 | 15.15 |
| 90 ordinary hot asphalt | 1.20 | 15.24 |
| SBS-modified asphalt | 1.06 | 15.12 |
Table 16.
Predicted shear fatigue life for different waterproof cohesive layer materials at 15 °C (0.4 MPa interlayer shear stress).
Table 16.
Predicted shear fatigue life for different waterproof cohesive layer materials at 15 °C (0.4 MPa interlayer shear stress).
| Material | Prediction Model | |
|---|
| SBS-modified emulsified asphalt | | |
| 90 ordinary hot asphalt | |
| SBS-modified asphalt | |


