Article

Can Phosphorus from Recycled Fertilisers Replace Conventional Sources? An Agronomic Evaluation in Field-Scale Experiments on Temperate Luvisols

by
Magdalena Jastrzębska
1,*,
Marta K. Kostrzewska
1 and
Agnieszka Saeid
2
1
Department of Agroecosystems, Faculty of Environmental Management and Agriculture, University of Warmia and Mazury in Olsztyn, Plac Łódzki 3, 10-718 Olsztyn, Poland
2
Department of Advanced Material Technologies, Faculty of Chemistry, Wrocław University of Science and Technology, Smoluchowskiego 25, 50-372 Wrocław, Poland
*
Author to whom correspondence should be addressed.
Appl. Sci. 2019, 9(10), 2086; https://doi.org/10.3390/app9102086
Submission received: 15 April 2019 / Revised: 15 May 2019 / Accepted: 16 May 2019 / Published: 21 May 2019
(This article belongs to the Special Issue Techniques for Sustainable Processing of Natural Resources)

Abstract

:
Facing phosphate rock scarcity, growing food requirements and pollution problems with phosphorus (P)-containing waste, re-using P as fertiliser is becoming a real need. Innovative fertilisers from sewage sludge ash, animal bones and blood, activated by phosphorus solubilising microorganisms (PSM), were tested in field experiments with winter or spring wheat and compared with commercial fertilisers (superphosphate, phosphorite). Three levels of P doses were established (17.6, 26.4 and 35.2 kg/ha). This paper discusses the fertilisers’ impact on total soil P content and on the P content and P accumulation in wheat grain and straw, weeds and post-harvest residues. Recycled fertilisers maintained soil P stocks and supplied plants with P in the same way as traditional fertilisers, and ensured a comparable P pool in the post-harvest residues to traditional fertilisers. They also did not favour weeds during competitive crop-weed interactions. The PSM included in waste-fertilisers did not exert an evident effect on the soil P content or on the P content and P accumulation in plant biomass. The findings show the potential of recycled fertilisers to act as a substitute to fertilisers from primary sources. Further field research is needed to settle the question of the reasonability of PSM inclusion into fertilisers.

Graphical Abstract

1. Introduction

The development of the global economy has resulted in unsustainable overuse of the natural resources available on Earth [1]. The situation is worsening as the world population approaches 9 billion. In the countries of the Global North, consumer excess accompanied by great wastage has occurred since the 1970s [2]. In recent years, Brazil, Russia, India and China have contributed significantly to this growing consumption [3]. Moreover, the consequences of resource use in terms of impact on the environment may induce serious damage that goes beyond the carrying capacity of the environment [4].
In September 2015, the United Nations General Assembly formally adopted a set of 17 Sustainable Development Goals (SDGs), which are to be implemented and achieved in every country from the year 2016 to 2030 [5]. The circular economy (CE) is considered an important means to meet the challenges of SDGs [6]. This concept entails gradually decoupling economic activity from the consumption of finite resources and is based on three principles: design out waste and pollution, keep products and materials in use and regenerate natural systems. It is forecast that a transition to CE approaches will provide more than U.S. $1 trillion globally in material cost savings by 2025 [7].
Phosphorus (P) recovery and recycling is considered a possible CE pilot, in other words, a potential case to demonstrate that CE principles work in practice [8].
P is an element of great biological importance [9]. The availability of P for crops ensures the proper growth of plant roots, good condition of the stem, adequate formation of flowers and fruits, timely ripening, appropriate volume and quality of yields, intensive N2 fixation by leguminous plants and a stronger resistance of all plants to biotic and abiotic stress factors [9,10].
The natural resources of phytoavailable P in arable soils do not fully satisfy the nutritional requirements of field plant communities [10], which must therefore receive some of this element from fertilisers [11]. The production of mineral phosphorus fertilisers almost completely relies on phosphate rock [12]. Although the P resources and stocks in the world are still relatively large [13], it is not disputed that they are limited and non-renewable. Li et al. [14] indicate that without proper management, phosphate rock will be depleted within the next 70~140 years. In addition, phosphate rock resources are unevenly distributed across the globe: most are located in Africa (71.4% of the P resources are controlled by Morocco and Western Sahara) [13]. This makes the European Union (EU), for example, largely dependent on imported phosphorites. Phosphate rock was included on the EU list of 20 critical resources in 2014 [15] and is still indicated on the updated list in 2017 [16].
The limited P resources can be compensated for by recycling used materials [17]. It is indicated that waste recovery at approximately 50% may defer the phosphate rock depletion time by 50 years [14]. A major step in this direction has been taken in some European countries, such as Switzerland, Germany and Austria, which have made the recycling of P from sewage sludge and slaughterhouse waste mandatory [18].
In recent years, many scientific centres have been involved in exploring suitable P substitutes among secondary raw materials and developing new methods of P recovery for fertiliser industry purposes [11,19,20,21,22,23]. Sewage sludge ash (SSA) is claimed to combine the most promising P source and recovery technologies [24]. Methods based on sewage sludge biomass incineration eliminate organic pollutants, microorganisms and pathogens [17]. The final form of mineral ash contains 7–12% P [17]. The problem of toxic elements residues in SSA is also proving to be solvable [11,20,22,23]. Slaughter industry by-products are also a valuable P source. Animal bones have been used for fertiliser purposes since biblical times [25]. In poultry bones, for example, the P content is 5–9% [26,27]. Animal blood is also used as fertiliser [28]. Although blood meal contains only 0.22% P, it also has 12% N and trace elements [29]. In addition, animal blood is a good binder that can be used in fertiliser production [29].
P-fertilisers produced from secondary raw materials will be able to replace or supplement traditional fertilisers, provided that they are as effective as the latter, in other words, that they provide crops with P nutrition enough to build the same yield volume and do not impair the yield or endanger the environment. Many new P products have been tested for P plant availability and crop-enhancing efficiency [20,21,22,23]. Although the results described seem to be optimistic, most of them were obtained in pot experiments and need confirmation in field trials [30].
Scientists from the Wrocław University of Science and Technology, the Institute of New Chemical Synthesis in Puławy and the University of Warmia and Mazury in Olsztyn (Poland) have developed an innovative technology for producing P-fertilisers from cheap renewable raw materials—SSA, animal (poultry) bones and dried animal blood. Most of them have been activated by phosphorus solubilising microorganisms (PSM). The additional potential of the PSM introduced into fertilisers is related to soil P solubilisation [31] and plant growth promotion [32]. New recycled fertilisers were evaluated for their agronomic utility in field experiments against traditional P-fertilisers. This paper addresses the dynamics of the total P content in soil under the influence of fertilisers from waste, as well as P content and accumulation in crop plants and accompanying weeds, and in the biomass of post-harvest residues. Based on the research, the following questions are expected to be answered: (i) Will waste-fertilisers not be worse than traditional fertilisers in maintaining soil P stock? (ii) Will they provide the same nourishment of crop plants with P and thus guarantee the same P content and accumulation in the main and by-product yields? (iii) Will they change the P content and accumulation by weeds and thus the weed competitiveness against crop plants? (iv) Will they ensure the same P pool in the post-harvest residues? (v) Will PSM present in fertilisers affect the soil P stock, and the P content and accumulation in the crop, weeds and post-harvest residues?

2. Materials and Methods

In the years 2014–2016, eight innovative fertilisers from recyclable materials were tested, with these being composed of ash from the incineration of sewage sludge biomass from wastewater treatment (SSA), poultry bones and dried animal blood. Six of them were biologically activated by PSM of the Bacillus megaterium or Acidithiobacillus ferrooxidans strains. The SSA originated from the Municipal Wastewater Treatment Plant ‘Łyna’ in Olsztyn (Poland), and bones and dried blood originated from the meat industry. The microbe strains were obtained from the Polish Collection of Microorganisms at the Institute of Immunology and Experimental Therapy of the Polish Academy of Sciences in Wrocław (Poland). Fertilisers were in the form of a suspension or granules. Table 1 presents the general characteristics of the new products. The production process was described in separate articles [33,34].
Five field experiments with winter or spring common wheat (Table 2) were conducted, in which new products were confronted with conventional fertilisers: superphosphate Fosdar 40 (SP, 17.6% mass P) and/or phosphorite Syria (PR, 12.2–12.9% mass P). In experiment I, an ash-water solution (A + H2O, 0.176% mass P) was also included.
In experiment I, P-fertilisers were applied at a P dose of 21 kg/ha, and in experiments II–V, three different P levels were established: 17.6, 26.4 and 35.2 kg/ha. Suspension fertilisers were applied by large-drop sprinkling of the soil and solid fertilisers were manually scattered on the soil surface. The fertilisers were mixed with the soil by harrowing. In experiment I, the plants were not protected against weeds or pests (−PP), in experiment II, two variants of plant protection were adopted: without the protection (−PP) and with full protection (+PP) and in experiments III-V, full protection (+PP) was applied. Full protection (+PP) means the application of herbicides, fungicides, insecticides and growth regulators.
Each year, wheat was grown in soil that met the requirements of the species (Table 3). The basic agrotechnical data for the experiments are presented in Table 4. Precipitation and thermal conditions in the growing seasons differed from those typical of the region and were not favourable for the grown plants (Table 5). In experiments I–III, the growing seasons for spring and winter wheat were very dry, while in experiment IV and V winter and spring wheat developed under rather wet weather conditions. The soil water content can change the P availability for plants and P uptake by plants [35], and abundant precipitation can be conducive to P leaching from the soil tillage layer into groundwater or water ecosystems [36].
Experiments I and III–V were established in a randomised block design and experiment II in a parallel strip design. In each experiment, particular experimental variants were performed in four replications (plots). The area of a single experimental plot was 20 m2.
Soil samples were taken from the 0–30 cm soil layer twice: before the start of the experiment and after wheat harvest. They were collected from each plot separately at evenly distributed points using a hand-held twisting probe (Egner’s stick). A total of about 1 kg of soil was taken from a single plot. The collected soil material was dried at room temperature for several days, then thoroughly mixed and sieved. Afterwards, the separated portions of about 300 g each were forwarded for chemical analyses.
Grain samples of approximately 1 kg from each plot were taken from the volumes obtained after combine harvesting. From these samples, portions of about 200 g of grain were weighed and forwarded to chemical analyses after previous cleaning from impurities and weed seeds.
Shortly before harvest, the samples of straw (i.e., wheat stems with leaves) and weeds were collected. Wheat plants were collected manually from two 1-metre-long rows of each plot. The spikes were removed and the roots were cut off at a level equal of the harvester’s mowing height. Straw was cut into pieces of about 10 cm in length. Weeds were taken from a randomly determined area of 0.25 m2 (0.5 m × 0.5 m frame) from each plot. Weed roots were separated from the aboveground parts and removed. Just after wheat harvest, post-harvest residues (i.e., wheat roots and bottom stem segments (stubble), and the residues of weeds that were not removed from the field during combine harvesting) were sampled from each plot. Soil columns with a surface area of 0.40 m2 and a depth of 0.30 m were dug up and then washed on sieves to remove soil pieces. The plant material was dried at room temperature for several days. Afterwards, straw portions of 50 g and weed and post-harvest residue samples in their entirety were forwarded for chemical analyses.
The P content in soil and plant biomass was determined using an inductively-coupled plasma-optical emission spectrometer (ICP-OES). An appropriate mass (0.5 g) of biological materials was digested in Teflon vessels (microwave oven Milestone MLS-1200, Sorisole, Bergamo, Italy) with 10 mL of aqua regia for soil samples and with 5 mL of concentrated 65 mg/kg HNO3 suprapur grade from Merck for plant samples. After mineralization, all samples were diluted to 50 mL. An ICP-OES with a pneumatic nebulizer with an axial view (iCAP Duo Thermo Scientific, Waltham, MA, USA) was used to measure the P content in all digested and diluted samples. The P accumulation in plant biomass was calculated by multiplying the P content in grain, straw, weeds and post-harvest residues by their biomass volumes. The results were converted into 1 ha.
The data were submitted to an analysis of variance (ANOVA), or the alternative Kruskal–Wallis test if the analysis of variance assumptions were not met. The normality of variable distribution was checked using the Shapiro–Wilk W-test and the homogeneity of variance was checked using the Levene’s test. The differences between objects were evaluated using the Duncan’s test or a multiple comparison test. The relationships between the variables were expressed using simple correlation coefficients determined based on the data from all experiments. The calculations were performed using Statistica 12.0 software (Dell Inc., Aliso Viejo, CA, USA).

3. Results and Discussion

3.1. Total Soil Phosphorus (P) Content

The level of total soil P in our experiments (Table 6) oscillated around the mean and median for Polish soils, both of which are 500 mg/kg [37], as well as around the lower limit of the range of 500–1000 mg/kg, adopted by Montange and Zapata [38] for the average total P content. The natural P stocks of the soil is mainly determined by the parent rock, but fertilisation, which supplements P losses from the soil (plant uptake, erosion losses, surface runoff, and leaching to groundwater), also has a large impact [39]. To increase crop yields, in many agricultural systems P has been historically oversupplied as phosphate fertilisers [40]. The soils on which our experiments were conducted have been systematically enriched with P over the years, but in the context of data provided by Barberis et al. [41] for European soils overfertilised with P (average total P content 1111 mg/kg, maximum 1920 mg/kg), they can hardly be considered overfertilised.
Compared with the starting situation, no P treatment resulted in a significant decrease of P content after wheat harvest in experiments I, IV and V, which was not proven in other experiments, although a clear tendency to decrease was observed. This decrease was undoubtedly due to the use of part of the soil P stock by plants and the P removal from the field during harvesting (Table 7). It cannot be ruled out that mobile P forms may be leaching from the soil [36]. According to Zhu et al. [40], the risk of the latter losses increases with increased P stocks in the soil. Studies by Zicker et al. [42] prove that the mere P uptake by crop plants without fertilisation leads to a negative P budget in the soil, which deepens over time. Rationale fertilisation (right form, right rate, right time, right method) should cover the nutritional needs of crop plants and prevent the decrease of soil P reserves [43]. The application of P-fertilisers in our studies generally provides good protection of soil P stocks against their depletion through crop uptake or leaching. A decrease in total P content despite fertilisation was noted only in experiment IV (except for ABgBm at a P dose of 35.2 kg/ha). An increase in total P content was found in experiment II under −PP where PR and AsBm were applied at P doses of 35.2 kg/ha, and in experiment III when SP and AgAf were applied at P doses of 26.4 and 35.2 kg/ha and ABgAf at a P dose of 35.2 kg/ha. In other cases, no differences in relation to the initial state were proven.
It is known that due to the high P fixing capacity of most soils and the low P use efficiency (around 10–15%) of most crops, surplus P input from fertilisers tends to accumulate in soils [44]. This accumulation is known as ‘legacy P’ and is calculated as the difference between inputs and outputs [45]. These stocks can be used by the plants, provided that they are activated. According to Zhu et al. [40], ‘legacy P’ represents a significant potential secondary P source that could substitute manufactured fertilisers, at least in part. Moreover, Khan et al. [46] suggested that the accumulated (surplus) P in agricultural soils is sufficient to sustain crop yields worldwide for about 100 years, if it were available.
In our studies, no significant differences in soil P content after the application of traditional and recycling fertilisers were found when they were applied at the same P doses (Table 6). In experiment II, regardless of plant protection treatments, the total soil P content increased with the increase in the P dose applied in fertilisers, while in other experiments only an increasing tendency was noted. These results seem to confirm the thesis that the fertiliser type can be much less substantial than the P amount applied [42]. In three other European long-term field experiments, where the annual P dose ranged between 23 and 35 kg/ha (and did not exceed the doses used in our experiments), the soil P content did not increase significantly [47]. We reported elsewhere that the increase in fertiliser doses up to 26.4 and 35.2 kg P/ha was usually already statistically ineffective [48]. Those findings, together with the tendency to accumulate unused P in soil, as discussed here, should provide a basis for a rational P-fertiliser dosage.
The lack of differences between applied fertilisers in terms of their impact on soil P stock proves the possibility of replacing fertilisers produced from non-renewable phosphate rock by waste-based fertilisers. These findings are in line with the results of a pot experiment by Weigand et al. [11] with rapeseed as a test plant, where the total soil P level increased with a P dose without clear differences between fertilisers—triple superphosphate (TSP) and SSA-based fertiliser.
PSM included in the fertilisers are expected to solubilise the P from the fertiliser substrate, but also to support the activation of unavailable P in the soil [19]. Potentially, therefore, as an activator of soil P stock [40], PSM may make P more accessible to plants, but also easier to be leached and ultimately contribute to the depletion of the soil P pool. In our studies, no such effects were observed when comparing the impact of ABgBm and AHgBm with ABg and AHg, respectively.

3.2. P Content and Accumulation in Plant Biomass

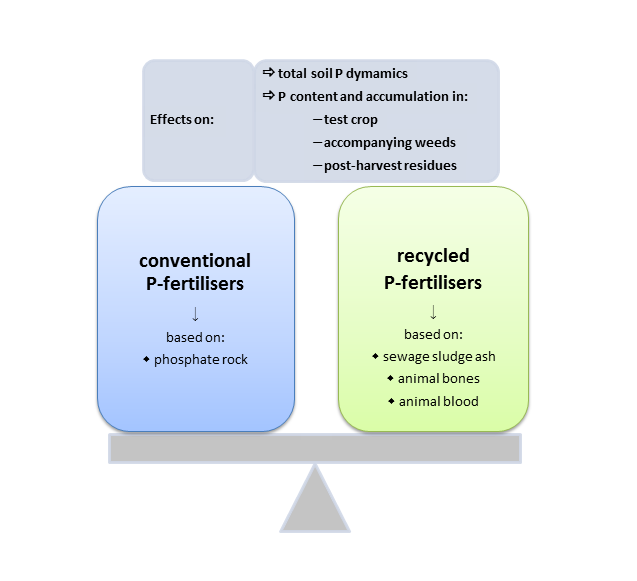
3.2.1. Wheat Grain and Straw

Crop plants are the main beneficiaries of soil resources and fertiliser support in an arable field. The range of P content determined in wheat grain and straw in our studies (Table 7) did not differ from the values reported in the literature [49,50]. The grain contained 5–15 times more P than straw, which is natural for cereals [51]. The wide range of grain P to straw P proportion in our experiments confirms that plants primarily provide P for seeds, and a large part of assimilates are transported from older leaves and stems to the generative parts before harvesting [52,53].
None of the presented experiments showed a significant effect of the applied fertiliser treatments on the P content in wheat grain and straw. In experiment II, P content in grain increased under +PP, mainly due to reduced competition from weeds [54], but also partly at the cost of straw [53]. Plant protection did not change the effect of fertiliser treatments.
The P content in grain and straw in our experiments had a strong positive correlation with the P content in soil (Table 8). It was also claimed by Kratochvil et al. [55] that luxury consumption of P does occur in agronomic species produced on P-enriched soils. A strong positive correlation was found between the P content in wheat grain and straw (Table 9), as was also reported by Shi et al. [56], as well as between P content in grain and in post-harvest residues. Winter wheat (experiments III and IV) showed a noticeably lower P content in grain than spring wheat (experiments I, II and V), which may be linked to a dilution effect [57] due to the higher yield of winter wheat grain (7.07–9.78 t/ha) as compared with spring wheat (4.18–6.70 t/ha). On the basis of research conducted in Sweden, Hussain et al. [58] reported the opposite—a higher P content in winter wheat grain than in spring wheat, but also found a negative correlation between grain P content and grain volume. In our research, the dilution effect was observed in all elements of plant biomass (Table 10).
Regarding the effect of P fertilisation on the P content in plants, there are divergent opinions in literature: no influence is indicated [59], and an increase in the P content in organs along with the increase in the P dose [60]. The reaction may vary by species [51].
Most of the P uptaken by plants in our experiments was accumulated in wheat grain (Table 7). It is consistent with earlier reports that about 60–85% of aboveground P is stored in cereal grain [61]. P accumulated in straw is usually far lower, mainly due to a low P content [62]. In our research, P accumulation in grains showed greater dependence on grain yield volume than P content in grain, whereas in the case of straw it was primarily a function of P content (Table 11).
In all of our experiments, the lowest P accumulation in grain was recorded when no P was applied. It was associated with a lower yield (see correlation coefficient in Table 11) due to lower soil P abundance (Table 6). Regardless of the fertiliser type, increasing the P dose from 17.6 to 26.4 and 35.2 kg/ha did not significantly differentiate the P accumulation in grain, as other studies also pointed out [60]. The relationship between P accumulation in grain and P content in soil has also not been proven (Table 8).
Waste-fertilisers not worse than commercial fertilisers guaranteed the P uptake by wheat and P accumulation in its grain and straw (Table 7). Differences in the fertilisers’ effect on the P accumulation in wheat grain were shown only in experiment I. Plants fed with AsBm accumulated the same P amount in grains as plants treated with SP, and more than those under PR, A + H2O and BsBm. In turn, BsBm resulted in a higher P accumulation in grain than PR. In experiments II–V, waste-fertilisers and traditional fertilisers did not differ in their effect on the P accumulation in grain. In experiment II, +PP against −PP contributed to an increase in P accumulation in grain, which was both a function of a higher yield and a higher grain P content (Table 11). The interaction between plant protection and P-fertilisation treatments was not noted. No significant impact of fertiliser and plant protection treatments on P accumulation in straw was found in any experiment.
To date, there have been few studies on the effect of waste-fertilisers on the P content of arable crops. The issue of P uptake/accumulation is more often addressed.
It was proven recently in pot experiments by Lemming et al. [63] (with barley) and Raymond et al. [64] (with wheat) that SSA caused the lower P content in cereal shoots (measured 6 weeks after sowing) than TSP applied at the same P dose (50 or 60 mg/kg soil, respectively). These results of pot research differ from the findings of our field experiments. However, in another field experiment by Iżewska and Wołoszyk [65], the P content in maize grain and straw did not differ when 21.8 kg P/ha was applied in the form of SSA or SP. The authors also noted that the P content in grain and straw increased when SSA was applied at 65.4 kg P/ha, but no SP at the same P dose was applied to compare, so this result is inconclusive. Other field studies on recycling P products, such as ashes made of wood and cereal straw, also showed results similar to ours, with no effect on P content in wheat grain [66] or the same effect on P content in barley grain and straw as the SP applied at the same P dose performed [67].
Previous studies, mostly based on pot experiments, demonstrate mainly the lower P uptake/accumulation in plant biomass when fertilised with recycled fertilisers, as compared with SP or other fertilisers of easily available P compounds [21,30,68]. The low bioavailability of P from secondary raw materials has been suggested as the reason for this [23]. In field research by Wollmann and Moller [69], PR contributed to lower P uptake by maize than recycled P fertilisers, which is in line with our findings from experiment I.
It was suggested that secondary raw materials of lower quality should be further modified to increase P availability and provide more P to plants faster [20,21,70]. The PSM introduction into fertiliser formulation was claimed to be one of the aforementioned approaches [26]. In our studies, no PSM influence on P content in wheat was observed. Similarly, combining the SSA application with soil pre-inoculation with PSM against SSA, PSM did not change the P content in wheat shoots in research by Raymond et al. [64]. In a study by Ram et al. [71], wheat grain inoculation by PSM stimulated P content in leaves of young wheat plants (up to 60 days after sowing), as well as P content in grain and total P uptake. Without changing the P content, PSM activity can influence P accumulation only by stimulating biomass growth. Many authors reported poor efficiency of bioactivators used to increase recycled P bioavailability [21,64,69,72]. The findings from our experiments I–III seem promising. However, we cannot conclude that the high efficiency (at the SP level) of AsBm, BsBm, AgAf and ABgAf in P accumulation resulted from the activity of PSM included in fertilisers, since we did not find any differences between ABg and ABgBm, and AHg and AHgBm impact in experiments IV and V, respectively. According to Ram et al. [71], PSM activity may be barely noticeable in P-rich soil.

3.2.2. Weeds

In arable fields, weeds compete for soil P resources with crop plants [73,74]. It follows from earlier reports that the richness of soil in P may be even more important to weeds than nitrogen (N) or potassium (K), and that the response to the availability of P depends on the species [75]. To date, however, weeds have not been the subject of research in terms of their use of P from recycled fertilisers.
The range of P content determined in the weed biomass in the current research (Table 7) was within the biological plant variability limits [50]. Many times, the P content in weed biomass exceeded the P content in grain. Available literature confirms that weeds very often have a higher capacity for P accumulation than arable crops. According to Zawiślak and Kostrzewska [76], P content in the weed biomass in the rye field was as much as twice as high as in the rye biomass.
In our research, the variability of weed biomass P content in individual experiments may be related to the species composition of weed communities [73], but negative correlations between P content in weeds and P content in soil (Table 8) and between P content in weeds and P content in wheat grain and post-harvest residues (Table 9) were found. These relationships indicate stronger weed competition for P with lower soil P abundance. In experiment II, wheat under +PP (poor weed competition) showed a higher grain P content than wheat under −PP (strong weed competition). According to Konesky et al. [54], Avena fatua L. was capable of reducing the P content of barley (Hordeum vulgare L.), and soil P content affected the level of competition between these species. However, studies by Blackshaw and Brandt [75] demonstrated that both the weed P content and wheat shoot P content markedly increased with added P.
None of our studies have demonstrated any significant effect of the applied P-fertiliser treatments on the P content in the weed biomass (Table 7). No plant protection effect nor interaction between plant protection and fertilisation in this matter was found (experiment II).
The P content in the post-herbicide multi-species weed biomass usually results from a combination of factors, including species diversity and species-specific P content (together with the variability related to the development stages), competitive ability and vulnerability to herbicide (i.e., to a particular active substance). In our study (experiment II), regardless of weed biomass reduction, changes in the species and biochemical structure of the community caused by herbicide (+PP) produced such a resultant weed biomass P content that did not differ from the one under −PP. Similar effects were also reported by other authors [76,77,78].
The P accumulation in weed biomass was of quantitative importance in the wheat under −PP (Table 7). In experiment II, in wheat field under −PP, the P accumulation in the weed biomass exceeded even P accumulation in straw and, at the same time, would be enough to produce about 1 t of wheat grain. The P accumulation in weed biomass showed a strong positive correlation with the biomass volume, and a weaker but negative correlation with the P content (Table 11). In the wheat fields under −PP, weed species of lower P content, such as Raphanus raphanistrum L. [79] found in experiment II, had a greater share in the total weed biomass.
In experiment I, weeds accumulated less P in their biomass when A + H2O or AsBm were applied than under PR treatment (Table 7). PR seemed to favour weed biomass development (probably with an increased Ca content [80]), which also resulted in a higher P accumulation in the biomass. In experiment II, SP applied at a P dose of 35.2 kg/ha caused an increase in P accumulation in weed biomass as compared to SP at 26.4 kg P/ha, and +PP treatment limited P accumulation in weed biomass against −PP. These effects were a consequence of the lower weed biomass. There was no interaction between plant protection and P-fertilisation. In experiments III–V (+PP) there was no P-fertiliser impact on P accumulation in weeds.
The weed rhizosphere is a natural habitat for many microorganisms, including PSM [81]. Various weed species have demonstrated different potentials for P solubilisation in the rhizosphere [82]. Weed–microbe interactions usually promote weed competitiveness against crop plants [81]. The introduction of exogenous microbes as biofertilisers or fertiliser bioeffectors may change the weed-crop relationship, including their performance in nutrient uptake. In our studies, no change in P content and P accumulation in weed biomass as a result of PSM addition to waste-fertilisers, either under −PP (AsBm vs. A + H2O in experiment I) or under +PP (ABgBm vs. ABg in experiment IV, AHgBm vs. AHg in experiment V), was observed. Assuming that P uptake by weeds is strongly correlated with their biomass, the observations above can be likened to the findings of Hussein and Radwan [83], who did not observe changes in the weed biomass in wheat fields following a PSM inclusion to traditional P-fertilisation. However, in the field study by Mohammadi et al. [10], when maize seeds were inoculated with PSM, weeds growing in the field built larger biomass than in the no PSM treatment case.
Since weed contribution to the organic matter balance and the nutrient cycles in the agroecosystem is currently of great interest [74], further research is recommended.

3.2.3. Post-Harvest Residues

Plant parts remaining in the field after harvesting are incorporated into the soil. P stored in this biomass is then slowly released and gradually used by succeeding plants, avoiding leaching into groundwater and water ecosystems [84].
The P level in post-harvest residues in our individual experiments (Table 7) was determined by the ratio between the residues of the roots, stubble and weeds. For the latter, the species composition, weed relative height in the wheat canopy and the P content of those weed parts (roots, stems or leaves) that prevailed in the biomass left on the field, are of importance [73]. The values obtained were within the limits considered natural [50]. The P content in post-harvest residues correlated positively with the P content in soil (Table 8), as did the P content in grain and straw (Table 8).
None of our experiments demonstrated a significant effect of P-fertiliser treatments on the P content in post-harvest residues (Table 7). In experiment II, post-harvest residues showed a higher P content under +PP than under −PP. Herbicide limited the weed growth, along with a great part of their above-ground biomass (green, richer in P [73]), which was located in the zone below the mowing level, left in the field and enriched the post-harvest residues. At the same time, in the field under −PP, most of the above-ground weed biomass was removed during harvesting, while the weed parts poorer in P (i.e., the stems and roots) remained in the field. This may explain the negative correlation between the P content in weed biomass and in post-harvest residues (Table 9). Interaction between plant protection and P-fertilisation (experiment II) was not found (Table 7).
A substantial P amount was accumulated in the post-harvest residues (Table 7). In experiments I–III, this quantity equalled or exceeded the P accumulation in wheat straw. Waste-fertilisers usually resulted in the same P accumulation as traditional fertilisers. Only in experiment I did BsBm cause higher P accumulation in residues than SP, A + H2O and AsBm, but it was equal to PR. BsBm application induced a greater wheat root biomass [85], which could be attributed to PSM activity [86], however, no parallel effect was observed due to AsBm. In experiments II–V, P-fertilisation treatments did not differentiate the P accumulation in post-harvest residues.
In experiment II, +PP treatment contributed to a higher P accumulation in post-harvest residues, probably as a result of a higher low height weed proportion in the total residue biomass. This thesis is further enhanced by the fact that the P accumulation in residues depended more strongly on the P content than on the biomass volume (Table 11). +PP against −PP treatment did not change the P-fertilisers’ effect on P accumulation in post-harvest residues.
We have not been successful in finding other studies on the effects of recycled fertilisers or PSM on the P content and P accumulation in post-harvest residues. Partial reference can be made to the studies on the P amount in those plant organs whose remains are components of the post-harvest residues found in wheat straw (see Section 3.2.1), weeds (see Section 3.2.2) and roots. Lower maize root biomass fertilised with SSA in comparison to SP applied at the same dose, and root growth stimulation by seed-inoculated PSM, were reported by Raymond et al. [64]. The biomass volume may be an indirect indicator of the P accumulation in the roots. As the post-harvest residues are the natural way of P and the recycling of other nutrients, more research seems to be needed, especially based on field experiments.

4. Conclusions

Recycled fertilisers were no worse than traditional fertilisers in maintaining soil P resources. They guaranteed the same P content and P accumulation in the main and by-product yield of the test plant as commercial fertilisers. Similar to traditional fertilisers, they did not affect the P content in weed biomass and did not promote a higher P accumulation by weeds and so did not favour them during competitive crop-weed interactions. Just like traditional fertilisers, recycled fertilisers did not affect the P content in the post-harvest residues and resulted in the same or higher P accumulation in their biomass. The PSM included in waste-fertilisers did not exert evident effects on the soil P content or on the P content and P accumulation in wheat grain and straw, weeds accompanying wheat or post-harvest residues. The research suggests that the P of recycled fertilisers, including PSM-activated fertilisers, have the potential to replace or supplement the P of traditional fertilisers. However, more long-term field experiments should be conducted to determine the full functional properties spectrum of fertilisers made from renewable raw materials.

Author Contributions

Conceptualization, M.J., M.K.K. and A.S.; methodology, M.J., M.K.K. and A.S.; validation, M.J. and M.K.K.; formal analysis, M.J.; investigation, M.J., M.K.K. and A.S.; resources, M.J., M.K.K. and A.S.; writing—original draft preparation, M.J.; writing—review and editing, M.K.K.; visualization, M.J.; funding acquisition, A.S., M.J. and M.K.K.

Funding

This research was funded by National Center for Research and Development, Poland, grant number PBS 2/A1/11/2013.

Acknowledgments

The Institute of New Chemical Synthesis in Puławy is highly acknowledged for providing fertilisers’ batches for field experiments. The authors kindly acknowledge the technical support of Kinga Treder, Przemysław Makowski and Wiesław P. Jastrzębski from the University of Warmia and Mazury in Olsztyn, and of Sylwia Baśladyńska from the Wrocław University of Science and Technology.

Conflicts of Interest

The authors declare no conflict of interest.

References

  1. Nakajima, K.; Daigo, I.; Nansai, K.; Matsubae, K.; Takayanagi, W.; Tomita, M.; Matsuno, Y. Global distribution of material consumption: Nickel, copper, and iron. Resour. Conserv. Recycl. 2018, 133, 369–374. [Google Scholar] [CrossRef]
  2. Bringezu, S.; Potočnik, J.; Schandl, H.; Lu, Y.; Ramaswami, A.; Swilling, M.; Suh, S. Multi-scale governance of sustainable natural resource use-Challenges and opportunities for monitoring and institutional development at the national and global level. Sustainability 2016, 8, 778. [Google Scholar] [CrossRef]
  3. Wu, R.; Geng, Y.; Liu, W. Trends of natural resource footprints in the BRIC (Brazil, Russia, India and China) countries. J. Clean. Prod. 2017, 142, 775–782. [Google Scholar] [CrossRef]
  4. Nielsen, P.H.; Tukker, A.; Weidema, B.; Lauridsen, E.H.; Notten, P. Environmental Impact of the Use of Natural Resources (EIRES). 2005. Available online: http://ftp.jrc.es/pub/EURdoc/eur21485en.pdf (accessed on 27 March 2019).
  5. UNGA. Transforming our World: The 2030 Agenda for Sustainable Development. Resolution Adopted by the United Nations General Assembly on 25 September 2015; UNGA: New York, NY, USA, 2015. [Google Scholar]
  6. Schroeder, P.; Anggraeni, K.; Weber, U. The Relevance of Circular Economy Practices to the Sustainable Development Goals. J. Ind. Ecol. 2019, 23, 77–95. [Google Scholar] [CrossRef]
  7. Nikolova, A.; Mesiano, R. Circular Economy -Making Sustainability Part of the Solution in Asia-Pacific; The United Nations Economic and Social Commission for Asia and the Pacific (ESCAP): Bangkok, Thailand, 2018; Available online: http://www.unescap.org/blog/circular-economy-making-sustainability-part-the-solution-asia-pacific (accessed on 27 March 2019).
  8. Jedelhauser, M.; Binder, C.R. The spatial impact of socio-technical transitions—The case of phosphorus recycling as a pilot of the circular economy. J. Clean. Prod. 2018, 197, 856–869. [Google Scholar] [CrossRef]
  9. Herrera-Estrella, L.; López-Arredondo, D. Phosphorus: The Underrated Element for Feeding the World. Trends Plant Sci. 2016, 21, 461–463. [Google Scholar] [CrossRef]
  10. Mohammadi, G.R.; Ghobadi, M.E.; Sheikheh-Poor, S. Phosphate biofertilizer, row spacing and plant density effects on corn (Zea mays L.) yield and weed growth. Am. J. Plant Sci. 2012, 3, 425. [Google Scholar] [CrossRef]
  11. Weigand, H.; Bertau, M.; Hübner, W.; Bohndick, F.; Bruckert, A. RecoPhos: Full-scale fertilizer production from sewage sludge ash. Waste Manag. 2013, 33, 540–544. [Google Scholar] [CrossRef]
  12. Van Kauwenbergh, S.J. World Phosphate Rock Reserves and Resources; IFDC Muscle Shoals: Muscle Shoals, AL, USA, 2010. [Google Scholar]
  13. USGS. Mineral Commodity Summaries 2019. Phosphate Rock; U.S. Geological Survey: Reston, VA, USA, 2019; pp. 122–123.
  14. Li, B.; Boiarkina, I.; Young, B.; Yu, W.; Singhal, N. Prediction of Future Phosphate Rock: A Demand Based Model. J. Environ. Inform. 2018, 31. [Google Scholar] [CrossRef]
  15. European Commission. Report on Critical Raw Materials for the EU; Report of the Ad-Hoc Working Group on Defining Critical Raw Materials; EC: Brussels, Belgium, 2014; p. 41. [Google Scholar]
  16. European Commission. Study on the Review of the List of Critical Raw Materials; Publications Office of the European Union: Luxembourg, 2017; p. 93. [Google Scholar]
  17. Gorazda, K.; Tarko, B.; Wzorek, Z.; Kominko, H.; Nowak, A.K.; Kulczycka, J.; Henclik, A.; Smol, M. Fertilisers production from ashes after sewage sludge combustion—A strategy towards sustainable development. Environ. Res. 2017, 154, 171–180. [Google Scholar] [CrossRef] [PubMed]
  18. Günther, S.; Grunert, M.; Müller, S. Overview of recent advances in phosphorus recovery for fertilizer production. Eng. Life Sci. 2018, 18, 434–439. [Google Scholar] [CrossRef]
  19. Saeid, A.; Wyciszkiewicz, M.; Jastrzębska, M.; Chojnacka, K.; Górecki, H. A concept of production of new generation of phosphorus-containing biofertilizers. BioFertP project. Przem. Chem. 2015, 94, 361–365. [Google Scholar] [CrossRef]
  20. Herzel, H.; Krüger, O.; Hermann, L.; Adam, C. Sewage sludge ash—A promising secondary phosphorus source for fertilizer production. Sci. Total Environ. 2016, 542, 1136–1143. [Google Scholar] [CrossRef]
  21. Lekfeldt, J.D.S.; Rex, M.; Mercl, F.; Kulhánek, M.; Tlustoš, P.; Magid, J.; de Neergaard, A. Effect of bioeffectors and recycled p-fertiliser products on the growth of spring wheat. Chem. Biol. Technol. Agric. 2016, 3. [Google Scholar] [CrossRef]
  22. Smol, M.; Kulczycka, J.; Kowalski, Z. Sewage sludge ash (SSA) from large and small incineration plants as a potential source of phosphorus—Polish case study. J. Environ. Manag. 2016, 184, 617–628. [Google Scholar] [CrossRef] [PubMed]
  23. Severin, M.; Breuer, J.; Rex, M.; Stemann, J.; Adam, C.; Van den Weghe, H.; Kücke, M. Phosphate fertilizer value of heat treated sewage sludge ash. Plant Soil Environ. 2014, 60, 555–561. [Google Scholar] [CrossRef]
  24. Egle, L.; Rechberger, H.; Krampe, J.; Zessner, M. Phosphorus recovery from municipal wastewater: An integrated comparative technological, environmental and economic assessment of P recovery technologies. Sci. Total Environ. 2016, 571, 522–542. [Google Scholar] [CrossRef] [Green Version]
  25. Wisniak, J. Phosphorus—From discovery to commodity. Indian J. Chem. Technol. 2005, 12, 108–122. [Google Scholar]
  26. Wyciszkiewicz, M.; Saeid, A.; Dobrowolska-Iwanek, J.; Chojnacka, K. Utilization of microorganisms in the solubilization of low-quality phosphorus raw material. Ecol. Eng. 2016, 89, 109–113. [Google Scholar] [CrossRef]
  27. Wyciszkiewicz, M.; Saeid, A.; Samoraj, M.; Chojnacka, K. Solid-state solubilization of bones by B. megaterium in spent mushroom substrate as a medium for a phosphate enriched substrate. J. Chem. Technol. Biotechnol. 2017, 92, 1397–1405. [Google Scholar] [CrossRef]
  28. Jayathilakan, K.; Sultana, K.; Radhakrishna, K.; Bawa, A.S. Utilization of byproducts and waste materials from meat, poultry and fish processing industries: A review. J. Food Sci. Technol. 2012, 49, 278–293. [Google Scholar] [CrossRef]
  29. Kowalski, Z.; Makara, A.; Banach, M. Krew zwierzęca, metody jej przetwarzania i zastosowanie. Tech. Trans. Chem. 2011, 108, 87–105. [Google Scholar]
  30. Römer, W.; Steingrobe, B. Fertilizer effect of phosphorus recycling products. Sustainability 2018, 10, 1166. [Google Scholar] [CrossRef]
  31. Mogollón, J.M.; Beusen, A.H.W.; van Grinsven, H.J.M.; Westhoek, H.; Bouwman, A.F. Future agricultural phosphorus demand according to the shared socioeconomic pathways. Glob. Environ. Chang. 2018, 50, 149–163. [Google Scholar] [CrossRef]
  32. Karpagam, T.; Nagalakshmi, P.K. Isolation and characterization of phosphate solubilizing microbes from agricultural soil. Int. J. Curr. Microbiol. Appl. Sci. 2014, 3, 601–614. [Google Scholar]
  33. Rolewicz, M.; Rusek, P.; Mikos-Szymańska, M.; Cichy, B.; Dawidowicz, M. Obtaining of Suspension Fertilizers from Incinerated Sewage Sludge Ashes (ISSA) by a Method of Solubilization of Phosphorus Compounds by Bacillus megaterium Bacteria. Waste Biomass Valoriz. 2016, 7, 871–877. [Google Scholar] [CrossRef]
  34. Rolewicz, M.; Rusek, P.; Borowik, K. Obtaining of granular fertilizers based on ashes from combustion of waste residues and ground bones using phosphorous solubilization by bacteria Bacillus megaterium. J. Environ. Manag. 2018, 216, 128–132. [Google Scholar] [CrossRef]
  35. Zalba, P.; Bravo, O.; Garay, M.; Peinemann, N. Moisture and temperature effect on soil phosphorus availability. Agrochimica 2007, 51, 55–63. [Google Scholar]
  36. Roberts, J.; Israel, D.W. Influence of Soil Properties and Manure Sources on Phosphorus in Runoff during Simulated Rainfall. Commun. Soil Sci. Plant Anal. 2017, 48, 222–235. [Google Scholar] [CrossRef]
  37. IUNG. Monitoring Chemizmu Gleb ornych Polski; Institute of Soil Science and Plant Cultivation (IUNG): Puławy, Poland, 2017. [Google Scholar]
  38. Montange, D.; Zapata, F. Standard Characterization of Soils Employed in the FAO/IAEA Phosphate Project; International Atomic Energy Agency: Vienna, Austria, 2002. [Google Scholar]
  39. Sapek, B. Soil phosphorus accumulation and release-sources, processes, causes. Water-Environ.-Rural Areas 2014, 14, 45. [Google Scholar]
  40. Zhu, J.; Li, M.; Whelan, M. Phosphorus activators contribute to legacy phosphorus availability in agricultural soils: A review. Sci. Total Environ. 2018, 612, 522–537. [Google Scholar] [CrossRef]
  41. Barberis, E.; Ajmone Marsan, F.; Scalenghe, R.; Lammers, A.; Schwertmann, U.; Edwards, A.C.; Maguire, R.; Wilson, M.J.; Delgado, A.; Torrent, J. European soils overfertilized with phosphorus: Part 1. Basic properties. Fertil. Res. 1995, 45, 199–207. [Google Scholar] [CrossRef]
  42. Zicker, T.; von Tucher, S.; Kavka, M.; Eichler-Löbermann, B. Soil test phosphorus as affected by phosphorus budgets in two long-term field experiments in Germany. Field Crop. Res. 2018, 218, 158–170. [Google Scholar] [CrossRef]
  43. Sharpley, A. Managing agricultural phosphorus to minimize water quality impacts. Sci. Agric. 2016, 73, 1–8. [Google Scholar] [CrossRef] [Green Version]
  44. Withers, P.J.A.; Edwards, A.C.; Foy, R.H. Phosphorus cycling in UK agriculture and implications for phosphorus loss from soil. Soil Use Manag. 2001, 17, 139–149. [Google Scholar] [CrossRef]
  45. Sattari, S.Z.; Bouwman, A.F.; Giller, K.E.; Van Ittersum, M.K. Residual soil phosphorus as the missing piece in the global phosphorus crisis puzzle. Proc. Natl. Acad. Sci. USA 2012, 109, 6348–6353. [Google Scholar] [CrossRef] [Green Version]
  46. Khan, M.S.; Zaidi, A.; Wani, P.A. Role of phosphate-solubilizing microorganisms in sustainable agriculture—A review. Agron. Sustain. Dev. 2007, 27, 29–43. [Google Scholar] [CrossRef]
  47. Blake, L.; Mercik, S.; Koerschens, M.; Moskal, S.; Poulton, P.R.; Goulding, K.W.T.; Weigel, A.; Powlson, D.S. Phosphorus content in soil, uptake by plants and balance in three European long-term field experiments. Nutr. Cycl. Agroecosyst. 2000, 56, 263–275. [Google Scholar] [CrossRef]
  48. Jastrzębska, M.; Kostrzewska, M.K.; Saeid, A.; Treder, K.; Makowski, P.; Jastrzębski, W.P.; Okorski, A. Granulated phosphorus fertilizer made of ash from biomass combustion and bones with addition of Bacillus megaterium in the field assessment. Part 1. Impact on yielding and sanitary condition of winter wheat. Przem. Chem. 2017, 96, 2168–2174. [Google Scholar] [CrossRef]
  49. Broadley, M.R.; Bowen, H.C.; Cotterill, H.L.; Hammond, J.P.; Meacham, M.C.; Mead, A.; White, P.J. Phylogenetic variation in the shoot mineral concentration of angiosperms. J. Exp. Bot. 2004, 55, 321–336. [Google Scholar] [CrossRef] [Green Version]
  50. Markert, B. Presence and significance of naturally occurring chemical elements of the periodic system in the plant organism and consequences for future investigations on inorganic environmental chemistry in ecosystems. Vegetatio 1992, 103, 1–30. [Google Scholar] [CrossRef]
  51. Tang, X.; Li, J.; Ma, Y.; Hao, X.; Li, X. Phosphorus efficiency in long-term (15 years) wheat-maize cropping systems with various soil and climate conditions. Field Crop Res. 2008, 108, 231–237. [Google Scholar] [CrossRef]
  52. Sarfraz, M.; Mehdi, S.M.; Abid, M.; Akram, M. External and internal phosphorus requirement of wheat in Bhalike soil series of Pakistan. Pak. J. Bot. 2008, 40, 2031–2040. [Google Scholar]
  53. Wang, K.; Cui, K.; Liu, G.; Luo, X.; Huang, J.; Nie, L.; Wei, D.; Peng, S. Low straw phosphorus concentration is beneficial for high phosphorus use efficiency for grain production in rice recombinant inbred lines. Field Crop Res. 2017, 203, 65–73. [Google Scholar] [CrossRef]
  54. Konesky, D.W.; Siddiqi, M.Y.; Glass, A.D.M.; Hsiao, A.I. Wild oat and barley interactions: Varietal differences in competitiveness in relation to phosphorus supply. Can. J. Bot. 1989, 67, 3366–3371. [Google Scholar] [CrossRef]
  55. Kratochvil, R.J.; Coale, F.J.; Momen, B.; Harrison, M.R., Jr.; Pearce, J.T.; Schlosnagle, S. Cropping systems for phytoremediation of phosphorus-enriched soils. Int. J. Phytoremed. 2006, 8, 117–130. [Google Scholar] [CrossRef] [PubMed]
  56. Shi, G.L.; Zhu, S.; Bai, S.N.; Xia, Y.; Lou, L.Q.; Cai, Q.S. The transportation and accumulation of arsenic, cadmium, and phosphorus in 12 wheat cultivars and their relationships with each other. J. Hazard. Mater. 2015, 299, 94–102. [Google Scholar] [CrossRef] [PubMed]
  57. Bi, J.; Liu, Z.; Lin, Z.; Alim, M.A.; Rehmani, M.I.A.; Li, G.; Wang, Q.; Wang, S.; Ding, Y. Phosphorus accumulation in grains of japonica rice as affected by nitrogen fertilizer. Plant Soil 2013, 369, 231–240. [Google Scholar] [CrossRef]
  58. Hussain, A.; Larsson, H.; Kuktaite, R.; Johansson, E. Mineral composition of organically grown wheat genotypes: Contribution to daily minerals intake. Int. J. Environ. Res. Public Health 2010, 7, 3442–3456. [Google Scholar] [CrossRef]
  59. Orphanos, P.I.; Krentos, V.D. Concentration of N, P and K in leaves, straw and grain of wheat and barley as influenced by N and P fertilizers under semi-arid conditions. J. Agric. Sci. 1980, 94, 551–556. [Google Scholar] [CrossRef]
  60. Mehdi, S.M.; Abid, M.; Sarfraz, M.; Hafeez, M.; Hafeez, F. Wheat response to applied phosphorus in light textured soil. J. Biol. Sci. 2007, 7, 1535–1538. [Google Scholar] [CrossRef]
  61. Wang, F.; Rose, T.; Jeong, K.; Kretzschmar, T.; Wissuwa, M. The knowns and unknowns of phosphorus loading into grains, and implications for phosphorus efficiency in cropping systems. J. Exp. Bot. 2016, 67, 1221–1229. [Google Scholar] [CrossRef]
  62. Ahmad, L.; Dar, N.A.; Kaleem, M. Yield and nutrient uptake of wheat (Triticumaestivum L) as influenced by different levels of nitrogen and foliar spray of nutrient mixture. ISABB J. Food Agric. Sci. 2015, 5, 27–33. [Google Scholar] [CrossRef]
  63. Lemming, C.; Bruun, S.; Jensen, L.S.; Magid, J. Plant availability of phosphorus from dewatered sewage sludge, untreated incineration ashes, and other products recovered from a wastewater treatment system. J. Plant Nutr. Soil Sci. 2017, 180, 779–787. [Google Scholar] [CrossRef]
  64. Raymond, N.S.; Jensen, L.S.; van der Bom, F.; Nicolaisen, M.H.; Müller-Stöver, D. Fertilising effect of sewage sludge ash inoculated with the phosphate-solubilising fungus Penicillium bilaiae under semi-field conditions. Biol. Fertil. Soils 2019, 55, 43–51. [Google Scholar] [CrossRef]
  65. Iżewska, A.; Wołoszyk, C. Yields of grain and straw, their content and ionic proportions of macroelements in maize fertilized with ash from municipal sewage sludge combustion. J. Elem. 2015, 20, 319–329. [Google Scholar] [CrossRef]
  66. Stankowski, S.; Sobolewska, M.; Jaroszewska, A.; Gibczyńska, M. Influence of biomass ash, lime and gypsum fertilization on macro-and microelement contents in the soil and grains of spring wheat. Soil Sci. Ann. 2018, 69, 177–183. [Google Scholar] [CrossRef]
  67. Cruz-Paredes, C.; López-García, Á.; Rubæk, G.H.; Hovmand, M.F.; Sørensen, P.; Kjøller, R. Risk assessment of replacing conventional P fertilizers with biomass ash: Residual effects on plant yield, nutrition, cadmium accumulation and mycorrhizal status. Sci. Total Environ. 2017, 575, 1168–1176. [Google Scholar] [CrossRef] [PubMed]
  68. Müller-Stöver, D.S.; Jakobsen, I.; Grønlund, M.; Rolsted, M.M.M.; Magid, J.; Hauggaard-Nielsen, H. Phosphorus bioavailability in ash from straw and sewage sludge processed by low-temperature biomass gasification. Soil Use Manag. 2018, 34, 9–17. [Google Scholar] [CrossRef]
  69. Wollmann, I.; Möller, K. Phosphorus bioavailability of sewage sludge-based recycled fertilizers in an organically managed field experiment. J. Plant Nutr. Soil Sci. 2018, 181, 760–767. [Google Scholar] [CrossRef]
  70. Mackay, J.E.; Cavagnaro, T.R.; Jakobsen, I.; Macdonald, L.M.; Grønlund, M.; Thomsen, T.P.; Müller-Stöver, D.S. Evaluation of phosphorus in thermally converted sewage sludge: P pools and availability to wheat. Plant Soil 2017, 418, 307–317. [Google Scholar] [CrossRef]
  71. Ram, H.; Malik, S.S.; Dhaliwal, S.S.; Kumar, B.; Singh, Y. Growth and productivity of wheat affected by phosphorus-solubilizing fungi and phosphorus levels. Plant Soil Environ. 2015, 61, 122–126. [Google Scholar] [CrossRef]
  72. Wollmann, I.; Gauro, A.; Müller, T.; Möller, K. Phosphorus bioavailability of sewage sludge-based recycled fertilizers. J. Plant Nutr. Soil Sci. 2018, 181, 158–166. [Google Scholar] [CrossRef]
  73. Blackshaw, R.E.; Brandt, R.N.; Janzen, H.H.; Entz, T. Weed species response to phosphorus fertilization. Weed Sci. 2004, 52, 406–412. [Google Scholar] [CrossRef]
  74. Kaur, S.; Kaur, R.; Chauhan, B.S. Understanding crop-weed-fertilizer-water interactions and their implications for weed management in agricultural systems. Crop Prot. 2018, 103, 65–72. [Google Scholar] [CrossRef]
  75. Blackshaw, R.E.; Brandt, R.N. Phosphorus fertilizer effects on the competition between wheat and several weed species. Weed Biol. Manag. 2009, 9, 46–53. [Google Scholar] [CrossRef]
  76. Zawiślak, K.; Kostrzewska, M. The nutritional competition of weeds in winter rye crops grown in crop rotation and long-term monoculture. II. Macronutrient content and uptake in above-ground biomass of winter rye and weeds. Ann. UMCS Sect. E LV Suppl. 2000, 33, 269–275. [Google Scholar]
  77. Manish, B.; Devendra, S.; Jat, B.L. Production potential of [Glycine max (L.) Merrill] under different weed management practices. Asian J. Hortic. 2017, 12, 1–21. [Google Scholar] [CrossRef]
  78. Brar, A.S.; Walia, U.S. Influence of planting techniques and weed control treatments on nutrient uptake by P. minor Retz. and broadleaf weeds in wheat (Triticum aestivum L.). Indian J. Weed Sci. 2007, 39, 55–61. [Google Scholar]
  79. Souza, L.S.; Velini, E.D.; Maimoni-Rodella, R.; Martins, D. Teores de macro e micronutrientes e a relação C/N de várias espécies de plantas daninhas. Planta Daninha 1999, 17, 163–167. [Google Scholar] [CrossRef]
  80. Lundy, M.E.; Fischer, A.J.; Van Kessel, C.; Hill, J.E.; Ruark, M.D.; Linquist, B.A. Surface-applied calcium phosphate stimulates weed emergence in flooded rice. Weed Technol. 2010, 24, 295–302. [Google Scholar] [CrossRef]
  81. Massenssini, A.M.; Bonduki, V.H.A.; Melo, C.A.D.; Tótola, M.R.; Ferreira, F.A.; Costa, M.D. Soil microorganisms and their role in the interactions between weeds and crops. Planta Daninha 2014, 32, 873–884. [Google Scholar] [CrossRef] [Green Version]
  82. Dos Santos, E.A.; Ferreira, L.R.; Costa, M.D.; Da Silva, M.C.S.; Dos Reis, M.R.; França, A.C. Occurrence of symbiotic fungi and rhizospheric phosphate solubilization in weeds. Acta Sci.-Agron. 2013, 35, 49–55. [Google Scholar] [CrossRef]
  83. Hussein, H.F.; Radwan, S.M.A. Effect of biofertilization with different levels of nitrogen and phosphorus on wheat and associated weeds under weed control treatments. Pak. J. Biol. Sci. 2001, 4, 435–441. [Google Scholar] [CrossRef]
  84. Damon, P.M.; Bowden, B.; Rose, T.; Rengel, Z. Crop residue contributions to phosphorus pools in agricultural soils: A review. Soil Biol. Biochem. 2014, 74, 127–137. [Google Scholar] [CrossRef]
  85. Jastrzębska, M.; Kostrzewska, M.; Treder, K.; Jastrzębski, W.; Makowski, P. Phosphorus biofertilizers from ash and bones—Agronomic evaluation of functional properties. J. Agric. Sci. 2016, 8, 58–70. [Google Scholar] [CrossRef]
  86. Mahanta, D.; Rai, R.K.; Mishra, S.D.; Raja, A.; Purakayastha, T.J.; Varghese, E. Influence of phosphorus and biofertilizers on soybean and wheat root growth and properties. Field Crop Res. 2014, 166, 1–9. [Google Scholar] [CrossRef]
Table 1. Recycled fertilisers tested in the experiments.
Fertiliser SymbolRaw MaterialBacteriaFormPhosphorus (P) (% mass)
AsBmsewage sludge ash (SSA)Bacillus megateriumsuspension0.176
BsBmbonesBacillus megateriumsuspension0.259
AgAfSSAAcidithiobacillus ferrooxidansgranules9.24
ABgAfSSA + bonesAcidithiobacillus ferrooxidansgranules7.50
ABgSSA + bones-granules6.10
ABgBmSSA + bonesBacillus megateriumgranules5.87
AHgSSA + blood-granules8.68
AHgBmSSA + bloodBacillus megateriumgranules9.55
Table 2. Field experiments conducted.
ExperimentYearTest PlantRecycled FertilisersTo Comparison
I2014spring wheatAsBm, BsBmno phosphorus (P), superphosphate (SP), phosphorite Syria (PR), ash-water solution (A + H2O)
II2015spring wheatAsBmno P, SP, PR
III2015winter wheatAgAf, ABgAfno P, SP
IV2016winter wheatABg, ABgBmno P, SP
V2016spring wheatAHg, AHgBmno P, SP
Table 3. Soil characteristics before the start of the experiments.
ExperimentSoil TypeSoil TexturepH (in KCl)Total (g/kg)
CNKMg
ILuvisolssandy clay loam6.238.311.302.982.07
IILuvisolssandy loam5.328.901.352.902.01
IIILuvisolssandy loam5.518.871.363.212.25
IVLuvisolssandy loam5.237.151.093.302.20
VLuvisolssandy clay loam6.288.531.422.982.02
Table 4. Basic agricultural data for the experiments.
ItemExperiment
IIIIIIIVV
Wheat cultivarTrappeMonsunJuliusJuliusMonsun
Previous cropspring barleycereal-legume mixturewinter rapewinter rapewinter rape
Soil tillage systemplough tillageplough tillageplough tillageplough tillageplough tillage
Fertilisation
K2O 1, kg/ha120100100100100
N 2, kg/ha100110130120130
Plant protection−PP−PP or +PP+PP+PP+PP
− herbicides−/++++
− fungicides−/++++
− insecticides−/++++
− growth regulators++
Sowing date25.04.20149.04.20152.10.201415.10.201521.04.2016
Harvest date11.08.201411.08.20155.08.20159.08.201612.08.2016
1 potassium chloride, 2 ammonium sulphate, +applied, −not applied.
Table 5. Atmospheric precipitation and air temperature during the study period according to the Meteorological Station in Bałcyny.
YearMonth
IIIIIIIVVVIVIIVIIIIXXXIXII
Atmospheric precipitation (mm)
2014 26.134.972.220.459.230.821.321.256.6
201528.58.846.023.425.443.071.013.051.220.880.880.4
201628.750.520.533.170.866.3138.671.917.196.378.277.8
1981–201030.123.130.729.862.372.981.270.656.251.246.142.6
Air temperature (°C)
2014 9.513.314.821.017.914.59.54.4−0.6
20150.60.34.67.212.115.718.021.314.26.65.13.8
2016−3.82.73.68.814.918.018.517.614.76.92.51.0
1981–2010−2.4−1.61.87.713.215.818.317.713.08.12.8−1.0
Table 6. Total P content in soil from wheat field.
ExperimentP-FertiliserP Dose (kg/ha)Plant ProtectionP Content (g/kg)
StartEnd
INo P0−PP0.5660.511 a1
SP21 0.5790.579 a
PR21 0.5490.570 a
A + H2O21 0.5690.562 a
AsBm21 0.5520.560 a
BsBm21 0.5530.566 a
IINo P0−PP0.5850.569 gh
SP17.6 0.5610.584 efgh
26.4 0.5500.624 bcd
35.2 0.5900.649 ab
PR17.6 0.5560.583 efgh
26.4 0.5730.632 bc
35.2 0.5710.672 a
AsBm17.6 0.5580.579 fgh
26.4 0.5530.634 bc
35.2 0.5710.677 a
average0.5670.620 A
No P0+PP0.5860.552 h
SP17.6 0.5630.573 gh
26.4 0.5820.609 cdef
35.2 0.5720.628 bc
PR17.6 0.5770.579 fgh
26.4 0.5530.591 defg
35.2 0.5900.604 cdefg
AsBm17.6 0.5630.576 fgh
26.4 0.5470.609 cdef
35.2 0.5540.615 cde
average0.5690.594 B
IIINo P0+PP0.4280.419 a
SP17.6 0.4410.481 a
26.4 0.4250.479 a
35.2 0.4320.497 a
AgAf17.6 0.4560.499 a
26.4 0.4170.478 a
35.2 0.4330.489 a
ABgAf17.6 0.4490.476 a
26.4 0.4290.479 a
35.2 0.4200.483 a
IVNo P0+PP0.5330.436 c
SP40 0.5570.479 abc
17.6 0.5930.497 abc
26.4 0.5520.501 abc
ABg35.2 0.5400.461 bc
17.6 0.5400.496 abc
26.4 0.5630.513 ab
ABgBm35.2 0.5420.488 abc
17.6 0.5290.511 abc
26.4 0.5050.541 a
VNo P0+PP0.6220.540 b
SP17.6 0.6040.591 ab
26.4 0.6130.603 a
35.2 0.6020.613 a
AHg17.6 0.6110.604 a
26.4 0.6050.613 a
35.2 0.6110.626 a
AHgBm17.6 0.5990.597 a
26.4 0.6080.611 a
35.2 0.5920.621 a
1 different letters indicate significant differences at p < 0.05: small letters—for P fertiliser treatments in each experiment separately, capital letters—for plant protection treatments in experiment II; arrows indicate significant increase or decrease in relation to the starting state; +applied, −not applied.
Table 7. Phosphorus content and accumulation in plant biomass from the wheat field.
ExperimentP-FertiliserP Dose (kg/ha)Plant ProtectionContent (mg/kg)Accumulation (kg/ha)
Wheat GrainWheat StrawWeedsPost-Harvest ResiduesWheat GrainWheat StrawWeedsPost-Harvest Residues
INo P0−PP3602437315258615.1 d2.581.82 ab1.83 c
SP21 3585459321062819.4 a2.821.48 ab2.10 c
PR21 3557446310066617.0 c2.652.32 a2.96 ab
A+H2O21 3622432319860518.1 b2.720.84 b2.32 bc
AsBm21 3733479321456519.6 a2.980.72 b2.22 bc
BsBm21 3690499319061618.0 b3.021.81 ab3.37 a
IINo P0−PP3411359282660814.6 d1.393.16 ab2.05
SP17.6 3325311296357915.6 d1.464.02 ab1.95
26.4 3289373279757316.5 d1.734.32 a1.82
35.2 3386360294060717.9 cd1.732.48 b2.19
PR17.6 3264339282258515.5 d1.453.41 ab1.94
26.4 3448392278157916.4 d1.823.50 ab1.89
35.2 3400354284661916.3 d1.702.84 ab1.98
AsBm17.6 3573343285857316.2 d1.552.99 ab1.94
26.4 3290351285360715.2 d1.632.88 ab2.12
35.2 3457332279058115.8 d1.553.46 ab1.74
average3384 A1351 B2848591 B16.0 B1.603.31 A1.96 B
No P0+PP3714309303072320.1 bc1.720.33 c2.11
SP17.6 3528337280774621.6 ab1.850.32 c2.20
26.4 3683306283165822.8 ab1.780.55 c1.94
35.2 3484291275771922.2 ab1.660.26 c2.14
PR17.6 3898306334068023.9 a1.630.67 c2.37
26.4 3507333286964421.8 ab1.830.25 c1.96
35.2 3740325308569623.4 ab1.570.38 c2.27
AsBm17.6 3757303289361122.5 ab1.700.36 c1.92
26.4 3474291273065022.2 ab1.710.64 c2.19
35.2 3523306362863521.2 abc1.810.49 c2.13
average3631 B311 A2997676 A22.2 A1.730.43 B2.12 A
IIINo P0+PP1956153349047113.8 b1.000.771.81
SP17.6 1916166349843215.2 ab1.060.791.60
26.4 1886161394250815.4 ab1.110.791.89
35.2 1846143404652815.9 a0.940.752.00
AgAf17.6 2074150320455116.4 a0.971.012.28
26.4 1934139320655816.2 a0.890.532.38
35.2 1964142354053516.2 a0.870.562.05
ABgAf17.6 2095136372747616.6 a0.860.641.64
26.4 2005149334254317.1 a1.010.862.32
35.2 2055155351155917.4 a0.970.792.35
IVNo P0+PP2907301515635624.0 b1.890.141.53
SP17.6 2847306519836426.3 ab2.230.171.76
26.4 2848310565943527.2 a2.330.091.99
35.2 2878307456836427.2 a2.100.161.80
ABg17.6 2787306445531725.9 ab2.270.091.36
26.4 2814324539340226.8 a2.400.091.92
35.2 2860313415032126.6 a2.080.161.43
ABgBm17.6 2806297495730426.6 a2.330.041.21
26.4 2822297649142927.6 a2.350.062.19
35.2 2811340590136526.9 a2.740.081.81
VNo P0+PP3775662510650822.7 b3.730.102.14
SP17.6 3820623397554324.4 a3.340.232.05
26.4 3851720436254225.1 a4.310.111.85
35.2 3837667400361625.7 a4.140.192.67
AHg17.6 3833567493455324.2 a3.130.272.19
26.4 3851695408561424.7 a3.970.302.51
35.2 3870634397159824.7 a3.620.192.20
AHgBm17.6 3839676361357024.5 a4.150.181.95
26.4 3867715328362525.1 a4.070.102.27
35.2 3838656427259925.3 a3.920.142.08
1 different letters indicate significant differences at p < 0.05: small letters—for P fertiliser treatments in each experiment separately, capital letters—for plant protection treatments in experiment II, no letters—no significant differences at p = 0.05; +applied, −not applied.
Table 8. Relationship between P content and P accumulation in plant biomass parts and total soil P content—simple correlation coefficients.
InP ContentP Accumulation
Wheat grain0.704 1ns
Wheat straw0.4900.313
Weed−0.3220.352
Post-harvest residues0.4690.182
1 values significant at p = 0.05; ns—no significance at p < 0.05.
Table 9. Relationship between P content of individual plant biomass parts and between P accumulation in these parts—simple correlation coefficients.
InWheat GrainWheat StrawWeeds
Content
Wheat straw0.747 1--
Weed−0.133ns-
Post-harvest residues0.4230.191−0.395
Accumulation
Wheat straw0.543--
Weeds−0.632−0.266-
Post-harvest residuesns0.134ns
1 values significant at p = 0.05; ns—no significance at p < 0.05.
Table 10. Relationship between P content and biomass volume of plant biomass parts—simple correlation coefficients.
Wheat GrainWheat StrawWeedsPost-Harvest Residues
−0.631 1−0.152−0.429−0.402
1 values significant at p = 0.05.
Table 11. Dependence of P accumulation on P content and biomass volumes of plant biomass parts—simple correlation coefficients.
InP ContentBiomass Volume
Wheat grain0.350 10.502
Wheat straw0.9310.206
Weed biomass−0.3960.969
Post-harvest residues0.5990.467
1 values significant at p = 0.05.

