Effect of Incorporating Waste Limestone Powder into Solid Waste Cemented Paste Backfill Material


Abstract
:Featured Application
Abstract
1. Introduction
2. Materials and Methods
2.1. Raw Materials
2.1.1. Composition Analysis
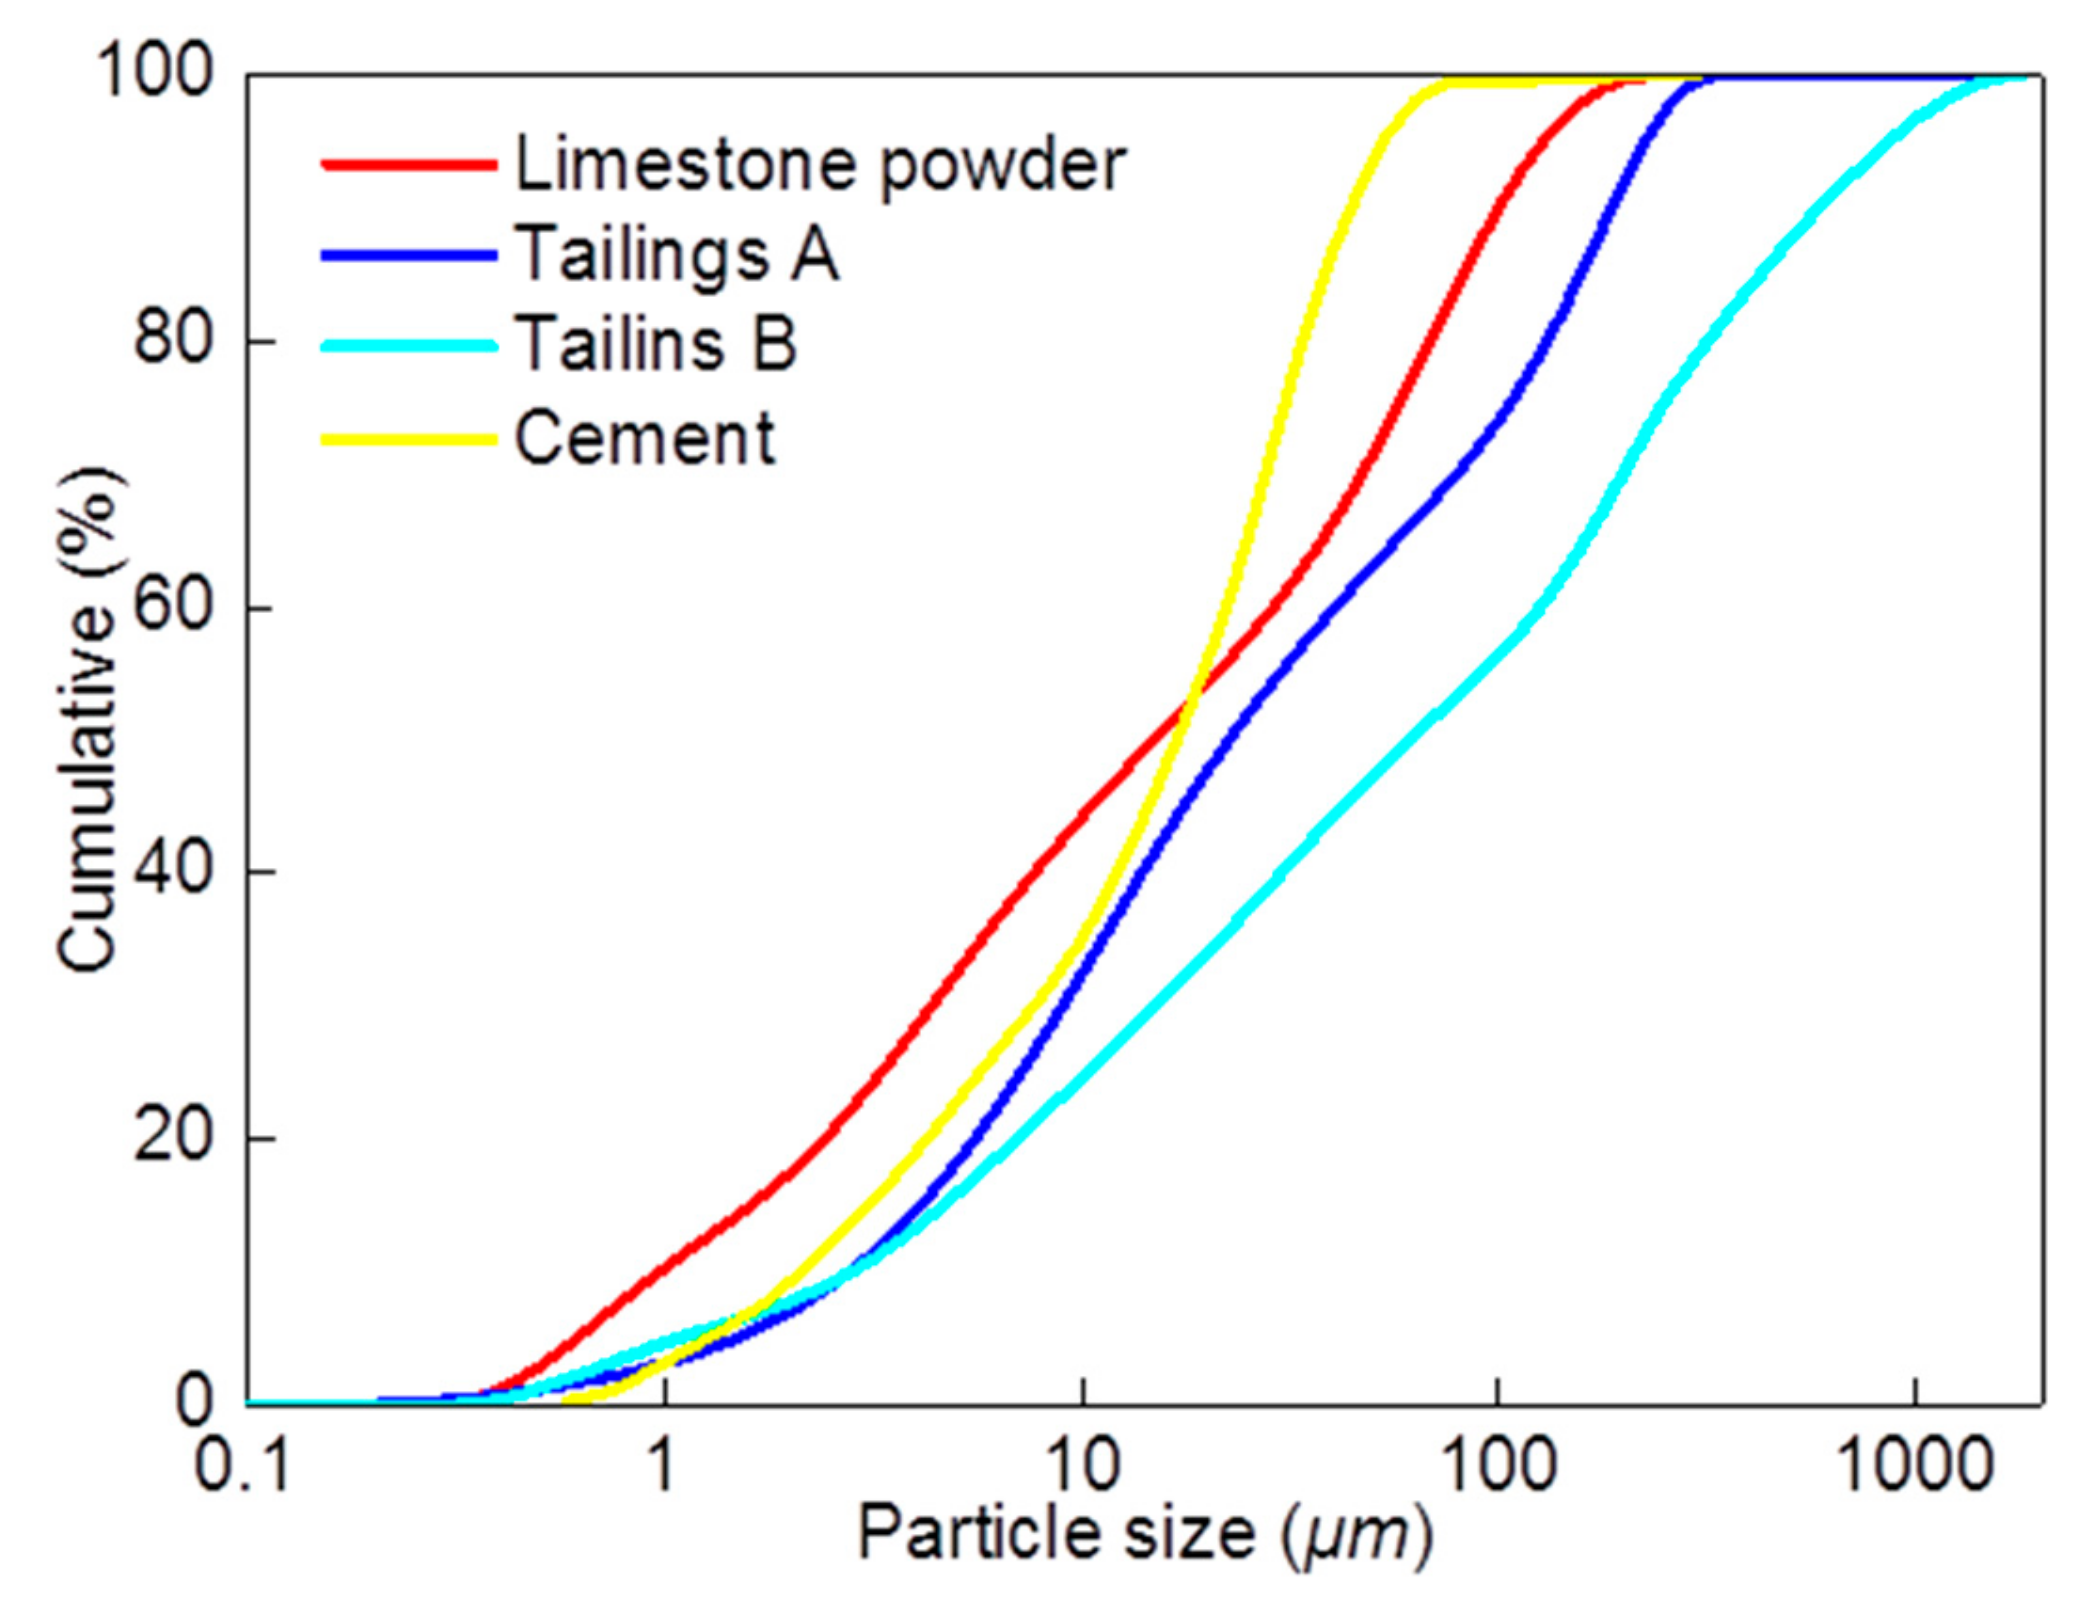
2.1.2. Particle Size Analysis
2.2. Sample Preparation
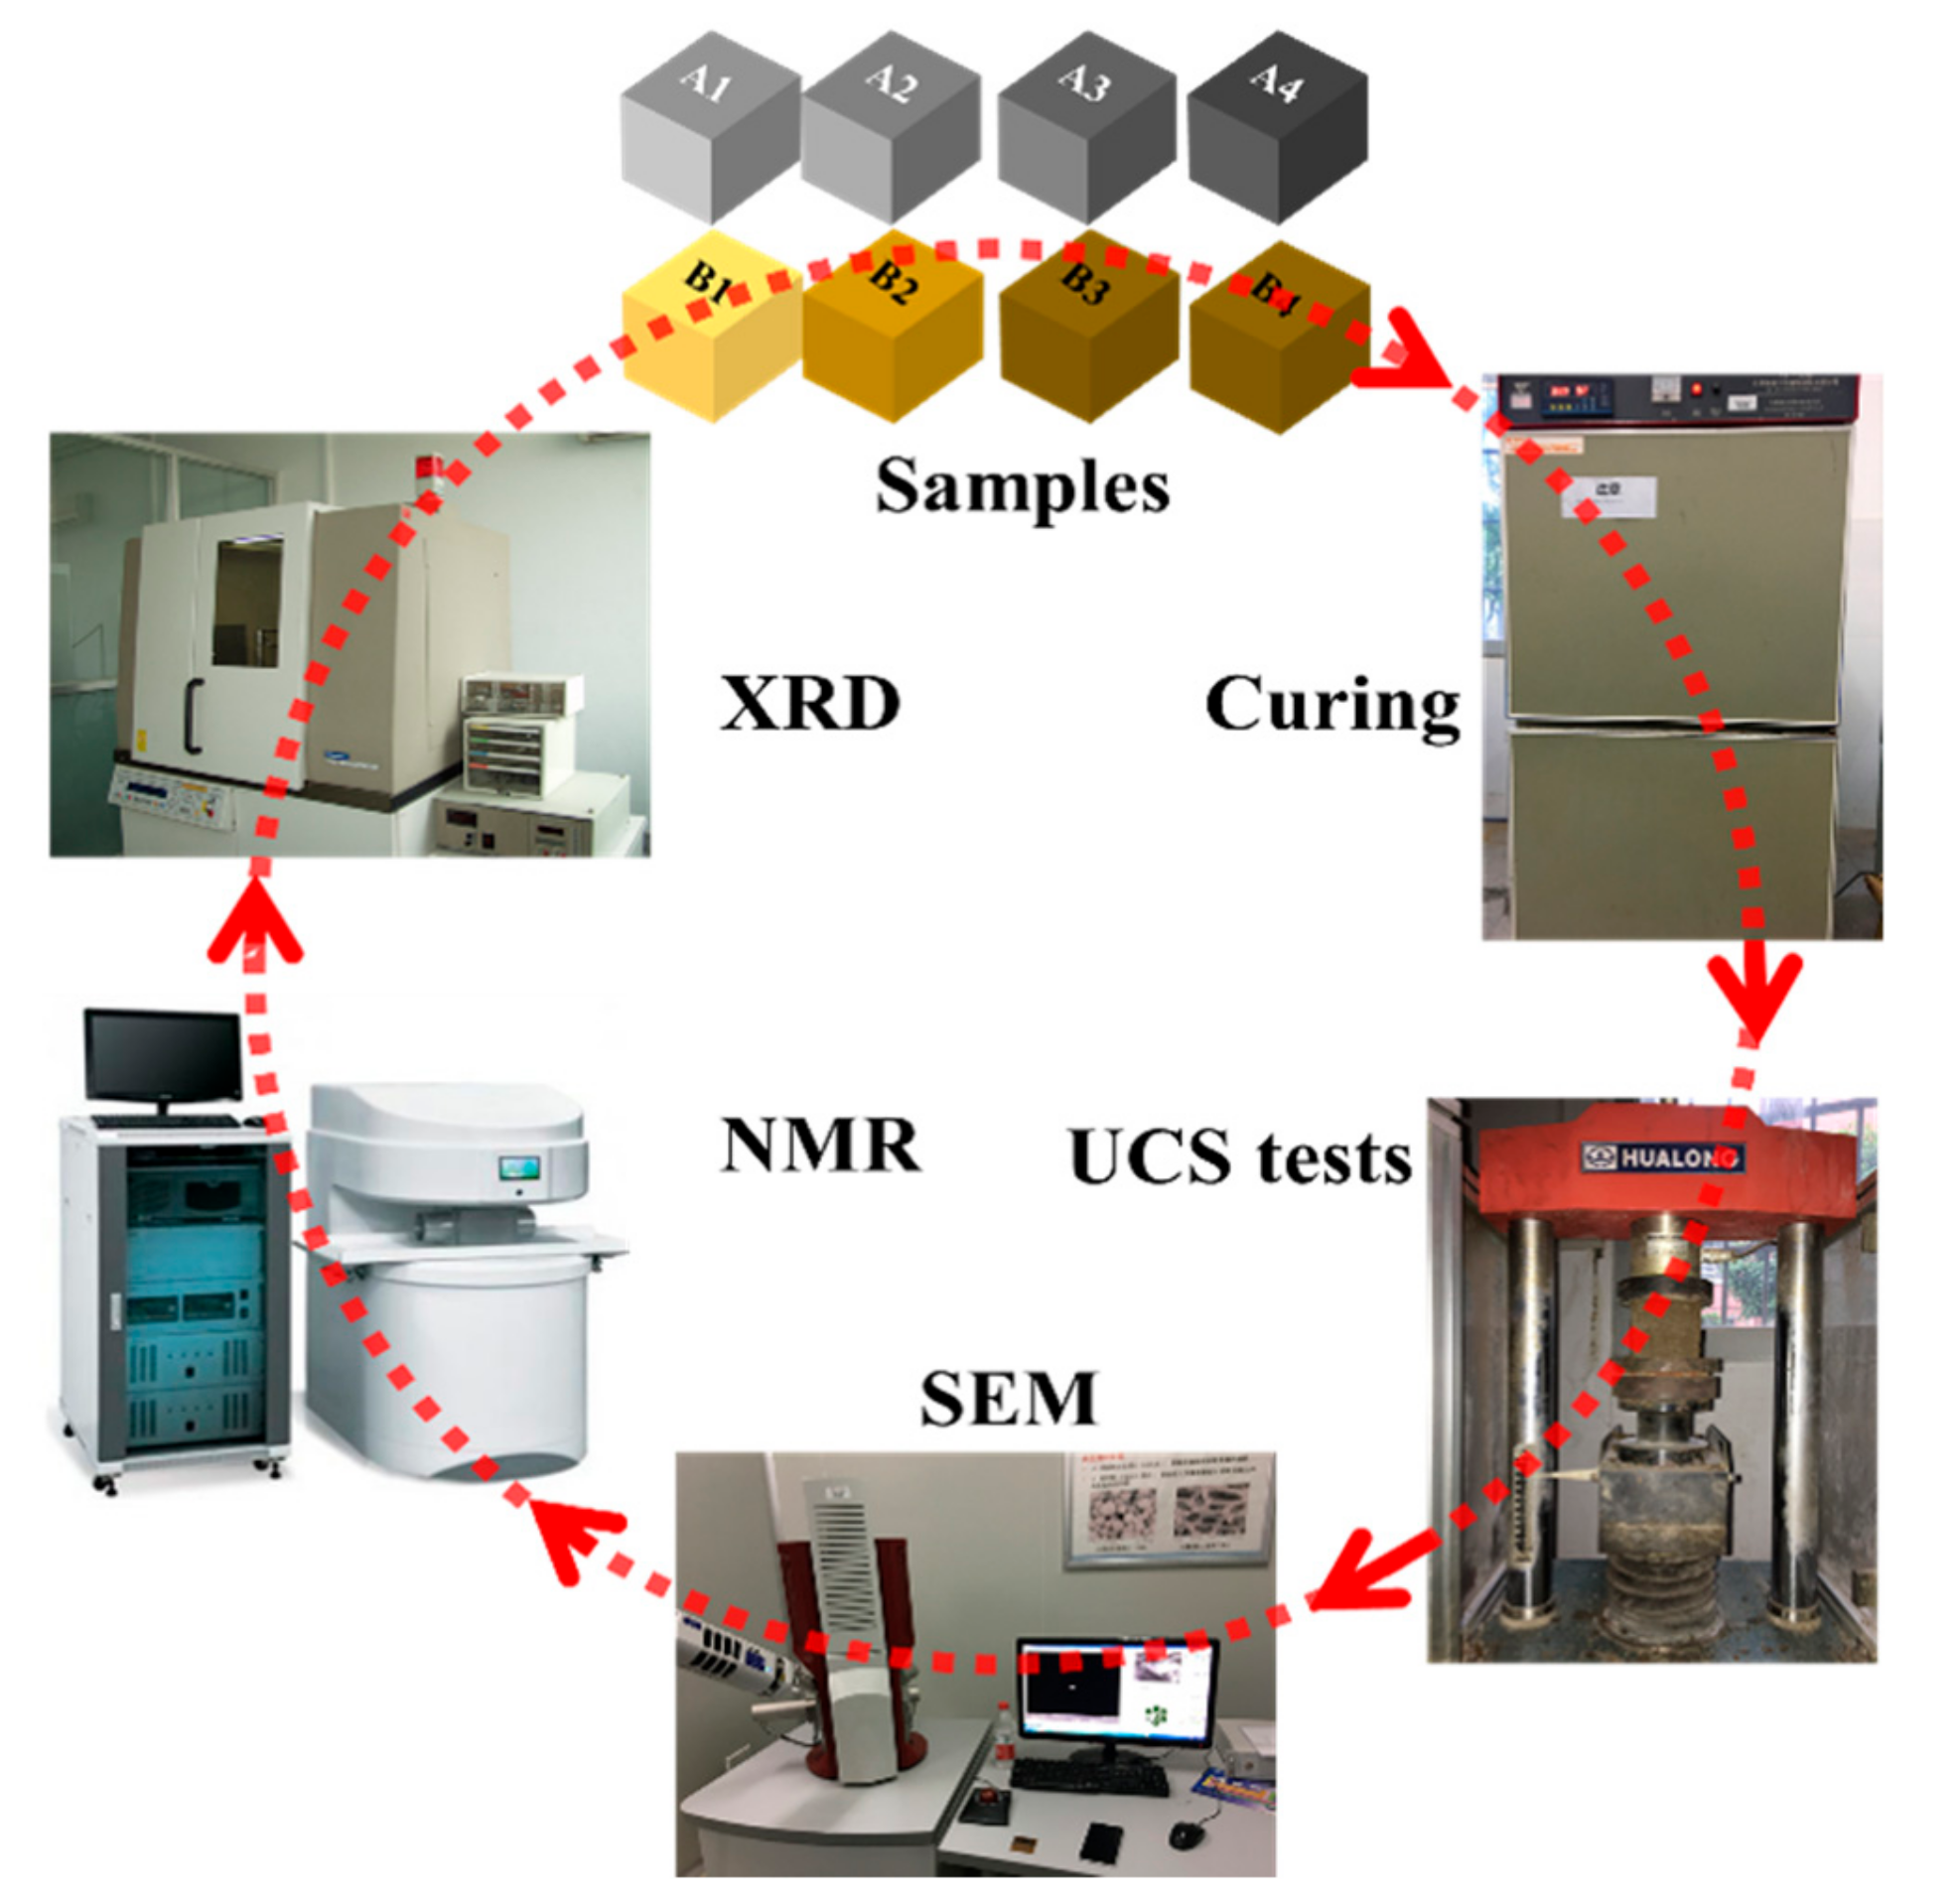
2.3. Experimental Methods
2.3.1. Uniaxial Compressive Strength (UCS) Test
2.3.2. Nuclear Magnetic Resonance (NMR) Analysis
2.3.3. Scanning Electron Microscopy-Image Analysis (SEM-IA)
3. Results
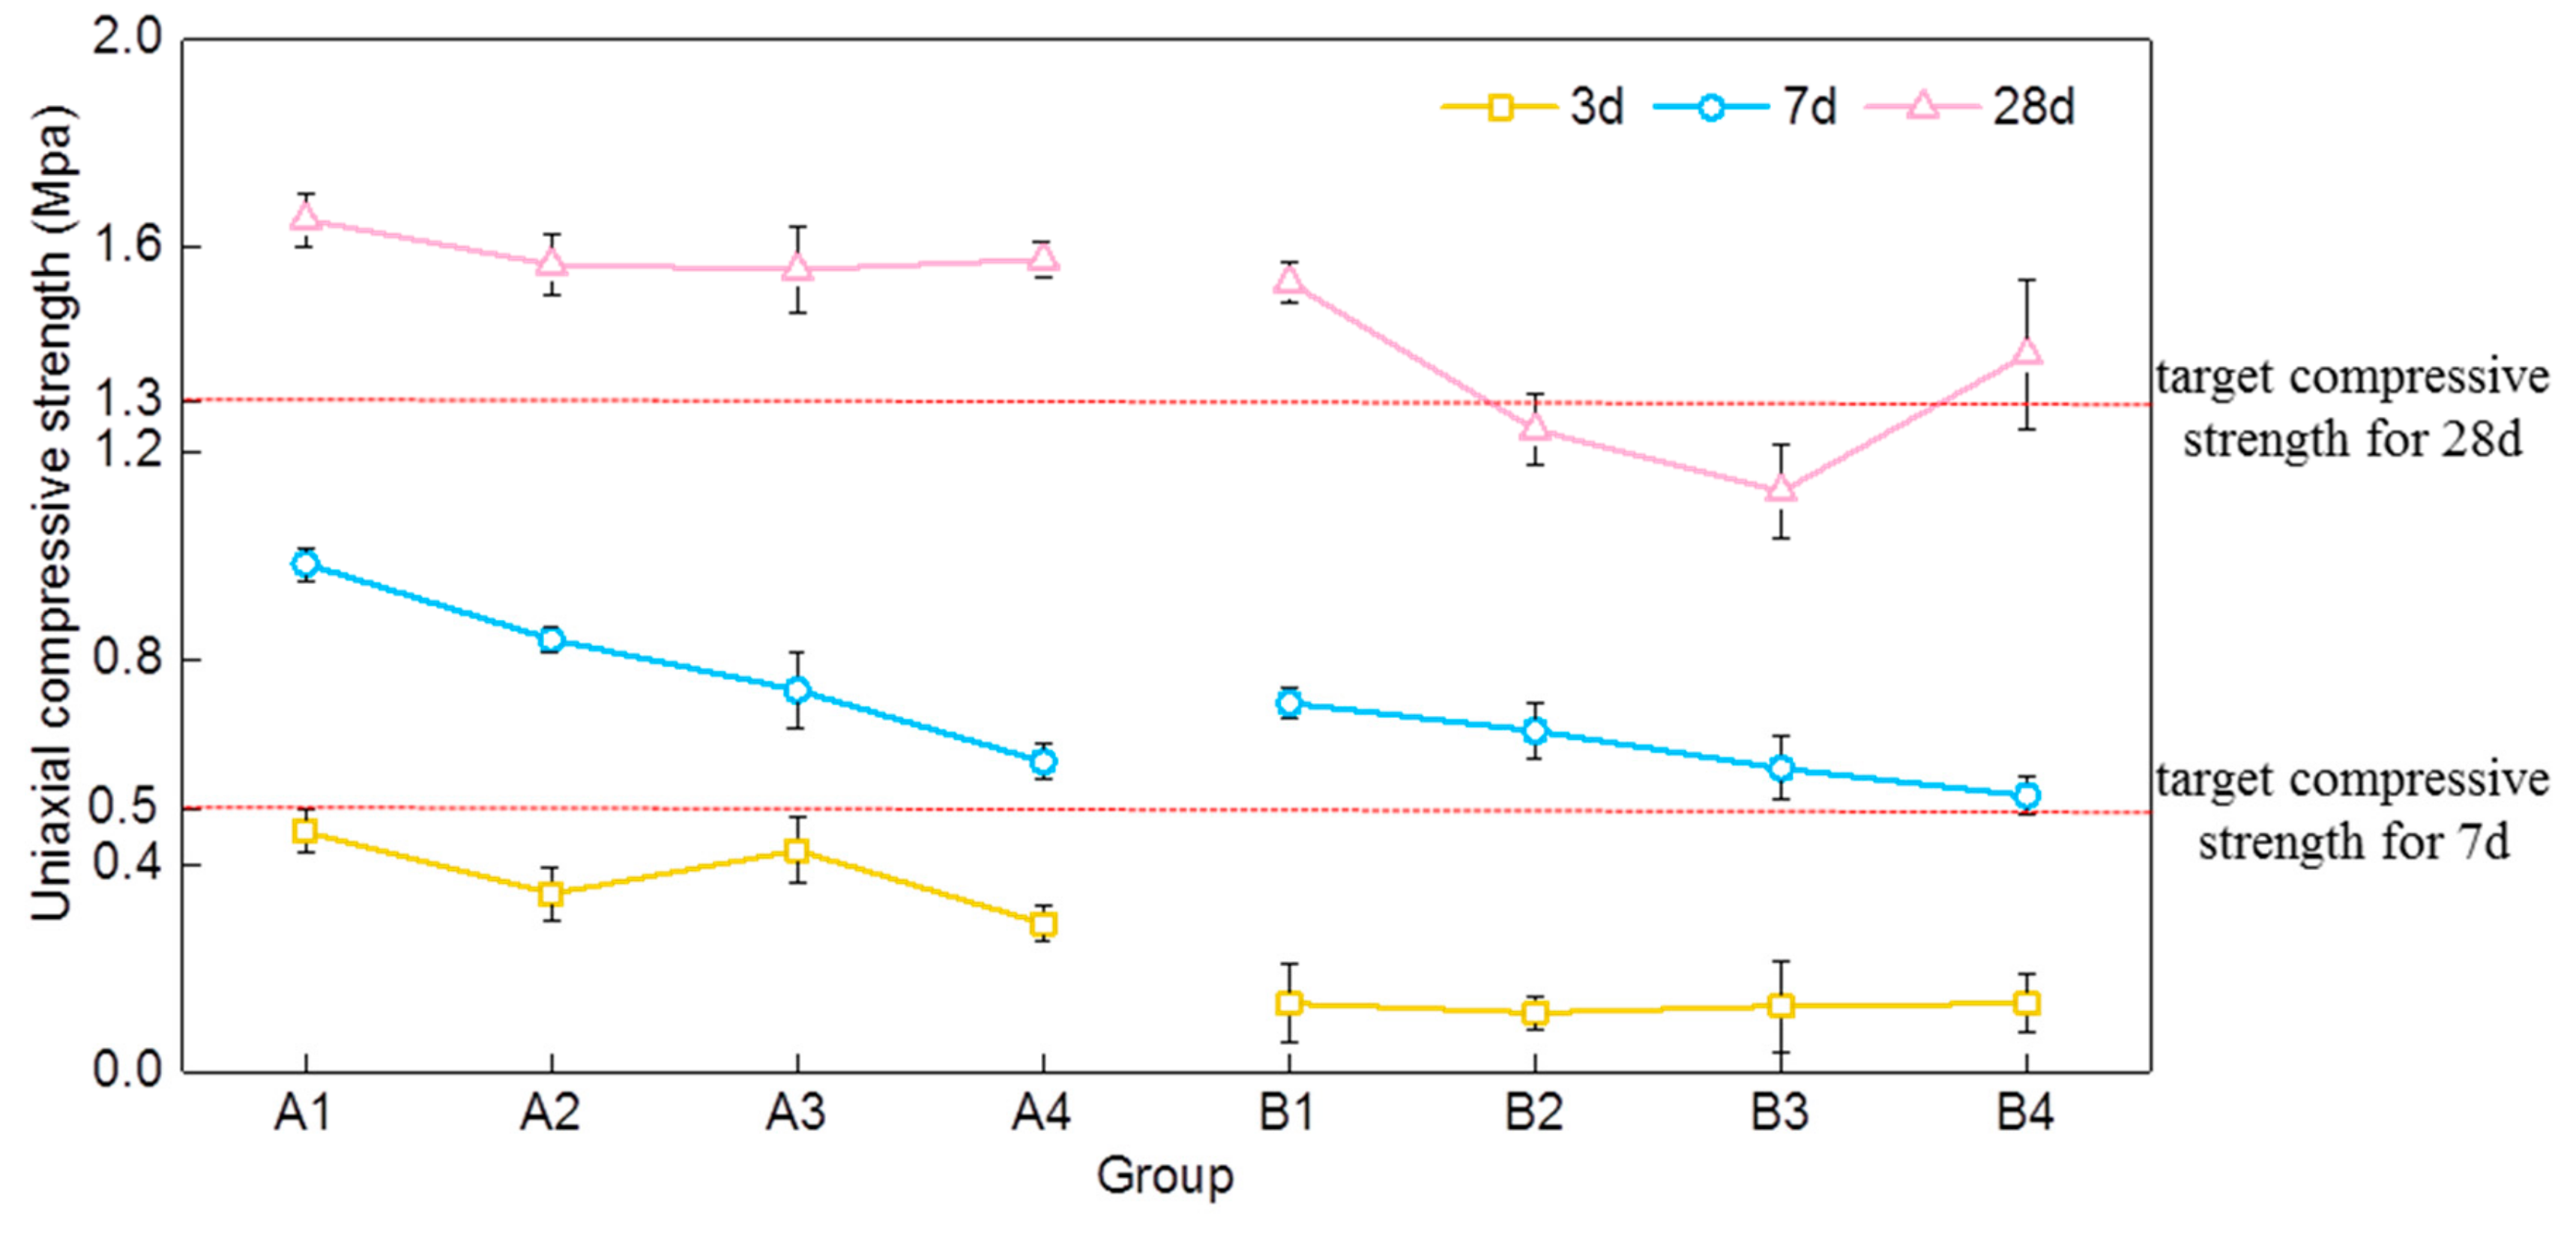
3.1. Uniaxial Compressive Strength
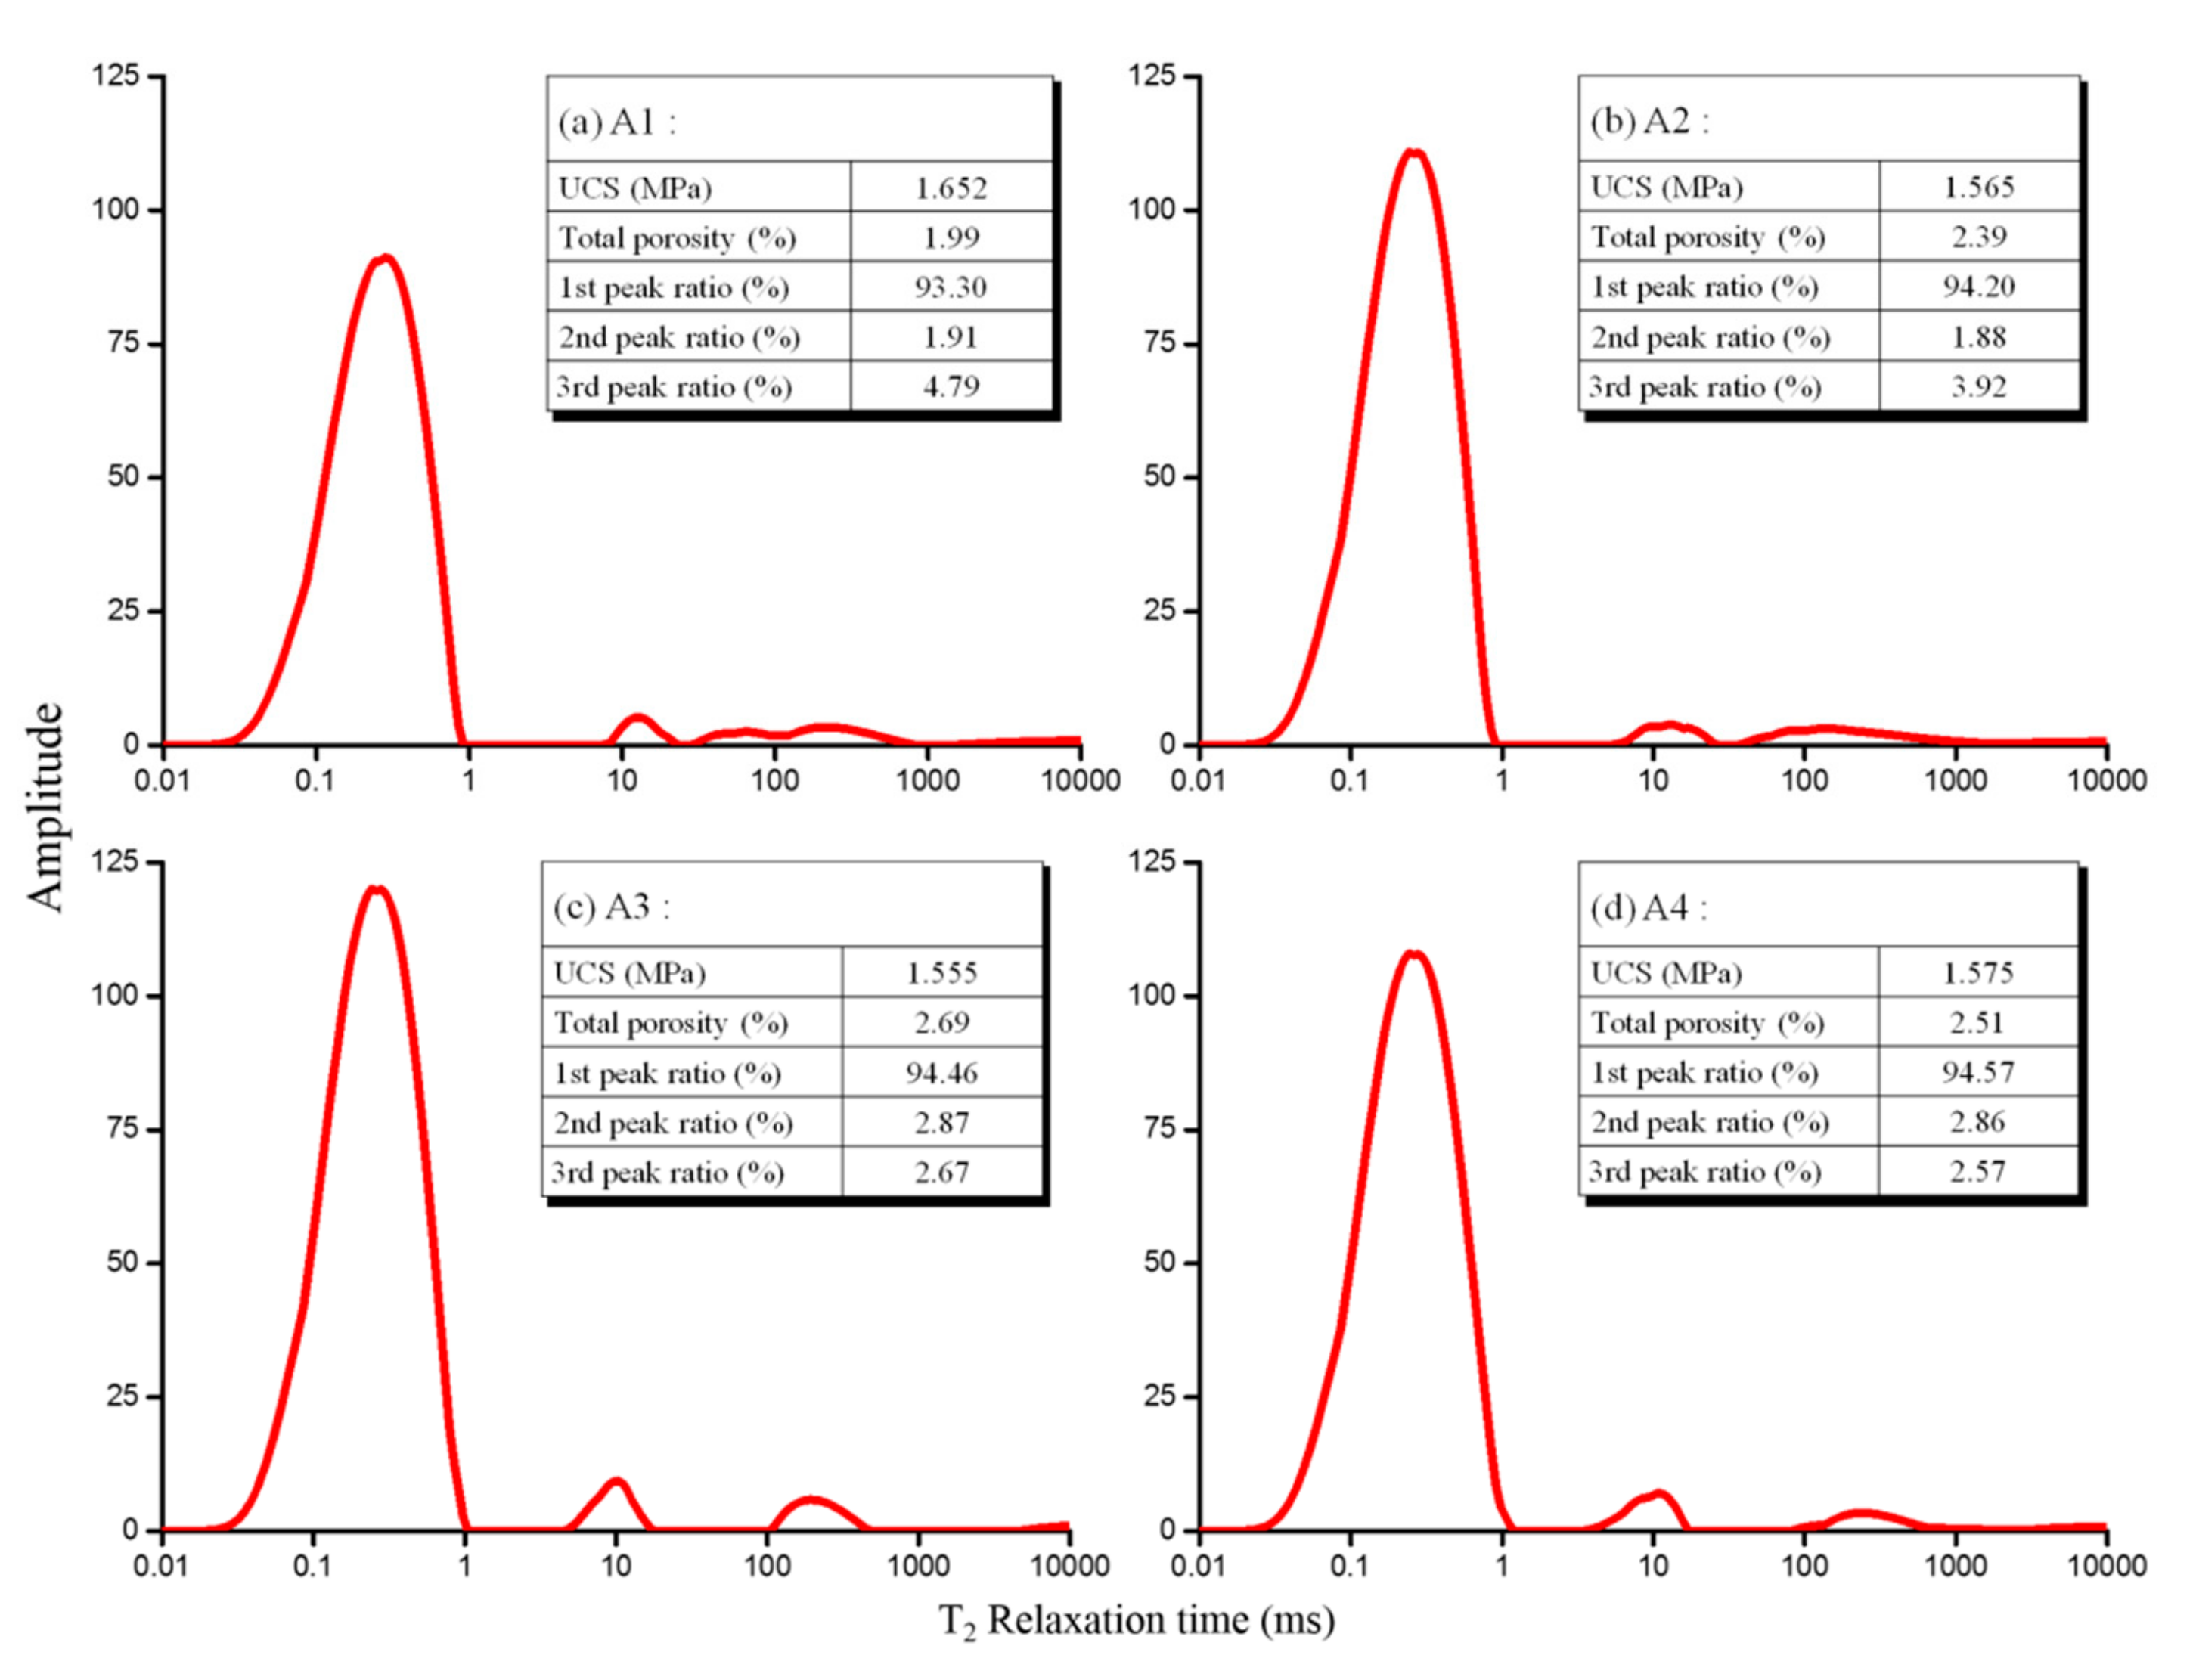
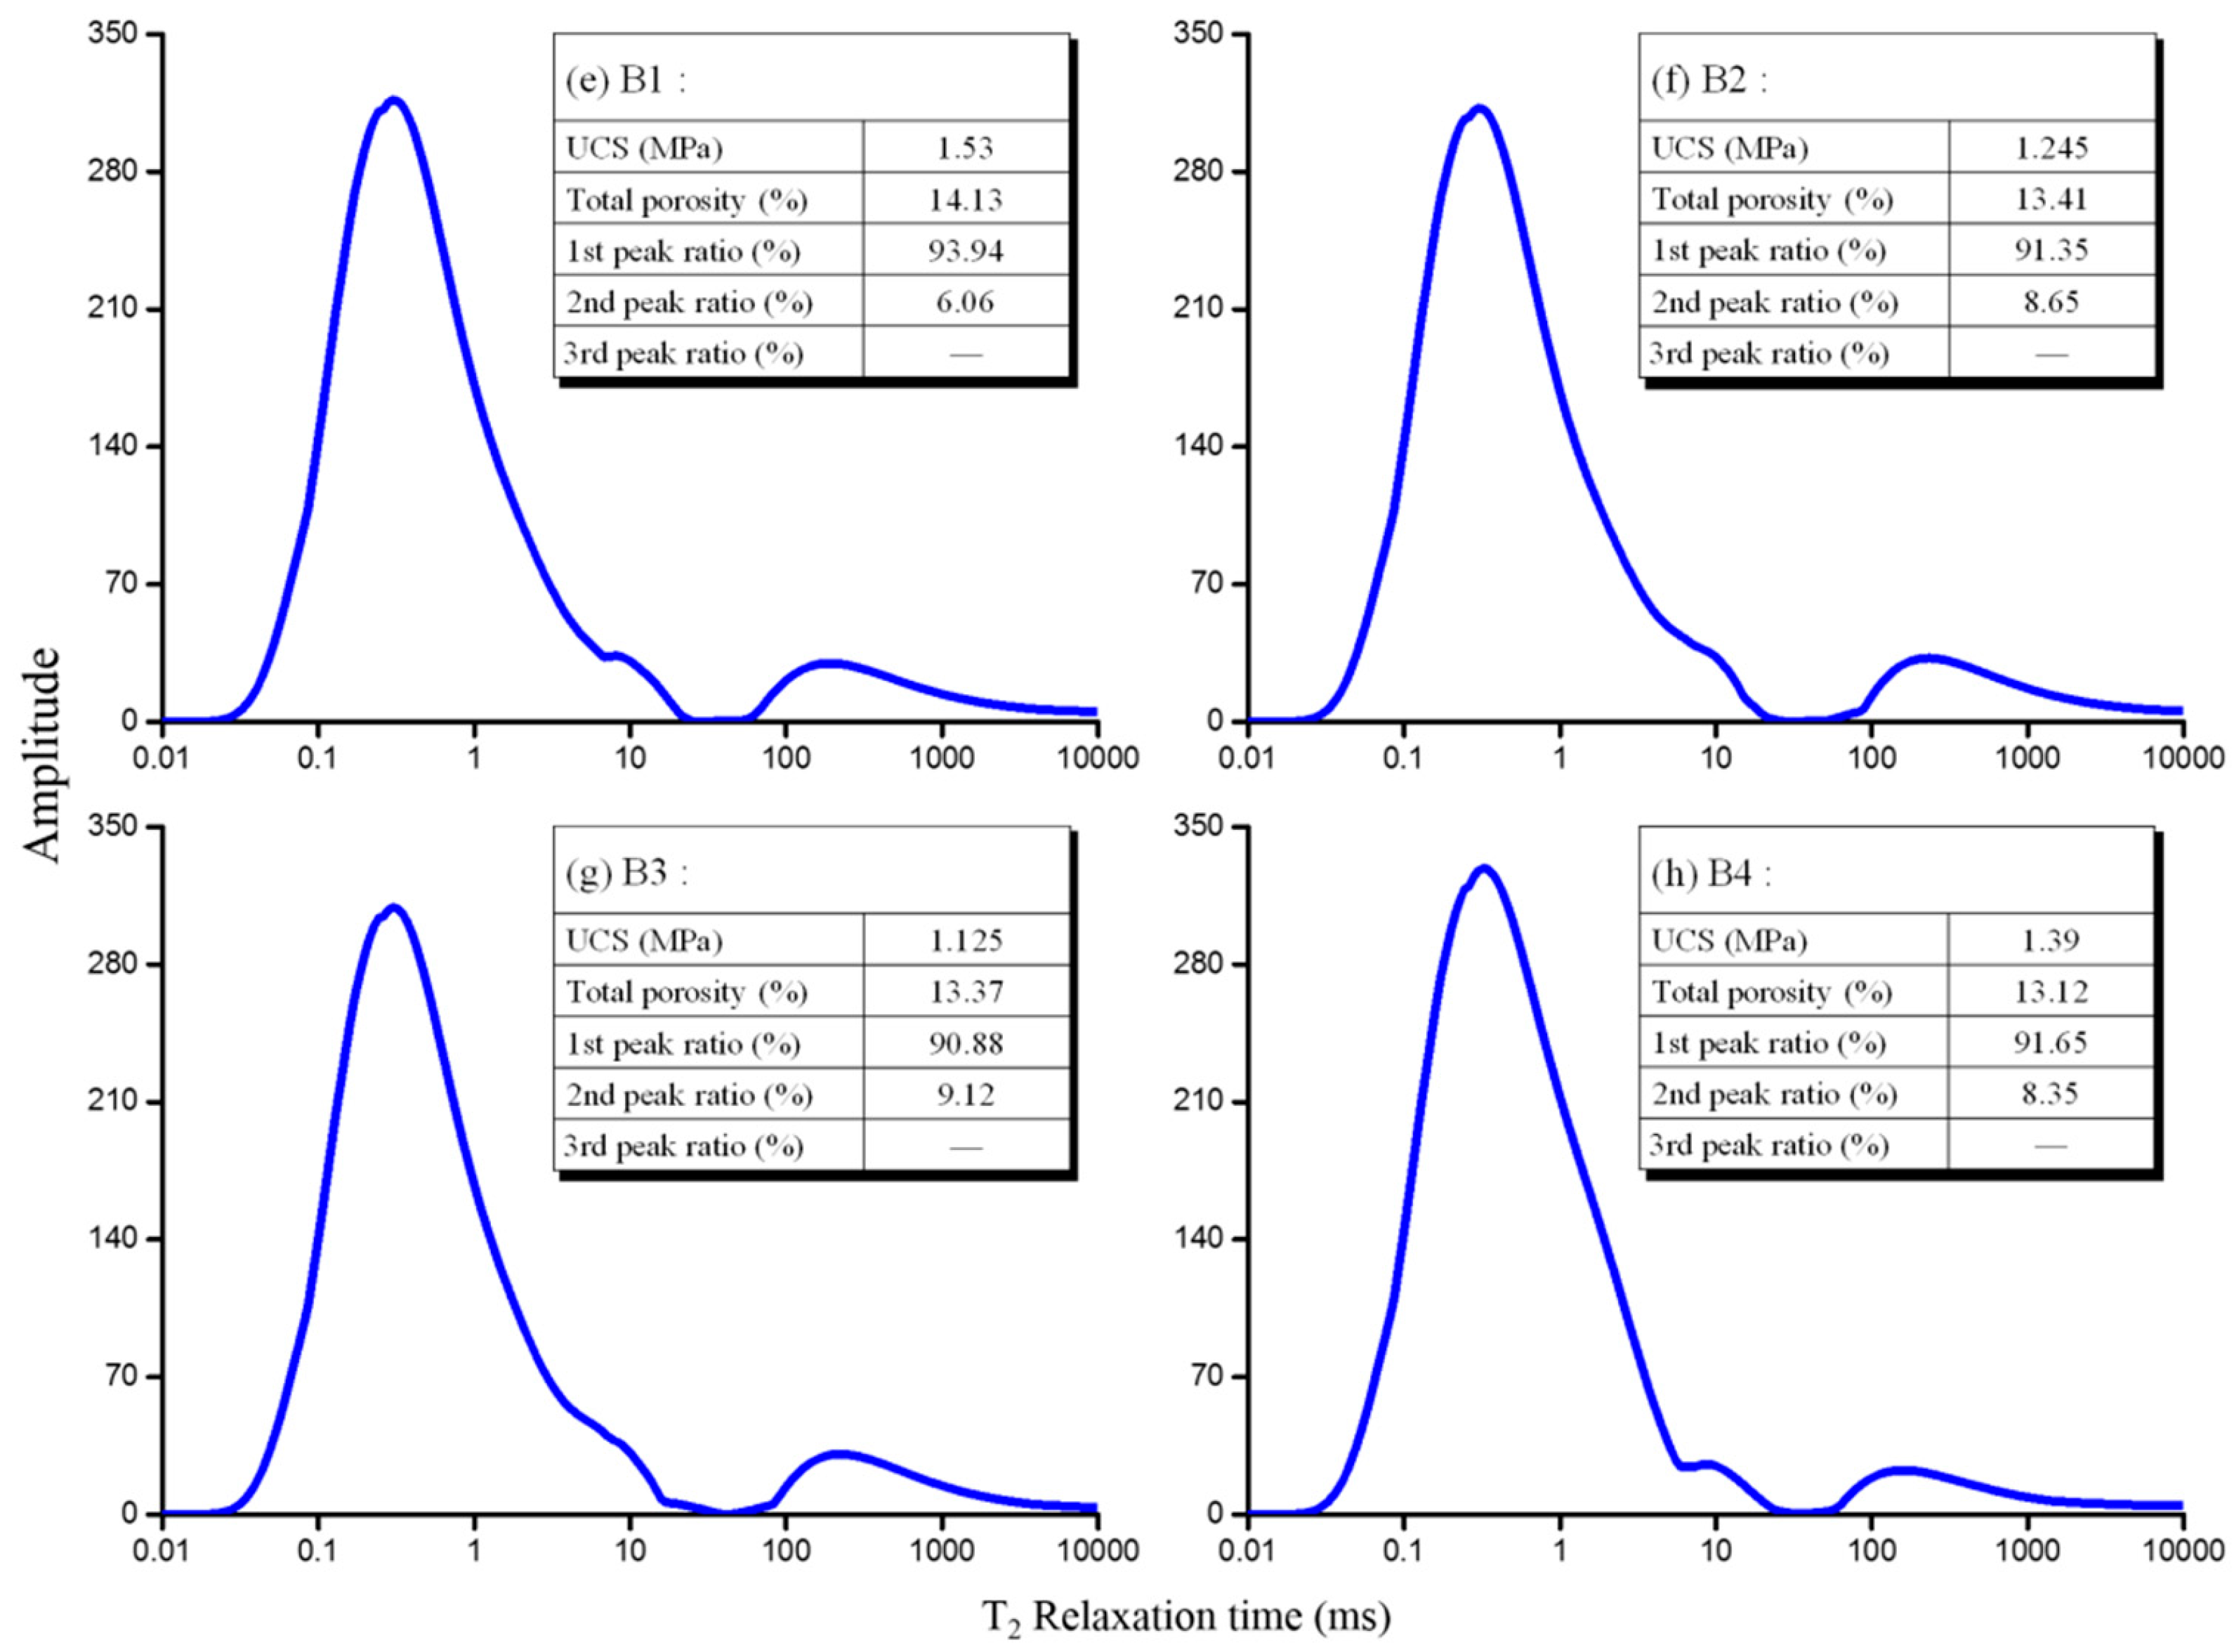
3.2. NMR Analysis of Pore Properties
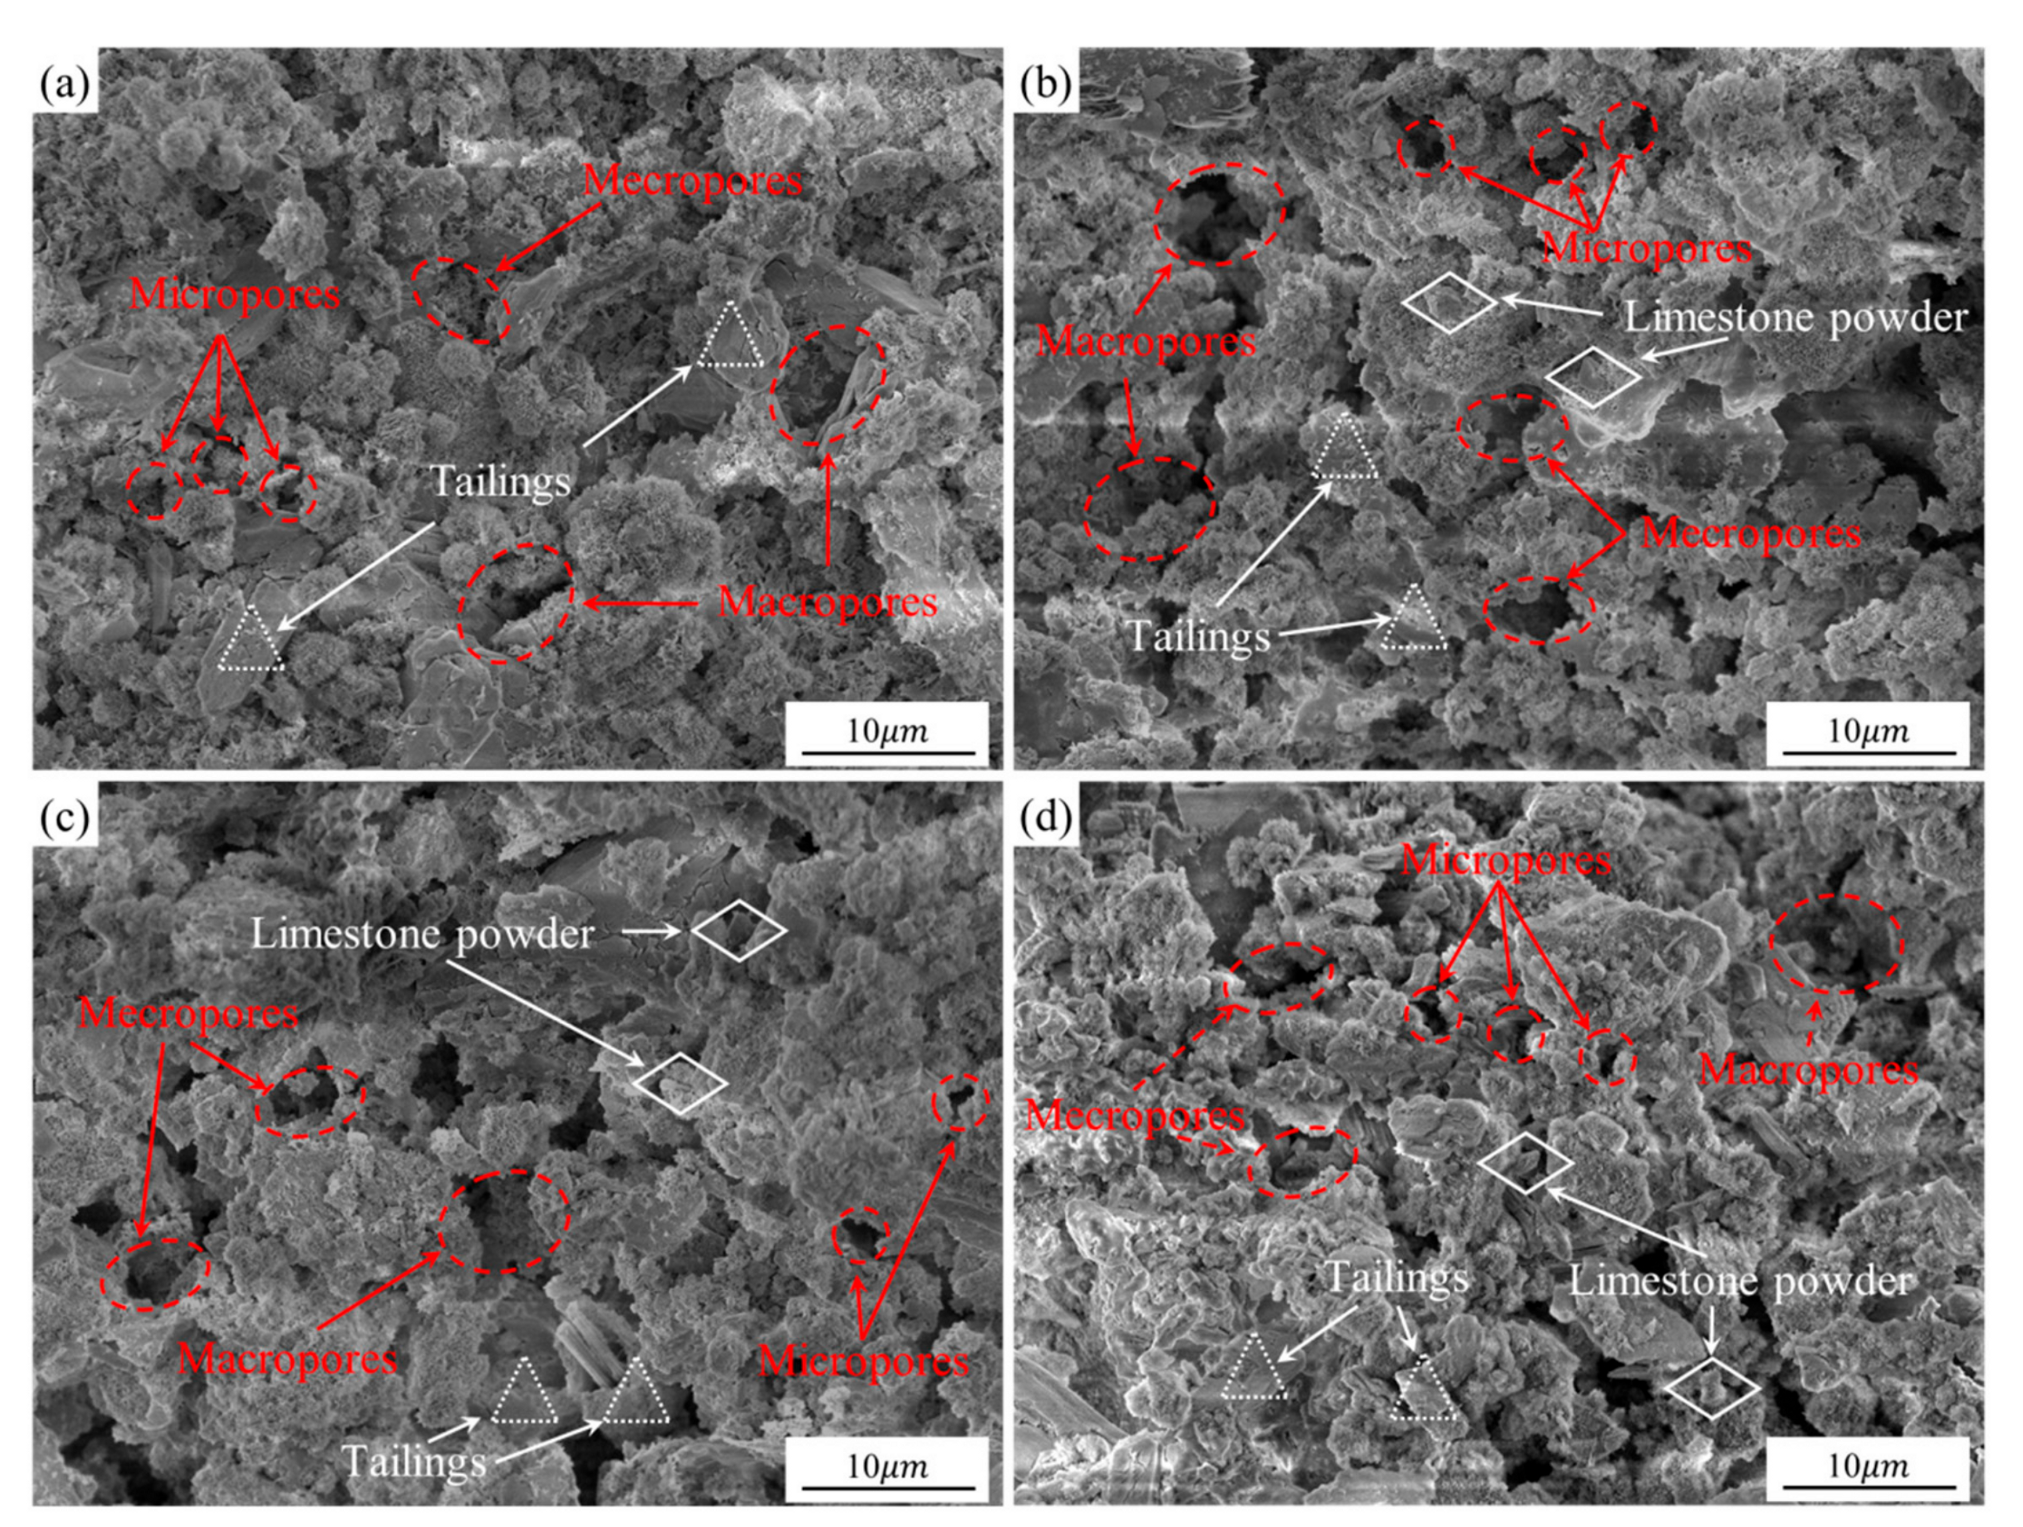
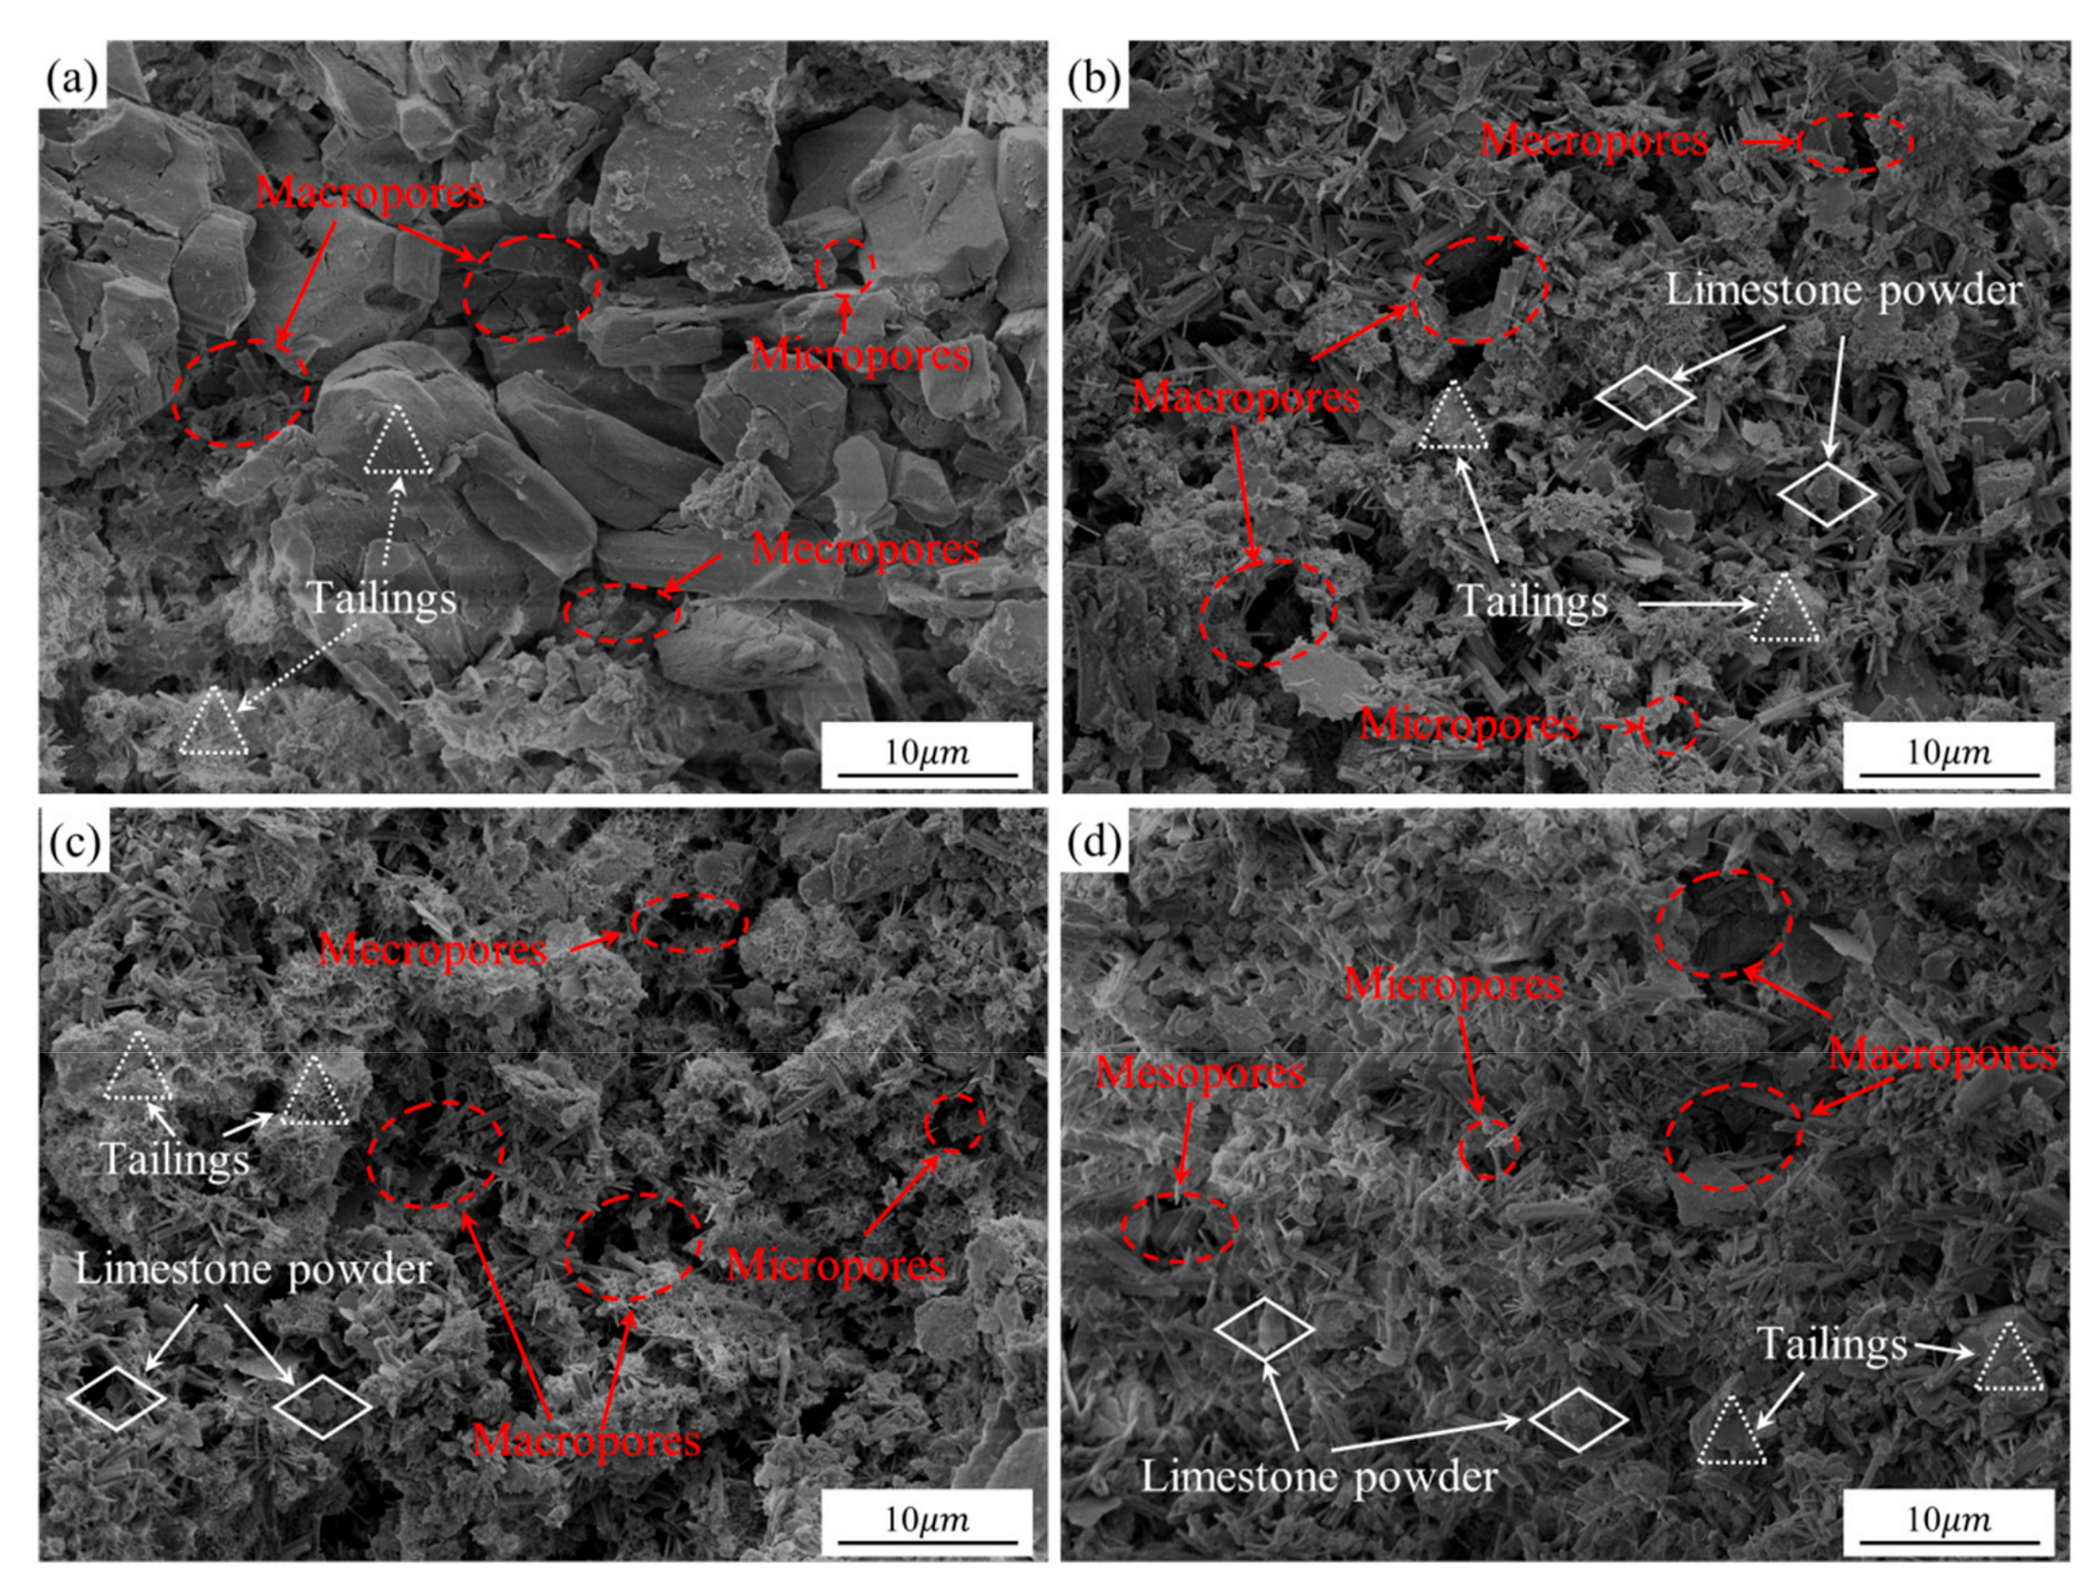
3.3. SEM Analysis of the Microstructure
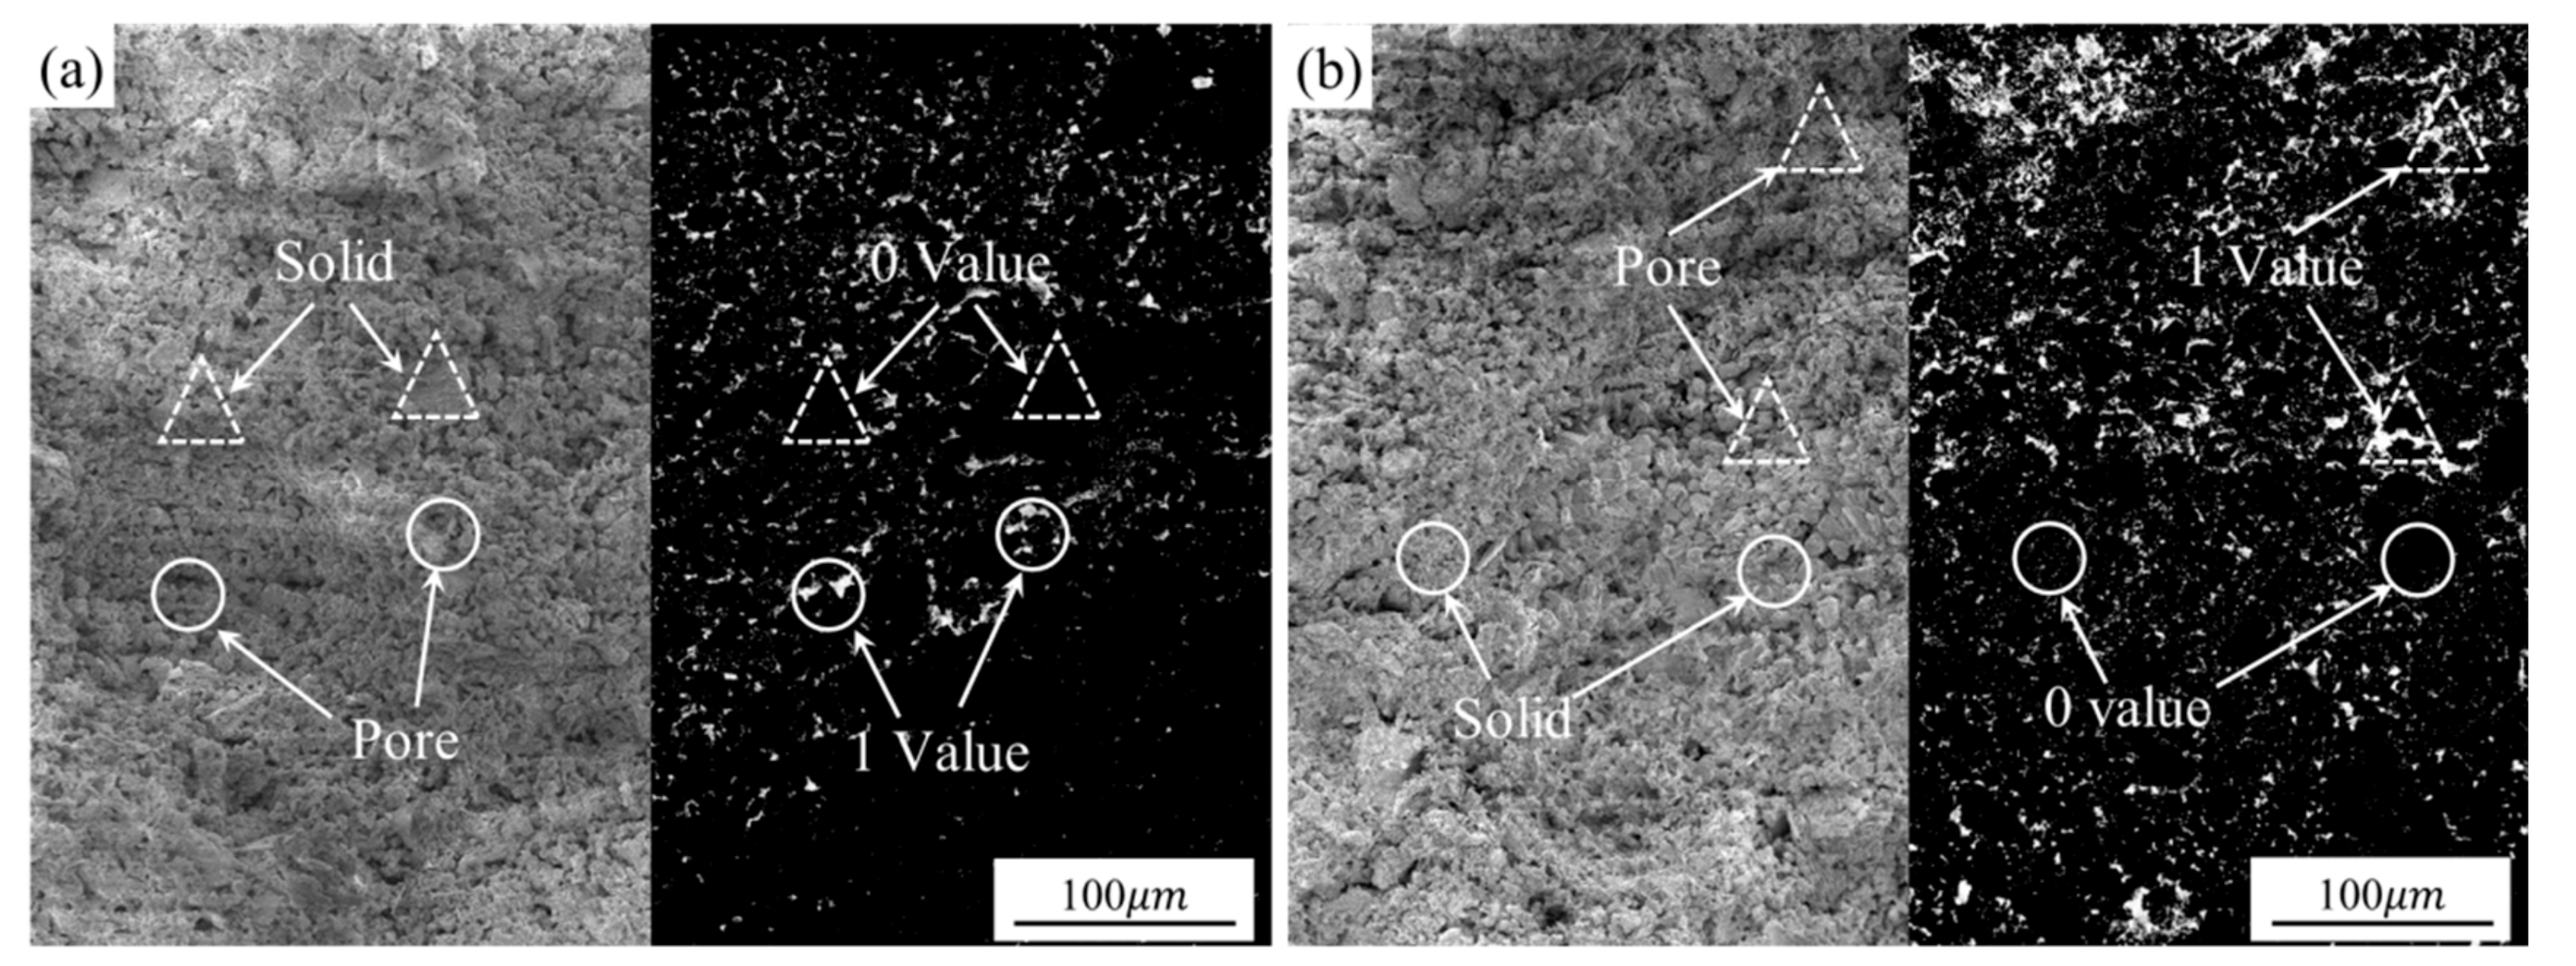
3.4. SEM Image Quantitative Analysis
4. Discussion
4.1. Pore Characteristics Analysis
4.2. Microstructure Analysis
4.3. Macro-Strength Characterization
5. Conclusions
Author Contributions
Funding
Acknowledgments
Conflicts of Interest
References
- Al-Kheetan, M.J.; Rahman, M.M.; Chamberlain, D.A. Chamberlain. Influence of early water exposure on modified cementitious coating. Constr. Build. Mater. 2017, 141, 64–71. [Google Scholar] [CrossRef]
- Al-Kheetan, M.J.; Rahman, M.M.; Chamberlain, D.A. A novel approach of introducing crystalline protection material and curing agent in fresh concrete for enhancing hydrophobicity. Constr. Build. Mater. 2018, 160, 644–652. [Google Scholar] [CrossRef]
- Kupwade-Patil, K.; Palkovic, S.D.; Bumajdad, A.; Soriano, C.; Buyukozturk, O. Use of silica fume and natural volcanic ash as a replacement to Portland cement: Micro and pore structural investigation using NMR, XRD, FTIR and X-ray microtomography. Constr. Build. Mater. 2018, 58, 574–590. [Google Scholar]
- Celik, K.; Meral, C.; Gursel, A.P.; Mehta, P.K.; Horvath, A.; Monteiro, P.J.M. Mechanical properties, durability, and life-cycle assessment of self-consolidating concrete mixtures made with blended portland cements containing fly ash and limestone powder. Cem. Concr. Compos. 2015, 56, 59–72. [Google Scholar] [CrossRef]
- De Weerdt, K.; Ben Haha, M.; le Saout, G.; Kjellsen, K.O.; Justnes, H.; Lothenbach, B. Hydration mechanisms of ternary Portland cements containing limestone powder and fly ash. Cem. Concr. Res. 2011, 41, 279–291. [Google Scholar] [CrossRef]
- Wang, D.; Shi, C.; Farzadnia, N.; Shi, Z.G.; Jia, H.F.; Ou, Z.H. A review on use of limestone powder in cement-based materials: Mechanism, hydration and microstructures. Constr. Build. Mater. 2018, 181, 659–672. [Google Scholar] [CrossRef]
- Sua-Iam, G.; Makul, N. Utilization of limestone powder to improve the properties of self-compacting concrete incorporating high volumes of untreated rice husk ash as fine aggregate. Constr. Build. Mater. 2013, 38, 455–464. [Google Scholar] [CrossRef]
- Pokharel, M.; Fall, M. Combined influence of sulphate and temperature on the saturated hydraulic conductivity of hardened cemented paste backfill. Cem. Concr. Compos. 2013, 38, 21–28. [Google Scholar] [CrossRef]
- Benzaazoua, M.; Ouellet, J.; Servant, S.; Newman, P.; Verburg, R. Cementitious backfill with high sulfur content: Physical, chemical and mineralogical characterization. Cem. Concr. Res. 1999, 29, 719–725. [Google Scholar] [CrossRef]
- Hu, J.H.; Ren, Q.F.; Jiang, Q.; Gao, R.G.; Zhang, L.; Luo, Z.Q. Strength characteristics and the reaction mechanism of stone powder cement tailings backfill. Adv. Mater. Sci. Eng. 2018, 2018, 8651239. [Google Scholar] [CrossRef]
- Fall, M.; Pokharel, M. Coupled effects of sulphate and temperature on the strength development of cemented tailings backfills: Portland cemen-paste backfill. Cem. Concr. Compos. 2010, 32, 819–828. [Google Scholar] [CrossRef]
- Kesimal, A.; Yilmaz, E.; Ercikdi, B.; Alp, I.; Deveci, H. Effect of properties of tailings and binder on the short- and long-term strength and stability of cemented paste backfill. Mater. Lett. 2005, 59, 3703–3709. [Google Scholar] [CrossRef]
- Zhou, K.P.; Gao, R.G.; Gao, F. Particle Flow Characteristics and Transportation Optimization of Superfine Unclassified Backfilling. Miner 2017, 7, 6. [Google Scholar] [CrossRef]
- Ercikdi, B.; Kuekci, G.; Yilmaz, T. Utilization of granulated marble and waste bricks as mineral admixture in cemented paste backfill of sulphide-rich tailings. Constr. Build. Mater. 2015, 93, 573–583. [Google Scholar] [CrossRef]
- Ye, G.; Liu, X.; de Schutter, G.; Poppe, A.M.; Taerwe, L. Influence of limestone powder used as filler in SCC on hydration and microstructure of cement pastes. Cem. Concr. Res. 2007, 29, 94–102. [Google Scholar] [CrossRef]
- Hassani, F.P.; Ouellet, J.; Hossein, M. Strength development in underground high sulphate paste backfill operation. CIM Bull. 2001, 1050, 57–62. [Google Scholar]
- Ouellet, S.; Bussiere, B.; Aubertin, M.; Benzaazoua, M. Characterization of cemented paste backfill pore structure using SE and IA analysis. Bull. Eng. Geol. Environ. 2008, 67, 139–152. [Google Scholar] [CrossRef]
- Davy, C.A.; Adler, P.M. Three-scale analysis of the permeability of a natural shale. Phys. Rev. 2017, 96, 063116. [Google Scholar] [CrossRef] [PubMed]
- Oh, B.H.; Jang, S.Y.; Shin, Y.S. Experimental investigation of the threshold chloride concentration for corrosion initiation in reinforced concrete structures. Mag. Concr. Res. 2001, 55, 441–504. [Google Scholar] [CrossRef]
- Shang, J.L.; Hu, J.H.; Zhou, K.P.; Luo, X.W.; Aliyu, M. Porosity increment and strength degradation of low-porosity sedimentary rocks under different loading conditions. Int. J. Rock Mech. Min. Sci. 2015, 75, 216–223. [Google Scholar] [CrossRef]
- Zhou, K.P.; Li, J.L.; Xu, Y.J.; Zhang, Y.M. Determination of pore structure characteristics of rock based on nuclear magnetic resonance. J. Central South Univ. (Sci. Technol.) 2012, 43, 4796–4800. [Google Scholar]
- Wu, Z.W. High performance concrete-green concrete. Chin. Concr. Cem. Prod. 2000, 2, 1–4. [Google Scholar]
- Zhou, S. Research on pore structure fractal characteristics of cement concrete. Concrete 2016, 315, 56–58. [Google Scholar]
- Liu, G.Q.; Liu, S.X.; Huang, Q.J.; Zhong, Y.L.; Zhong, S.; Qin, X. Metallography and material microstructure quantitative analysis technology. Chin. J. Stereol. Image Anal. 2002, 7, 248–251. [Google Scholar]
- Al-Kheetan, M.J.; Rahman, M.M.; Chamberlain, D.A. Development of hydrophobic concrete by adding dualcrystalline admixture at mixing stage. Struct. Concr. 2018, 19, 1504–1511. [Google Scholar] [CrossRef]


| Element | Tailing A | Tailing B | Limestone Powder | |
|---|---|---|---|---|
| Content/% | Compound | Concentration/% | ||
| O | 34.70 | 44.38 | CaO | 57.60 |
| Fe | 23.10 | 12.66 | SiO2 | 36.87 |
| S | 15.86 | 8.88 | Al2O3 | 1.58 |
| Ca | 14.03 | 9.09 | MgO | 1.17 |
| Si | 4.48 | 16.24 | Fe2O3 | 1.17 |
| Mg | 2.12 | 0.40 | SO3 | 0.74 |
| Zn | 1.23 | 1.14 | K2O | 0.27 |
| Al | 1.11 | 3.06 | BaO | 0.12 |
| As | 0.99 | 1.48 | P2O5 | 0.085 |
| K | 0.50 | 0.67 | Cr2O3 | 0.085 |
| Sn | 0.37 | 0.24 | TiO2 | 0.082 |
| Pb | 0.34 | 0.52 | MnO | 0.081 |
| Sb | 0.32 | 0.35 | Na2O | 0.039 |
| Mn | 0.14 | 0.41 | SrO | 0.039 |
| Group | Sample | Mass Content (%) | Cu | Cc | |||
|---|---|---|---|---|---|---|---|
| Water | Tailings | LSP | OPC | ||||
| Group A mixture | A1 | 30 | 56 | 0 | 14 | 14.56 | 0.72 |
| A2 | 30 | 56 | 1.4 | 12.6 | 14.68 | 0.72 | |
| A3 | 30 | 56 | 2.1 | 11.9 | 14.80 | 0.73 | |
| A4 | 30 | 56 | 2.8 | 11.2 | 14.93 | 0.73 | |
| Group B mixture | B1 | 30 | 56 | 0 | 14 | 40.02 | 0.71 |
| B2 | 30 | 56 | 1.4 | 12.6 | 44.36 | 0.64 | |
| B3 | 30 | 56 | 2.1 | 11.9 | 44.10 | 0.64 | |
| B4 | 30 | 56 | 2.8 | 11.2 | 43.83 | 0.65 | |
| Group | Porosity (%) | Calculated Porosity (%) | Pixel Area | Counting Unit | Calculated Average Pore Radius (μm) |
|---|---|---|---|---|---|
| A1 | 1.99 | 2.17 | 16,900 | 662 | 1.54 |
| A2 | 2.39 | 2.53 | 19,679 | 708 | 1.61 |
| A3 | 2.69 | 2.63 | 20,491 | 738 | 1.61 |
| A4 | 2.51 | 2.50 | 19,518 | 670 | 1.65 |
| B1 | 14.13 | 14.12 | 110,065 | 1903 | 2.32 |
| B2 | 13.41 | 12.97 | 101,102 | 2209 | 2.06 |
| B3 | 13.37 | 13.97 | 108,841 | 1992 | 2.25 |
| B4 | 13.12 | 14.09 | 109,802 | 2705 | 1.94 |
© 2019 by the authors. Licensee MDPI, Basel, Switzerland. This article is an open access article distributed under the terms and conditions of the Creative Commons Attribution (CC BY) license (http://creativecommons.org/licenses/by/4.0/).
Share and Cite
Hu, J.; Ding, X.; Ren, Q.; Luo, Z.; Jiang, Q. Effect of Incorporating Waste Limestone Powder into Solid Waste Cemented Paste Backfill Material. Appl. Sci. 2019, 9, 2076. https://doi.org/10.3390/app9102076
Hu J, Ding X, Ren Q, Luo Z, Jiang Q. Effect of Incorporating Waste Limestone Powder into Solid Waste Cemented Paste Backfill Material. Applied Sciences. 2019; 9(10):2076. https://doi.org/10.3390/app9102076
Chicago/Turabian StyleHu, Jianhua, Xiaotian Ding, Qifan Ren, Zhouquan Luo, and Quan Jiang. 2019. "Effect of Incorporating Waste Limestone Powder into Solid Waste Cemented Paste Backfill Material" Applied Sciences 9, no. 10: 2076. https://doi.org/10.3390/app9102076
APA StyleHu, J., Ding, X., Ren, Q., Luo, Z., & Jiang, Q. (2019). Effect of Incorporating Waste Limestone Powder into Solid Waste Cemented Paste Backfill Material. Applied Sciences, 9(10), 2076. https://doi.org/10.3390/app9102076