Abstract
The measurements of acoustic properties of three brittle materials i.e., ITO (alkaline earth boro-aluminosilicate) glass, bulk metallic glass (BMG) and nickel-based superalloy (CM247LC) are conducted in this work to obtain various properties. The elastic moduli of materials are derived from the results by simple acoustic speed-elasticity relationship and compared with the data obtained with nanoindentation. The difference between the Young’s modulus of ITO glass by ultrasonic and nanoindentation is 0.83%, a perfect match within range error. As for BMG, the difference (Young’s modulus) is 23.59%, and 5.11% for the CM247LC superalloys. The pulse-echo method proves to be reliable for homogeneous amorphous glass, however, the elastic moduli of metallic glass and CM247LC superalloy by ultrasonic are quite different from those by nanoindentation. The difference is large enough to cover the maximal error associated with the nanoindentation method. The relationship of acoustic speed and elastic constants must be reviewed in dealing with compound materials.
1. Introduction
A material is considered to be brittle if it exhibits low strain at the point of fracture when subjected to tensile stress. That is to say, unlike ductile materials, it has very little plastic capability and hence no specific yield point. Brittle materials include a wide range of material classes ranging from polymers to metals, through to glass, ceramics, and composites. The measurement of the elastic properties of brittle materials (Young’s modulus and Poisson ratio) is still always difficult due to the low strain if the stress-strain relationship of elongation is employed in the experiments. Alternative partially destructive or non-destructive methods have been developed to challenge the task. However, the validity or right occasion really depends on the target material. In this paper, we tried different popular methods on different special materials and demonstrated some considerable discrepancy of data between them under measurement.
Elastic modulus is an intrinsic material property and a key parameter in engineering design and materials development. The measurement of elastic moduli is a fundamental work to understand the mechanical behavior of materials. ASTM [1] has a wide range of test methods available for measuring modulus, but there is currently some uncertainty within parts of the user community about the reliability of modulus data, to the extent that many use values from Springer Handbook [2] in their calculations and designs. There are a few standardized methods such as destructive tensile or compression test, flexural bending, resonance [3], and ultrasonic testing [4,5,6,7] for general applications on regular materials. The associated uncertainty and right occasion of usage depends on the configuration such as shape and size, and material of the test subject. The ultrasonic method is a nondestructive and convenient modality. Normally, the ultrasonic NDT (nondestructive test) of material characterization is used for the determination of (a) elastic constants e.g., shear, bulk, Young’s and Lamé coefficients; (b) microstructure e.g., grain size, texture, density etic; (c) flaw (porosity, creep damage, fatigue damage etc.), and other mechanical properties such as tensile strength, shear strength, hardness as discussed by Auld [8]. It includes afore-mentioned pulse-echo [4], resonance [3] and mode transformation approaches [9]. Of the three approaches, pulse-echo is the most popular technique due to its convenience and ease to use. It is also superior to the tensile test when applied on brittle materials that fracture under small strain. A normal compression test is used for stress-strain measurement instead. The quantities, ultrasonic velocity and attenuation are the important parameters which are required for the ultrasonic nondestructive technique of material characterization. The acoustic speed is generally related to the elastic constants and density of material. Henceforth, it offers the information about the mechanical, anisotropic, and elastic properties of the transmitting medium. The elastic moduli are derived from the acoustic speed in pulse-echo method. It is desirable to validate of the relationship between the acoustic speeds and elastic moduli of the test subjects as the ultrasonic method is applied. The other parameter is the acoustic attenuation which is defined as the loss of energy of the acoustic waves travelling through different media. The general causes may be classified as scattering by heterogeneities (not applicable in the current study) and absorption by physical acoustics [8]. For the absorption part, as the ultrasonic wave propagates through the medium, some energy is attenuated through different complex mechanisms such as thermal loss, scattering, absorption, electron-phonon interaction, phonon-phonon interaction, and magnon-phonon interaction etc., called the acoustic attenuation. The coefficient of ultrasonic attenuation is also associated with several intrinsic physical properties as discovered in Pandey et al. [5], e.g., Grüneisen parameter, thermal conductivity, thermal relaxation time, thermal energy density, specific heat, granular size, Debye average velocity, and concentration etc. It is also a certain trace imprinted on material that may be used for characterization.
Instrumented indentation [10] is a technique investigated for determining both the elastic and plastic properties of the materials. The nanoindentation method [11] gained popularity with the development of advanced instruments that can record micro load and displacement with high precision. If the indentation is taken at a nanoscale level it can provide accurate measurements of the continuous variation of indentation load down to micro Newton, as a function of the indentation depth down to nanometer. Dao et al. [12] used standardized experimental procedure and analytic models (depending on the indenter shape identified by Cheng et al. [13]) the load-displacement data can be used to determine elastic moduli, hardness and other mechanical properties including residual stresses.
Metallic glasses can be described as metals or metal alloys without crystalline structure. Metallic glasses exhibit unique characteristics, i.e., the absence of translational periodicity and compositional homogeneity. They are usually prepared by rapid solidification during liquid phase. According to Chen [14], the crystallization can be avoided when the cooling rate is high enough, so that the atoms can be frozen in their liquid configuration as the solidification occurs. Unlike conventional metallic materials, metallic glasses do not exist in long-range atomic order, from which endowed some unique and interesting properties, e.g., high strength, elastic limit, toughness, good corrosion resistance, wear resistance and soft magnetic properties [15]. In industry, bulk metallic glasses (BMG) have been used as material for golf club heads, mobile phone casing, scalpels, tennis rackets, high-frequency power coils, and high torque geared motor parts [16,17,18,19]. It is very interesting to investigate how the special inherent structure impacts the acoustic properties of BMG. However, very few studies associated with the acoustic properties were made and most of the mechanical properties were performed by other modalities, most frequently by the tensile tests.
The turbine disk and blades of many small gas turbines, especially small aircrafts, turbo-fan missiles and vehicular engines, are usually cast into a single piece, generally known as integral wheels. There is a considerable variance of loading conditions from blade to disk, i.e., lower temperature and high stress at the hub versus high temperature and low stress at the tip. The materials used to construct the integral wheel must fit in the requirement of both blade and disk. These materials, therefore, must have a very high tensile strength at operating temperature of the hub to protect the parts from bursting, and high creep strength under the blade operating condition. CM247LC is a class of cast nickel-based superalloys with low carbon content, which was investigated by Rajendran et al. [20]. Moore [21] discovered that it is a modified superalloy based on the chemical composition of Mar-M247, specifically designed for producing directionally solidified (DS) turbine blades. The reason for the designated application is that the CM247LC superalloy is exceptionally castable to form an equiaxed grain structure if the casting parameters are well controlled. Therefore, high strength and superior creep resistance can be achieved. The control of the grain size (finer grain is preferred) is crucial for maintaining the required standard of both physical and mechanical properties [22,23].
In spite of the unique granular structure of the above stated materials, rather little research has touched upon the relationship between the acoustic properties and elastic moduli. In this paper the elastic moduli of three brittle materials, namely, ITO (alkaline earth boro-aluminosilicate) glass, BMG, and CM247LC superalloy, are measured by the pulse-echo method and compared to the data obtained from the nanoindentation method. The relationship between the granular structure and acoustic wave propagation and the validation of commonly used formula deriving the elastic moduli will be discussed.
Acoustic attenuation is a measure of the energy loss of sound propagation in media. Most media have viscosity or a certain relaxed nature, i.e., non-ideal media. When sound propagates in such media, there is always thermal consumption of energy caused by viscosity. This is true for most of the materials; however, some are more lossy than others. Acoustic attenuation in a lossy medium plays an important role in many scientific studies and engineering fields, such as medical ultrasonography, vibration and noise reduction. The classical analysis of dissipative acoustic wave propagation involves frequency-independent and frequency-squared dependent attenuation, such as damped wave equation. General power law frequency-dependent acoustic attenuation has also received much attention in recent years. In general, the acoustic attenuation property depends on many factors, e.g., the intrinsic physical properties (thermal conduction…), micro (crystalline) and macro (layered, or matrixed) structures [24,25].
2. Experiments and Methods
Two 40 × 40 × 1.1 mm ITO glass (sample No. 1 and 2), one 10 × 10 × 2 mm Zr-Cu-Ni-Al ((Zr53Cu30Ni9Al8)Si0.5) BMG (sample No. 3) [26] and one Ø 12 × 3.5 mm CM247LC superalloy sample [21] (sample No. 4) were prepared for the measurement. The CM247LC superalloy sample was cut from raw material ingot and polished down by 1.0 m aluminum-oxide powders to avoid any surface oxidation. The density measurement was performed under ASTM D792 (Standard Test Methods for Density and Specific Gravity of Plastics by Displacement) with relative controlled under 0.05%.
The ultrasonic measurements are performed under ASTM standard D2845-08 [27]. The setup is as shown in Figure 1 with Panametrics 5073PR pulse-receiver, GaGe 100 MHz sampling rate 12-bit A/D converter, Olympus M208-RM 0.125-inch 20 MHz longitudinal, and V157-RM 0.125-inch 5 MHz shear transducer. The errors of the A/D conversion are less than 10−7 s in time and 0.2 mV in amplitude. The density is measured by the Archimedes principle from samples of proper sample size as listed in Table 1. The Young’s modulus E, shear modulus G and Poisson ratio υ are calculated as follows [6,7]:
where VT is the transverse acoustic speed, VL is the longitudinal acoustic speed which equals two times thickness divided by round trip transit time, ρ is the density. Attenuation coefficient α, is calculated as follows [5,7,8,28]:
where A0 and A1 are the peak amplitude of the first and second echo signal respectively.
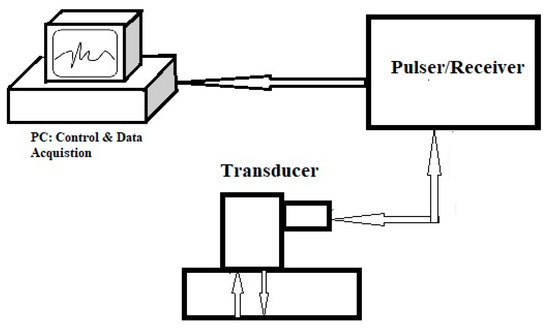
Figure 1.
Experimental setup for ultrasonic measurement.

Table 1.
Size and density of each sample used in the measurements.
The nanoindentation measurement is performed by MTS Nano Indenter XP system capable of Continual Stiffness Measurement (CSM) with software TestWorks as shown in Figure 2. The hardness H is defined as the maximum loading Pmax divided by the normal contact projection area A(hc) i.e., H = Pmax/A(hc), where hc is the depth (displacement) of contact [10]. The relationship between initial unloading stiffness S and reduced Young’s modulus Er can be obtained by
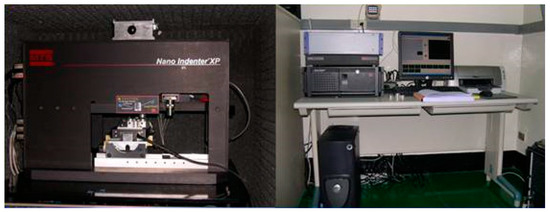
Figure 2.
MTS Nano Indenter XP system.
Metallurgical microscopic photos are also taken from the BMG and CM247LC superalloy samples to explain how the acoustic property is affected by the peculiar microstructure.
3. Results and Discussions
The ultrasonic measurement provides both the longitudinal and shear elastic constants, thus is discussed first for clarity. On the other hand, the nanoindentation measurement can only deliver longitudinal data and is discussed subsequently for comparison. The samples of the three different materials underwent both methods. Three ultrasonic measurements are performed for each sample and the average values are taken. In each measurement, three data points were taken, and the average values were recorded. Shown in Figure 3, Figure 4, Figure 5 and Figure 6 are the of results from the ultrasonic measurement where the horizontal-axis is time (ns) while the vertical-axis is the amplitude of signals (mV). The values of the echo amplitude and arrival time and are read from a cursor provided by the data acquisition software. Once the cursor is moved to the selected point, a pair (time, amplitude) is shown on the screen and recorded. For example, round-trip travel time (Δt = t1 − t2) in Figure 3a is 380 ns for the longitudinal waves. Similarly, the round-trip travel time is calculated as 631 ns for the transverse waves in Figure 3b. The attenuation of acoustic waves is weak so that the echo signals can be easily recognized for glass samples. However, the attenuation of acoustic waves is strong for the CM247LC superalloy sample and the echo signals are more difficult to identify, especially in the case of traverse waves. Proper adjustment of impulse energy was made to make sure no ambiguity in picking up the arrival timings. Examples of the selection of the data points for calculation e.g., t1, t2, A0, and A1 are depicted in the Figures. The average elastic moduli, longitudinal attenuation and Poisson ratios obtained by the ultrasonic measurement are tabulated in Table 2. The variation of data is very low, and the measurement precision is quite good as the mean values of measurement are listed.
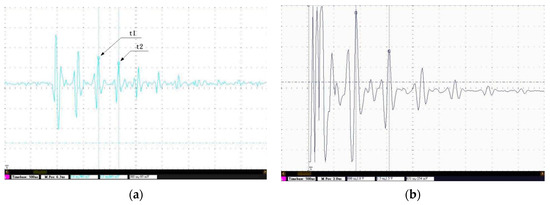
Figure 3.
The ultrasonic pulse-echo signal of the ITO-glass sample #1: (a) Longitudinal; (b) Transverse Wave.
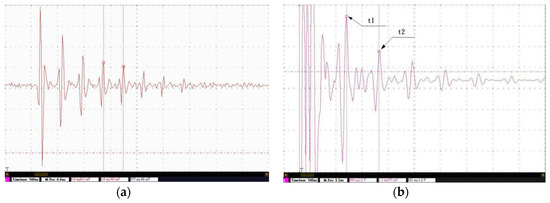
Figure 4.
The ultrasonic pulse-echo signal of the ITO-glass sample #2: (a) Longitudinal; (b) Transverse Wave.
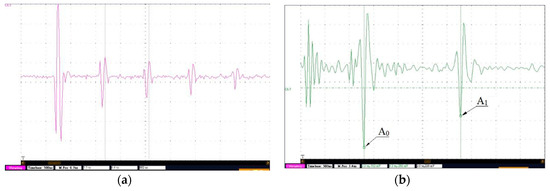
Figure 5.
The ultrasonic pulse-echo signal of the BMG sample: (a) Longitudinal; (b) Transverse Wave.
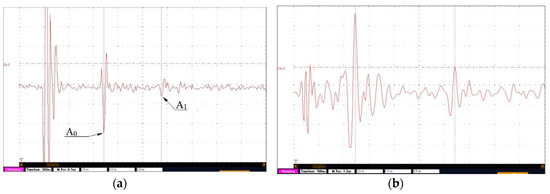
Figure 6.
The ultrasonic pulse-echo signal of the CM247LC superalloy sample: (a) Longitudinal; (b) Transverse Wave.
Table 2.
Ultrasonic measurement results and derived elastic coefficients. Longitudinal and shear attenuation were measured at 20 MHz and 5 MHz respectively.
The Young’s modulus of different common types of glass ranges from 51 (high-lead glass) to 88 GPa (aluminosilicate glass) and 69 GPa for the most commonly used soda-lime glass. The average Young’s moduli measured from the glass samples are respectively 72.52 (max error @1.94) and 72.67 (max error @0.602) GPa, which is consistent with the previous published data. The Poisson ratio of different types of glass ranges from 0.2 to 0.25 according to [29] while a consistent value of 0.22 is obtained in the results. The ultrasonic pulse-echo method performed very satisfactory in measuring the elastic constants of homogeneous and amorphous glass material.
The measured average Young’s modulus and Poisson ratio of BMG samples are 91.90 (max error @0.9) GPa and 0.38. There is no published data related to BMG material with the same Zr-Cu-Ni-Al constitution. The elastic properties of Cu-Zr-Ti BMG was investigated by the electromagnetic acoustic resonance (EMAR) technique [29]. The Young’s modulus and Poisson ratio shown are about 125 GPa and 0.36, which are reasonably close to the values in current study. Furthermore, the amorphous structure of the BMG in this study is slightly different from the poly-crystalline structure BMG in [29].
The measured average Young’s modulus and Poisson ratio of CM247LC superalloy sample are 248.67 (max error @0.6) GPa and 0.26. According to the data published in [20] the Young’s modulus and Poisson ratio of CM247LC-EA superalloy at ambient temperature are 196.7 GPa and 0.15. The discrepancy of the data is substantially at about 25%. Although it may be due to the difference of material and sample preparations, the validity of the ultrasonic data has to be examined by other modality.
The ultrasonic longitudinal attenuation coefficients of the two glass samples are 0.35 and 0.17 dB/mm at 20 MHz. The transversal attenuation coefficients of the two glass samples are 1.1 and 0.91 dB/mm at 5 MHz. As the glass is fully amorphous and homogeneous, the low attenuation is reasonable and predictable. The ultrasonic longitudinal and transversal attenuation coefficients of BMG sample are 0.58 (20 MHz) and 2.79 dB/mm (5 MHz). The longitudinal and transversal attenuation coefficients of the CM247LC superalloy sample are 5.51 dB/mm (20 MHz) and 5.64 dB/mm (5 MHz), respectively. As the material constitution and structure get more complicated the acoustic attenuation is raised accordingly. Notably, the attenuation coefficients of CM247LC superalloy is much higher than normal metals [28,30,31] e.g., steel, homogeneous alloy, … which normally lies within 1 dB/mm. The measured transverse attenuation coefficients follow the same trend. This is a unique property not usually found in commonly used metal and ceramic materials. Current findings of high ultrasonic attenuation are similar to what Wu et al. [32] have reported, at 1.0 dB/mm (15MHz) from the family of Ni3Si intermetallic materials previously.
Three nanoindentation measurements are performed for each sample and the average values are taken. The original (loading-unloading) and deduced loading (P) versus square of displacement (h2) (loading-unloading) diagrams of metallic glass (sample #3) sample in the nanoindentation test are shown in Figure 7 as an example. The elastic coefficient and hardness measured by nanoindentation are calculated with assumed Poisson ratio and tabulated in Table 3.
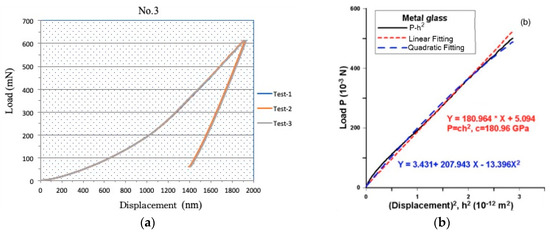
Figure 7.
The (a) original loading-unloading loading vs. displacement and (b) P-h2 relation curve by the nano-indentation measurement from BMG sample.
Table 3.
Elastic coefficient and hardness measured by nanoindentation.
The average Young’s modulus of the four samples from both ultrasonic and nanoindentation are also listed in Table 4 for ease of comparison. The average Young’s moduli measured from the glass samples are 72.58 and 70.57 (max error @1.1) GPa, which is in accordance with the ultrasonic measurement. The average Young’s modulus measured from the BMG is 119.70 (max error @0.1) GPa. Compared to 91.90 GPa from ultrasonic measurement the difference is 23.59%. The Young’s modulus measured from the CM247LC superalloy is 235.68 (max error @0.1) GPa. Compared to 248.67 GPa from ultrasonic measurement the difference is 5.11%. The disparity of the results by the two methods for these two materials is quite substantial. However, the nanoindentation results are closer to previously published data. This indicates that the approach by which the elastic coefficient calculated from acoustic speed has to be cautiously examined.
Table 4.
Comparison of elastic coefficient measured by ultrasonics and nanoindentation.
Different from that of conventional metals the atoms of metallic glasses are “frozen” in a random, disordered structure, rather than arranging themselves into repeating patterns of grains, just like glass. The metallurgical microscopic photo of BMG sample (500×) is shown in Figure 8. In general, it is homogeneous and no well-defined grain boundary can be found, although there are sparse precipitate crystalline phases as indicated in the area enclosed by the red bracket. It may be regarded without question as poly-crystalline or even amorphous depending on the manufacturing process.
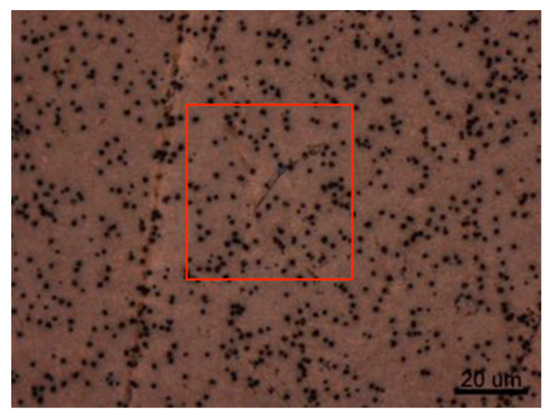
Figure 8.
Metallurgical microscopic photo of BMG sample (500×).
The metallurgical microscopic photo of CM247LC sample (500×) is shown in Figure 9. The dendrite structure can be seen with no pores. It is not refined or directionally solidified so that there is no unified grain growth although columnar grains i.e., polycrystalline [23] may exist in different directions with strong matrix gain boundary with carbide and γ–γ’ eutectic phase as indicated in the area enclosed by the red bracket. One common trait for both materials is the disordered structure and broken grain boundary.
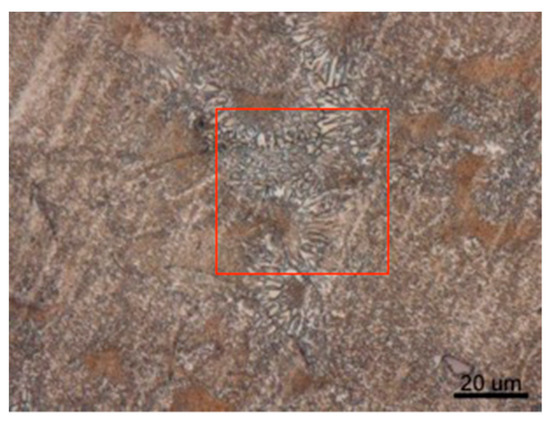
Figure 9.
Metallurgical microscopic photo of CM247LC superalloy sample (500×).
Majumdar et al. [33] compared ultrasonics with the nanoindentation method on titanium alloy material and concluded that elastic modulus can be measured more accurately by the ultrasonic method. The reason cited by them is that the accuracy of elastic modulus measurement using nanoindentation technique depends on more issues while ultrasonic method is directly related to the elastic property and density of the material. Both methods have some potential sources of errors. Factors that can lead to misleading results of nanoindentation include frame compliance, area function, tip sharpness, piling-up, unloading analysis, and specimen Poisson’s ratio [10,11]. However, determination of the elastic modulli matrix is rather complicated for non-homogeneous and anisotropic materials by ultrasonic method. For the homogeneous material such as amorphous glass, we can use simple elastic constant-acoustic velocity relationship to get consistent results with nanoindentaion if care is taken during measurements as in samples 1 and 2. However, the metallic glass and CM247LC materials are partially anisotropic (or poly-crystalline) materials as aforementioned in the Introduction section. The elastic constant matrices are material dependent and difficult to determine. Acoustic mode transformation (longitudinal-transversal and vice versa) is prominent and even more complicated than pure metallic materials with regular domain structure [9]. Direct comparisons between both methods are difficult. This may be the main cause for the discrepancy between the data from the two methods. Up until now, there was a lack of similar intermetallic data to be found for comparison. The velocity dispersion of these materials may contribute to some degree, but not enough to bring up 5 even 20% difference.
Another factor related to the acoustic velocity-elastic constant relationship is acoustic dispersion which is discussed in polymer, porous, layered, materials, and sea water with sediment. Acoustic dispersion is the phenomenon of a sound wave decomposed into different frequency components as it passes through a medium. The phase velocity of the sound wave can be viewed as a function of frequency. Hence, frequency components are measured by the rate of change in phase velocities as the radiated waves progress. In general, velocity dispersion can hardly be observed unless enough broadband measurement is taken to cover frequency components at both ends of spectrum, usually in the range of 100 MHz. For the frequency applied at 5 and MHz transducer, effect of velocity dispersion is supposed to be insignificant.
The attenuation of ultrasonic wave in solids may be attributed to a number of physical mechanisms within the propagating media. Although the exact nature of the cause of the attenuation may not always be fully understood, however, the possible causes of attenuation in the solid materials under study may be: loss due to thermoelastic relaxation, electron phonon interaction, phonon phonon interaction, magnon-phonon interaction, lattice imperfections, grain boundary losses, and Bardoni relaxation and internal friction [5,34]. Lattice imperfections and grain boundary losses are the characteristics of the metallic glass and CM247LC materials in addition inherent thermoelastic relaxation, although there is a lack research on the rest of the causes to be referred to. Of the few previous studies on the similar structure superalloy, Wu et al. [32] reported that the Ni3Si superalloy compound in L12 ordered face-centered cubic (fcc) structure has high acoustic attenuation. They are similar in serious dislocation and discontinued granular boundary due to in situ beta phase precipitation which is a good supporting validation for the current finding.
4. Conclusions
The ultrasonic method provides a convenient and nondestructive modality to measure mechanical properties of brittle materials. However, the acoustic property may vary with target material, especially the compound materials. The following can be concluded based on the results from the current study.
For amorphous glasses, the ultrasonic pulse-echo method is very accurate in measurement of elastic constants. The resulting data matches well with nanoindentation. This is due to the fact that the glass material is isotropic and slightly dispersive. The calculation for elastic constant is uncomplicated.
CM247LC superalloy (and other intermetallic alike) is a material of high acoustic attenuation. The reason may be due to strong grain boundary losses and lattice imperfections caused by the inherent strong matrix gain boundary with carbide and γ–γ’ eutectic phase. This family of materials is strongly viscoelastic.
For both BMG and CM247LC superalloys, the ultrasonic pulse-echo method deviates significantly from nanoindentation. The difference is large enough to cover the maximal error associated with the nanoindentation method. The relationship of acoustic speed and elastic constants must be reviewed in dealing with compound materials.
Author Contributions
Data curation, H.L.; Formal analysis, P.-C.C. and H.L.; Investigation, S.-J.W. and P.-C.C.; Methodology, S.-J.W.; Software, S.-J.W., P.-C.C. and H.L.; Writing—original draft, S.-J.W.; Writing—review & editing, P.-C.C.
Funding
This research received no external funding.
Conflicts of Interest
The authors declare no conflict of interest.
References
- ASTM E111-07. Standard Test Method for Young’s Modulus, Tangent Modulus, and Chord Modulus. Available online: https://www.astm.org/Standards/E111.htm (accessed on 19 December 2018).
- Wiederhorn, S.; Fields, R.; Law, S.; Gunwoong, B. Mechanical Properties. In Springer Handbook of Materials Measurement Methods; Czichos, H., Saito, T., Smith, L., Eds.; Springer Handbooks: Berlin/Heidelberg, Germany, 2006. [Google Scholar]
- Migliori, A.; Sarrao, J.L.; Visscher, W.M.; Bell, T.M.; Lei, M.; Fisk, Z.; Leisure, R.G. Resonant ultrasound spectroscopic techniques for measurement of the elastic moduli of solids. Phys. B 1993, 183, 1–24. [Google Scholar] [CrossRef]
- McIntire, P. Ultrasonic testing. In Non-Destructive Testing Handbook, 2nd ed.; American Society for Nondestructive Testing: Columbus, OH, USA, 1991; Volume 7. [Google Scholar]
- Pandey, D.; Pandey, S. Ultrasonics: A Technique of Material Characterization. In Acoustic Waves; Dissanayake, D.W., Ed.; IntechOpen: London, UK, 2010. [Google Scholar]
- Kino, G.S. Acoustic Waves. In Devices, Imaging, and Analog Signal Processing; Prentice Hall: Upper Saddle River, NJ, USA, 1986. [Google Scholar]
- Kinsler, L.E.; Frey, A.R.; Coppens, A.B.; Sanders, J.V. Fundamentals of Acoustics, 4th ed.; John Wiley & Sons: Hoboken, NJ, USA, 2000. [Google Scholar]
- Auld, B.A. Acoustic Fields and Waves in Solids; John Wiley & Sons: Hoboken, NJ, USA, 1990. [Google Scholar]
- Bouhadjera, A. A Mode Conversion Method for Evaluating Elastic Properties of Materials. Insight Non-Destr. Test. Cond. Monit. 1996, 38, 732–736. [Google Scholar]
- Oliver, W.C.; Phar, G.M. Measurement of hardness and elastic modulus by instrumented indentation: Advances in understanding and refinements to methodology. J. Mater. Res. 2004, 9, 3–20. [Google Scholar] [CrossRef]
- Fischer-Cripps, A.C. Nano-Indentation, 3rd ed.; Springer: Berlin/Heidelberg, Germany, 2011. [Google Scholar]
- Dao, M.; Chollacoop, N.K.; Van Vliet, J.; Venkatesh, T.A.; Suresh, S. Computational modeling of the forward and reverse problems in instrumented sharp indentation. Acta Mater. 2001, 49, 3899–3918. [Google Scholar] [CrossRef]
- Cheng, Y.T.; Cheng, C.M. Scaling approach to conical indentation in elastic-plastic solids with work hardening. J. Appl. Phys. 1998, 84, 1284–1291. [Google Scholar] [CrossRef]
- Chen, H.S. Metallic Glasses. Chin. J. Phys. 1990, 28, 407–425. [Google Scholar]
- Inoue, A.; Wang, X.M.; Zhang, W. Developments and Applications of Metallic Glasses. Rev. Adv. Mat. Sci. 2008, 18, 1–9. [Google Scholar]
- Wang, X. Formation of Metallic Glasses Near Intermetallics in Zr-Cu and Zr-Cu-Ti Systems. Ph.D. Thesis, Singapore University, Singapore, 2012. [Google Scholar]
- Morgana, M.T.; Thadhani, N.N. Mechanical Properties of Bulk Metallic Glasses. Prog. Mater. Sci. 2010, 55, 759–839. [Google Scholar]
- Dimitri, V.L.; Louzguina-Luzgina, L.V.; Churyumov, A.Y. Mechanical Properties and Deformation Behavior of Bulk Metallic Glasses. Metals 2013, 3, 1–22. [Google Scholar]
- Zhang, W.; Inoue, A. Synthesis, thermal stability and mechanical properties of Cu-based bulk glassy alloys. World Bulk Met. Glass. Compos. 2007, 201–230. [Google Scholar]
- Rajendran, R.; Petley, V.; Rehmer, B. Dynamic elastic properties of aero-enginemetallic isotropic materials. Part L J. Mater. Des. Appl. 2012, 227, 243–249. [Google Scholar]
- Moore, Z.J. Life Modeling of Notched Cm247lc Ds Nickel-Base Superalloy. Master’s Thesis, Georgia Institute of Technology, Atlanta, GA, USA, 2008. [Google Scholar]
- Huang, H.E.; Koo, C.H. Effect of Zirconium on Microstructure and Mechanical Properties of Cast Fine-Grain CM 247 LC Superalloy. Mater. Trans. 2004, 45, 554–561. [Google Scholar] [CrossRef]
- Huang, H.E.; Koo, C.H. Characteristics and Mechanical Properties of Polycrystalline CM 247 LC Superalloy Casting. Mater. Trans. 2004, 45, 562–568. [Google Scholar] [CrossRef]
- Meyers, M.A.; Chawla, K.K. Mechanical Behavior of Materials; Cambridge University Press: Cambridge, MA, USA, 2009; pp. 98–103. [Google Scholar]
- Szabo, T.L.; Wu, J. A model for longitudinal and shear wave propagation in viscoelastic media. J. Acoust. Soc. Am. 2000, 107, 2437–2446. [Google Scholar] [CrossRef] [PubMed]
- Wang, H.S.; Sua, Y.Z.; Jang, S.C.; Chen, H.G. A comparison of crystallization behaviors of laser spot welded Zr–Cu–Ag–Al and Zr–Cu–Ni–Al bulk metallic glasses. Mater. Chem. Phys. 2013, 139, 215–219. [Google Scholar] [CrossRef]
- ASTM D2845-08. Standard Test Method for Laboratory Determination of Pulse Velocities and Ultrasonic Elastic Constants of Rock (Withdrawn 2017); ASTM International: West Conshohocken, PA, USA, 2008. [Google Scholar]
- Smith, R.L.; Reynolds, W.N.; Wadley HN, G. Ultrasonic attenuation and microstructure in low-carbon steels. Metal Sci. 1981, 15, 554–558. [Google Scholar] [CrossRef]
- Kannappan, A.N.; Thirumaran, S.; Palani, R. Elastic and Mechanical Properties of Glass Specimen by Ultrasonic Method. ARPN J. Eng. Appl. Sci. 2009, 4, 27–31. [Google Scholar]
- Ali, M.G.S.; Elsayed, N.Z.; Eid, A.M. Ultrasonic Attenuation and Velocity in Steel Standard Reference Blocks. RJAV 2013, 10, 33–38. [Google Scholar]
- Moysan, J.; Gueudré, C.; Ploix, M.A.; Corneloup, G.; Guy, P.; Guerjouma, R.E.; Chassignole, B. Advances in ultrasonic testing of austenitic stainless steel welds. Towards a 3D description of the material including attenuation and optimisation by inversion. In Ultrasonic Wave Propagation in Non Homogeneous Media, Springer Proceedings in Physics; Leger, A., Deschamps, M., Eds.; Springer: Berlin/Heidelberg, Germany, 2009; 128p. [Google Scholar]
- Wu, S.J.; Jang, S.C.; Kuo, C.M.; Lin, D.Y.; Ting, C.C. Acoustic Properties of NI3SI Intermetallic Materials. In EPD Congress 2005; Schlesinger, M.E., Ed.; The Minerals, Metals & Materials Society: Pittsburgh, PA, USA, 2005; pp. 145–148. [Google Scholar]
- Majumdar, P.; Singh, S.B.; Chakraborty, M. Elastic modulus of biomedical titanium alloys by nano-indentation and ultrasonic techniques—A comparative study. Mater. Sci. Eng. A 2008, 489, 419–425. [Google Scholar] [CrossRef]
- Li, W.; Chen, B.; Qing, X.; Cho, Y. Characterization of Microstructural Evolution by Ultrasonic Nonlinear Parameters Adjusted by Attenuation Factor. Metals 2019, 9, 271. [Google Scholar] [CrossRef]


© 2019 by the authors. Licensee MDPI, Basel, Switzerland. This article is an open access article distributed under the terms and conditions of the Creative Commons Attribution (CC BY) license (http://creativecommons.org/licenses/by/4.0/).