Article

Advances in Spectral Distribution Assessment of Laser Accelerated Protons using Multilayer CR-39 Detectors

1
Low Temperature Plasma Department, National Institute for Laser, Plasma and Radiation Physics (INFLPR), Magurele 077125, Romania
2
Centre for Advanced Laser Technology (CETAL-PW), National Institute for Laser, Plasma and Radiation Physics, Magurele 077125, Romania
3
STARDOOR Department, National Institute for Laser, Plasma and Radiation Physics, Magurele 077125, Romania
4
Horia Hulubei National Institute for R&D in Physics and Nuclear Engineering, Magurele 077125, Romania
5
Nano-SAE Research Centre, Faculty of Physics, University of Bucharest, Magurele 077125, Romania
6
Department of Nuclear Physics, Faculty of Physics, University of Bucharest, Magurele 077125, Romania
7
Doctoral School in Physics, Faculty of Physics, University of Bucharest, Magurele 077125, Romania
8
Faculty of Electronics, Politehnica University of Bucharest (UPB), Bucharest 060042, Romania
*
Author to whom correspondence should be addressed.
Appl. Sci. 2019, 9(10), 2052; https://doi.org/10.3390/app9102052
Submission received: 5 April 2019 / Revised: 15 May 2019 / Accepted: 16 May 2019 / Published: 18 May 2019
(This article belongs to the Special Issue Laser Acceleration Technology and Applications)

Abstract

:
We show that a spectral distribution of laser-accelerated protons can be extracted by analyzing the proton track diameters observed on the front side of a second CR-39 detector arranged in a stack. The correspondence between the proton track diameter and the incident energy on the second detector is established by knowing that protons with energies only higher than 10.5 MeV can fully deposit their energy in the second CR-39 detector. The correlation between the laser-accelerated proton track diameters observed on the front side of the second CR-39 detector and the proton incident energy on the detector stack is also presented. By calculating the proton number stopped in the CR-39 stack, we find out that its dependence on the proton energy in the 1–15 MeV range presents some discontinuities at energies higher than 9 MeV. Thus, we build a calibration curve of the track diameter as a function of the proton incident energy within the 1–9 MeV range, and we infer the associated analytical function as the calculations performed indicate best results for proton spectra within the 1–9 MeV range. The calibration curve is used as a tool to ascertain the pits identified on the surfaces of both CR-39 detectors to proton tracks. The proton tracks spatial distribution analyzed by optical and atomic force microscopy is correlated with the peculiarity of the used targets.

1. Introduction

Proton acceleration up to energies of tens of MeV using high intensity laser pulses (I >1018 W/cm2) that interact with thin solid targets has been an issue of considerable interest over the last two decades, both experimentally and theoretically [1,2,3,4,5,6]. Most studies on laser-driven proton acceleration were performed under experimental conditions which are characteristic of the so-called Target Normal Sheath Acceleration (TNSA) mechanism. TNSA represents the main rear surface ion acceleration regime, where femtosecond laser pulses with intensities higher than 1018 W/cm2 interact with thin solid targets, which are a few microns thick [1,2]. As the laser pre-pulse interacts with the solid target, a pre-plasma is generated at the front target surface, shortly before the main pulse arrival. The electrons generated at the front side of the solid target foil, as an outcome of the main laser pulse interaction with the pre-plasma, absorb a percentage of the laser energy. These hot electrons, characterized by a mean free path larger than the target thickness, are transported through the target and then reach its rear surface where they generate a dense electron sheath. Following the expansion of this electron sheath an electric field of TV/m magnitude occurs, normal to the target surface. Due to this strong electric field the water and organic molecules contained within the adsorbed surface contaminants present at the rear side of the target can get dissociated and ionized. The protons generated by such mechanism are accelerated in a direction normal to the target [1,2].
The analysis of proton beams characteristics and of the associated energy distribution is usually performed with radiochromic films or solid-state nuclear track detectors, most often coupled with Thomson Parabola spectrometers [3,4]. The CR-39 nuclear track detector [polyallyl-diglycol-carbonate (PADC), C12H18O7], has demonstrated its capabilities to detect protons as it is insensitive to electromagnetic noise [3,7,8], while showing high uniformity and high sensitivity to ions, as well as excellent etching properties. As reported in [3], once the laser accelerated protons are analyzed by means of CR-39 detectors, the output data can be used to characterize accelerated ion beams without requiring an additional spectrometer.
A high energy charged particle (for example a proton) travelling through a CR-39 detector loses energy along its trajectory in matter by electronic collisions, by scattering, then stops when it has completely deposed its energy into the detector material, according to the Bragg curve. The point where the proton entirely deposes its energy as ionizing radiation and comes to rest is known as the Bragg peak [7,9]. It is assumed [3] that a proton leaves a track in matter when it has totally deposed its energy. As the stopping power scaling law of charged particles in matter is dE/dx ~1/E, the track diameter can be related to the proton energy [10]. Thus, as the proton energy increases the track diameter decreases.
The geometrical characteristics of the damaged zone left by the proton into the detector can be investigated by means of optical and atomic force microscopy after etching the plastic detector in very well-defined conditions of time, temperature, and concentrations of etching solution [3]. Recent literature in the field [2,4] emphasizes the advantages of using radiochromic films to reveal proton densities higher than 107 particles/cm2. Proton beams with lower densities can be detected using solid-state nuclear track detectors [7,11,12].
With respect to late experimental results in the field [3,7,13,14], our paper brings a new approach on the spectral characterization of laser accelerated protons with energies higher than 10.5 MeV extracted from the front side of a second CR-39 detector (arranged in a stack of 2 CR-39 detectors). Protons with energies higher than 10.5 MeV do not leave observable traces on the front side of the first 1 mm thick CR-39 detector [3,7]. Therefore, we extracted and characterized the spectral energy distribution of laser-accelerated protons (with energies higher than 10 MeV) that leave their tracks on the front side of the second detector of the stack. Previously, stacks of two or three CR-39 detectors were used to estimate the proton maximum energy or to analyze spectral distribution of tracks found on the detector surface [3,14].
Moreover, we characterize the spectral energy distribution of laser-accelerated proton beams by investigating the tracks they leave in CR-39 detectors on the front side of the second detector of the stack. The number of protons as a function of proton energy is also established after the analysis of the front side of the first detector in the stack. Protons result as an outcome of the interaction mechanism between high-power laser pulses and Al or Ag targets (5 and 10 μm thick). The targets synthesized by magnetron sputtering technique present peculiar kind of periodical structures on their surfaces.
A detection stack composed of two CR-39 detectors (1 mm thick each) covered with a 10 μm Al foil was used. The experimental set-up is uniquely designed in a compact manner as it connects the target holder with the detector holder, and the laser spot optical analysis system.
CR-39 detectors irradiated with monoenergetic proton beams of different energies, and dedicated numerical codes, were used to achieve energy calibration of the proton tracks observed on the front side of a 1 mm CR-39 detector slab. Proton tracks characteristics are investigated by means of visible light microscopy and atomic force microscopy (AFM). By correlating the experimental observations with the theoretical calculations performed for 1 mm thick CR-39 detector, the surface images obtained on the front side of the second post-etched CR-39 detector allow us to estimate the energy distribution of the protons stopped in the second slab of CR-39 detector as a function of the proton track diameter.

2. Materials and Methods

The experiments were performed using the PW class laser system from the CETAL-PW laboratory [15,16,17,18]. The 40 fs laser pulse with a diameter of about 200 mm is focused on the target at 45° incidence angle with respect to the target normal, using an off-axis parabolic mirror with a focal length of 400 mm. The laser parameters at focus are: laser energy 8 J, laser spot surface area 207(9 × 23) μm2, and laser intensity of about 5 × 10¹⁹ W/cm2. The contrast ratio (prepulse domain pulse ratio) value is around 10−8. The full width at half maximum (FWHM) of the spot contains ~ 30% of the laser energy.
The experimental set-up used in these experiments to analyze the laser spot profile and the proton beams produced by high-power laser-target interaction is original, as shown in Figure 1a. It consists of a target and detector holder ensemble, and an optical analysis ensemble. The target and detector holder system contains translation and rotation mechanical stages for precise alignment of the target in the laser focus. The optical analysis system employed to investigate the laser beam focal spot, shown in Figure 1a, is placed in front of the target holder system. The target and detector holder system consists of two parallel metallic plates (with a diameter of 200 mm), as illustrated in Figure 1a. The first plate holds the targets, where the distance between the centers of two adjacent targets is around 20 mm. The second plate holds the CR-39 plastic detectors (13 × 37 × 1 mm3, purchased from Track Analysis System Ltd (Bristol, UK)), located at 3 cm distance behind the first plate. The detectors are centered relative to the targets position. Both plates are rotated simultaneously by means of an electronically driven mechanical stage, thus avoiding any misalignment between targets and detectors. The target and detector holder ensemble is tightly fixed on mechanical translation stages, to achieve a precise x-y-z alignment in the focus of the laser beam. The optical analysis system located in front of the target and detector holder ensemble consists of an optical microscope coupled with a Basler Charge-Coupled Device (CCD) optical camera, with a resolution of 0.976 µm/pixel. The CCD camera was placed in a sealed metallic cylinder at atmospheric pressure, allowing us to perform direct and continuous observation of the laser beam spot profile on target, under high vacuum conditions. As illustrated in Figure 1b,c, the system is used both for laser beam focal point profile analysis (see Figure 1b) and to visualize the laser spot reflected light on the target surface (see Figure 1c). Thus, the influence of the target surface morphology on the laser spot profile can be investigated. The target and detector holder ensemble, together with the laser spot analysis ensemble make up a compact system which exhibits significant advantages: lack of misalignments between targets and detectors; direct and front side visualization of the laser spot with high accuracy (1.25 µm/full step of rotation stage), prior to each laser-target interaction.
Our paper reports for the first time on a system that couples in a compact manner the target positioning system with the detection holder ensemble, and the optical analysis system. Previous work [19] only reports on a wheel system for the automated positioning of targets in the focal point of a high-power laser beam.
Using the magnetron sputtering technique, target foils of Al and Ag with 5 and 10 µm thickness were prepared. The morphological surface features of a 5 µm thick Ag target investigated by scanning electron microscopy are shown in Figure 1d.
In order to diagnose the proton beams produced as a result of the laser beam interaction with solid targets, a stack of 2 CR-39 detectors of 1 mm thickness covered with a 10 μm Al foil was used. The Al foil shields the detector surface against interaction with protons and ions of low energies.

3. Results and Discussion

3.1. Calibration of CR-39 detectors

The CR-39 nuclear track detectors are frequently used to detect and characterize charged particles such as protons, alpha particles or neutrons [9,20]. The analysis of laser-accelerated proton beams by means of CR-39 detectors was demonstrated [3,7] to represent a powerful tool, as the shape and size of a track left by each proton into the detector can give useful information about their energy and incident angle.
The region damaged by the protons can be revealed after the chemical etching of the detector. Thus, depending on the etching conditions like: etching solution concentration, etching time and temperature, the proton tracks can be enlarged and made visible through optical microscopy [7,9]. The region damaged by protons stopped into the detector is more chemically active than the surrounding protons unaffected zone [7,9].
A proton that hits the detector slab at normal incident angle will leave a circular track. An oblique incidence angle between the proton and the detector surface implies an elliptic shape of the track and the major axis will be larger than the minor axis.
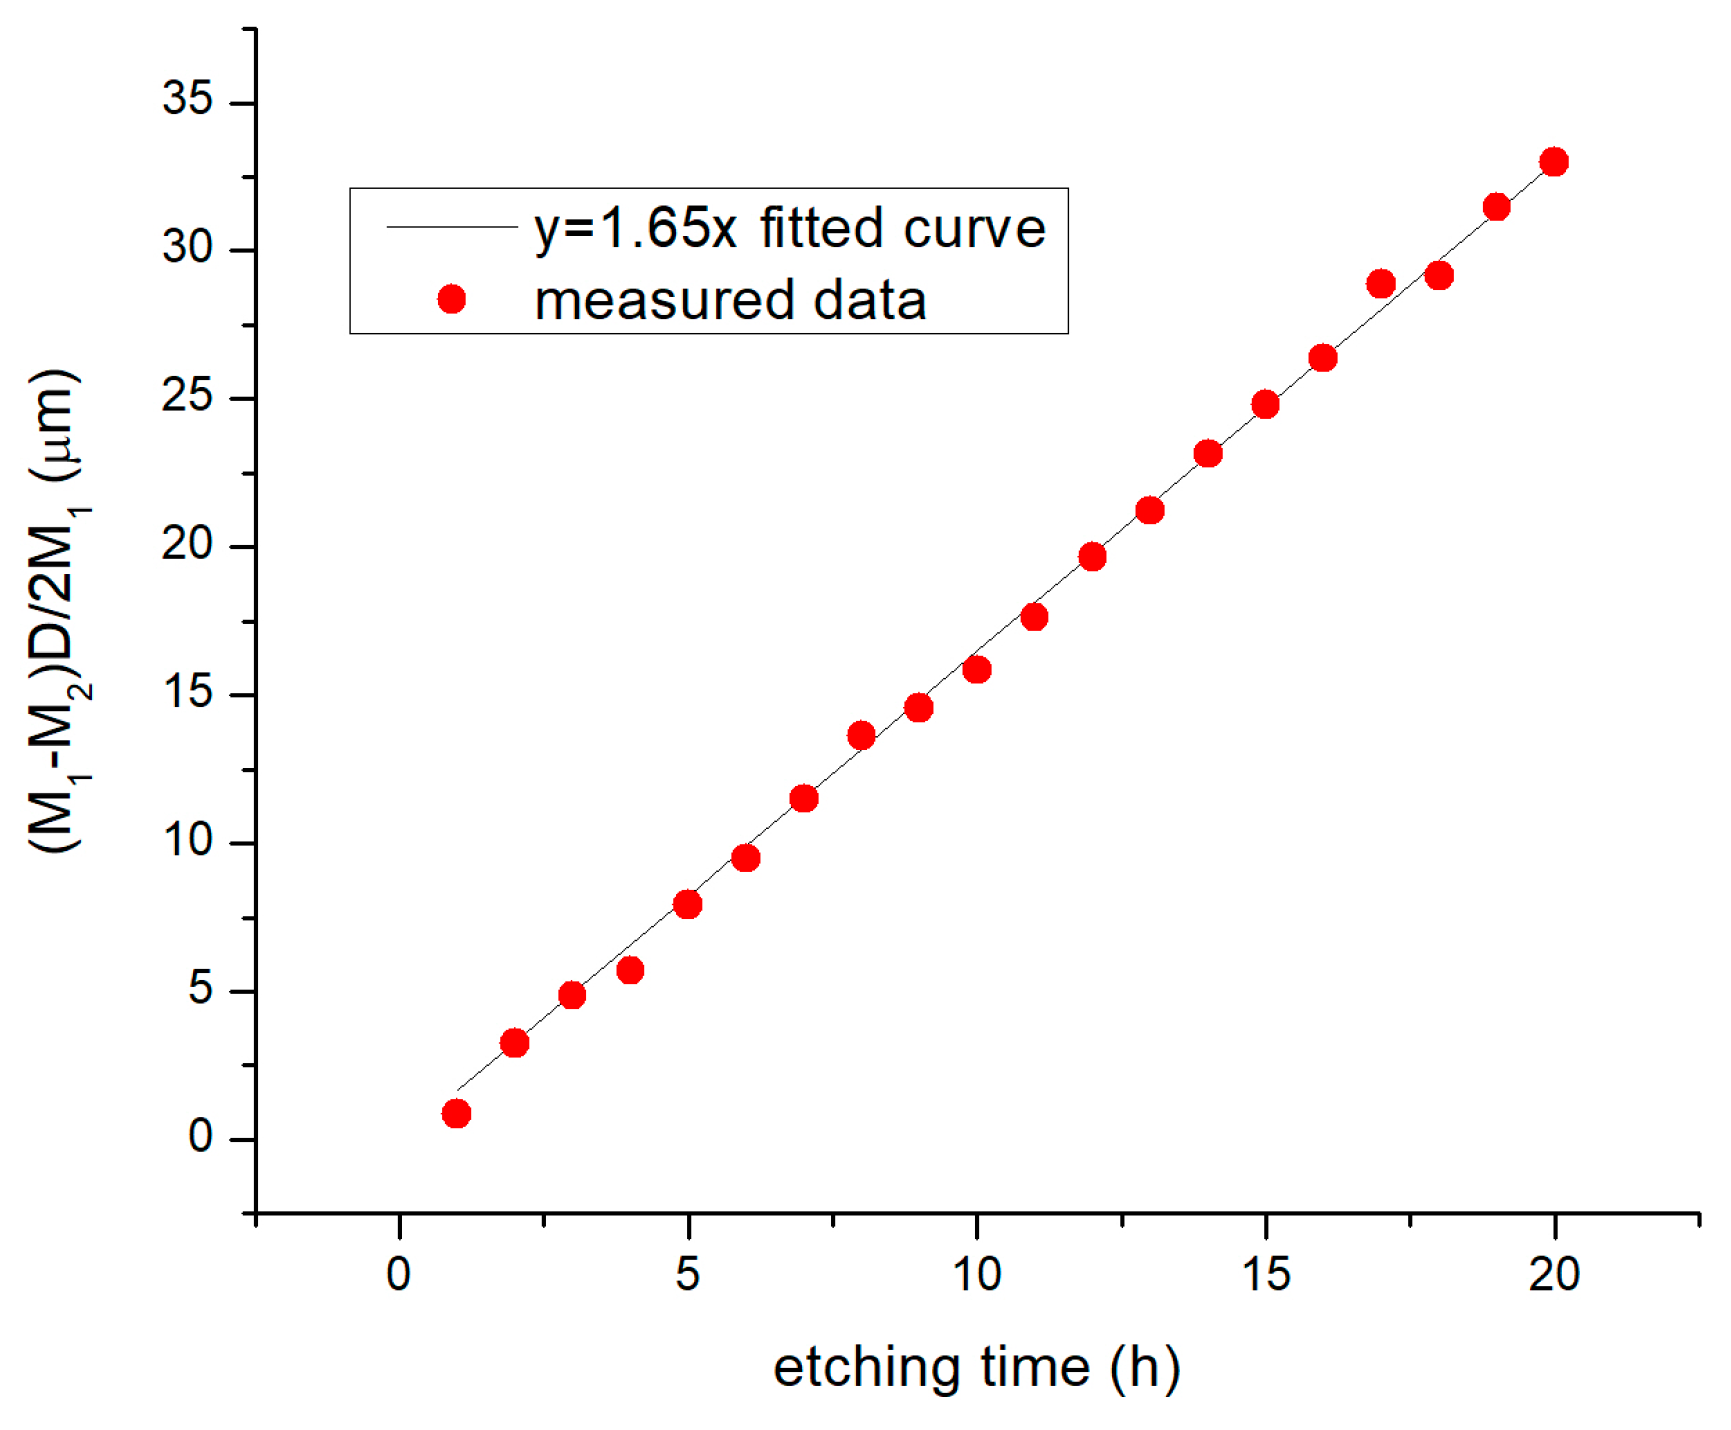
The first step in calibrating the CR-39 detectors consists in finding the material bulk etch rate, under very well-defined chemical and temperature conditions. The bulk etch rate of a CR-39 nuclear track detector is usually calculated both experimentally and theoretically. We used the weight loss method to calculate the bulk etch rate experimentally [21]. Several samples of CR-39 detectors were etched in 6.25 N NaOH solution at 70 °C, for different time intervals. The detector weights were measured before and after etching. Then, the bulk etch rate vb is determined using the following relation [21]:
(M1 − M2)D/2M1 = vb t
where M1 represents the initial detector weight, M2 is the detector weight after chemical etching, while D stands for the initial thickness of the detector, and t is the etching time. The detectors weight was measured using an electronic balance, with a sensitivity of around 10−4 g. The thickness of each detector was measured by means of an electronic device with an accuracy of 0.01 mm.
Figure 2 shows a graphical representation of equation 1, which results from measurements (red points). By linear fitting (black line) of these experimental data with the analytical function y = ax (a = 1.65), the bulk etch rate of the CR-39 detectors was determined. A bulk etch rate of 1.65 ± 0.05 µm/h over an etching time of 20 h was calculated (see Figure 2).
Monoenergetic proton beams, produced in the TANDEM accelerator at the Horia Hulubei National Institute for R&D in Physics and Nuclear Engineering (http://www.nipne.ro), were used to calibrate the CR-39 detectors with an aim to find a relation between the incident energy of the proton beam on a CR-39 detector, and the diameter of the proton tracks revealed after chemical etching. The CR-39 plastic nuclear track detectors were exposed to different proton energies, for beam fluencies of around 70,000 particles/cm2. The proton beam energy dispersion at the TANDEM facility is ± 5.5 keV. The diameter of the proton beam spot is 7 mm, and the irradiation time value is about 1 s. The particles were normally incident to the surface of the plastic sheet. The particle beam fluency value was specially chosen to avoid overlapping of the proton tracks on the CR-39 detector during the optical microscopy analysis after chemical etching. Reference [7] shows that proton beams with fluencies in the range of 105 particles/cm2 are suited for counting proton beam tracks by visible light microscopy, avoiding any difficulties owing to track overlapping.
After irradiation, the CR-39 samples were chemically etched using a 6.25 N NaOH solution at 70 °C for 6 hours in an etching bath container under conditions of fine temperature control. The temperature shift during the etching time was about 1 °C. After chemical etching all detectors are washed in distilled water. The diameters of the proton tracks on the post etched CR-39 detectors were analyzed by means of a EUROMEX IS.1053- PLPOLRi polarized microscope (Euromex Microscopen BV, Arnhem, Netherlands), fitted with a CMEX-5000 USB-2 DIGITAL CAMERA -EUROMEX DC.5000 (Euromex Microscopen BV, Arnhem, Netherlands).
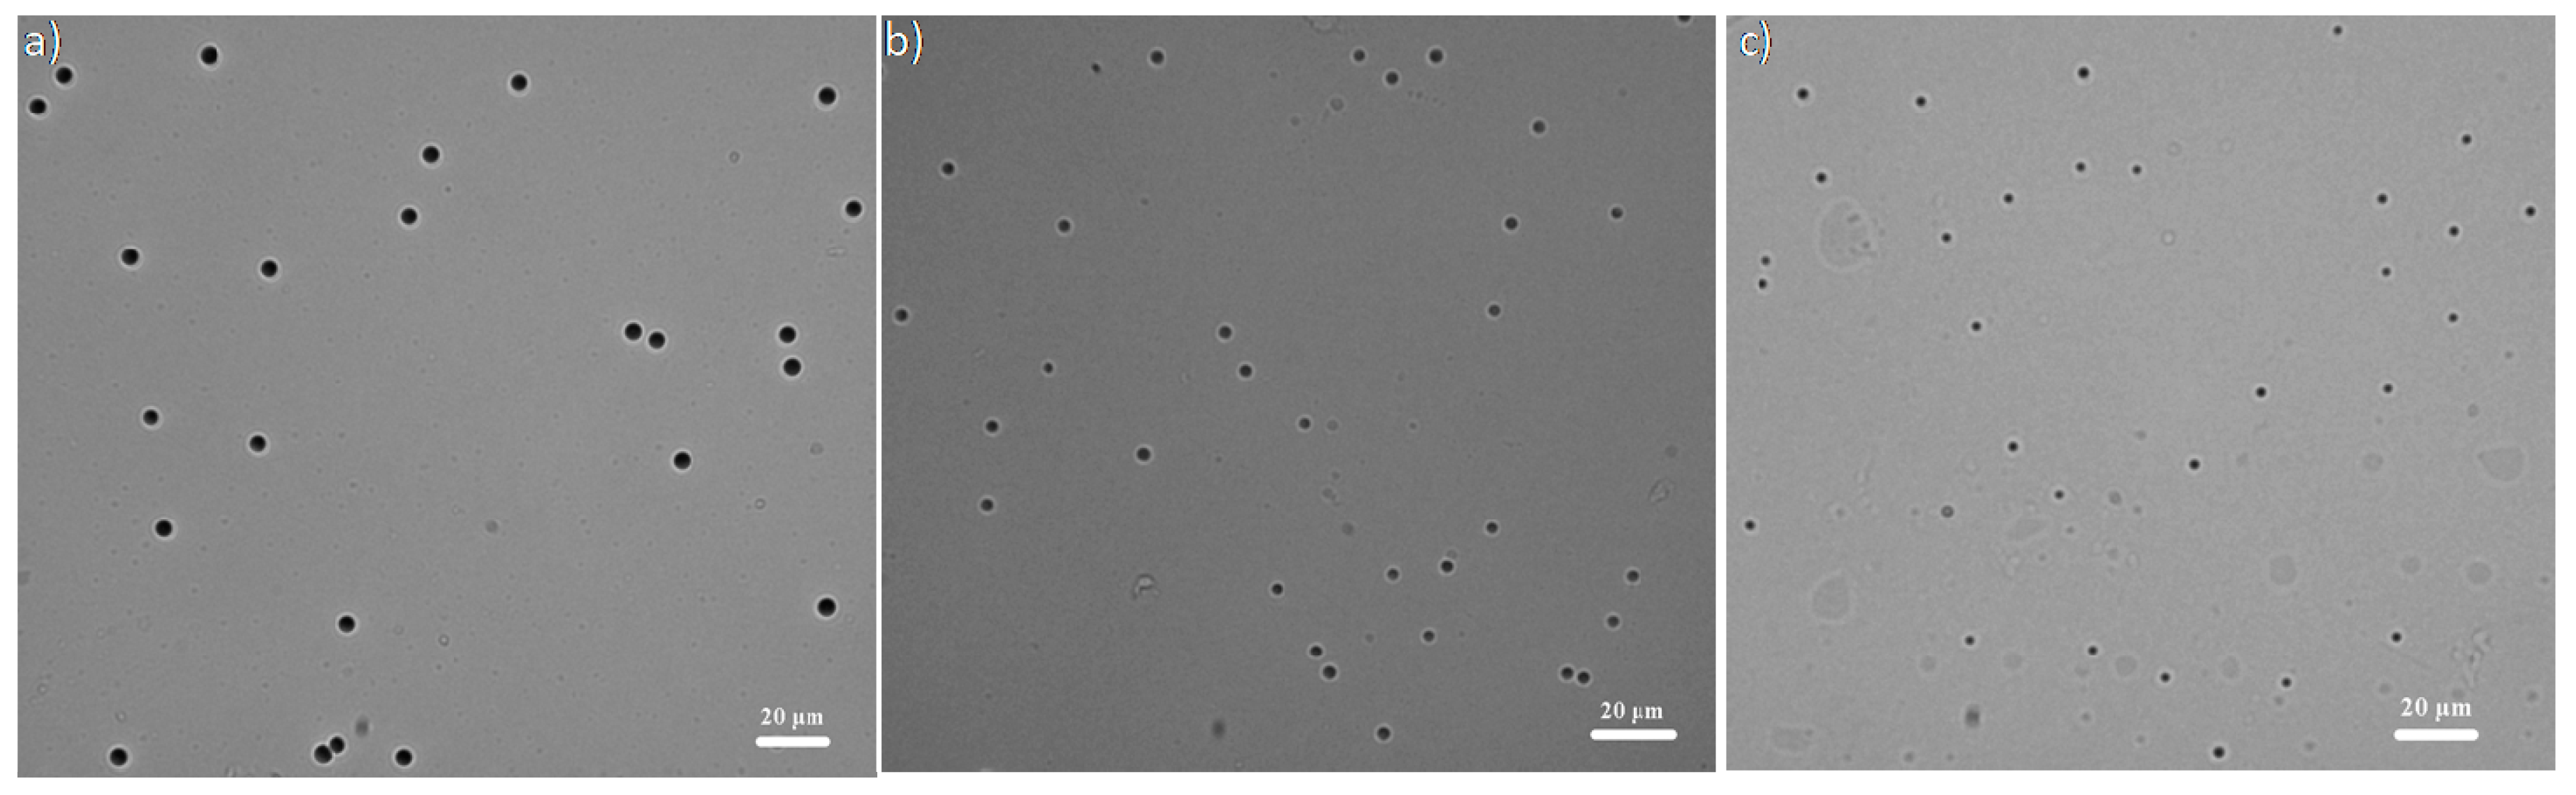
Figure 3 show the images of the tracks left by protons within the detector, for proton energies of 2, 3 and 5 MeV. The corresponding measured track diameters of the protons are 5.5 µm, 4.5 µm and 3 µm, respectively. Besides circular proton tracks, in Figure 3a–c, some traces with irregular shapes and sizes attributed to the chemical etching of the detector material unmarked by protons, can be observed. Similar values for the proton track diameters are obtained after the analysis of the post-etched CR-39 detectors using atomic force microscopy.
The data that connect the proton track diameters with respect to the proton beam energies, are in good agreement with those reported by Malinowska et al. [8], in case of CR-39 detectors etched in 6.25 N NaOH solution at 70 °C, for different etching times. Figure 3 from Reference [8] presents the proton track diameters and the stopping power evolution in CR-39 detectors, as a function of the incident energy and etching time. By extrapolating these data, the proton track diameter values for 6 h etching time are shown to be ~6.8 µm, 5 µm, 4 µm, 3.5 µm and 3 µm, for proton incident energies of 1, 2, 3, 4 and 5 MeV, respectively. Figure 3 in [8] also shows that within the 1–6 MeV energy range, the proton track diameter decreases following the evolution of the stopping power as a function of energy.
Recently, Reference [22] reported on a computer software, TRACK-P, used to compute the proton range and the proton track diameters in a post-etch CR-39 detector, as a function of: the incident proton energy, the bulk etch rate of the detector material, the incident angle of the protons on the detector, and the chemical etching time. It also computes the proton range using the SRIM 2003 software [23]. For a bulk etch rate of 1.65 µm/h, and proton energies of 1, 2, 3, 4 and 5 MeV, for a 6 h etching time value and a 90° proton incident angle, the proton track diameters computed with TRACK-P are found to be 9.4 µm, 7 µm, 5.7 µm, 4.5 µm and 3.2 µm, respectively. By using the SRIM code of Ziegler et. al. [23] to calculate the energy loss dE/dx (keV/µm) of protons with energies up to 15 MeV into the detector stack, we find the proton range, as illustrated in Figure 4a (black line). Protons with energy ranging between 1.1–10.4 MeV are stopped in the first CR-39 detector, while protons with energies between 10.5–14.8 MeV are stopped within the second CR-39 detector.
The proton range can also be computed using the TRACK-P software, but only for 1 mm thick CR-39 detectors and maximum incident proton energy up to 11 MeV [22]. The results on the proton range calculated with the TRACK-P software using as input data a bulk etch rate of 1.65 µm/h, a 6 h etching time value, and a 90° proton incidence angle on the detector, are presented in Figure 4a (red points). The percentage errors on the proton range calculated with TRACK-P with respect to SRIM lie within a 3% range.
The proton track diameter evolution as a function of the incident energy for a CR-39 detector, which results from TRACK-P calculations in the 1–9 MeV proton energy range is presented in Figure 4b (blue triangles). It can be observed that the proton track diameter magnitude decreases from 9.38 µm (for 1 MeV proton energy) to 0.5 µm (for 9 MeV proton energy) as the proton energy increases, presenting a similar behavior with the one reported in [8], for 1–6 MeV proton energy range. Figure 4b (red points) illustrates the proton track diameters measured on the post-etched CR-39 detectors after irradiation with monoenergetic proton beams.
A simple analytical function of type y = Aexp(−BE) was used to fit the proton track diameter dependence on energy (see Figure 4b), where E is the proton energy, and the fitting parameters A, B are indicated in the figure legend. The A and B fitting parameters were iteratively determined using the least-squares fitting procedure in order to assured a minimum percentage error (within ±15%) of the measured proton track values with respect to those calculated with the TRACK-P software.
By calculating the proton track diameter with the analytical function from Figure 4b, a value of ~9 µm at 1 MeV proton energy results, together with a 0.88 µm track diameter for a proton energy value of 9 MeV.
The proton track diameter dependence on the proton energy shown in Figure 4b (calculated both experimentally and theoretically) is in good agreement with previous results [3,8] for the used etching parameters.

3.2. Estimation of Proton Energies Incident on the Second CR-39 Detector

The proton range and consequently the Bragg peak position for different proton energies within the stack of CR-39 detectors stack was calculated using the SRIM code [23] (Figure 4a). Figure 5 and Table 1 present the Bragg curves and the Bragg peak position for protons with 1–15 MeV energy range as a function of the incident proton energy. It can be observed that protons with energies higher than 10.5 MeV are fully stopped into the second CR-39 detector, while the first CR-39 detector (1 mm thick) only acts as a filter.
A proton with energy higher than 10.5 MeV could penetrate through 1 mm thick CR-39 detector without losing enough energy to damage it. In [3] it was showed that protons with energies higher than 10.5 MeV do not leave observable traces on the front side of a 1 mm thick CR-39 detector. Reference [3] also reports on the presence of tracks for protons with energies higher than 10 MeV (10.5 < E < 10.7 MeV) on the rear side of a first CR-39 detector and on the front side of a second CR-39 detector. A direct correlation between the proton track diameter on the front side of the second detector and the proton energy incident on the detector stack was not established. Previously, [3,7,9,10] it was reported that the dependence of the proton track diameter on proton incident energy can be established only for protons that stops in a single detector slice (around Bragg peak).
Due to the fact that only protons with energies higher than 10.5 MeV can fully deposit their energies in the second CR-39 detector (the first detector acting as an attenuation energy filter), the correspondence between the proton track diameter identified on the second detector and the incident energy of protons on the second detector can be achieved. Thus, we consider the energy of proton after crossing the first CR-39 detector, as the proton incident energy on the second CR-39 detector.
Table 2 presents the correspondence between the energies of the protons incident on the first detector (with energies higher than 10.5 MeV) and the energies of the protons incident on the second detector, calculated using the Stopping and Range of Ions in Matter (SRIM) code [23]. The dependence between the energies of the protons transmitted through the first CR-39 detector, and the energies of the protons incident on the detector stack (in 1–15 MeV range) is shown in Figure 6a. Previously, in [3,13] only the transmittance of protons with energies ranging between 10 to 10.7 MeV through 1 mm thick CR-39 detector was analyzed.
The number of protons with energies higher than 10 MeV that travel through a first CR-39 detector and stopped in a second detector can be determined with the SRIM code following a similar calculation procedure with the one used for finding the proton transmitted energy.
The assessment of number of protons with known energy stopped in a slice of CR-39 detector material has also been calculated (see Figure 6b). Firstly, we estimate the range of protons with energies from 1 to 15 MeV in the 2 mm thick CR-39 detector stack. Then, a CR-39 material slab (2 mm in thick) was sliced in sheaths of different thicknesses. The thickness of each slice was determined by iterative calculations taking into account the proton incident energy and the Bragg peak position into the CR-39 detector slice (see Table 1). Thus, considering a number of 1000 protons incident on the front side of the detector stack, we calculated the number of protons stopped in each slice of CR-39 detector material as a function of the proton incident energy (see Figure 6b).
For proton energies ranging from 2 to 15 MeV, the graph presented in Figure 6b exhibits some discontinuities at 2.2, 5, 8, 10 and respectively, 12 MeV. The SRIM code calculates the number of protons stopped into the CR-39 slab considering its chemical composition (polyallyl-diglycol-carbonate (PADC), C12H18O7) and a value of the detector density of about 1.3 g/cm3 (given by the Track Analysis System Ltd). So, we suppose that these discontinuities could be specific to the material physical and chemical properties.

3.3. Analysis of the Laser Driven Proton Tracks in CR-39 Detectors by Atomic Force Microscopy (AFM)

The investigation of proton tracks by AFM is more precise with respect to an optical microscopy as it can perform a direct physical measurement of the revealed pits on the post-etched surface of the detector [23]. However, optical microscopy is currently considered as a standard method to perform the analysis of proton tracks [3,8]. The mismatch in the results supplied by these two methods appears mainly because of microscope focusing issues, knowing that the optical image of the CCD camera attached to the microscope consists of a matrix of pixels (with x; y coordinates) and associated grey scale values [24]. Thus, AFM analysis of the post etched CR-39 detectors can be very useful to identify all questions related to the evidence of proton tracks by optical microscopy, issues that mainly appear due to detector transparency, depth of the proton tracks, and microscope focusing.
Proton beams generated as a result of high-power, laser-thin solid target interaction were identified by AFM, after the tracks left in the post-etched surface of both CR-39 detectors that comprise the irradiated stack (10 µm thick Al foil, 2 CR-39 detectors, each one 1 mm thick). The CR- 39 detectors irradiated with laser driven proton beams were etched for 6 h in 6.25 N NaOH solution at 70 °C.
A SPM-NTegra Prima AFM (NT-MDT) atomic force microscope was used, operating in semi-contact mode with a NSG 01 cantilever (resonance frequency: 87–230 kHz, force constant: 1.45–15.1 N/m). The proton track diameters were also measured using the Image J software.
Figure 7 shows the AFM images of the proton tracks observed on front side of both post etched CR-39 detectors irradiated with laser driven proton beams. The proton tracks mainly exhibit circular shapes of different diameters as an indication of various proton energies of normal incidence on the detector plate. There are no so much elliptic shapes of proton tracks, (which could indicate that the incident angle of the protons on the detector surface is not normal [3]). The images also point out the influence of the target thickness and material type on the proton number for the 50 × 50 µm2 investigated area. Similar spatial distributions of the proton tracks on few mm2 areas were also observed.
The number of proton tracks in the 50 × 50 µm2 area identified on the first detector, in case of high-power laser pulses interaction with Al targets (with 10 and 5 µm thickness), is higher than in case of Ag (with 10 and 5 µm thickness) targets.
The AFM images in Figure 7 emphasize the presence of proton tracks, with diameters ranging from 1 to 7 µm, on both CR-39 detectors. The circular proton tracks with diameters of ~1 µm are very well illustrated in the AFM images of the post-etched CR-39 detectors, shown in Figure 7. The differences between the proton track diameters of ~1 µm and the rugged surface of the chemical process detectors (pits of about 0.6 µm) were also revealed. Thus, the uniform distributed tracks with diameters of about 0.6 µm observed on the post–etch surface of the CR-39 detectors, cannot be attributed to protons. On the other hand, as the linear energy transfer (LET) of protons with energy higher than 10.7 MeV is very low in the first CR-39 slab their corresponding track diameters cannot be differentiated from the rugged surface pits.
We suppose that the non-uniform distribution of the proton tracks on the surface of post-etched CR-39 detectors could be attributed to the surface morphology of Al and Ag targets (see Figure 1d).
The tracks with diameters greater than ~1 µm identified on the surface of the first and second CR-39 detectors (see Figure 7), irradiated during the performed laser-proton accelerated experiments, present an exponential distribution. The correlation between the proton track diameter and energy was performed by using the fitting curve.
The analytical function y = 12 × exp(−0.29 × E) proposed in Section 3.1 to establish the proton track diameter dependence on proton energy, was used as a calibration tool to identify (with a percentage error of ±15%) the proton energies read from the AFM images. Using such fitting, a proton track diameter of 1.17 µm correspond to 8 MeV proton energy, while a 0.88 µm diameter corresponds to 9 MeV proton energy. The smallest proton track diameter observed in the AFM images from Figure 7 is about 1 µm, which indicates proton energies of about 8.4 MeV. Table 2 indicates that the incident proton energy of 8.4 MeV on the second CR-39 detector corresponds to 13.8 MeV incident proton energy on the detector stack.
The evolution of the proton track diameter on the incident proton energy for both CR-39 detectors, within the 1–9 MeV range, is shown in Figure 8 together with the fitting curve previously presented in Figure 4b. As the dependence of the pits identified on the front side of the second CR-39 detector is also an exponential one with respect to energy, result that the measured track diameters can be attributed to protons.

3.4. Analysis of the Laser Driven Proton Tracks in CR-39 Detectors by Visible Light Microscopy

The surfaces of the both front side of the CR-39 post-etched detectors exposed to laser driven proton beams were also investigated by optical microscopy, as the shape and size of the identified tracks were measured, counted and analyzed.
Counting of the track diameters was performed using the Python [25,26] wrapper for the OpenCV library [27], and numerical processing was performed using the NumPy [28] packages. The first step of this process lies in adjusting the picture contrast for better track edge detection. An algorithm for counting and contour detection was implemented. It uses a simple chain approximation approach which allows performing measurement of the track diameters on the x, y axes. The major and minor axes of the counted tracks were determined. Slight deviations in the values of the major axes relatively to values of the minor axes indicate circular shapes of the tracks. For major differences between the minor and the major axis a correlation with the incident angle of the proton on the detector surface plane can be obtained. A standard deviation of about 1.56 degrees was obtained between the minor and major axes as an indication of a reduced elipticity of the tracks, for all the analyzed CR-39 detectors. This means that the protons incidence angle on the detector varies mainly between 0° (normally incident on the detector surface) and 30° (relative to the normally incident on the detector surface).
Simultaneous measurements of the track diameters were also performed with ImageJ software.
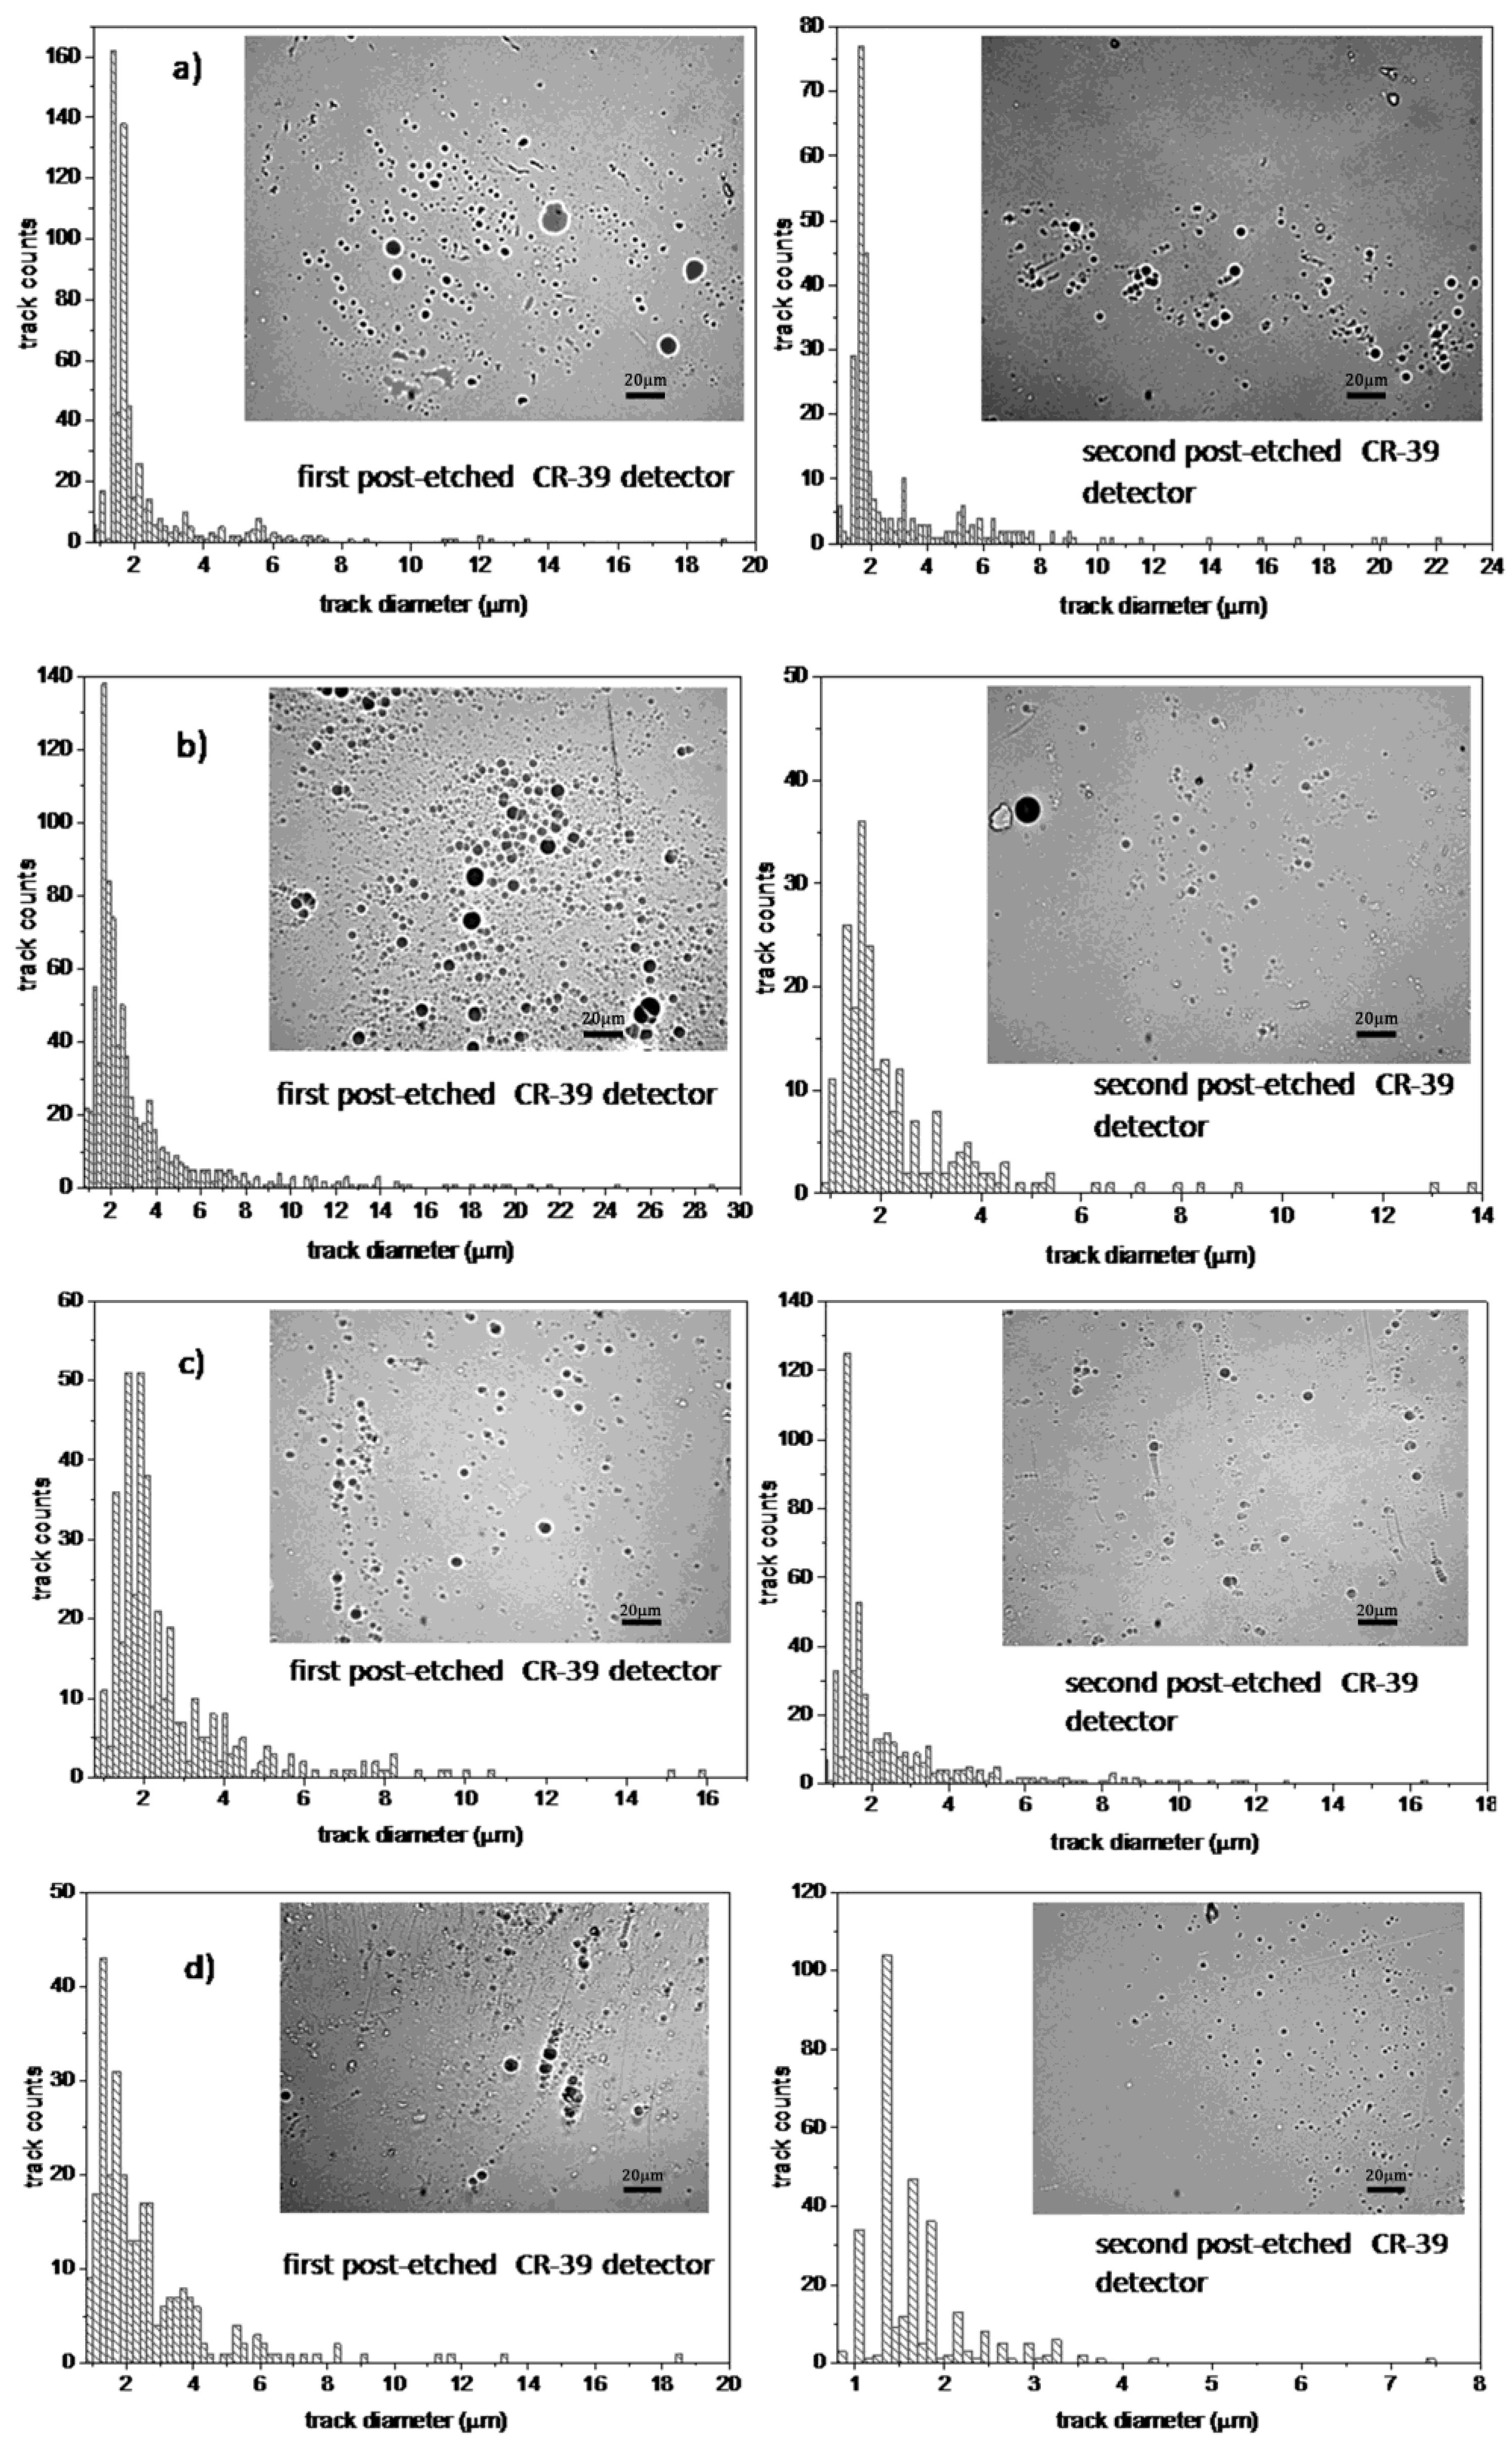
As a result of counting and geometrical shape analysis of protons, the histograms of the minor axes of the track diameters obtained from the acquired optical images of the post-etched CR-39 detectors were plotted (see Figure 9). The x axis of each graph begins at 0.88 µm, as it represents the minimum number (within ±15% error) of tracks in CR-39 detectors that can be attributed to protons (as seen in Figure 4b).
The dependence between the proton track diameter (within the 0.88–8 µm range) identified on the front side of each CR-39 detectors and the incident proton energy was established using the calibration curve from Figure 4b and Table 2. Thus, the evolution of the tracks counted on the front side of the second CR-39 detector as a function of proton energy was calculated.
In Figure 10, the spectral distribution of protons stopped in each CR-39 detector after the interaction of the high-power laser pulse with the Al target of 5 µm thickness is presented. It can be observed that the experimental data presented in Figure 10 are similar with the theoretical predicted one shown in Figure 6b in the 1–9 MeV energy range. The graphical representation of the counted number of protons stopped in the first and second CR-39 slab (see Figure 10a,b) present discontinuity points at ~3.3, 5.5 and 6.7 MeV respectively at 4.3, 5.5 and 6.6 MeV. As the revealing of the proton track depends on the etching conditions of the CR-39 detectors, we suppose that these discontinuity points can be linked with the etching process of the detector material as they are slightly different from those identified in Figure 6b.
Similar results were obtained after the interaction of the high-power laser pulse with the Al and Ag structured targets of 5 and 10 µm thicknesses.
Recently, in [29] by particle-in-cell simulations of target normal sheath acceleration of protons was obtained a proton spectrum (Figure 2e from reference) similar with that one from Figure 10.
Optical images of the proton tracks identified on both front sides of the post-etched CR-39 detectors can be observed in Figure 8.
These pictures illustrate traces with irregular, circular or elliptic shapes of different sizes that make difficult the proton track analysis. The spots with irregular shapes can be attributed to unwashed contaminants of the etching solution that remain on the detector surface, or to the material etched by the chemical solution. The irregular shapes with dimensions smaller than 0.88 µm (the minimum number of tracks in CR-39 detectors that might be attributed to protons, Figure 4b) or higher than 8 µm (the maximum number of tracks in CR-39 detectors that might be attributed to protons, Figure 4b) renders difficult the identification of proton tracks. Only the circular and elliptic shapes observed on the surface of post etched CR-39 detectors with very well-defined edges could be assigned to proton tracks. This is an indication of a good signal to noise ratio and proof of protons.
It may be concluded that for a proper identification of proton track diameters in CR-39 detectors by optical microscopy, it is important to establish, beside a clear signal of proton pits, the theoretically values for the minimum and maximum diameters of the proton tracks.
The non-uniform distribution of the proton tracks on the surface of post-etched CR-39 detectors due to the surface morphology of Al and Ag targets was also observed. Similar proton track distributions were observed for structured dynamic plasma targets [18].

4. Conclusions

By correlating experimental results with some theoretical considerations, we showed that the spectral energy distribution of the laser-accelerated protons stopped in the second CR-39 detector, of the detection stack, can be determined. The correspondence between the proton track diameter and the incident energy on the second detector is established by knowing that only protons with energies higher than 10.5 MeV can fully deposit their energy in the second CR-39 detector. The energy of protons stopped in the first CR-39 detector was also evaluated from the proton track diameter dependence on proton incident energy.
Calibration of 1 mm thick CR-39 detector was performed both experimentally and theoretically by finding an analytical expression of the calibration curve. Using the analytical expression of the calibration curve in the 1–9 MeV energy range, we estimate individually the proton energy from the track diameter measured by AFM in each detector that makes up the irradiated stack. From the histograms of the counted track diameters on the front side of the second CR-39, we estimated the energy distribution of laser-accelerated protons.
The data obtained after the microscopy analysis of the surfaces of the post-etched CR-39 detectors was discussed to explain all issues that occur after exposure of CR-39 type solid-state nuclear detectors to laser-accelerated proton beams. Only individual tracks with circular or elliptic shapes observed on the front side of the both detectors, with very well-defined edges and diameters in the 0.8–8 µm range (theoretically established), are assigned to protons.
The method proposed in this paper can be applied for dose assessment in high energy particle environments such as space, where astronauts dose records can be performed using CR-39 detectors. Using our approach, the energy distribution of ionizing particles extracted from each detector that compose a stack allows the assessment of ionizing particle type (neutrons, protons or heavier ions) as a function of its track shape in correlation with the incident energy on each detector surface. The correct evaluation of the type and energy of the ionizing particle ensure a better associated dose risk assessment.

Author Contributions

Conceptualization, A.G., B.B., M.S., M.G. E.S., and A.C.; methodology, M.S., B.B., E.S., M.S., and I.B.; software, A.C. and E.S.; validation, A.G., M.S., B.B., E.S., M.S., I.B., A.B., A.C., B.M., and M.G.; investigation, A.B., E.S., B.B. M.S., I.B., A.G, and B.M.; A.G., B.B., E.S., A.C. and M.S. writing—original draft preparation; B.M., M.G. and A.C. writing—review and editing.

Funding

Work has been funded by European Space Agency within the ESA contract No.4000121912/17/NL/CBi.

Acknowledgments

We acknowledge support from the CETAL-PW facility at the National Institute for Laser, Plasma and Radiation Physics, Magurele, Romania.

Conflicts of Interest

The authors declare no conflict of interest.

References

  1. Fuchs, J.; Antici, P.; d’Humieres, E.; Lefebvre, E.; Borghesi, M.; Brambrink, E.; Cecchetti, C.A.; Kaluza, M.; Malka, V.; Manclossi, M.; et al. Laser-driven proton scaling laws and new paths towards energy increase. Nat. Phys. 2006, 2, 48–56. [Google Scholar] [CrossRef]
  2. Hidding, B.; Karger, O.; Konigstein, T.; Pretzler, G.; Manahan, G.G.; McKenna, P.; Gray, R.; Wilson, R.; Wiggins, S.M.; Welsh, G.H.; et al. Laser-plasma-based Space Radiation Reproduction in the Laboratory. Sci. Rep. 2017, 7, 42354. [Google Scholar] [CrossRef] [Green Version]
  3. Jeong, T.W.; Singh, P.K.; Scullion, C.; Ahmed, H.; Hadjisolomou, P.; Jeon, C.; Yun, H.; Kakolee, K.F.; Borghesi, M.; Ter-Avetisyan, S. CR-39 track detector for multi-MeV ion spectroscopy. Sci. Rep. 2017, 7, 447. [Google Scholar] [CrossRef] [Green Version]
  4. Nürnberg, F.; Schollmeier, M.; Brambrink, E.; Blažević, A.; Carroll, D.C.; Flippo, K.; Gautier, D.C.; Geisel, M.; Harres, K.; Hegelich, B.M.; et al. Radiochromic film imaging spectroscopy of laser-accelerated proton beams. Sci. Instrum. 2009, 80, 033301. [Google Scholar] [CrossRef] [PubMed] [Green Version]
  5. Bolton, P.; Borghesi, M.; Brenner, C.; Carroll, D.; De Martinis, C.; Fiorini, F.; Flacco, A.; Floquet, V.; Fuchs, J.; Gallegos, P.; et al. Instrumentation for diagnostics and control of laser-accelerated proton (ion) beams. Phys. Med. 2014, 30, 255–270. [Google Scholar] [CrossRef] [PubMed] [Green Version]
  6. Ledingham, K.W.D.; Galster, W. Laser-driven particle and photon beams and some applications. New J. Phys. 2010, 12, 45005. [Google Scholar] [CrossRef] [Green Version]
  7. Seimetz, M.; Bellido, P.; Garcıa, P.; Mur, P.; Iborra, A.; Soriano, A.; Hulber, T.; Lopez, J.G.; Jimenez-Ramos, M.C.; Lera, R.; et al. Spectral characterization of laser-accelerated protons with CR-39 nuclear track detector. Rev. Sci. Instrum. 2018, 89, 023302. [Google Scholar] [CrossRef]
  8. Malinowska, A.; Szydlowski, A.; Jaskola, M.; Korman, A.; Sartowska, B.; Kuehn, T.; Kuk, M. Investigations of protons passing through the CR-39/PM-355 type of solid state nuclear track detectors. Rev. Sci. Instrum. 2013, 84, 073511. [Google Scholar] [CrossRef]
  9. Durrani, S.A.; Bull, R.K. Solid State Nuclear Track Detection; Pergamon Press: Oxford, UK, 1987. [Google Scholar]
  10. Sinenian, N.; Rosenberg, M.J.; Manuel, M.; McDuffee, S.C.; Casey, D.T.; Zylstra, A.B.; Rinderknecht, H.G.; Johnson, M.G.; Séguin, F.H.; Frenje, J.A.; et al. The response of CR-39 nuclear track detector to 1–9 MeV protons. Sci. Instrum. 2011, 82, 103303. [Google Scholar] [CrossRef] [PubMed] [Green Version]
  11. Gaillard, S.; Fuchs, J.; Galloudec, N.R.-L.; Cowan, T. Study of saturation of CR39 nuclear track detectors at high ion fluence and of associated artifact patterns. Sci. Instrum. 2007, 78, 13304. [Google Scholar] [CrossRef]
  12. Kanasaki, M.; Hattori, A.; Sakaki, H.; Fukuda, Y.; Yogo, A.; Jinno, S.; Nishiuki, M.; Ogura, K.; Kondo, K.; Oda, K.; et al. A high Energy Component of the intense laser-accelerated proton beams detected by stacked CR-39. Radiat. Meas. 2013, 50, 46–49. [Google Scholar] [CrossRef]
  13. Jeong, T.W.; Singh, P.K.; Scullion, C.; Ahmed, H.; Kakolee, K.F.; Hadjisolomou, P.; Alejo, A.; Kar, S.; Borghesi, M.; Ter-Avetisyan, S. Experimental evaluation of the response of micro-channel plate detector to ions with 10s of MeV energies. Sci. Instrum. 2016, 87, 083301. [Google Scholar] [CrossRef] [PubMed] [Green Version]
  14. Zigler, A.; Eisenman, S.; Botton, M.; Nahum, E.; Schleifer, E.; Baspaly, A.; Pomerantz, I.; Abicht, F.; Branzel, J.; Priebe, G.; et al. Enhanced Proton Acceleration by an Ultrashort Laser Interaction with Structured Dynamic Plasma Targets. Phys. Lett. 2013, 110, 215004. [Google Scholar] [CrossRef]
  15. National Institute for Laser, Plasma and Radiation Physics, Center for Advanced Laser Technologies (CETAL). Available online: http://cetal.inflpr.ro/newsite/cetal-pw (accessed on 4 April 2019).
  16. Florescu, M.G.; Duliu, O.G.; Pantazi, D.; Ticos, C.M.; Sporea, D.; Vasilache, R.; Ionescu, V.; Oane, M. Radiological Safety Assessment for the experimental Area of a Hyper-Intense Laser with Peak-Power of 1 PW-CETAL. Radiat. Prot. Dosim. 2017, 175, 104–109. [Google Scholar]
  17. Florescu, G.M.; Duliu, O.G. Shielding activation of petawatt laser facilities in Romania: A FLUKA preliminary evaluation. Radiat. Prot. Dosim. 2016, 168, 566–569. [Google Scholar] [CrossRef]
  18. Ganciu, M.; Groza, A.; Cramariuc, O.; Mihalcea, B.; Serbanescu, M.; Stancu, E.; Surmeian, A.; Butoi, B.; Dreghici, D.; Chirosca, A.; et al. Hardware and software methods for radiation resistance rising of the critical infrastructures. Rom. Cyber Secur. J. 2019, 1, 3–13. [Google Scholar]
  19. Bin, J.; Haffa, D.; Kreuzer, C.; Hartmann, J.; Speicher, M.; Lindner, F.H.; Ostermayr, T.M.; Hilz, P.; Rösch, T.F.; Lehrack, S.; et al. An automated, 0.5 Hz nano-foil target positioning system for intense laser plasma experiments. High Power Laser Sci. Eng. 2017, 5, 5. [Google Scholar]
  20. Robu, E.; Maringer, F.J.; Garavaglia, M.; Piccini, L. Influence of Exposure Geometry on the Response of CR39 SSNT Radon Detectors. Rom. Rep. Phys. 2011, 63, 376–382. [Google Scholar]
  21. Lounis, Z.; Djeffal, S.; Morsli, K.; Allab, M. Track etch parameters in CR-39 detectors for proton and alpha particles of different energies. Instrum. Methods Phys. Sect. B 2001, 179, 543–550. [Google Scholar] [CrossRef]
  22. Nikezic, D.; Ivanovic, M.; Yu, K. A computer program TRACK_P for studying proton tracks in PADC detectors. SoftwareX 2016, 5, 74–79. [Google Scholar] [CrossRef] [Green Version]
  23. Ziegler, J.F.; Biersack, J.P. The Stopping and Range of Ions in Matter. In Treatise on Heavy-Ion Science; Springer Nature: New York, NY, USA, 1985; Volume 6, pp. 93–129. [Google Scholar]
  24. Johnson, C.; Benton, E.; Yasuda, N.; Benton, E. Analysis of short-range tracks and large track fluences in CR-39 PNTD using atomic force microscopy. Radiat. Meas. 2009, 44, 742–745. [Google Scholar] [CrossRef]
  25. Oliphant, T.E. Python for scientific computing. Comput. Sci. Eng. 2007, 9, 10–20. [Google Scholar] [CrossRef]
  26. Millman, K.J.; Aivazis, M. Python for Scientists and Engineers. Comput. Sci. Eng. 2011, 13, 9–12. [Google Scholar] [CrossRef] [Green Version]
  27. Bradski, G. The OpenCV Library. Dr. Dobb’s J. Softw. Tools 2000, 120, 122–125. [Google Scholar]
  28. Oliphant, T.E. Guide to NumPy; Create Space Independent Publishing Platform: Miami, FL, USA, 2015. [Google Scholar]
  29. Xiao, K.D.; Zhou, C.T.; Jiang, K.; Yang, Y.C.; Li, R.; Zhang, H.; Qiao, B.; Huang, T.W.; Cao, J.M.; Cai, T.X.; et al. Multidimensional effects on proton acceleration using high-power intense laser pulses. Phys. Plasmas 2018, 25, 23103. [Google Scholar] [CrossRef] [Green Version]
Figure 1. (a) General view of the experimental set-up; Detailed view of arrangement used: (b) for laser beam focal point profile analysis; (c) to visualize the reflected laser light on target; (d) SEM images of the magnetron sputtering produced Ag target.
Applsci 09 02052 g001
Figure 2. Experimental (red points) and theoretical (black line curve) CR-39 detectors thickness evolution as a function of the etching time.
Applsci 09 02052 g002
Figure 3. Images of proton tracks on the CR-39 detectors, obtained for a 40× optical microscope magnification: (a) 2 MeV; (b) 3 MeV and (c) 5 MeV proton beam energy.
Applsci 09 02052 g003
Figure 4. (a) Proton range calculated with SRIM 2013 and TRACK-P software; (b) The dependence of the proton track diameter on energy.
Applsci 09 02052 g004
Figure 5. Bragg peak positions in CR-39 detector stack.
Applsci 09 02052 g005
Figure 6. (a) Dependence of proton transmitted energy through 1 mm thick CR-39 detector on incident proton energy within the 10–15 MeV range; (b) Counted number of protons stopped in 2 mm CR-39 detector as function of incident proton energy.
Applsci 09 02052 g006
Figure 7. AFM images of first (a,c,e,g) and second (b,d,f,h) post etched CR-39 detectors when high-power laser pulse irradiates: 5 µm thick Ag target; 5 µm thick Al target; 10 µm thick Ag target; respectively, 10 µm thick Al target.
Applsci 09 02052 g007
Figure 8. Evolution of proton track diameters on first (red points) and second (blue points) post-etched CR-39 detector, as it results from the AFM images for: (a) 5 µm thick Ag target; (b) 5 µm thick Al target; (c) 10 µm thick Ag target; (d) 10 µm thick Al target. The black line represents the fitting curve.
Applsci 09 02052 g008
Figure 9. Histograms of the track diameters measured from optical images of post-etched CR-39 detectors irradiated by proton beams produced by high-power laser pulse interaction with: (a) 5 µm thick Ag target; (b) 5 µm thick Al target; (c) 10 µm thick Ag target; (d) 10 µm thick Al target.
Applsci 09 02052 g009
Figure 10. Dependence of number of proton tracks on the proton energy obtained for (a) first and (b) second CR-39 detector in the case of the interaction of the high-power laser pulse with the Al target of 5 µm thickness.
Applsci 09 02052 g010
Table 1. Data obtained from SRIM simulation of the detector stack.
Layer No.Energy (MeV)Proton Range (mm)Stopping Power Intensity (eV/A)Simulation Structures of the Experimental Stack (10 µm Al + 2 mm of the CR-39 Detectors)
1115.5 × 10−34.965.9 µm
2255.3 × 10−34.23layer 1 + 40.5 µm
33115 × 10−33.85layer 2 + 58.5 µm
44187 × 10−33.41layer 3 + 76 µm
55279 × 10−34.27layer 4 + 93.5 µm
66386 × 10−33.65layer 5 + 109 µm
77508 × 10−33.45layer 6 + 124 µm
88646 × 10−33.6layer 7 + 142 µm
99797 × 10−33.22layer 8 + 153 µm
1010962 × 10−33.25layer 9 + 168 µm
11111.142.97layer 10 + 178 µm
12121.333.02layer 11 + 200 µm
13131.532.76layer 12 + 205 µm
14141.762.72layer 13 + 230 µm
1514.81.952.59layer 14 + 200 µm
Table 2. Correspondence between the incident proton energy on the first and second CR-39 detector.
Proton Incident Energy on Al+2CR-39 Detectors Stack Calculated with SRIM 2013Mean Energy of the Protons Incident on the Second CR-39 Detector from the Stack Calculated with SRIM 2013
10.51.6
113.2
11.54.4
125.46
12.56.43
137.25
13.58
13.88.4
148.77
14.59.89

