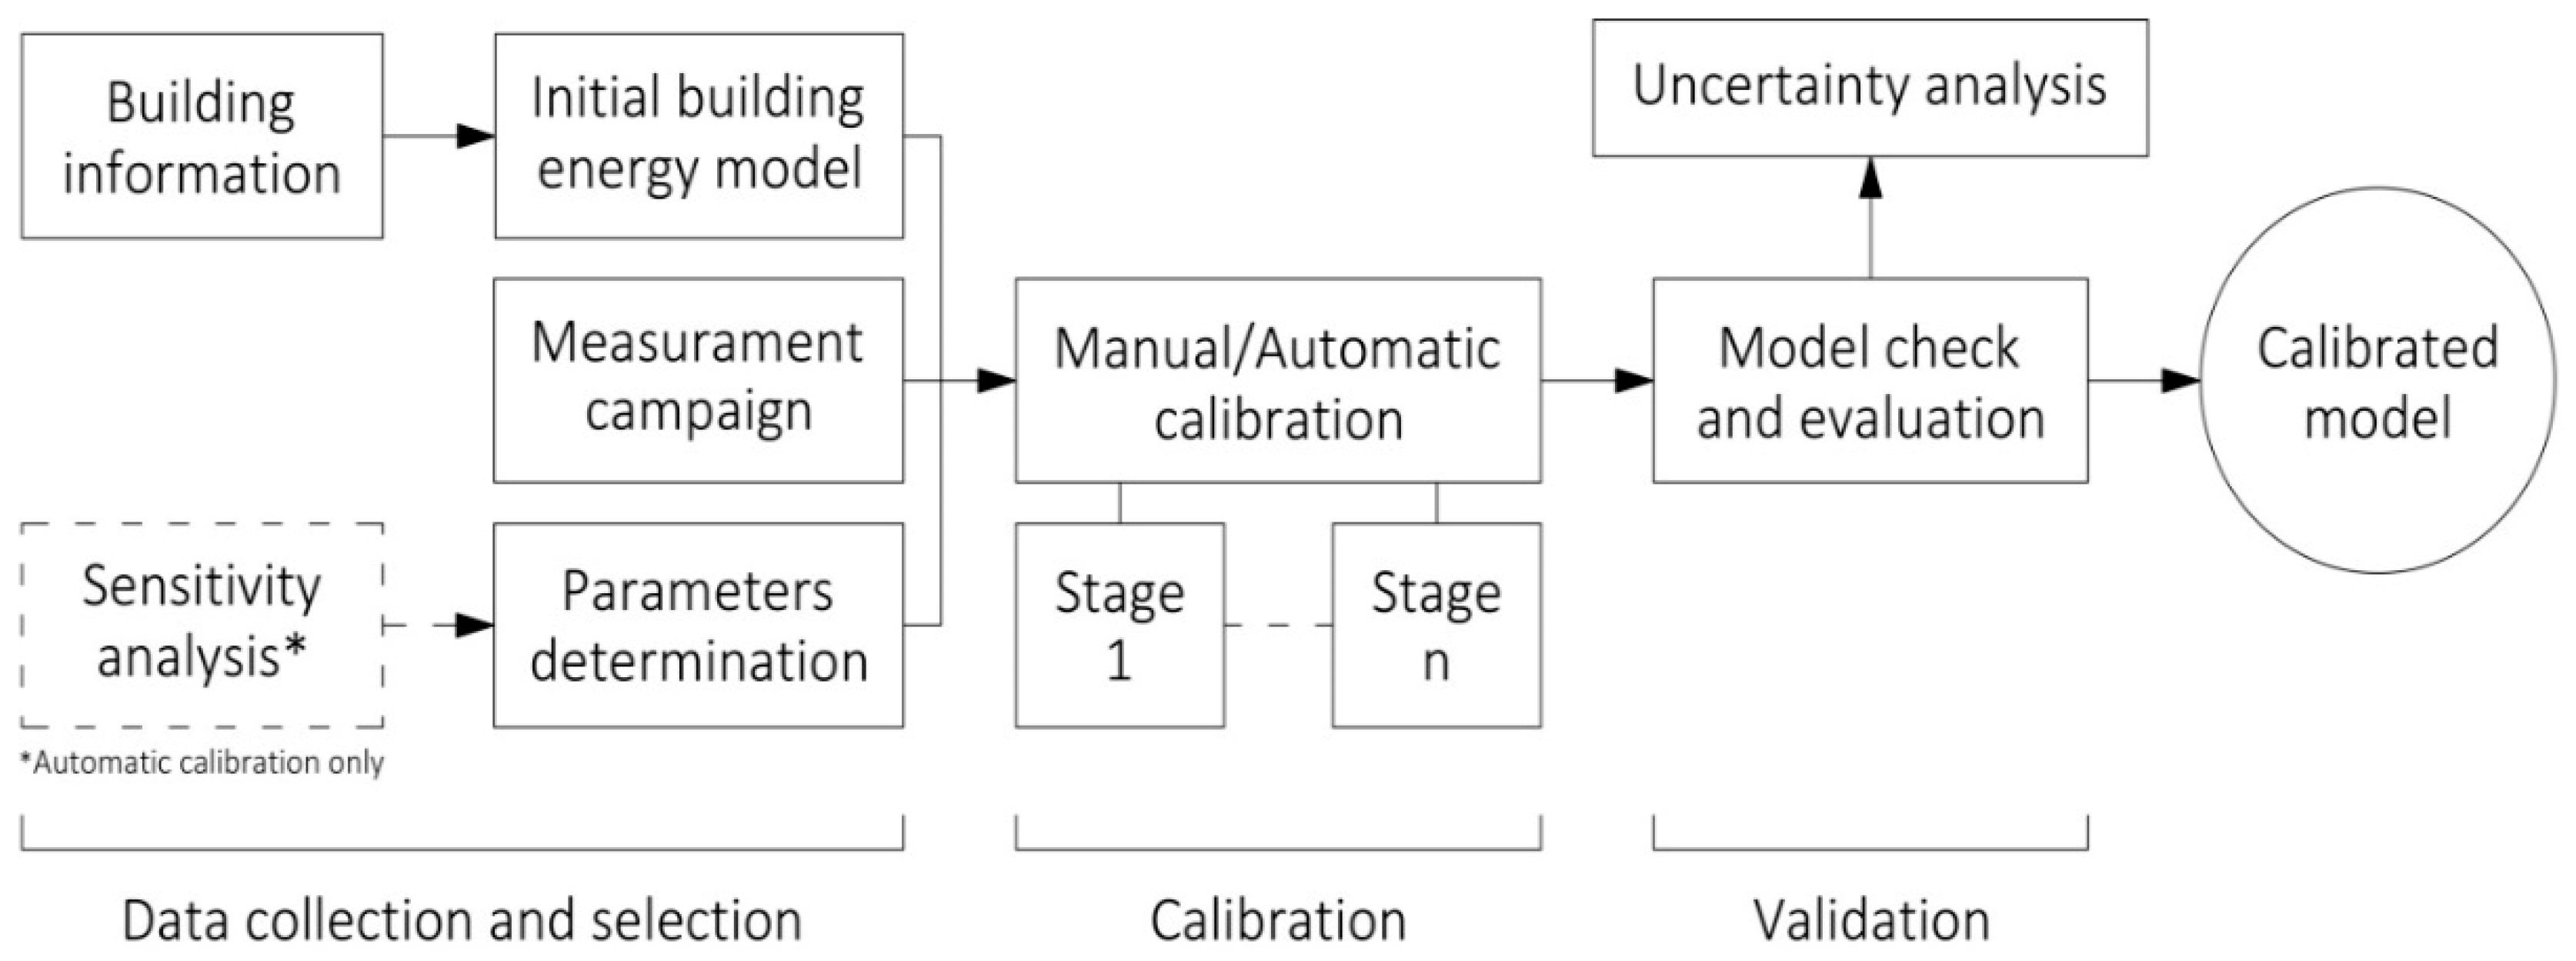
Figure 1.
Methodology scheme.
Figure 1.
Methodology scheme.
Figure 2.
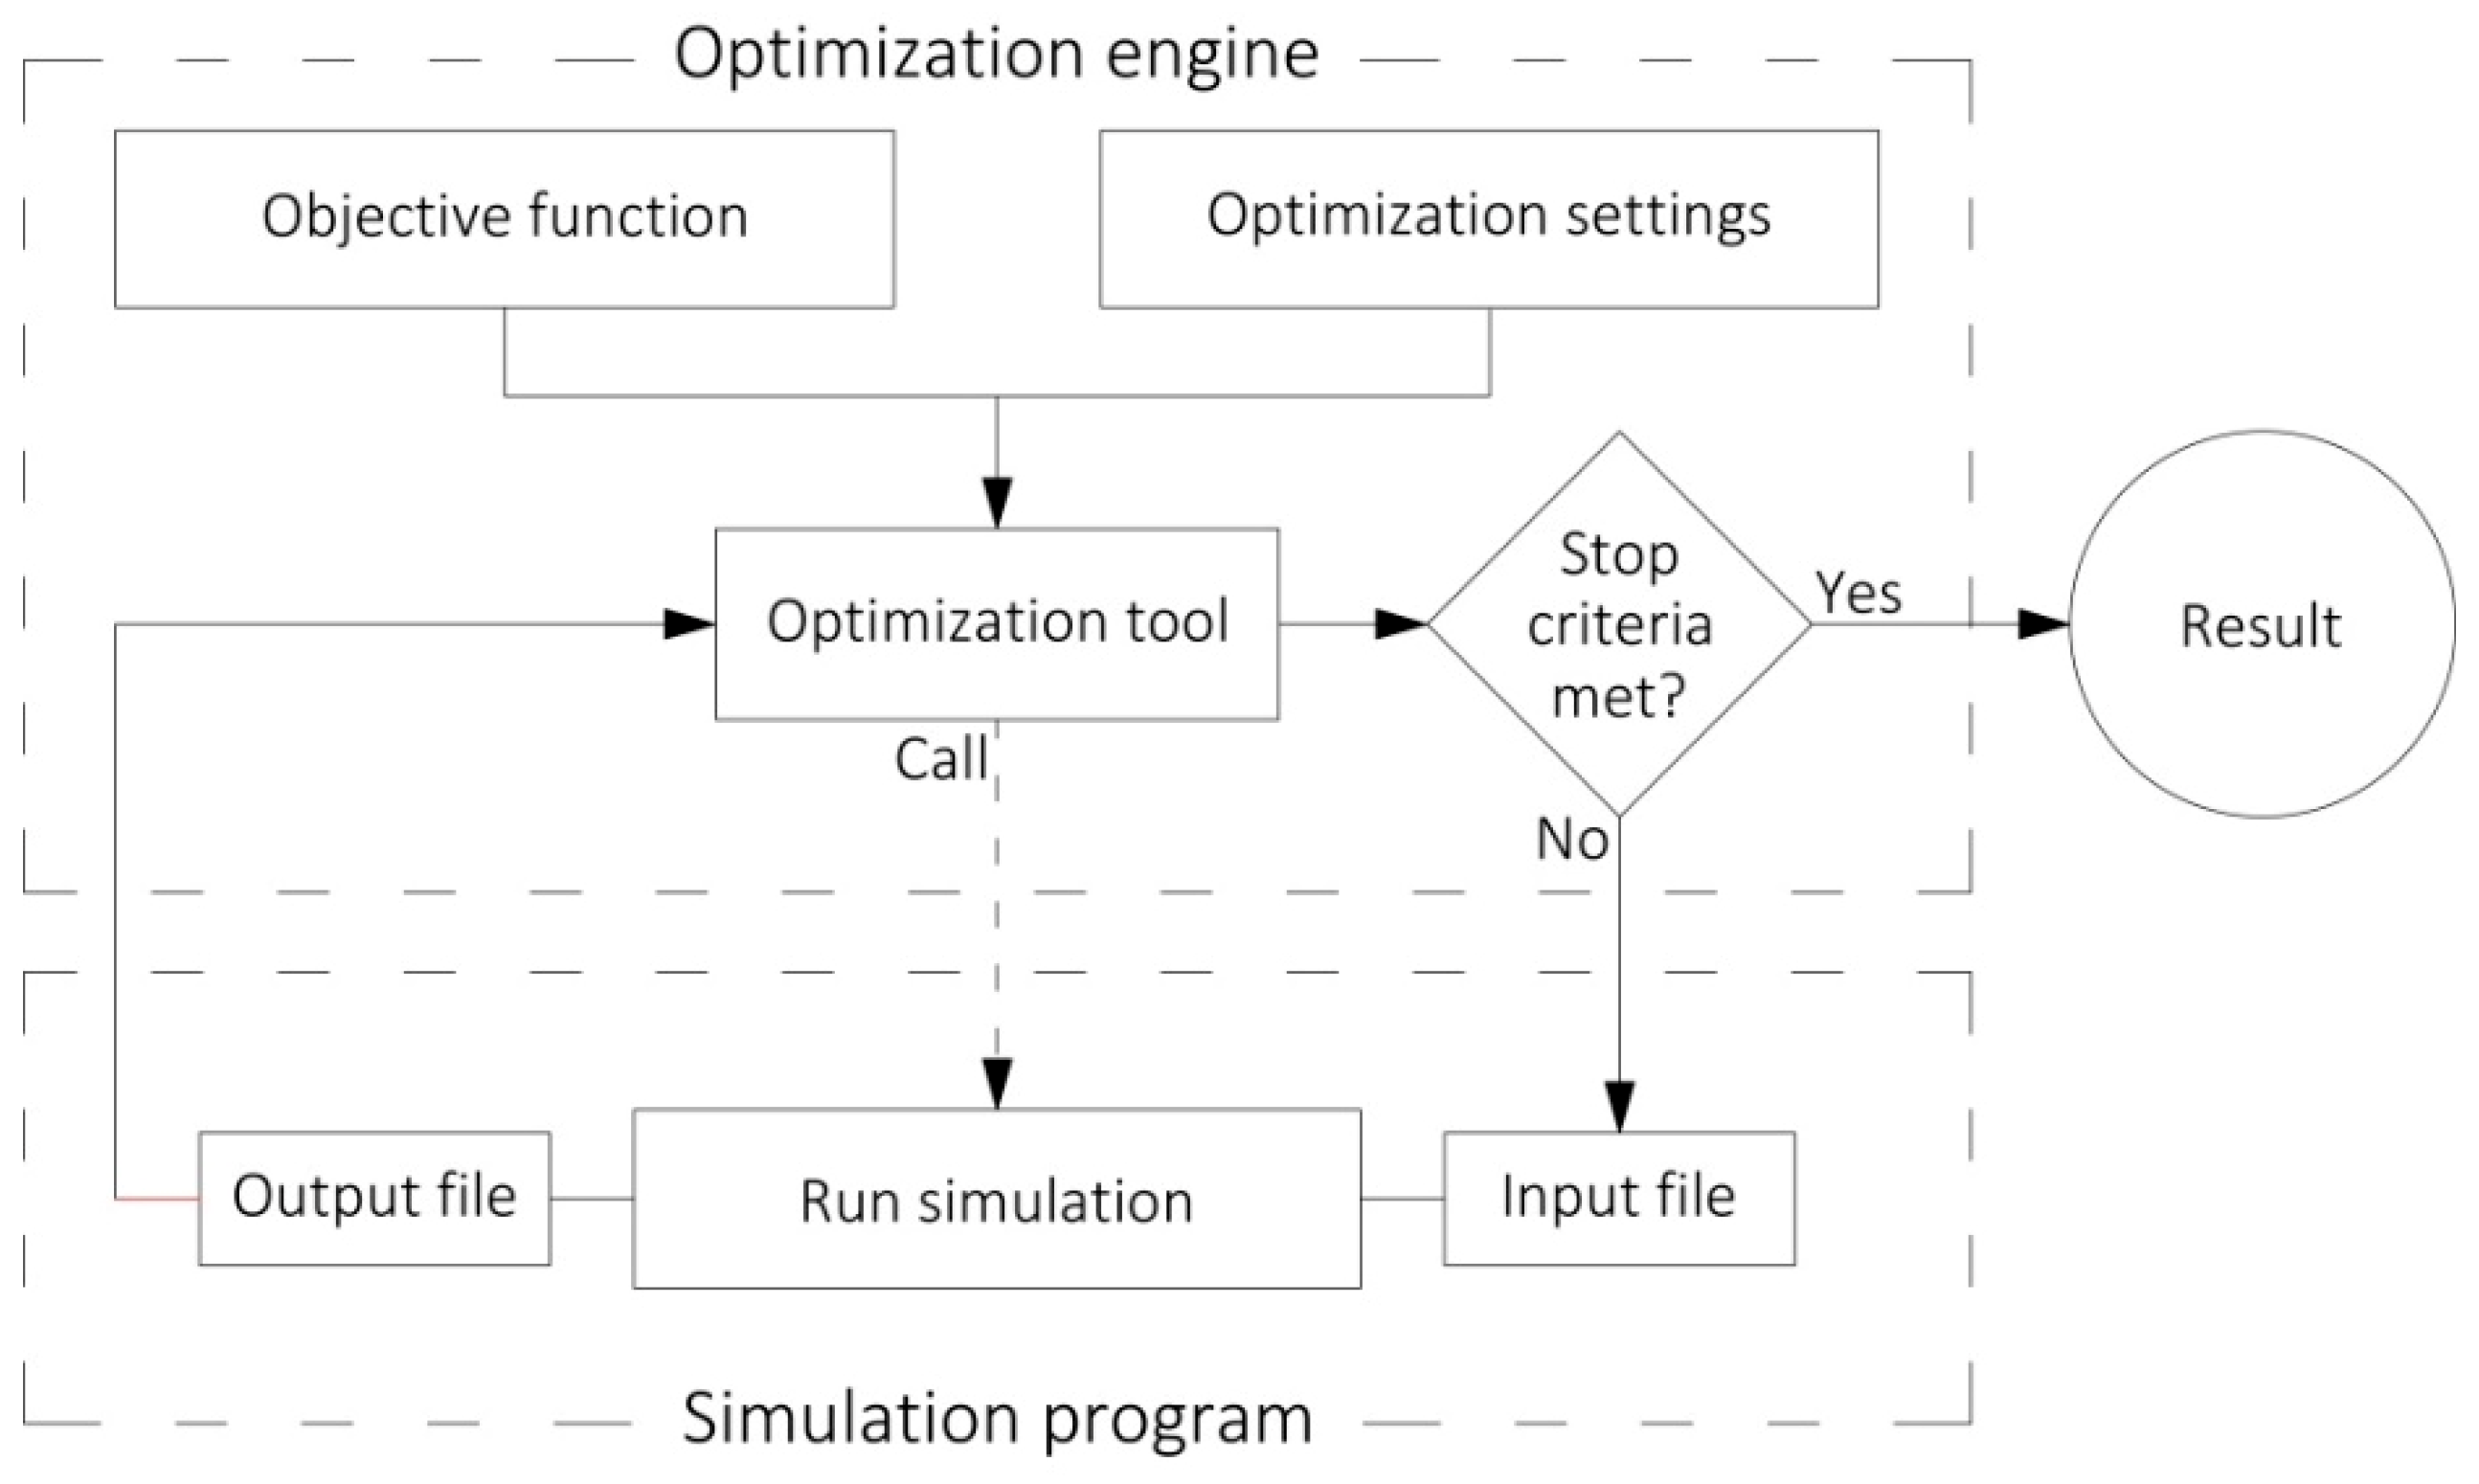
Coupling of a simulation program and an optimization engine in a simulation-based optimization method.
Figure 2.
Coupling of a simulation program and an optimization engine in a simulation-based optimization method.
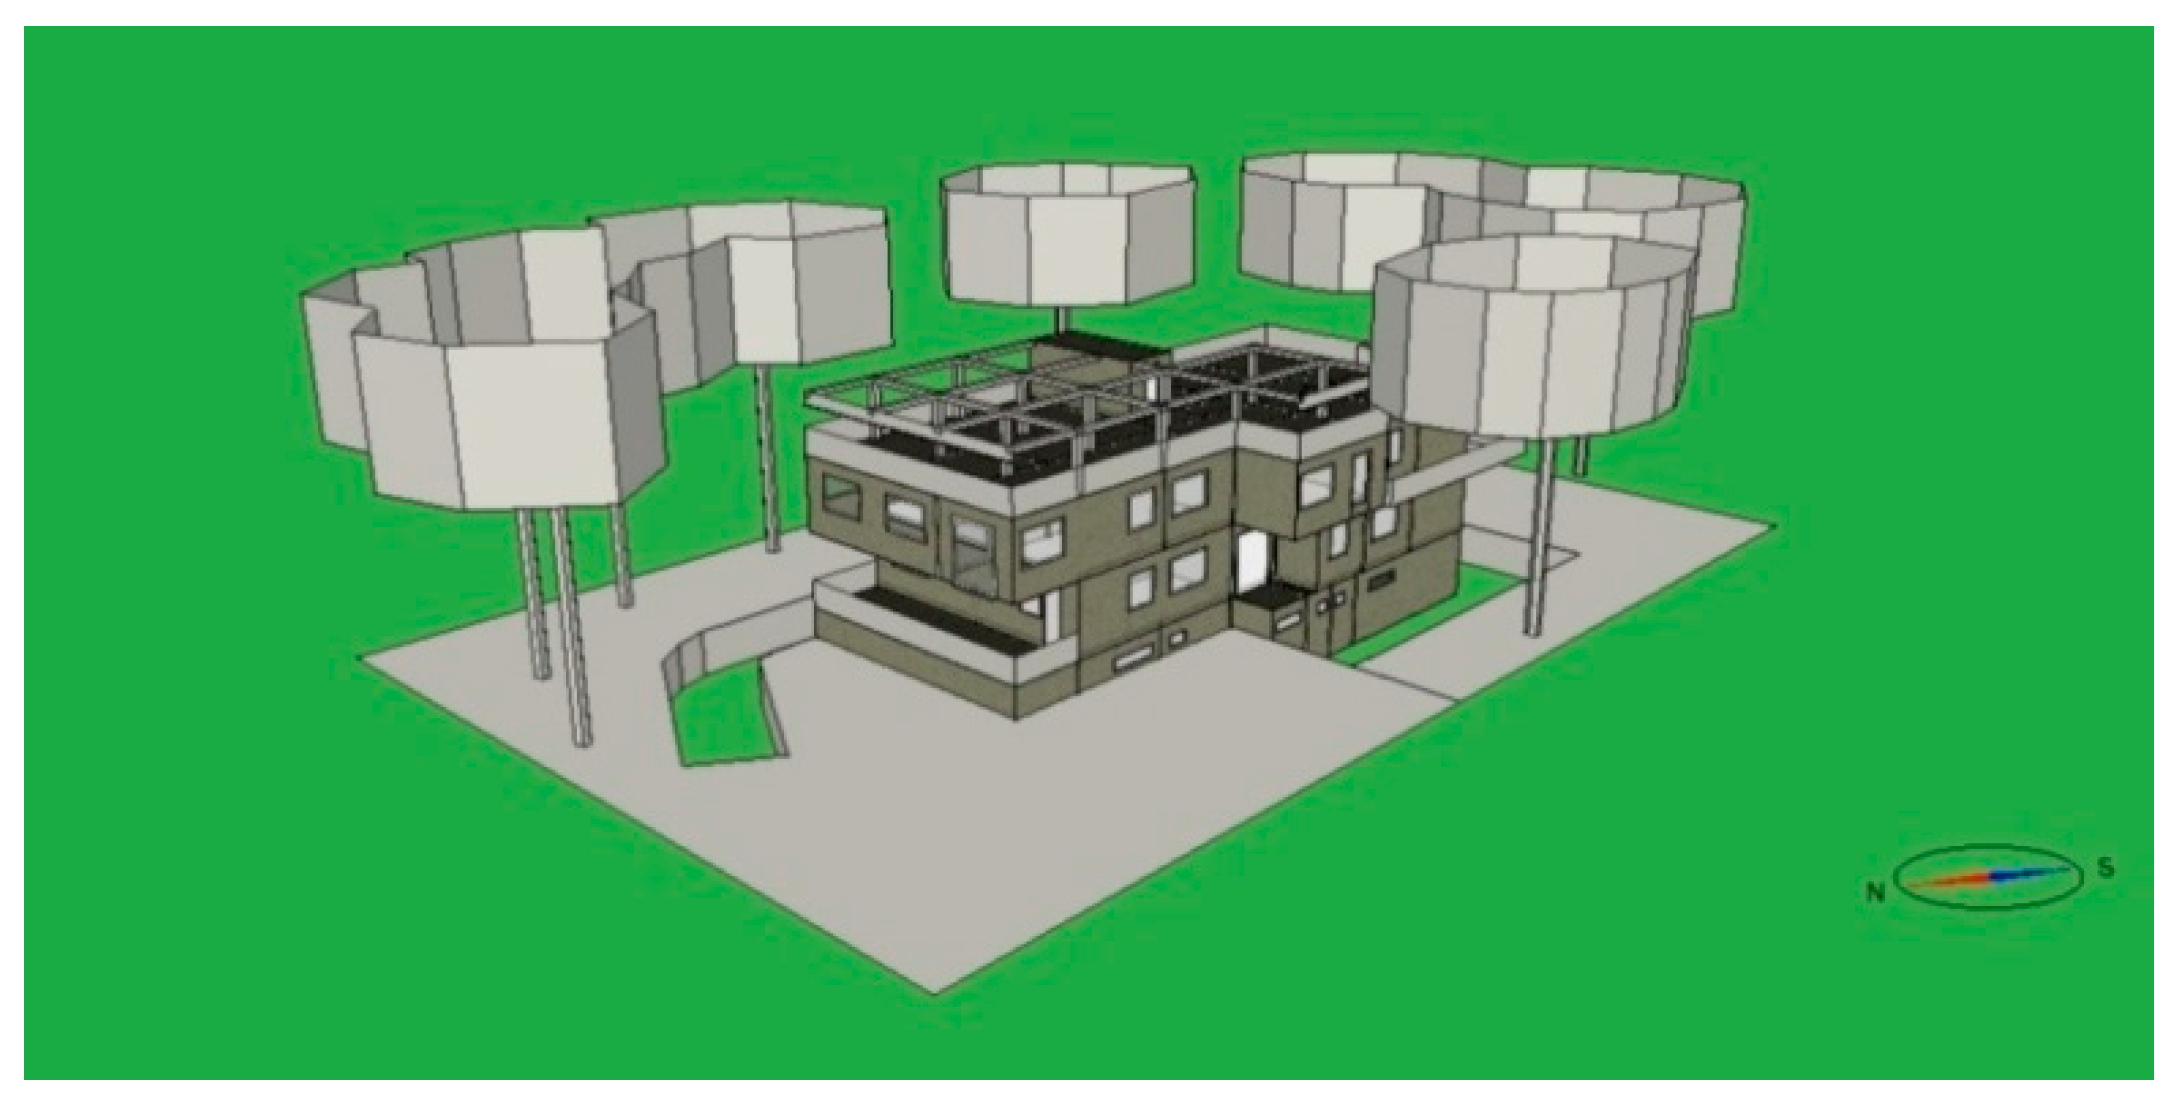
Figure 3.
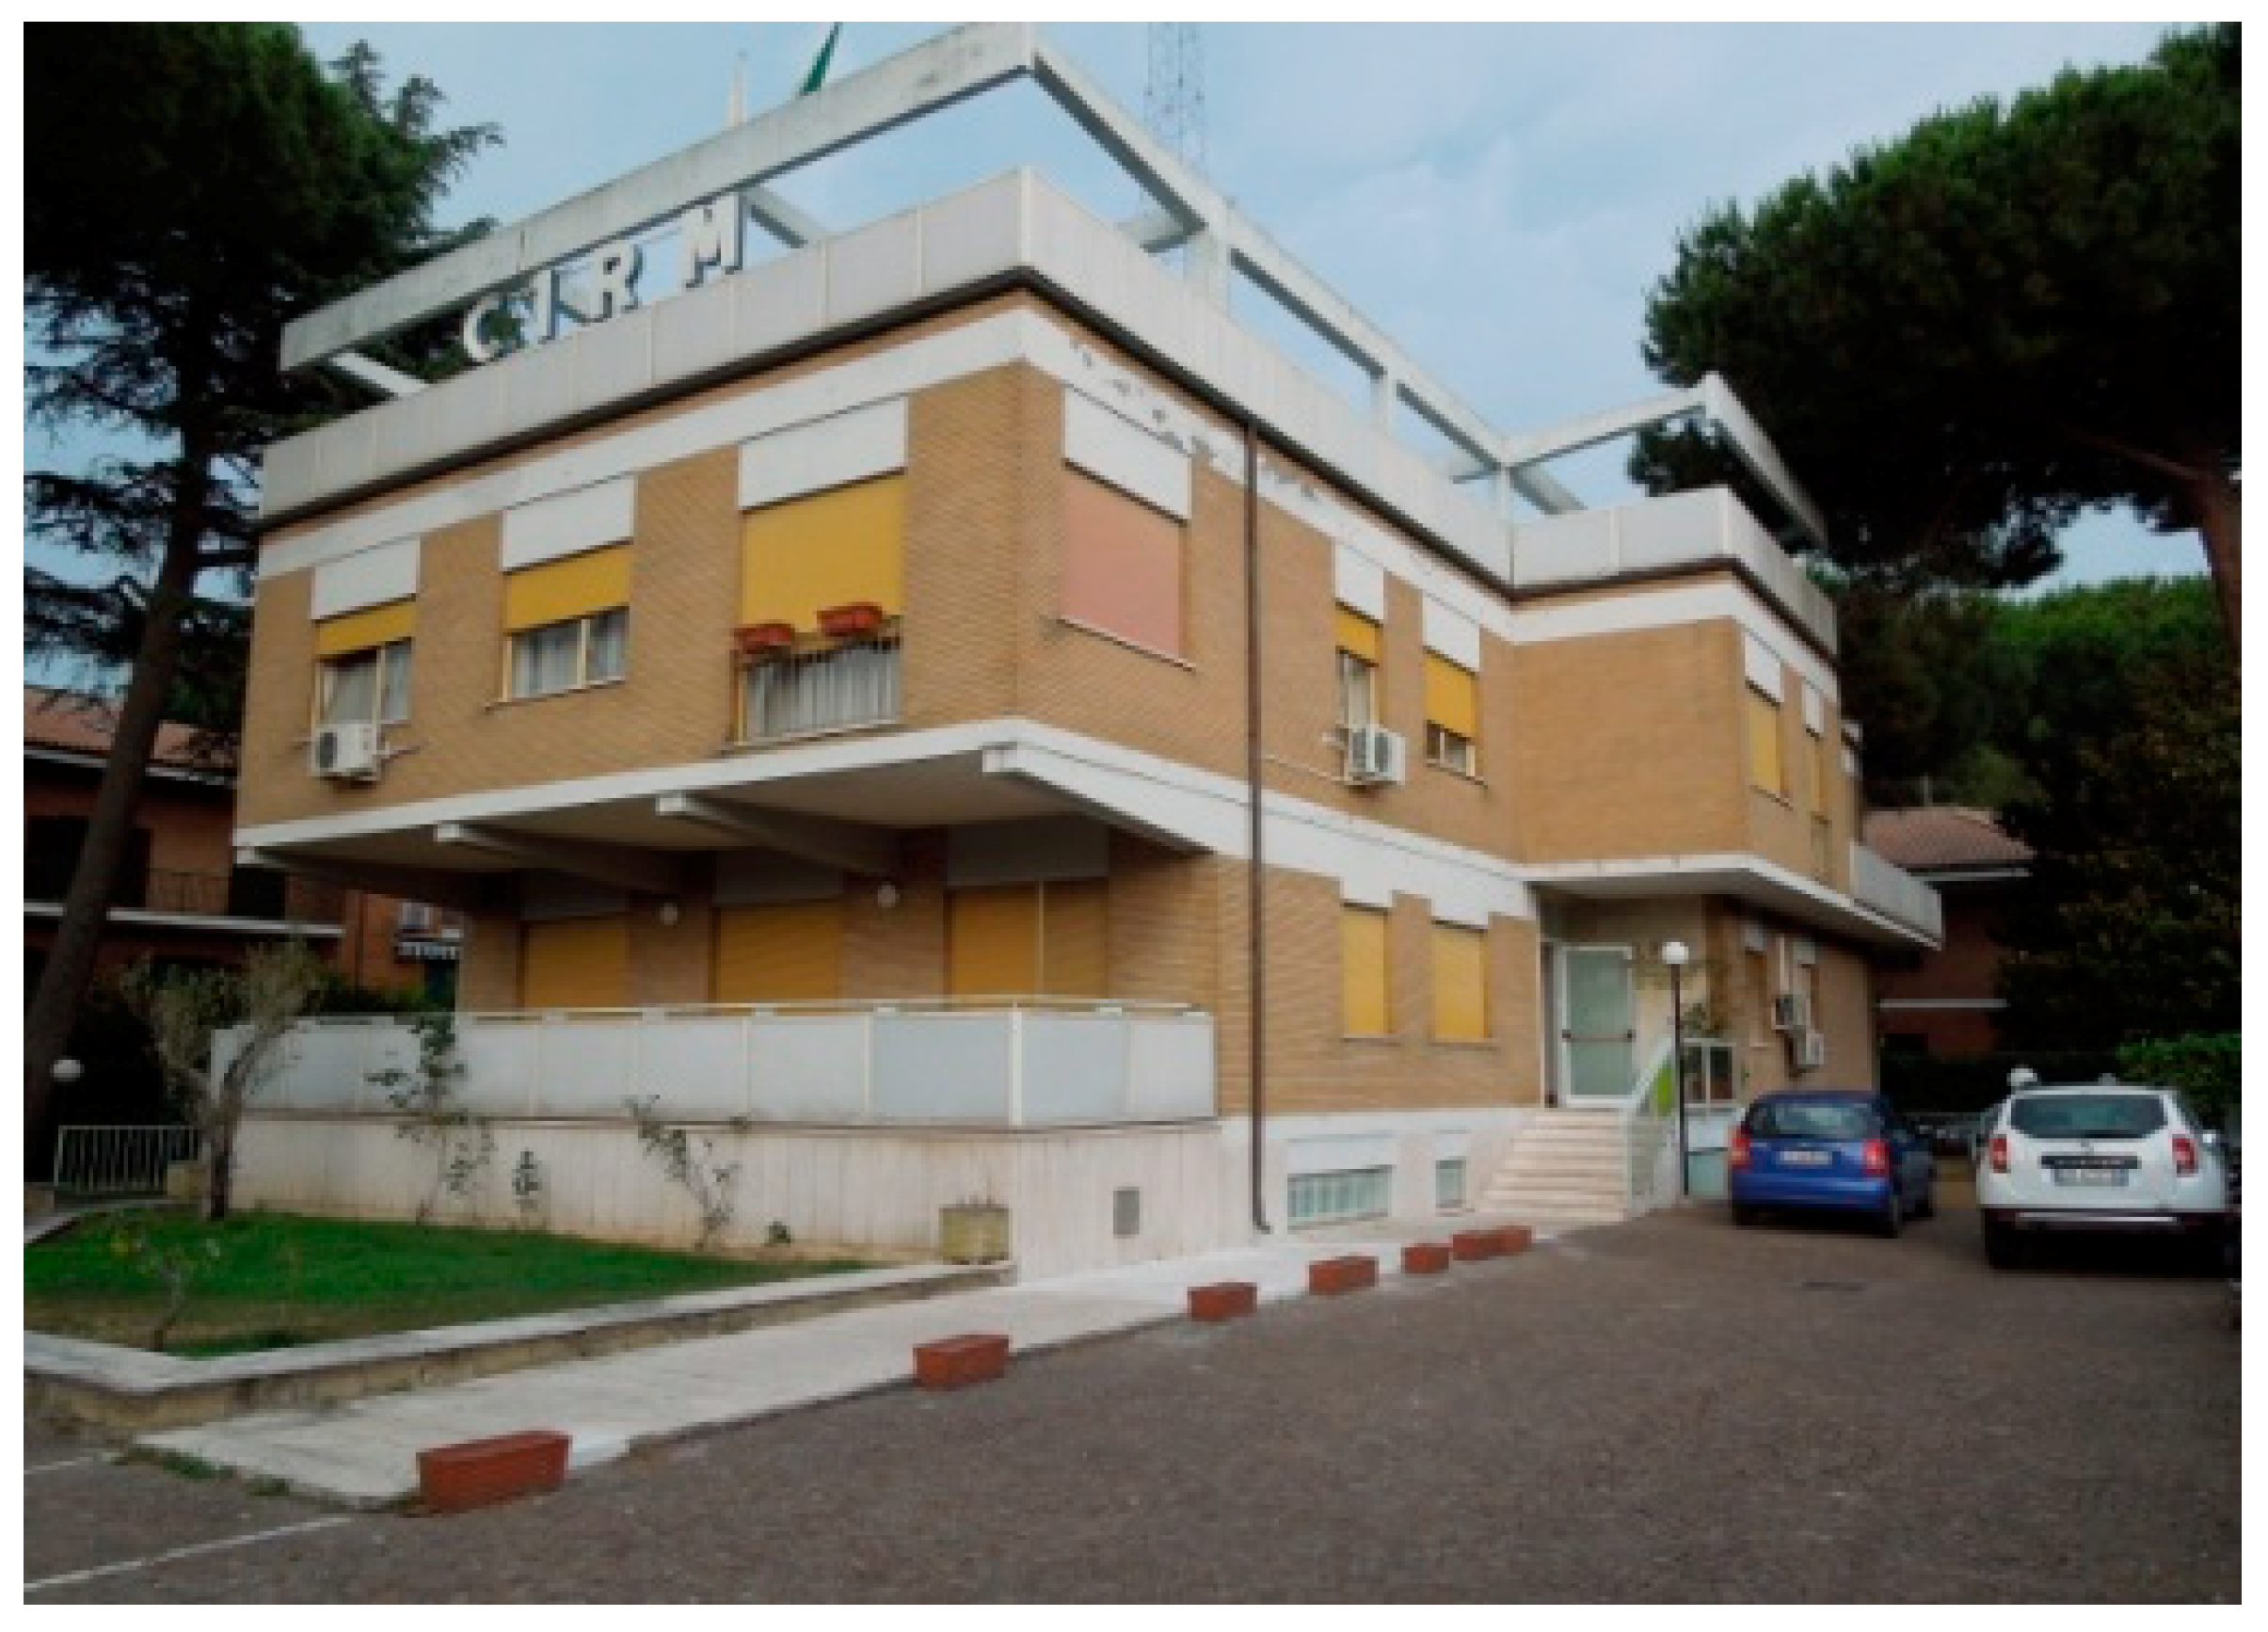
The International Radio Medical Centre (CIRM) administrative headquarter building.
Figure 3.
The International Radio Medical Centre (CIRM) administrative headquarter building.
Figure 4.
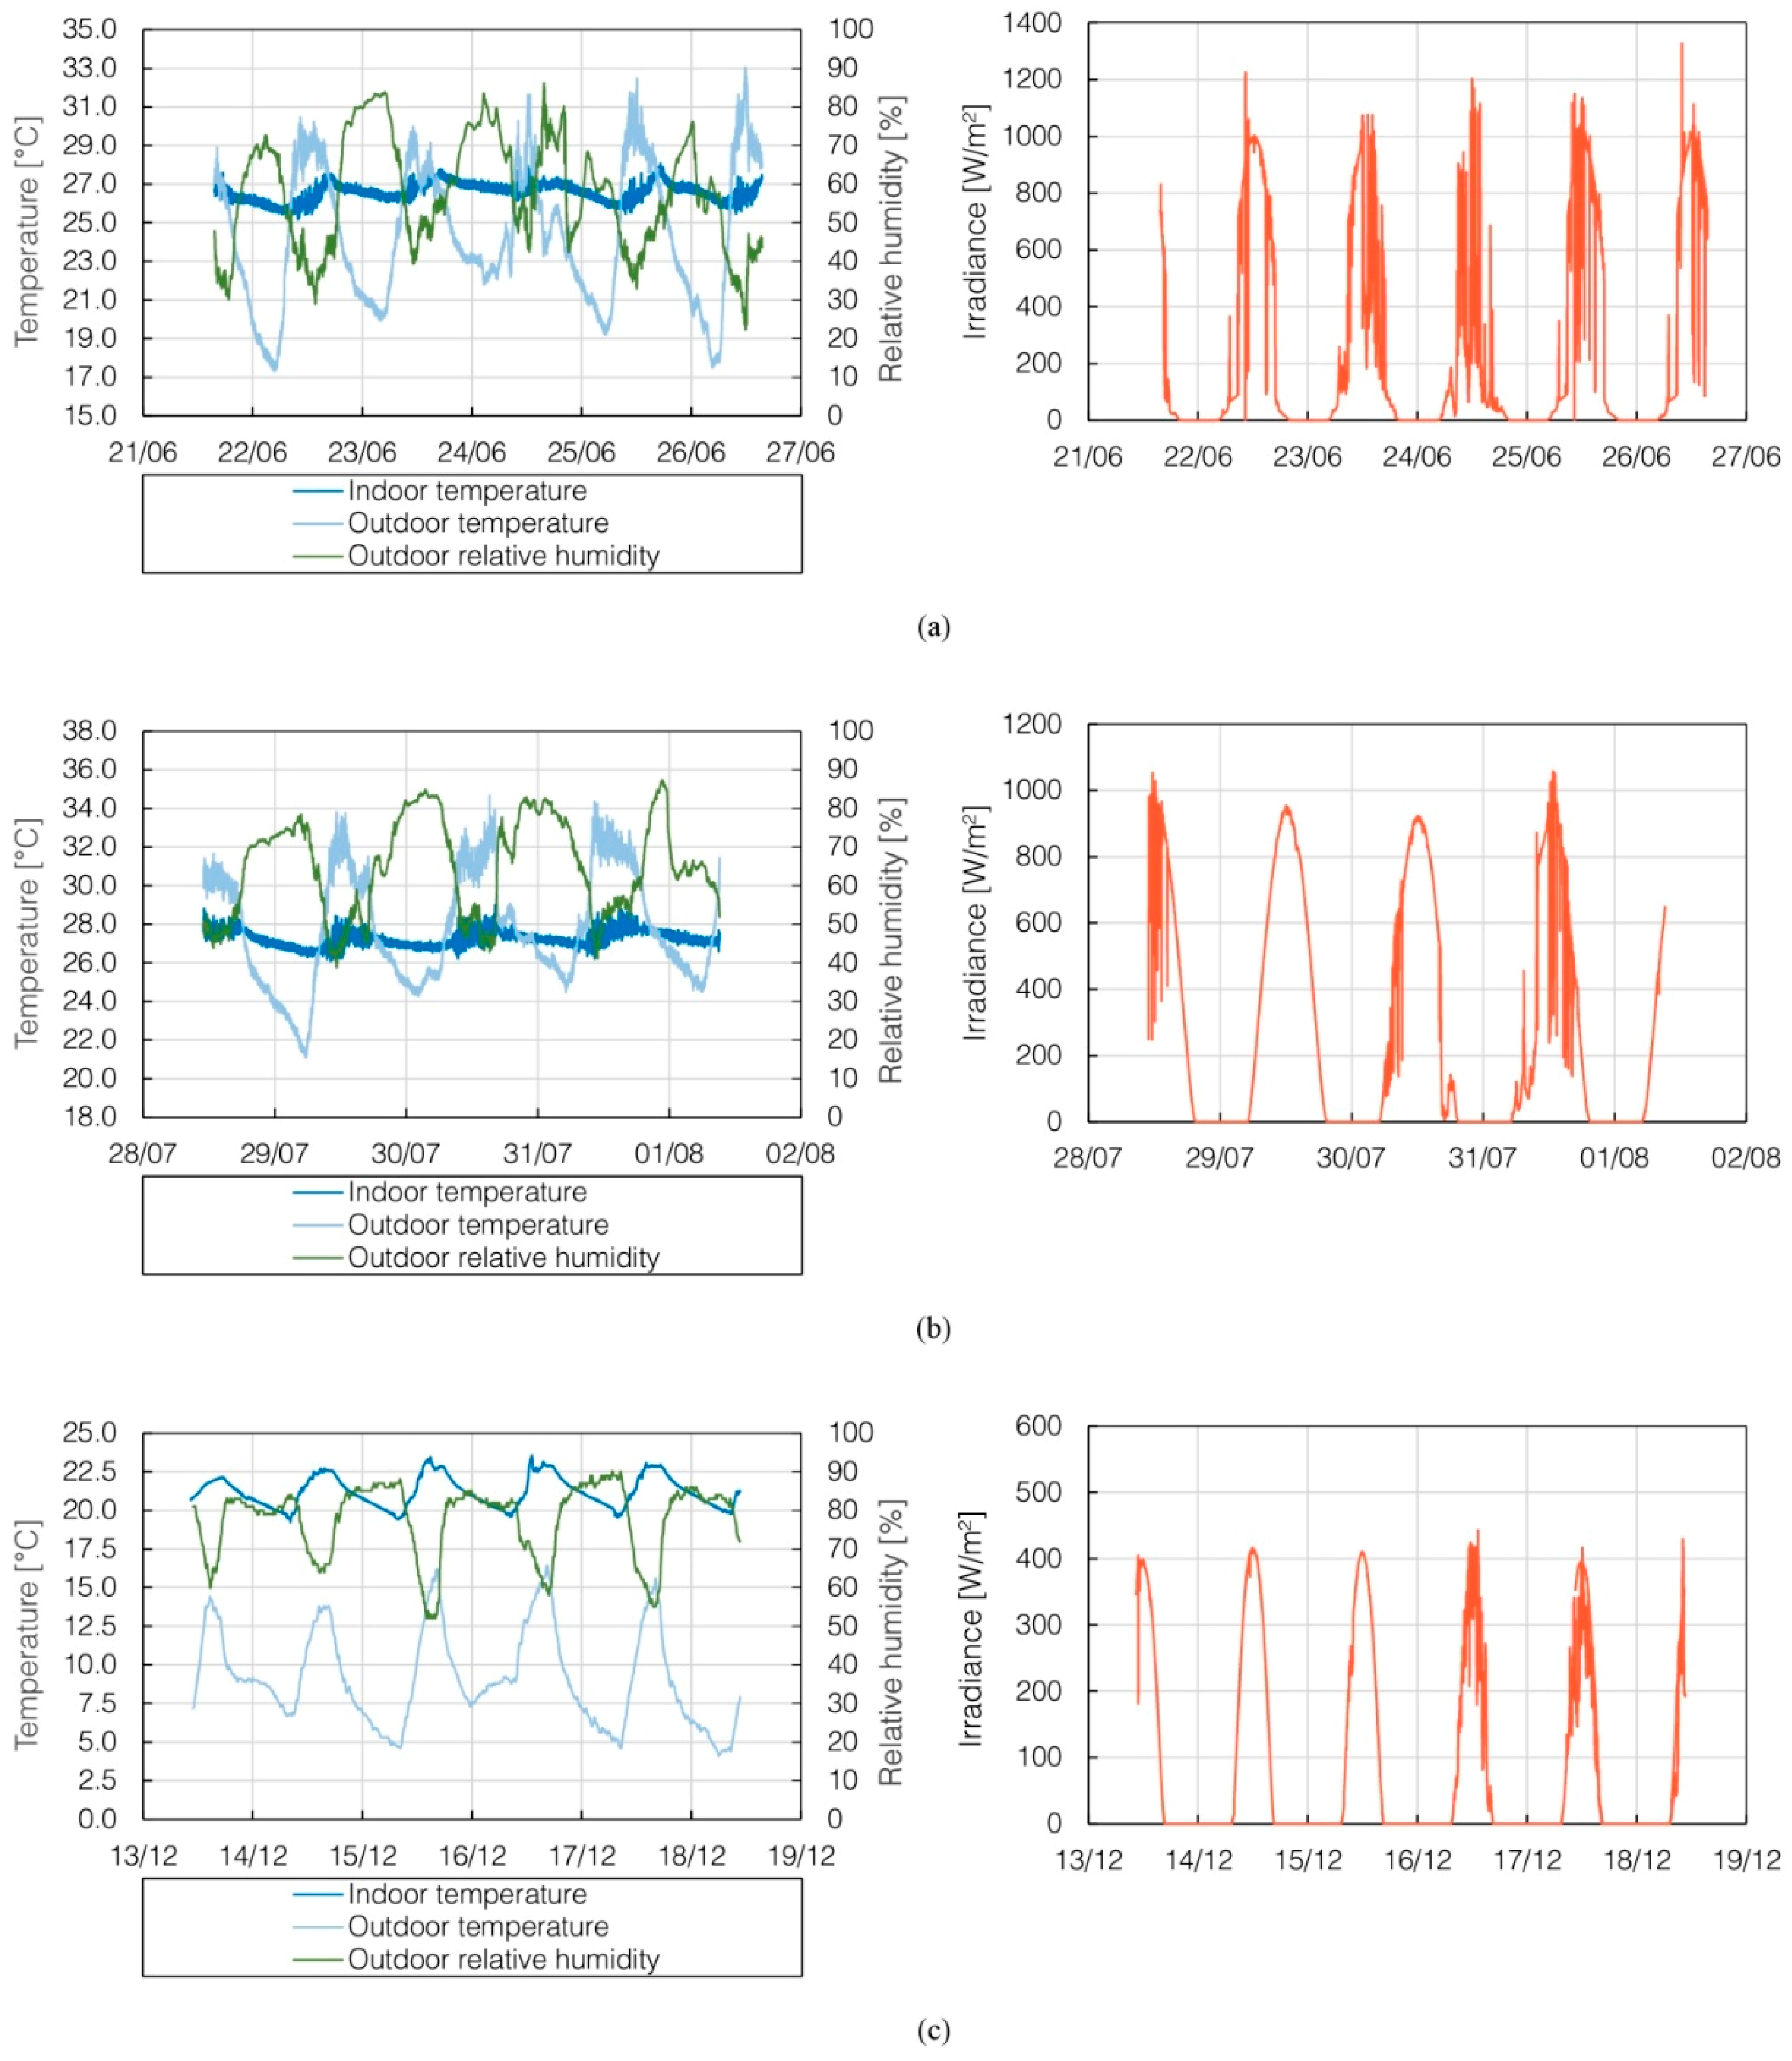
Data acquired during the measurement campaigns. (a) data from survey A; (b) data from survey B; (c) data from survey C.
Figure 4.
Data acquired during the measurement campaigns. (a) data from survey A; (b) data from survey B; (c) data from survey C.
Figure 5.
First guess model in IDA-ICE’s 3D environment.
Figure 5.
First guess model in IDA-ICE’s 3D environment.
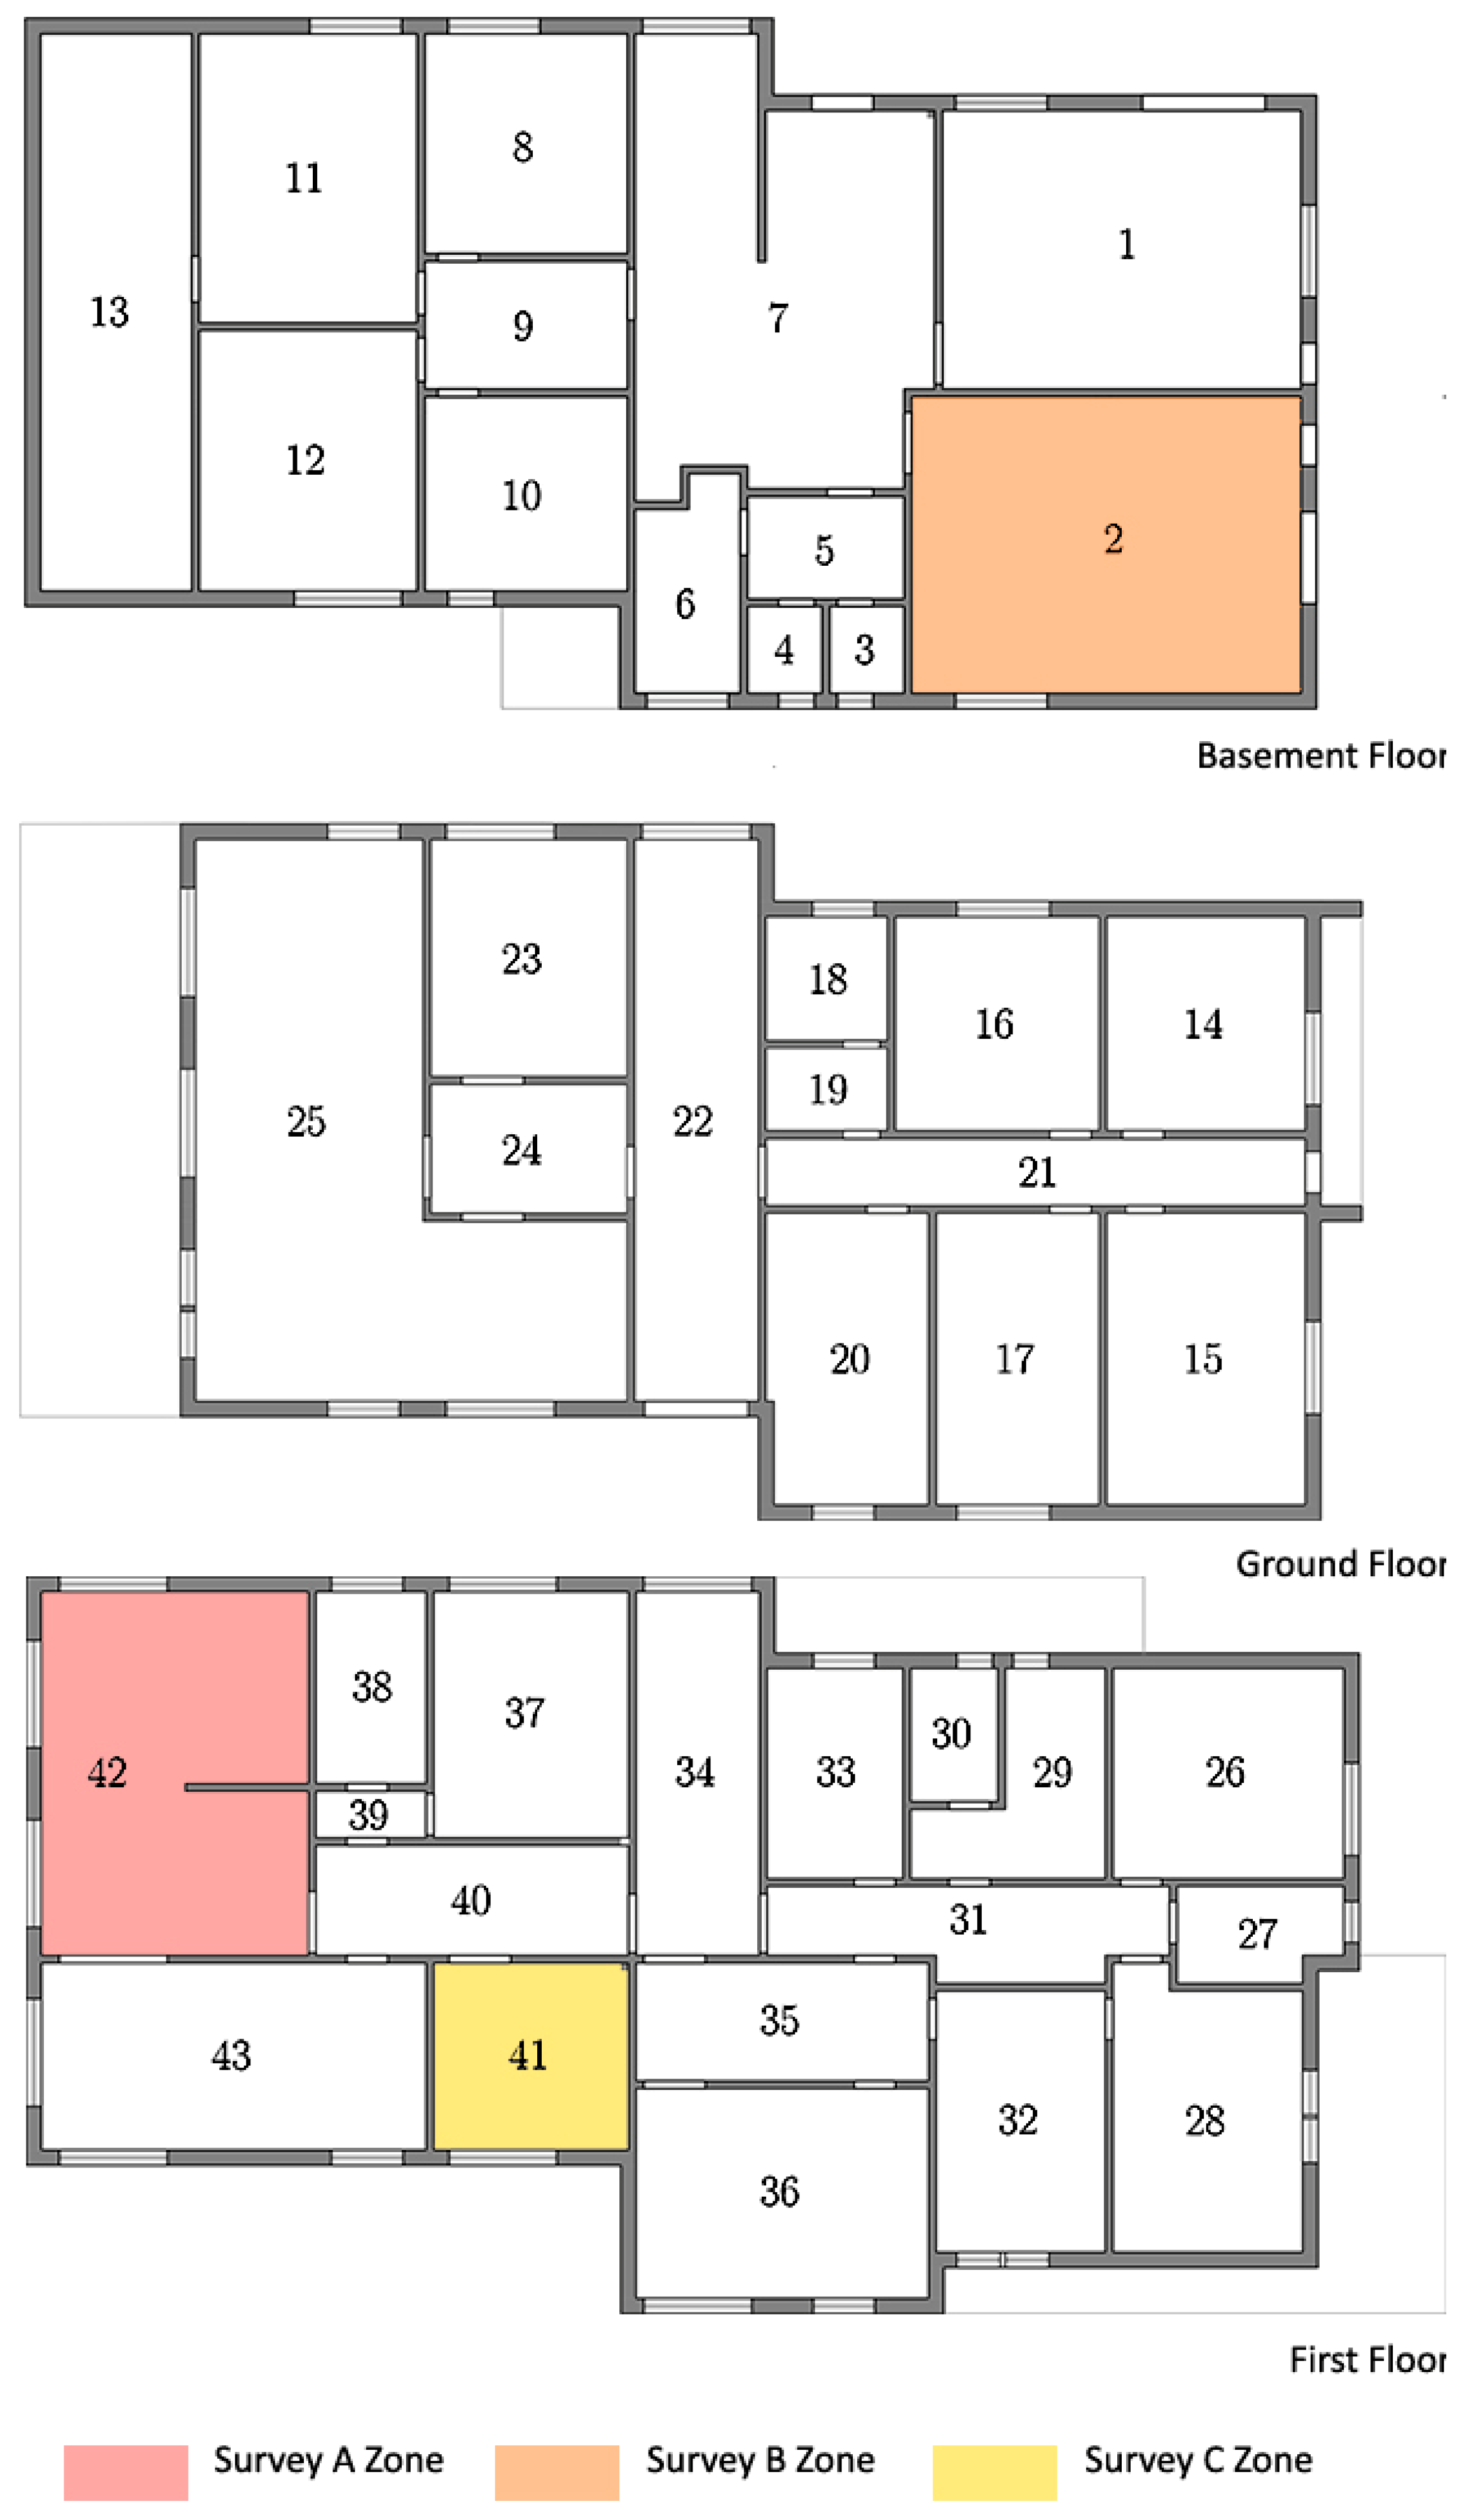
Figure 6.
Thermal zones. The highlighted zones refer to the rooms where the monitoring surveys were carried out.
Figure 6.
Thermal zones. The highlighted zones refer to the rooms where the monitoring surveys were carried out.
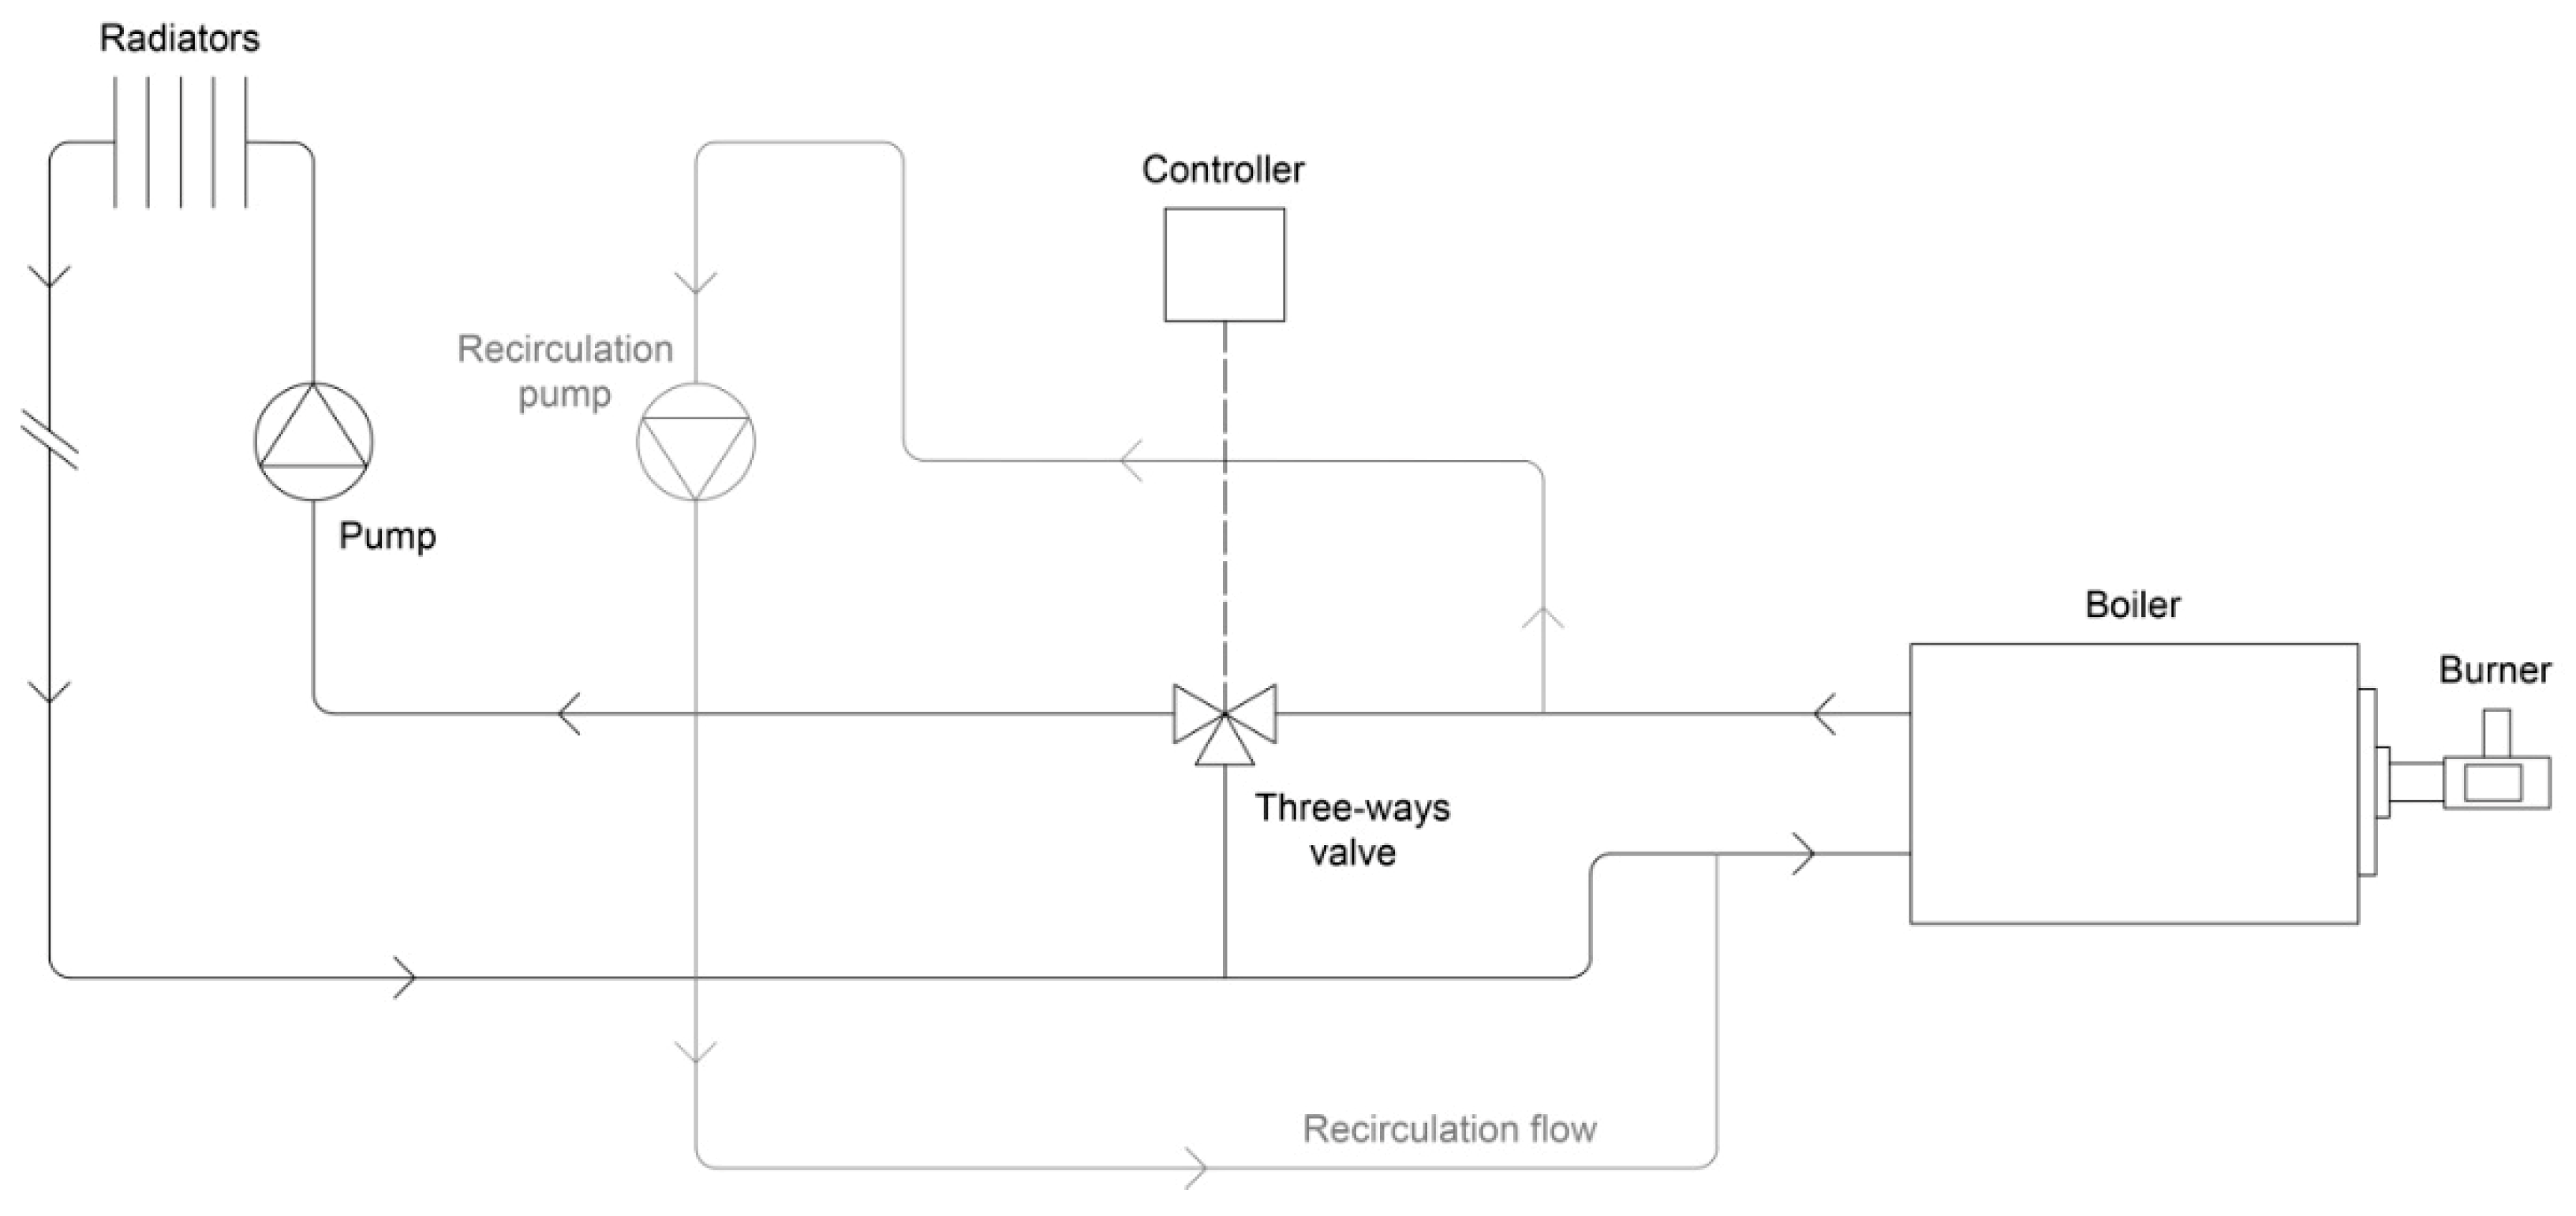
Figure 7.
Heating plant scheme.
Figure 7.
Heating plant scheme.
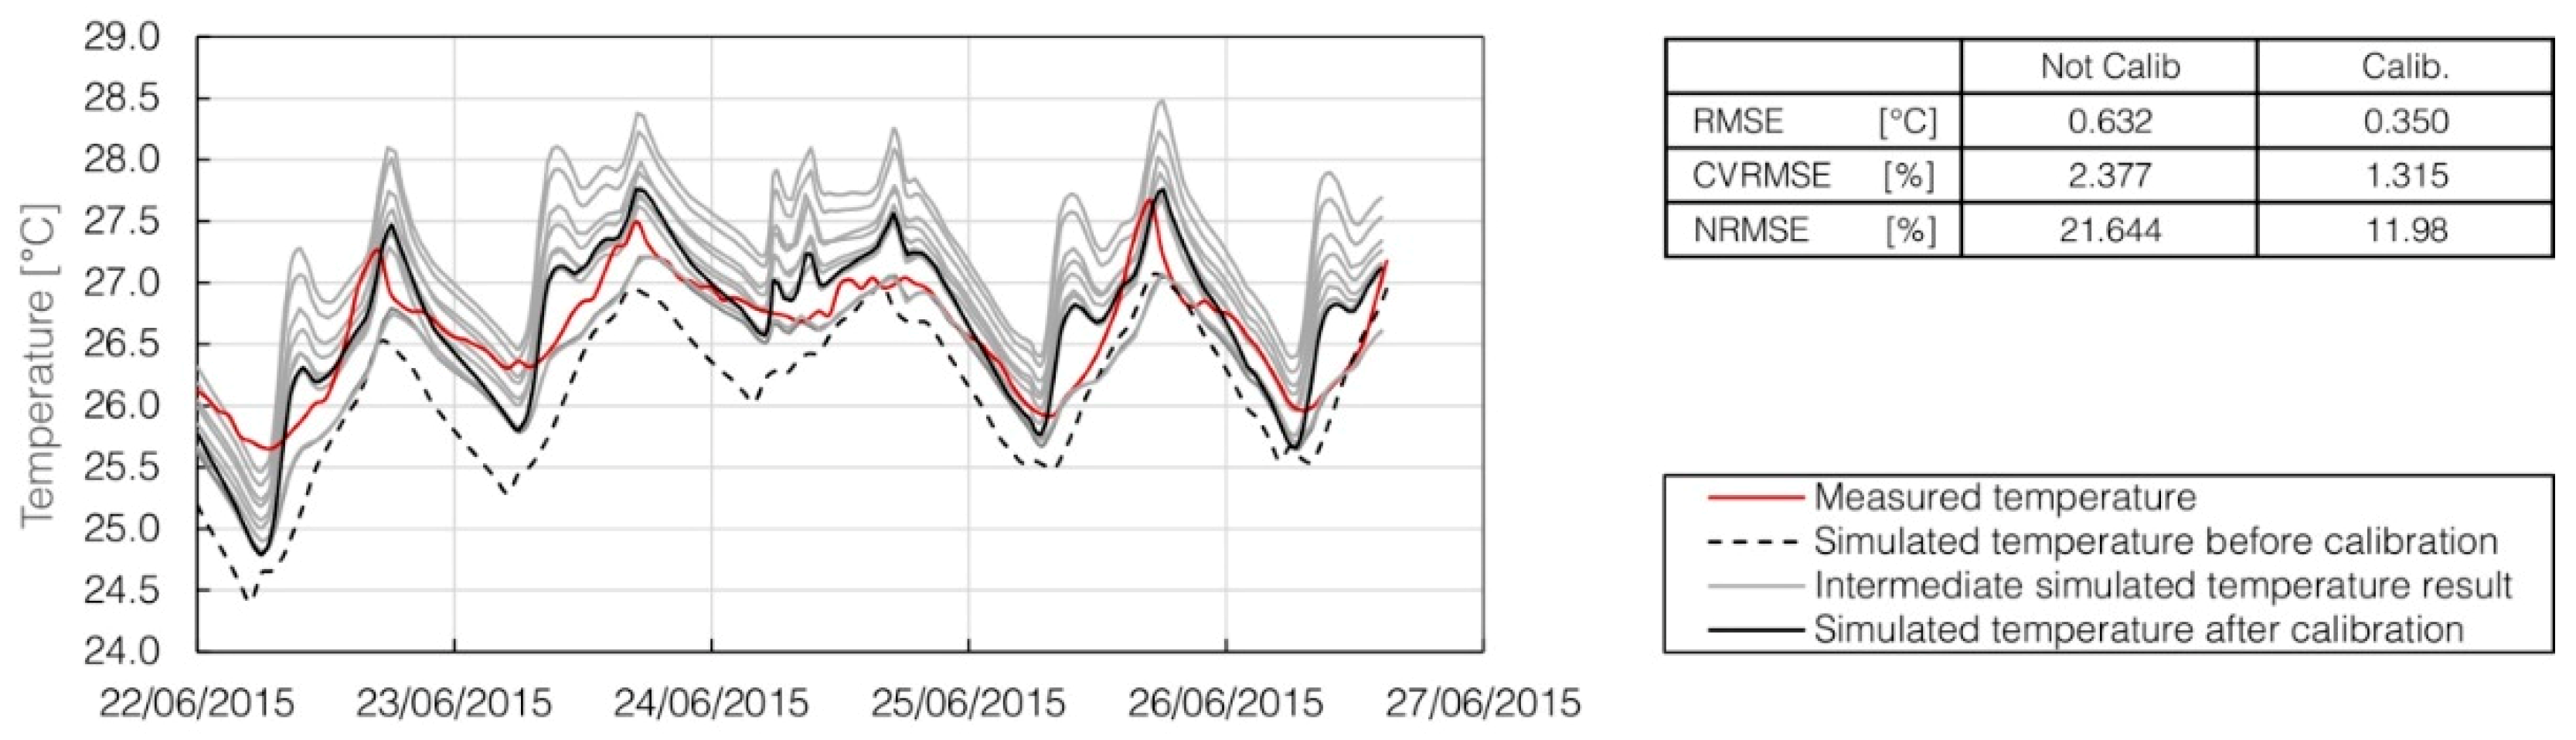
Figure 8.
Results for Calibration A. First floor, North exposure.
Figure 8.
Results for Calibration A. First floor, North exposure.
Figure 9.
Results for Calibration B. Basement, South exposure.
Figure 9.
Results for Calibration B. Basement, South exposure.
Figure 10.
Results from Calibration C. First floor, North-West exposure.
Figure 10.
Results from Calibration C. First floor, North-West exposure.
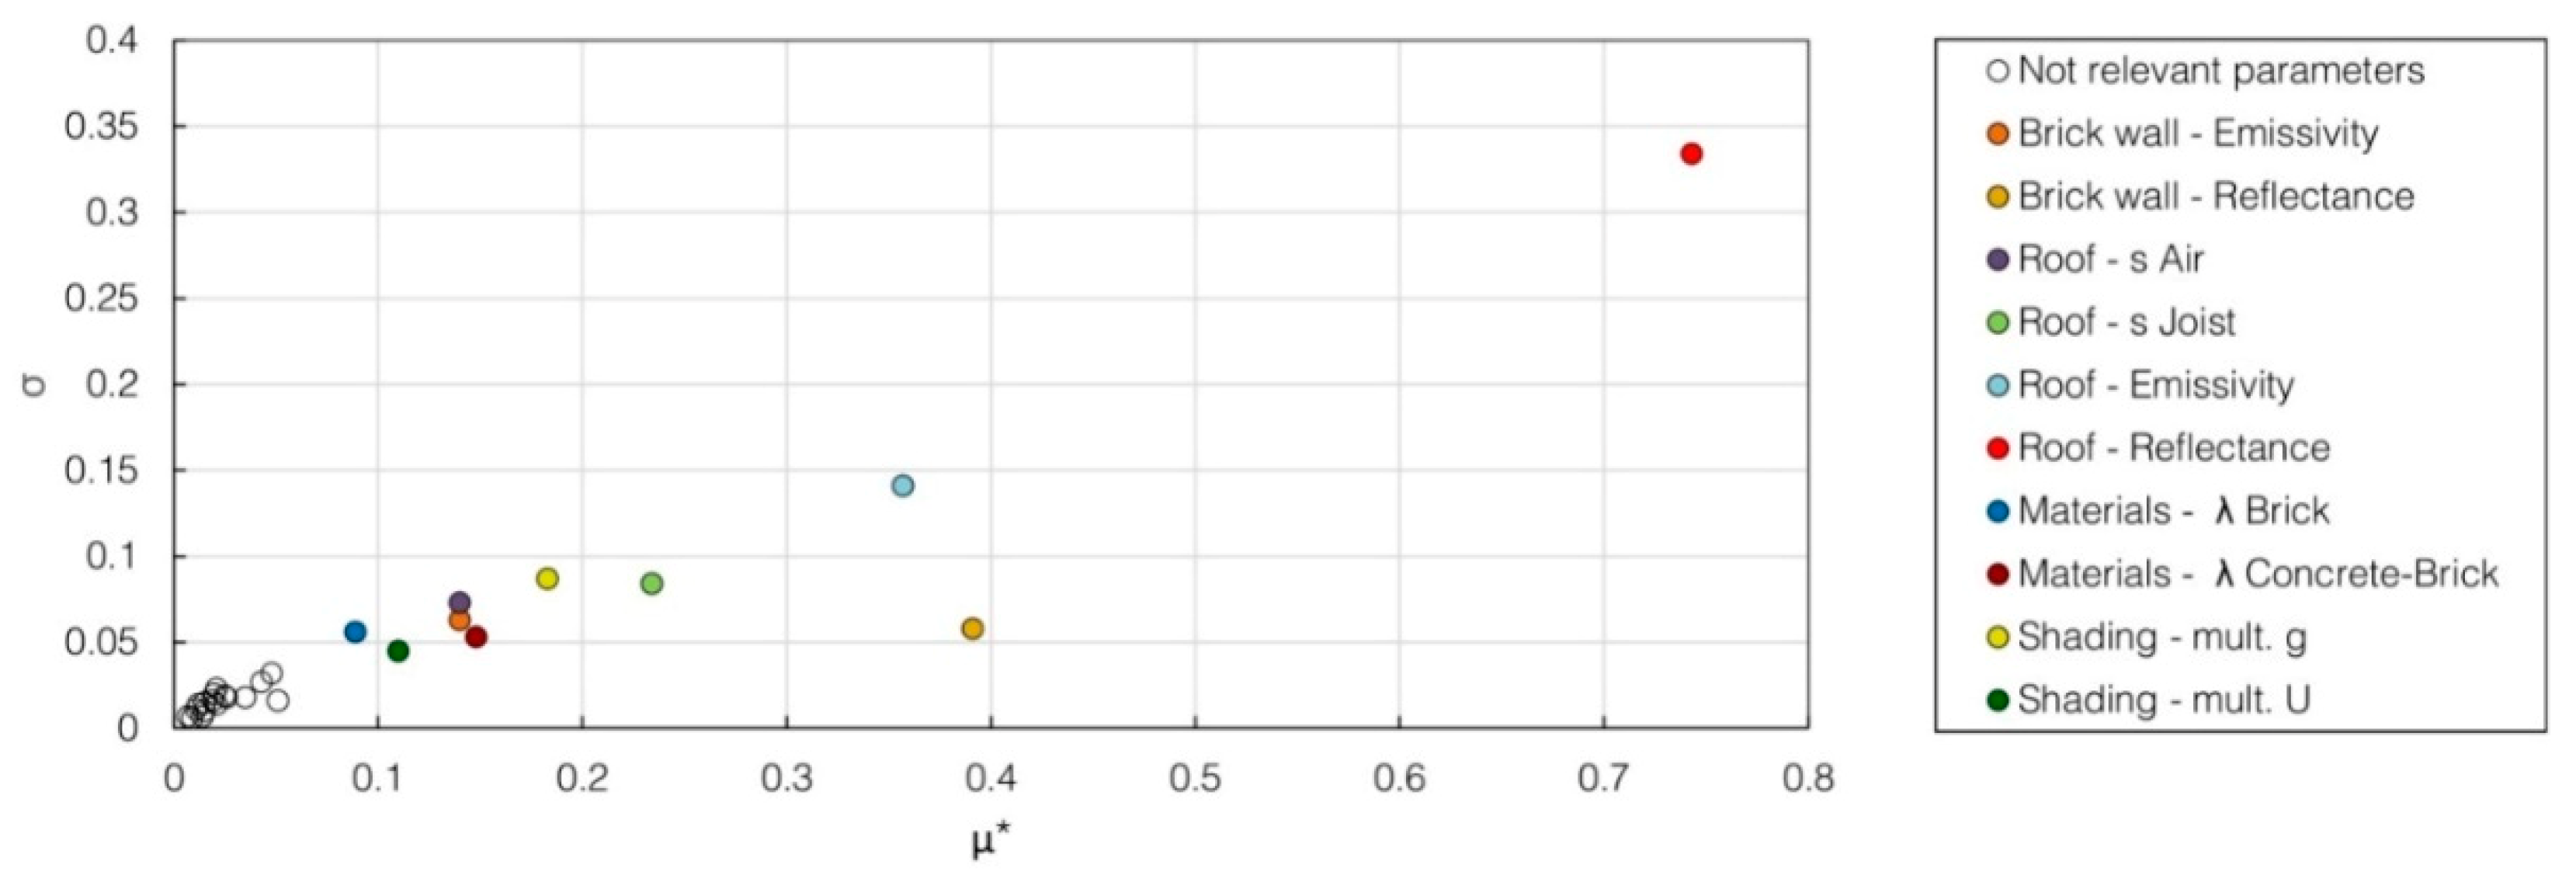
Figure 11.
Results for Sensitivity Analysis A. First floor, North exposure.
Figure 11.
Results for Sensitivity Analysis A. First floor, North exposure.
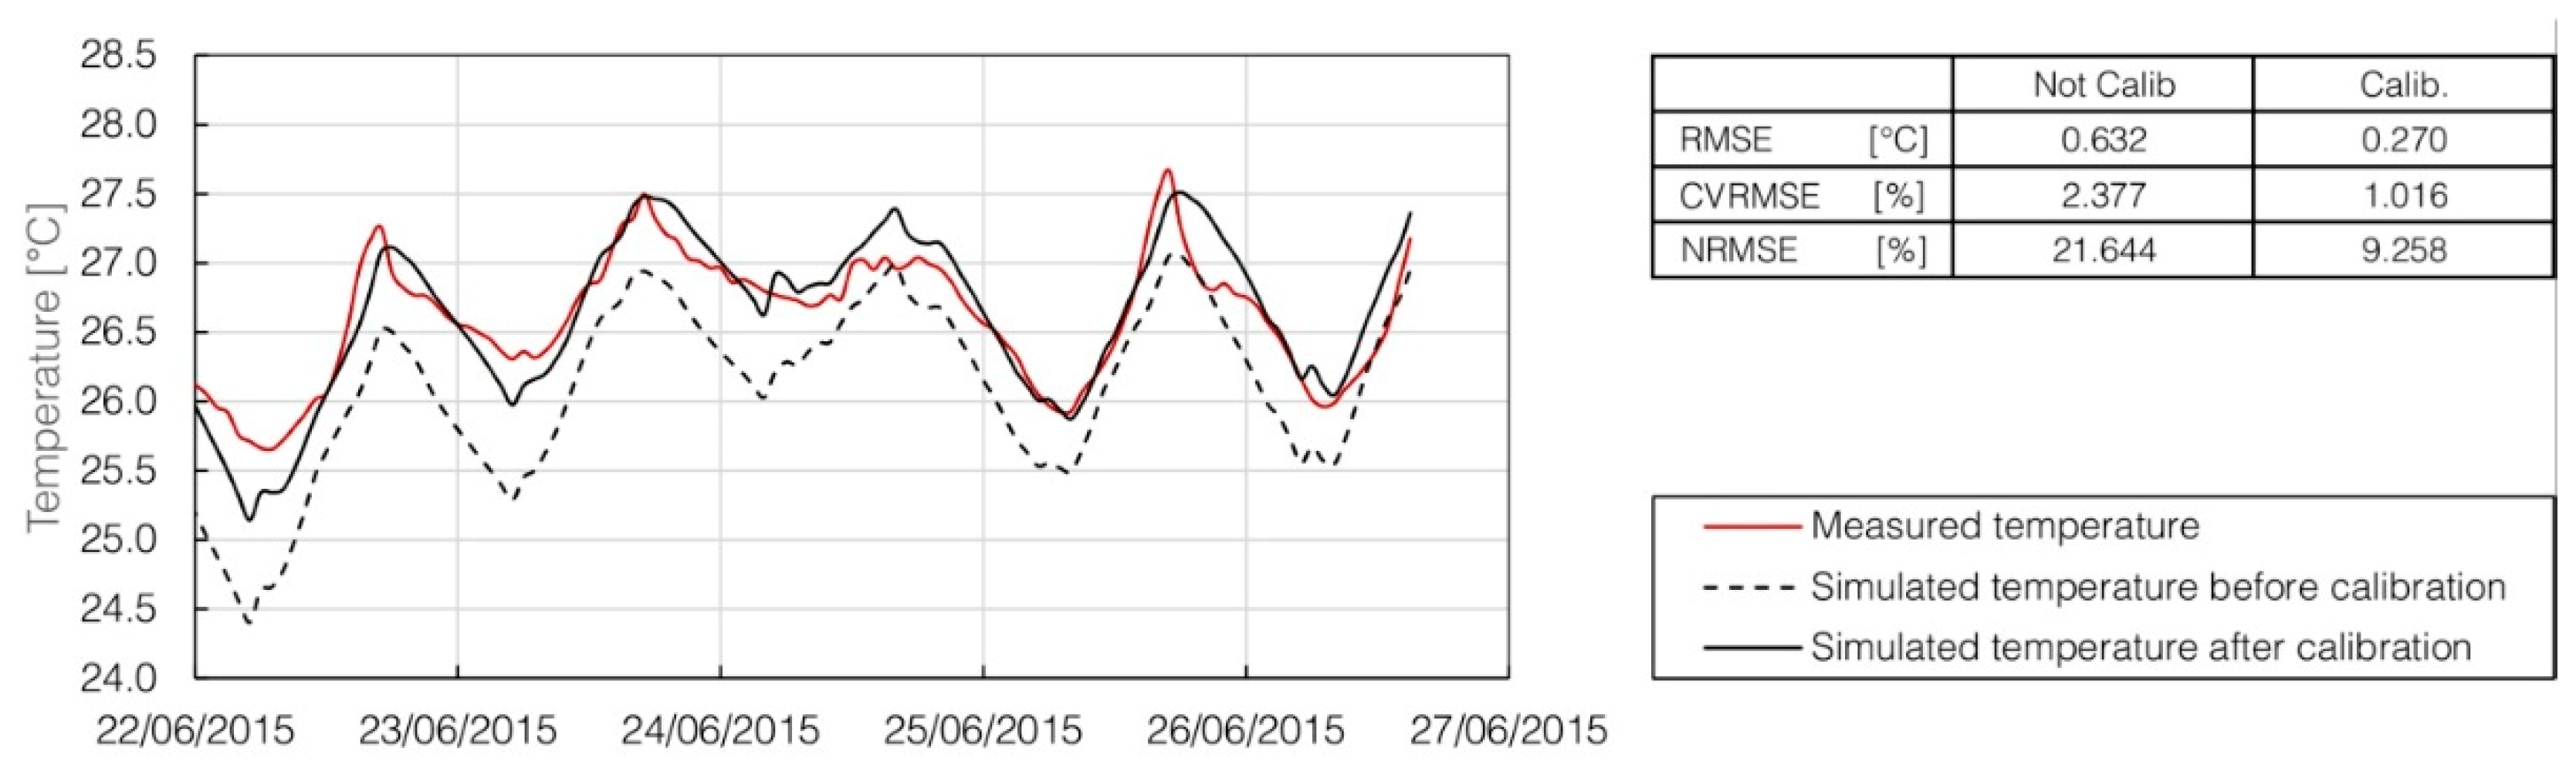
Figure 12.
Results for Calibration A. First floor, North exposure.
Figure 12.
Results for Calibration A. First floor, North exposure.
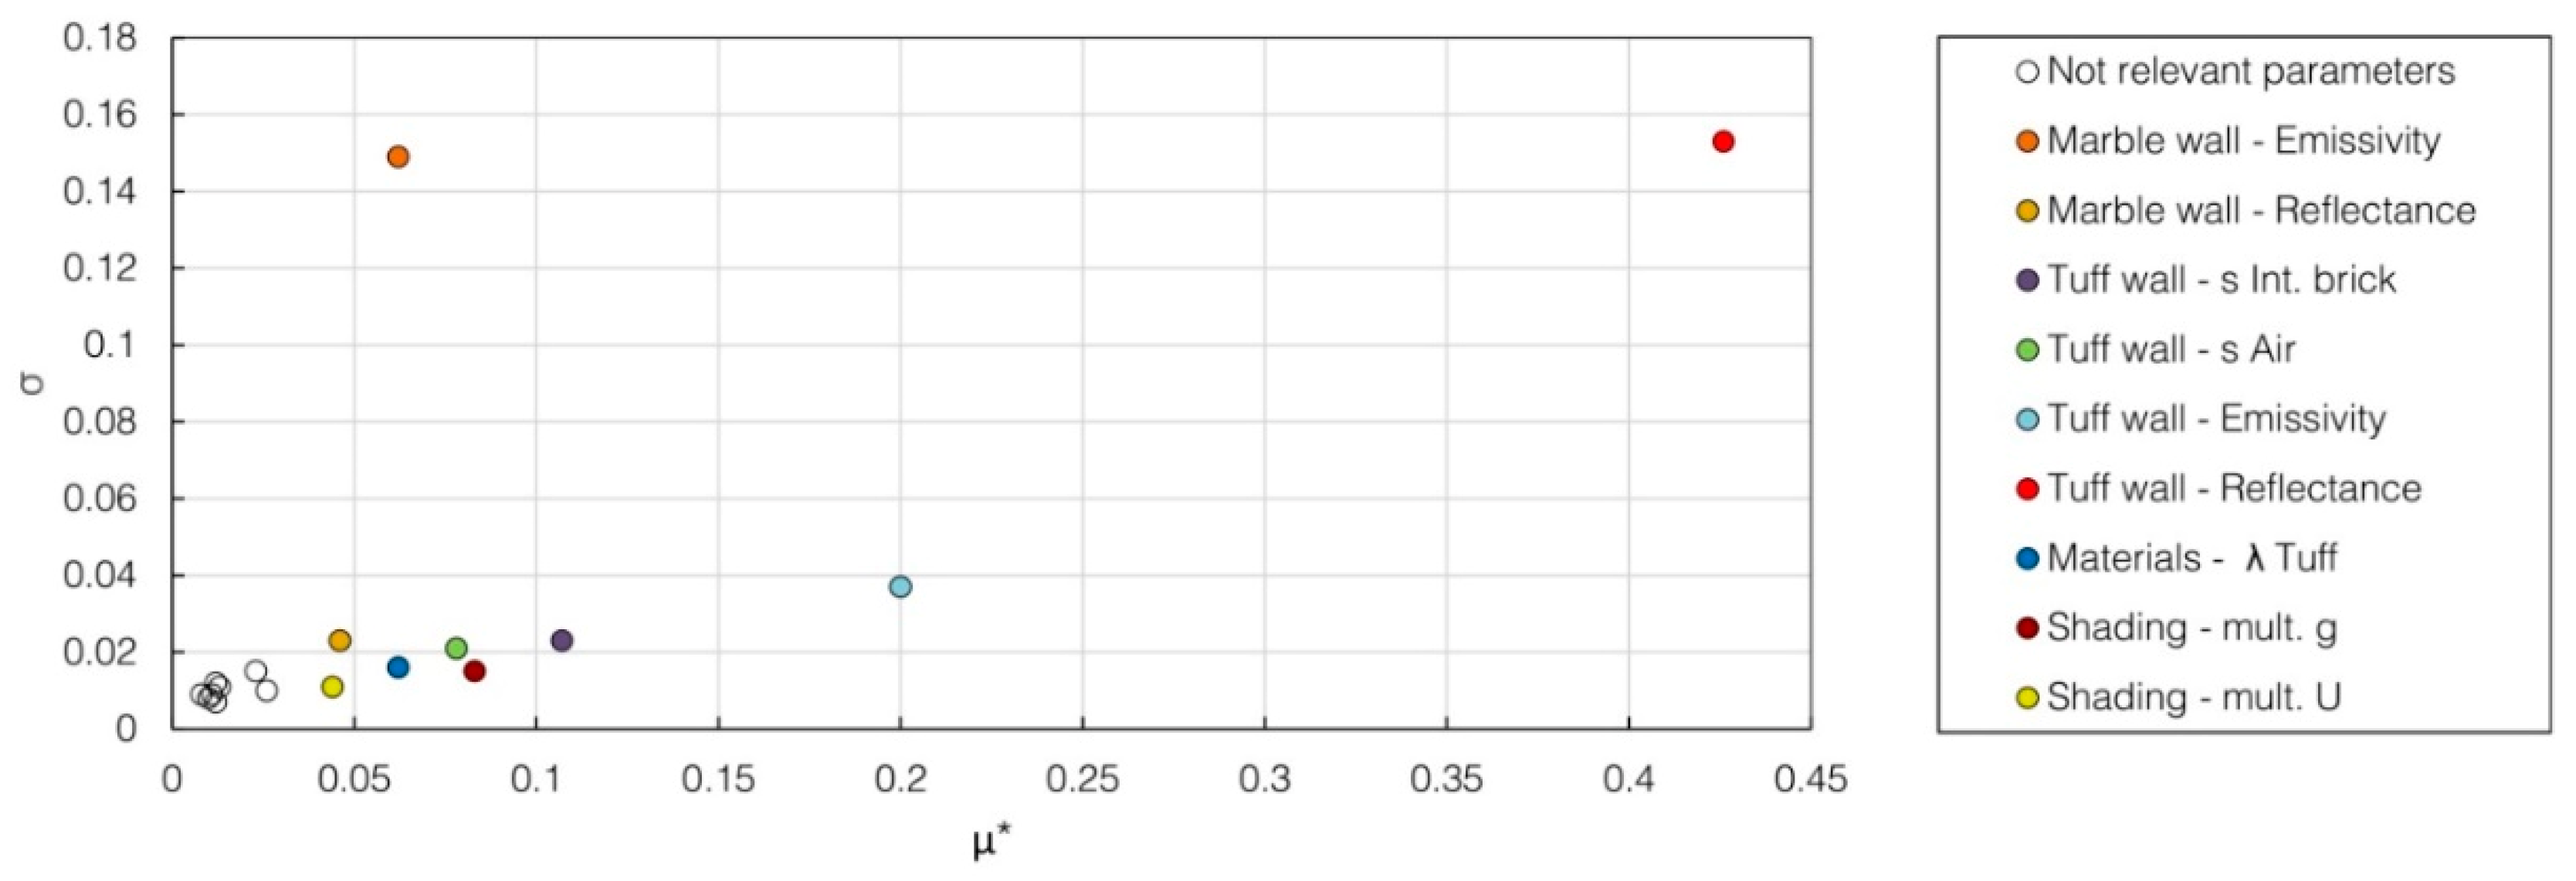
Figure 13.
Results for Sensitivity Analysis B. Basement, South exposure.
Figure 13.
Results for Sensitivity Analysis B. Basement, South exposure.
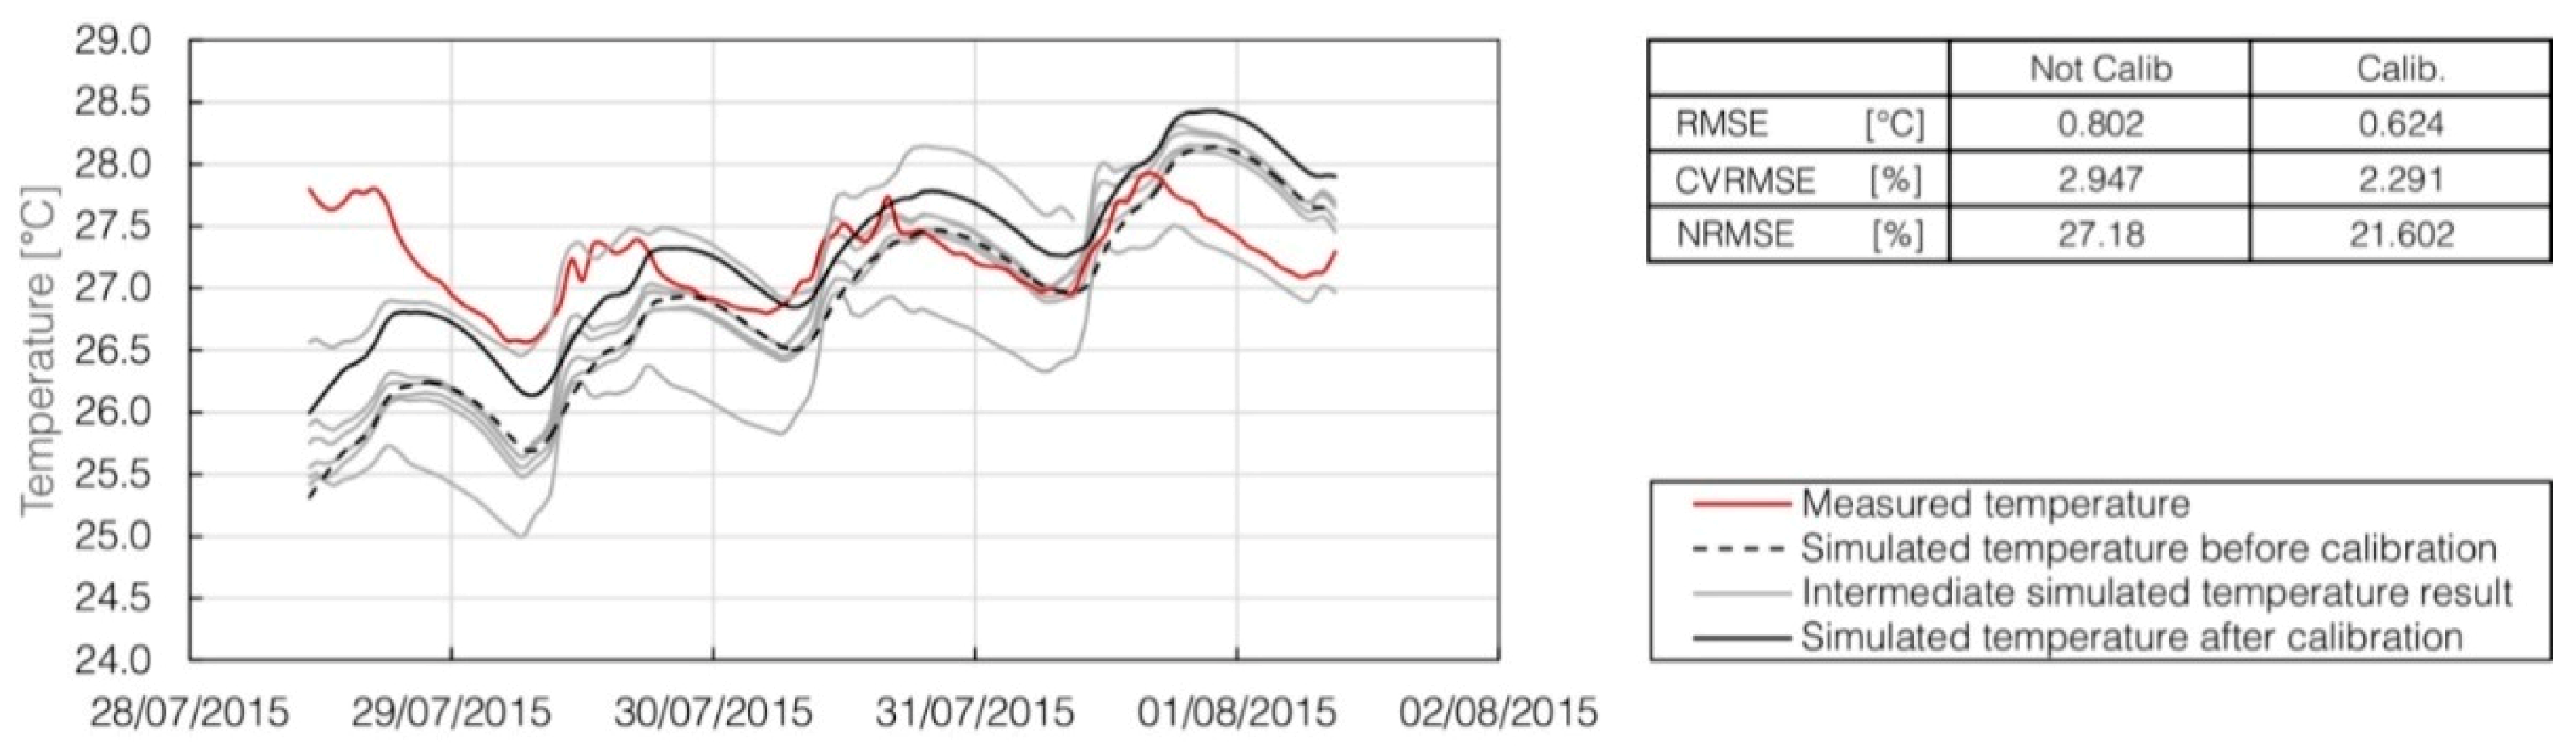
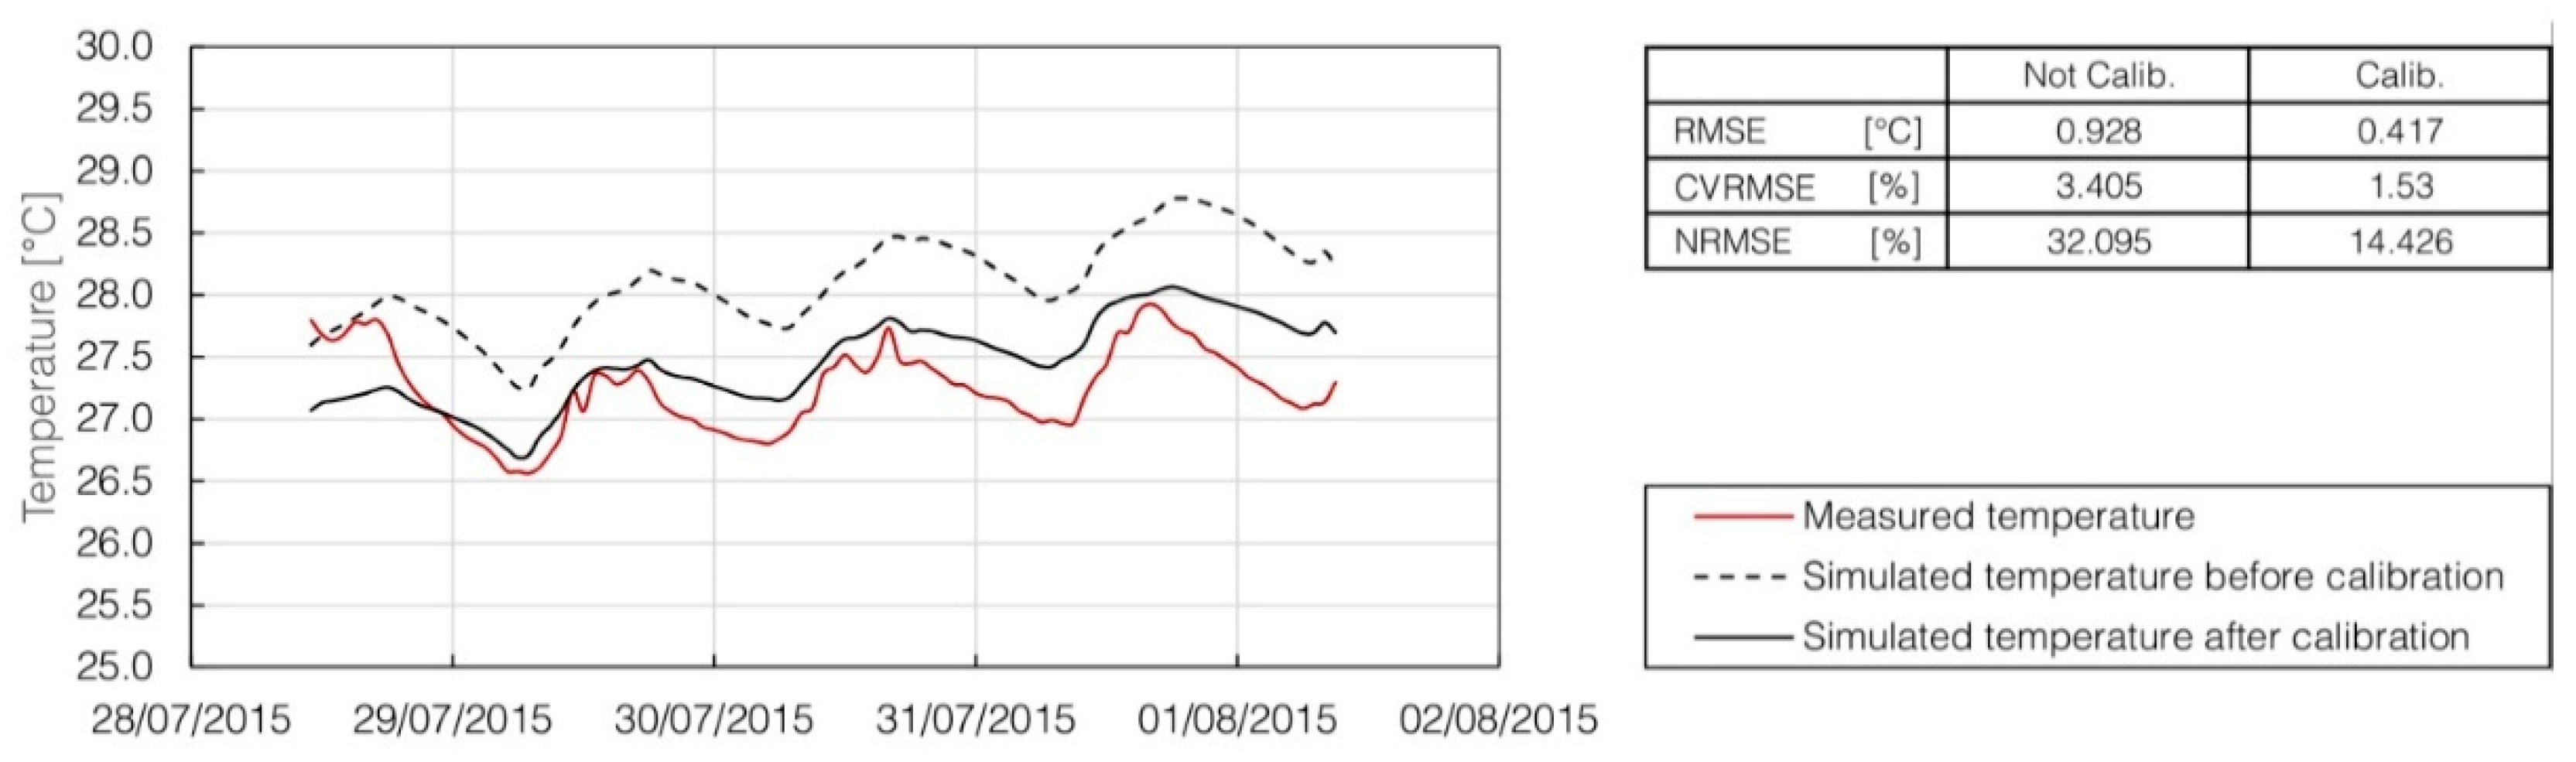
Figure 14.
Results for Calibration B. Basement, South exposure.
Figure 14.
Results for Calibration B. Basement, South exposure.
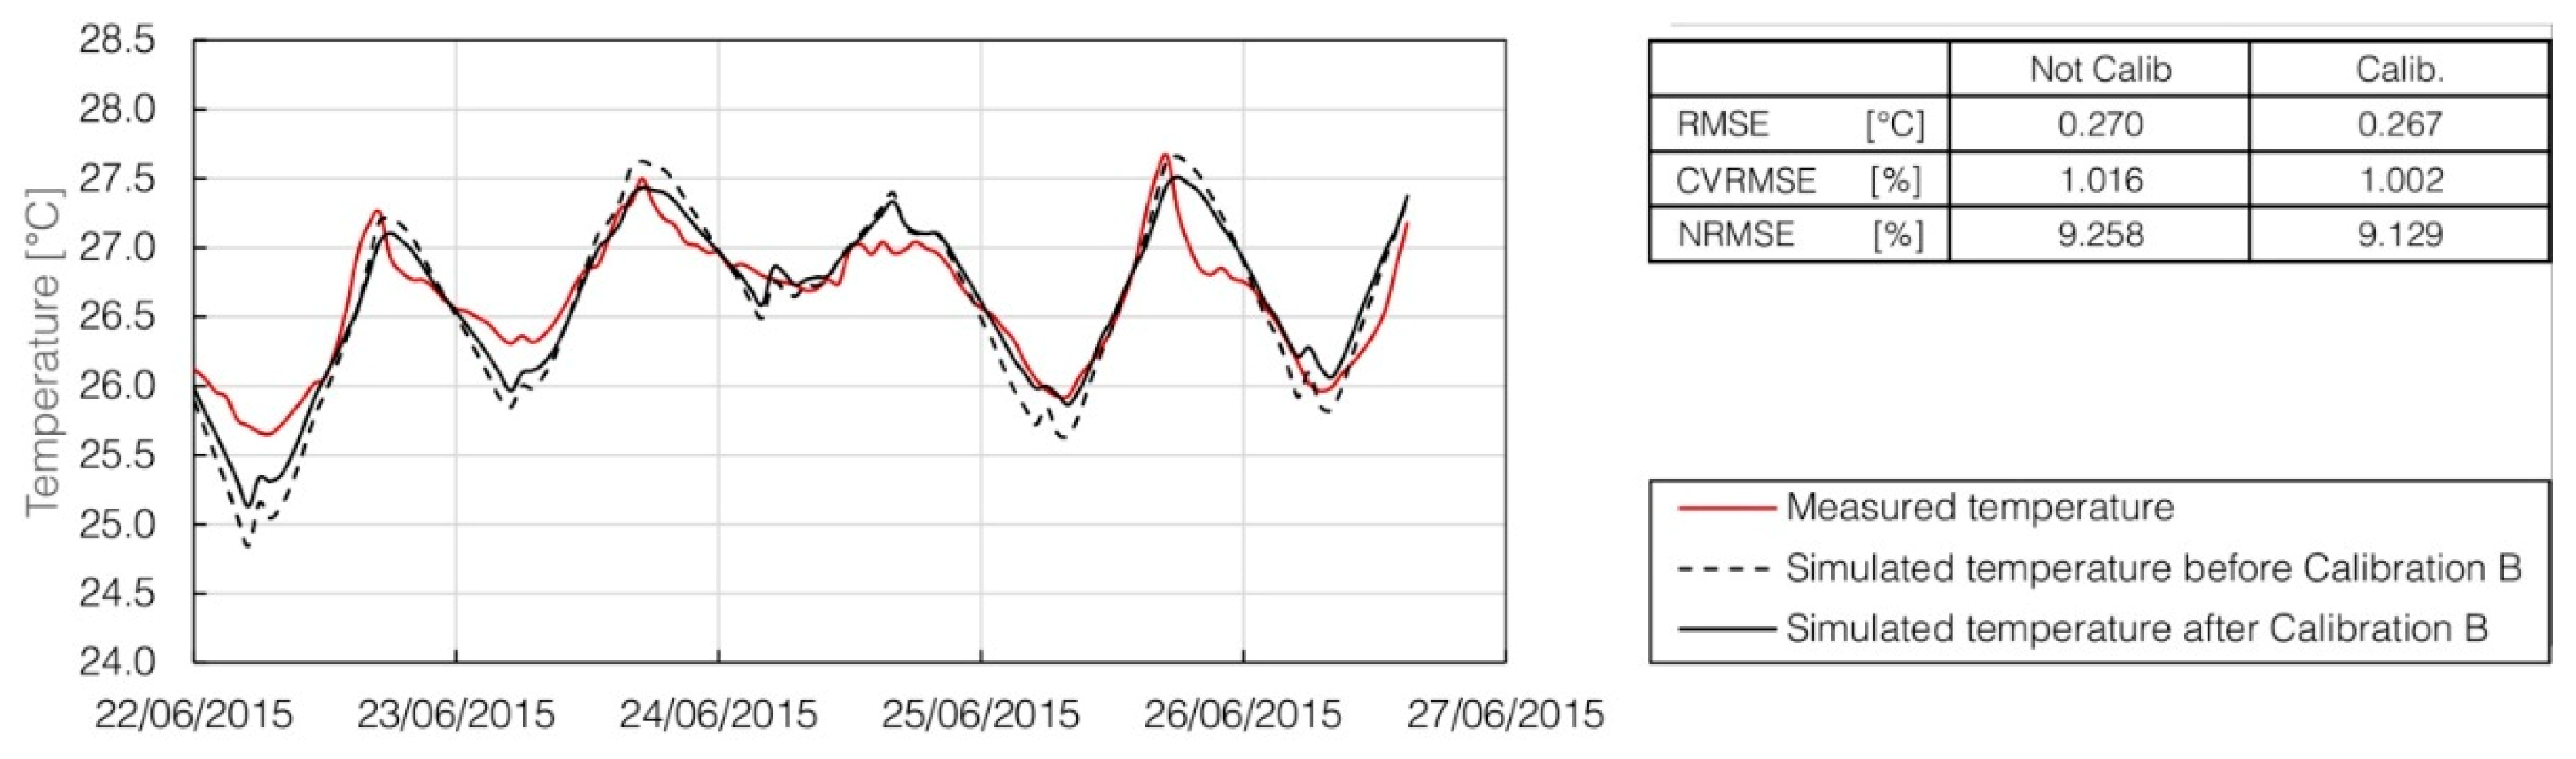
Figure 15.
Effect of Calibration B on the temperature trend of the first floor, North exposure.
Figure 15.
Effect of Calibration B on the temperature trend of the first floor, North exposure.
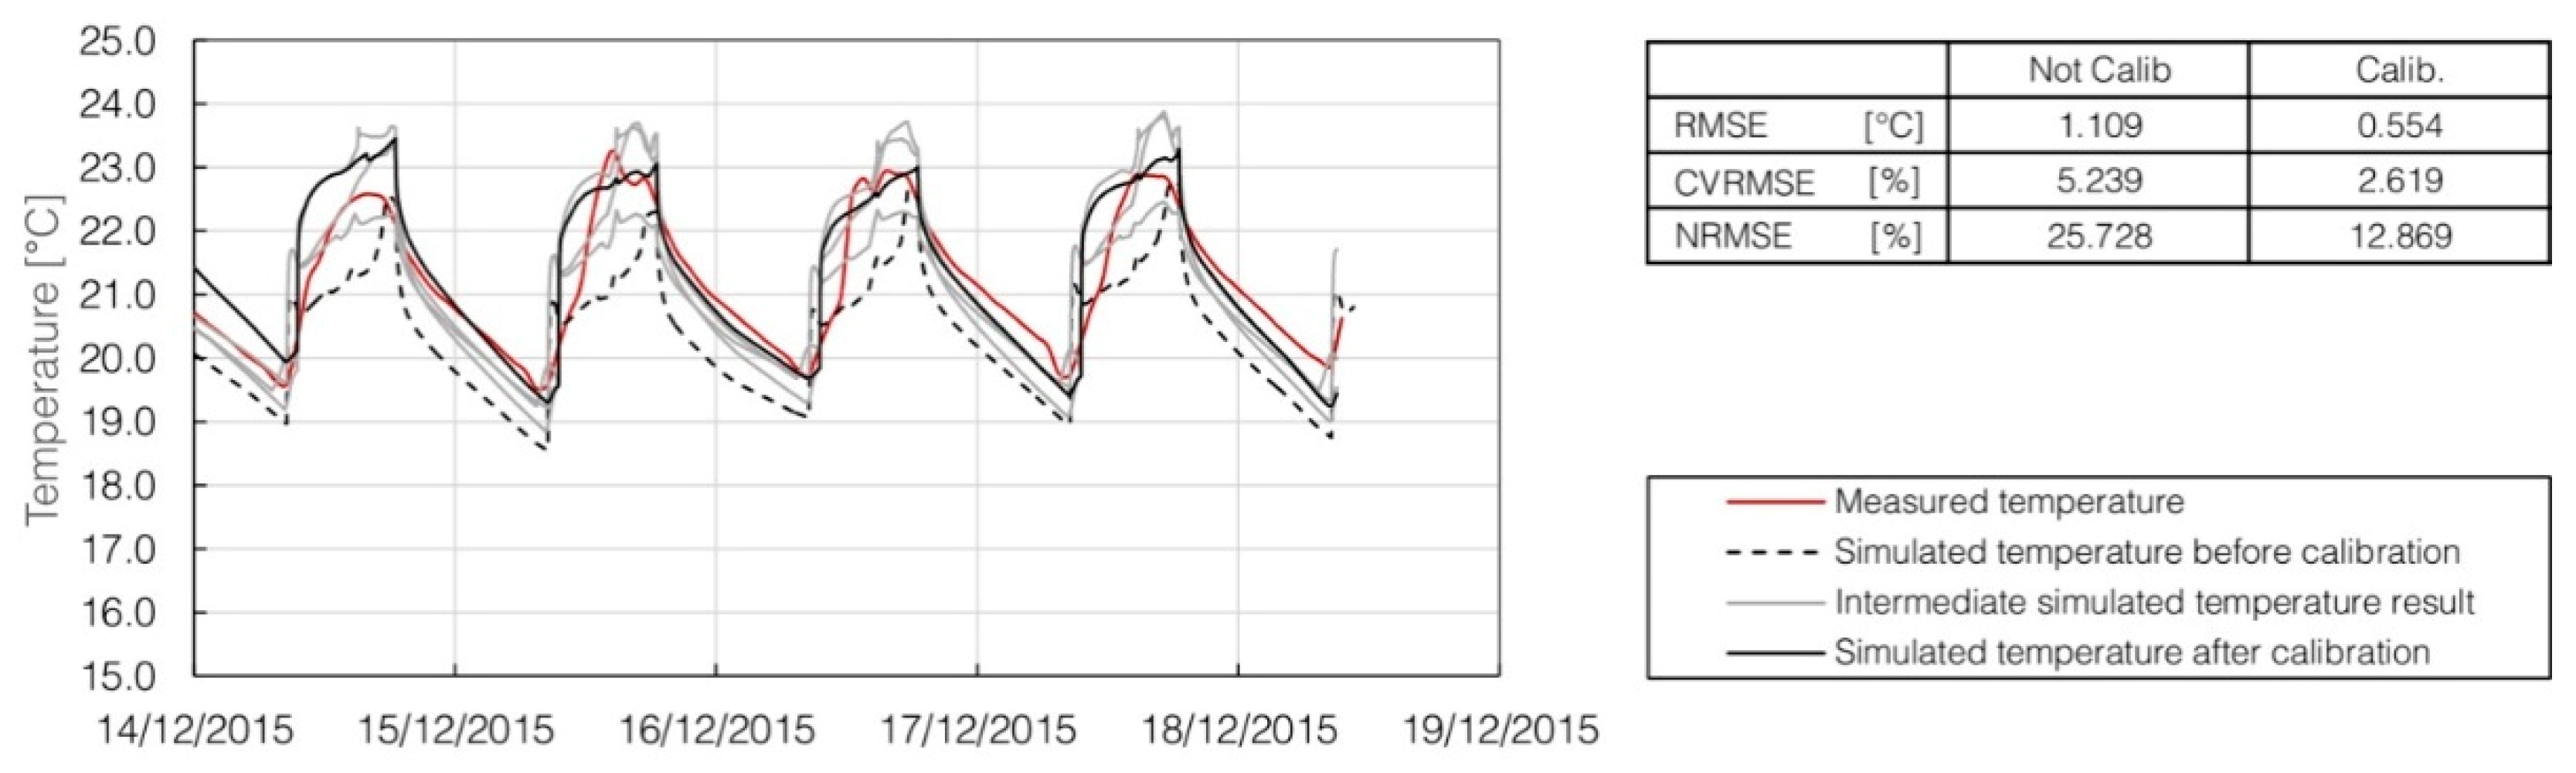
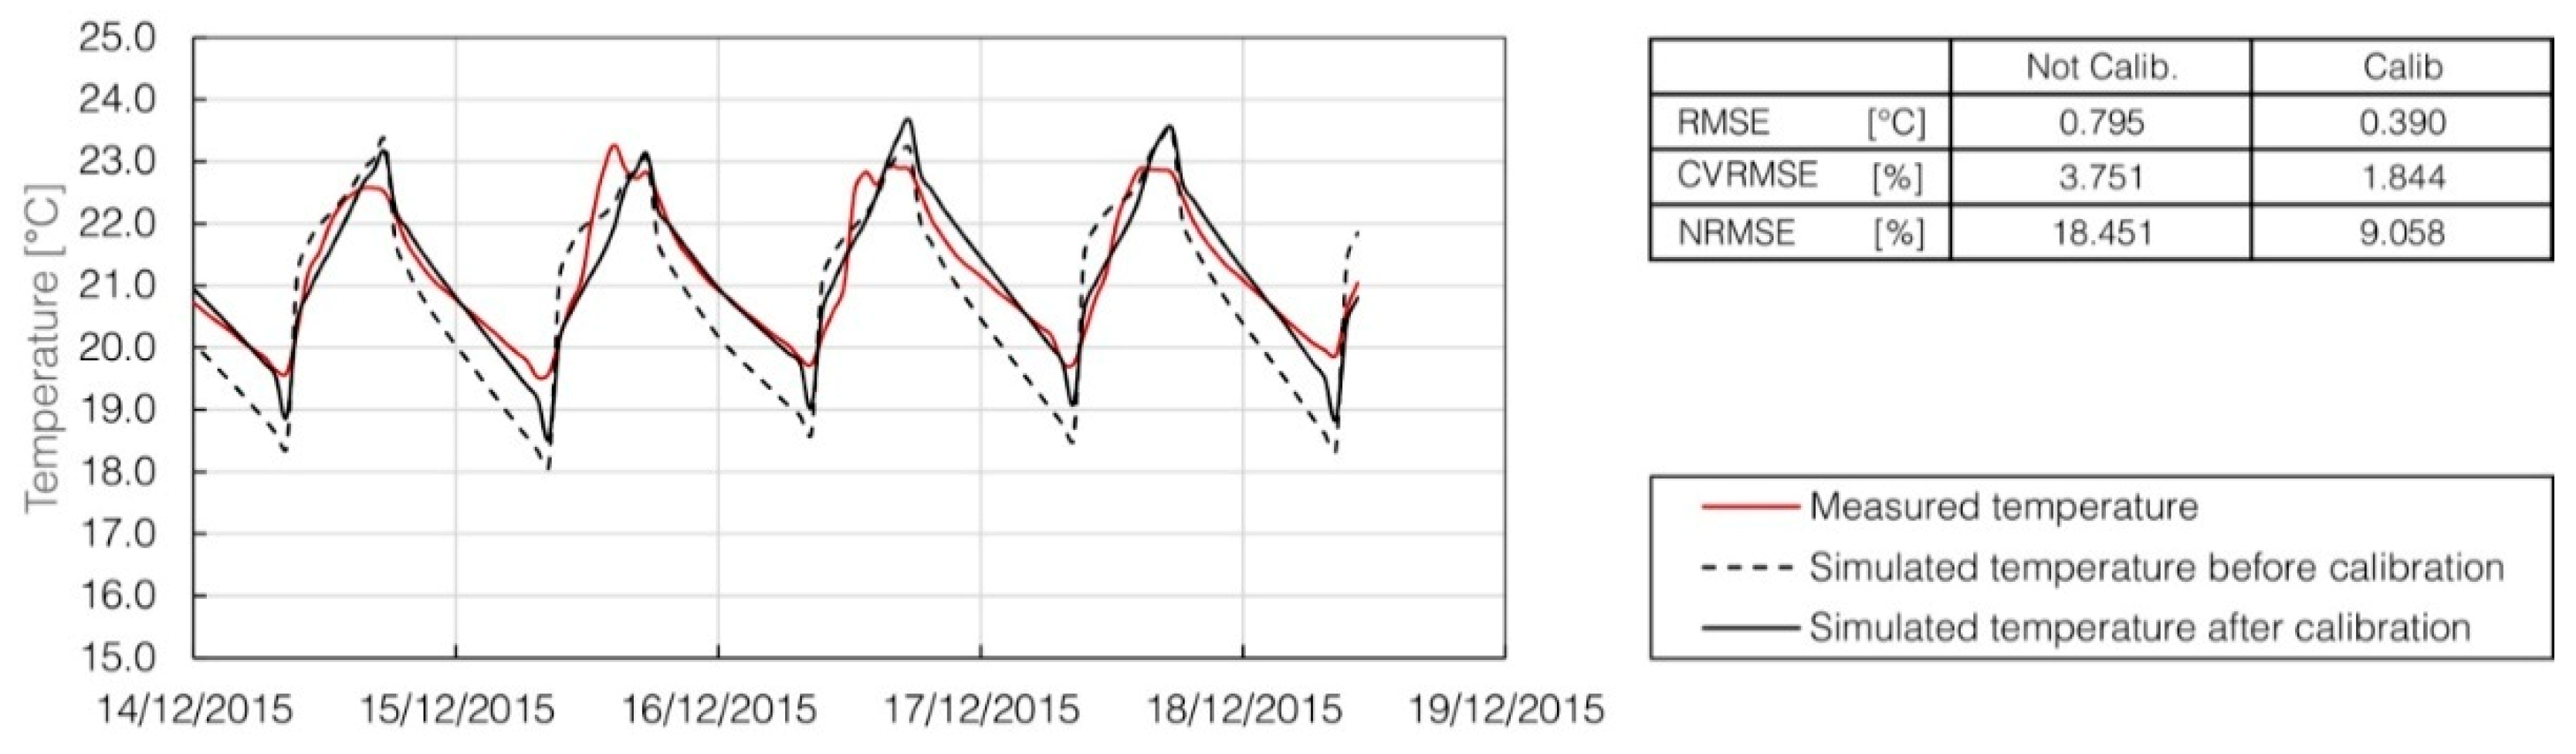
Figure 16.
Results for Calibration C. First floor, North-West exposure.
Figure 16.
Results for Calibration C. First floor, North-West exposure.
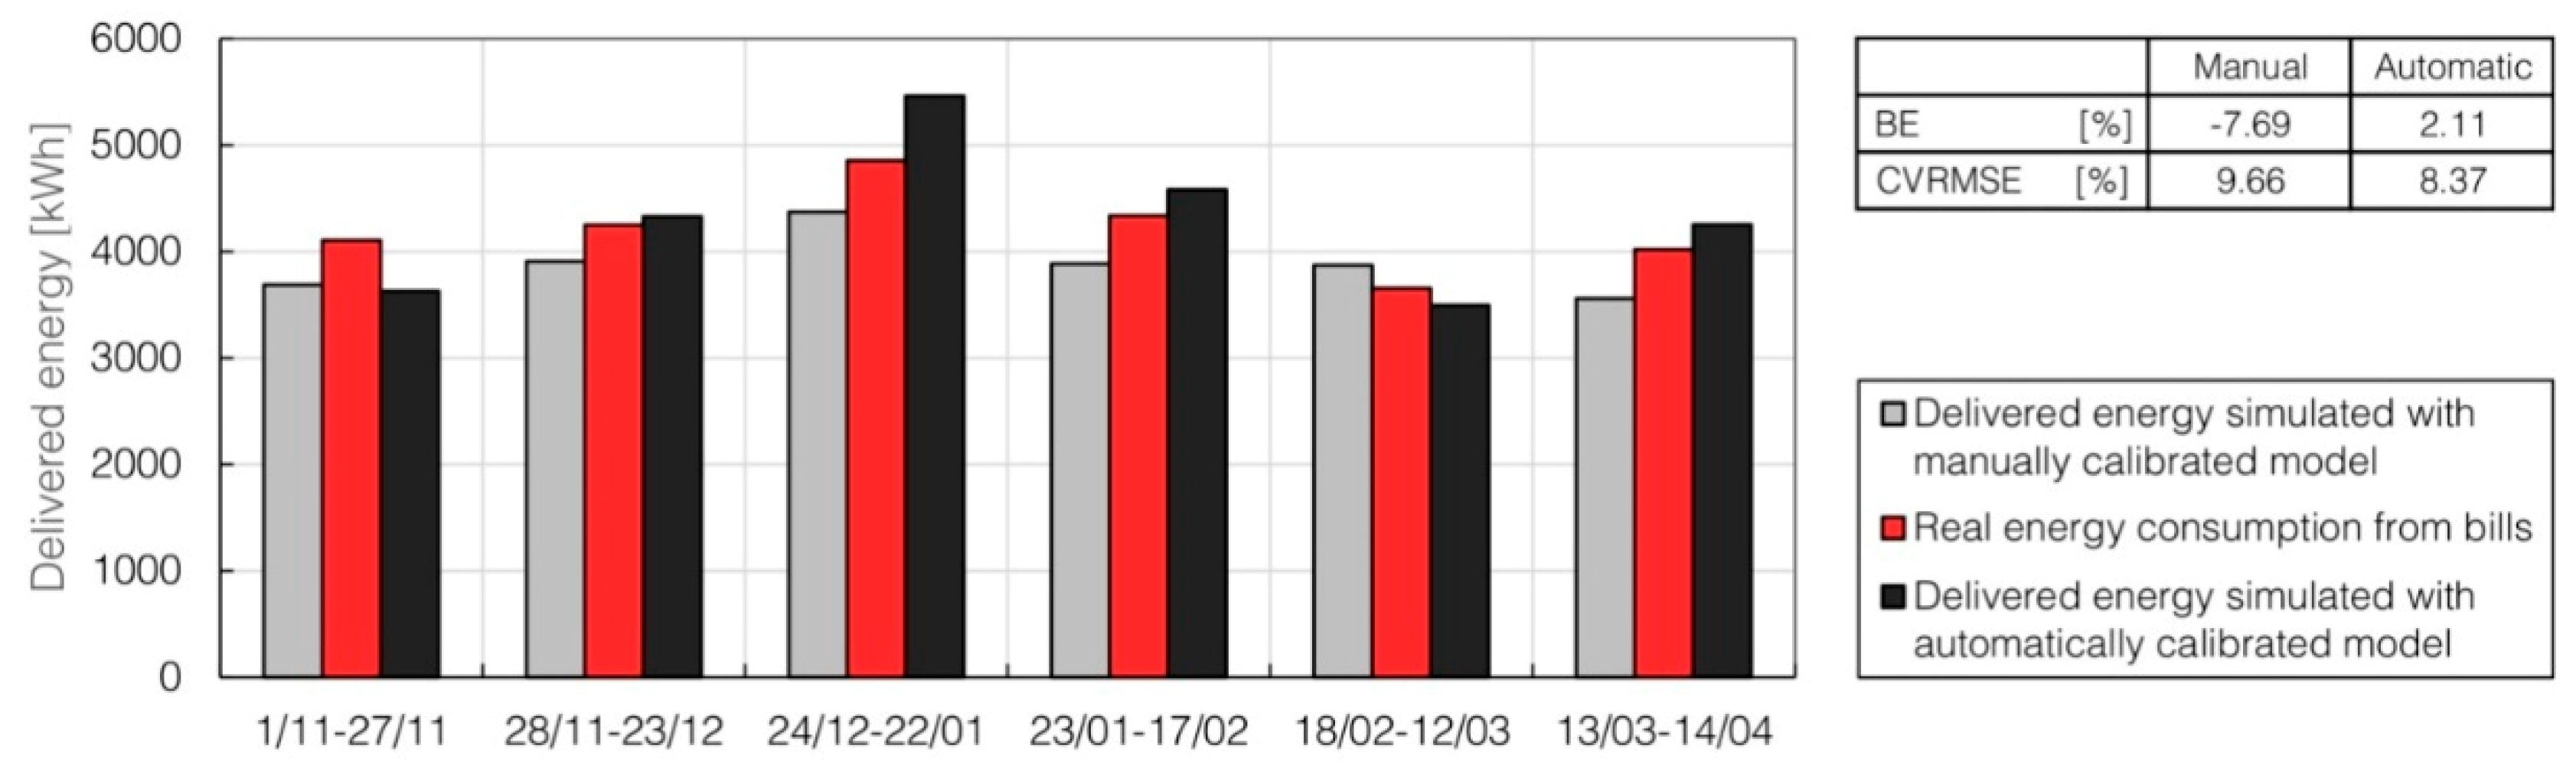
Figure 17.
Delivered energy from manual and automatic calibrated models compared with real consumption from bills.
Figure 17.
Delivered energy from manual and automatic calibrated models compared with real consumption from bills.
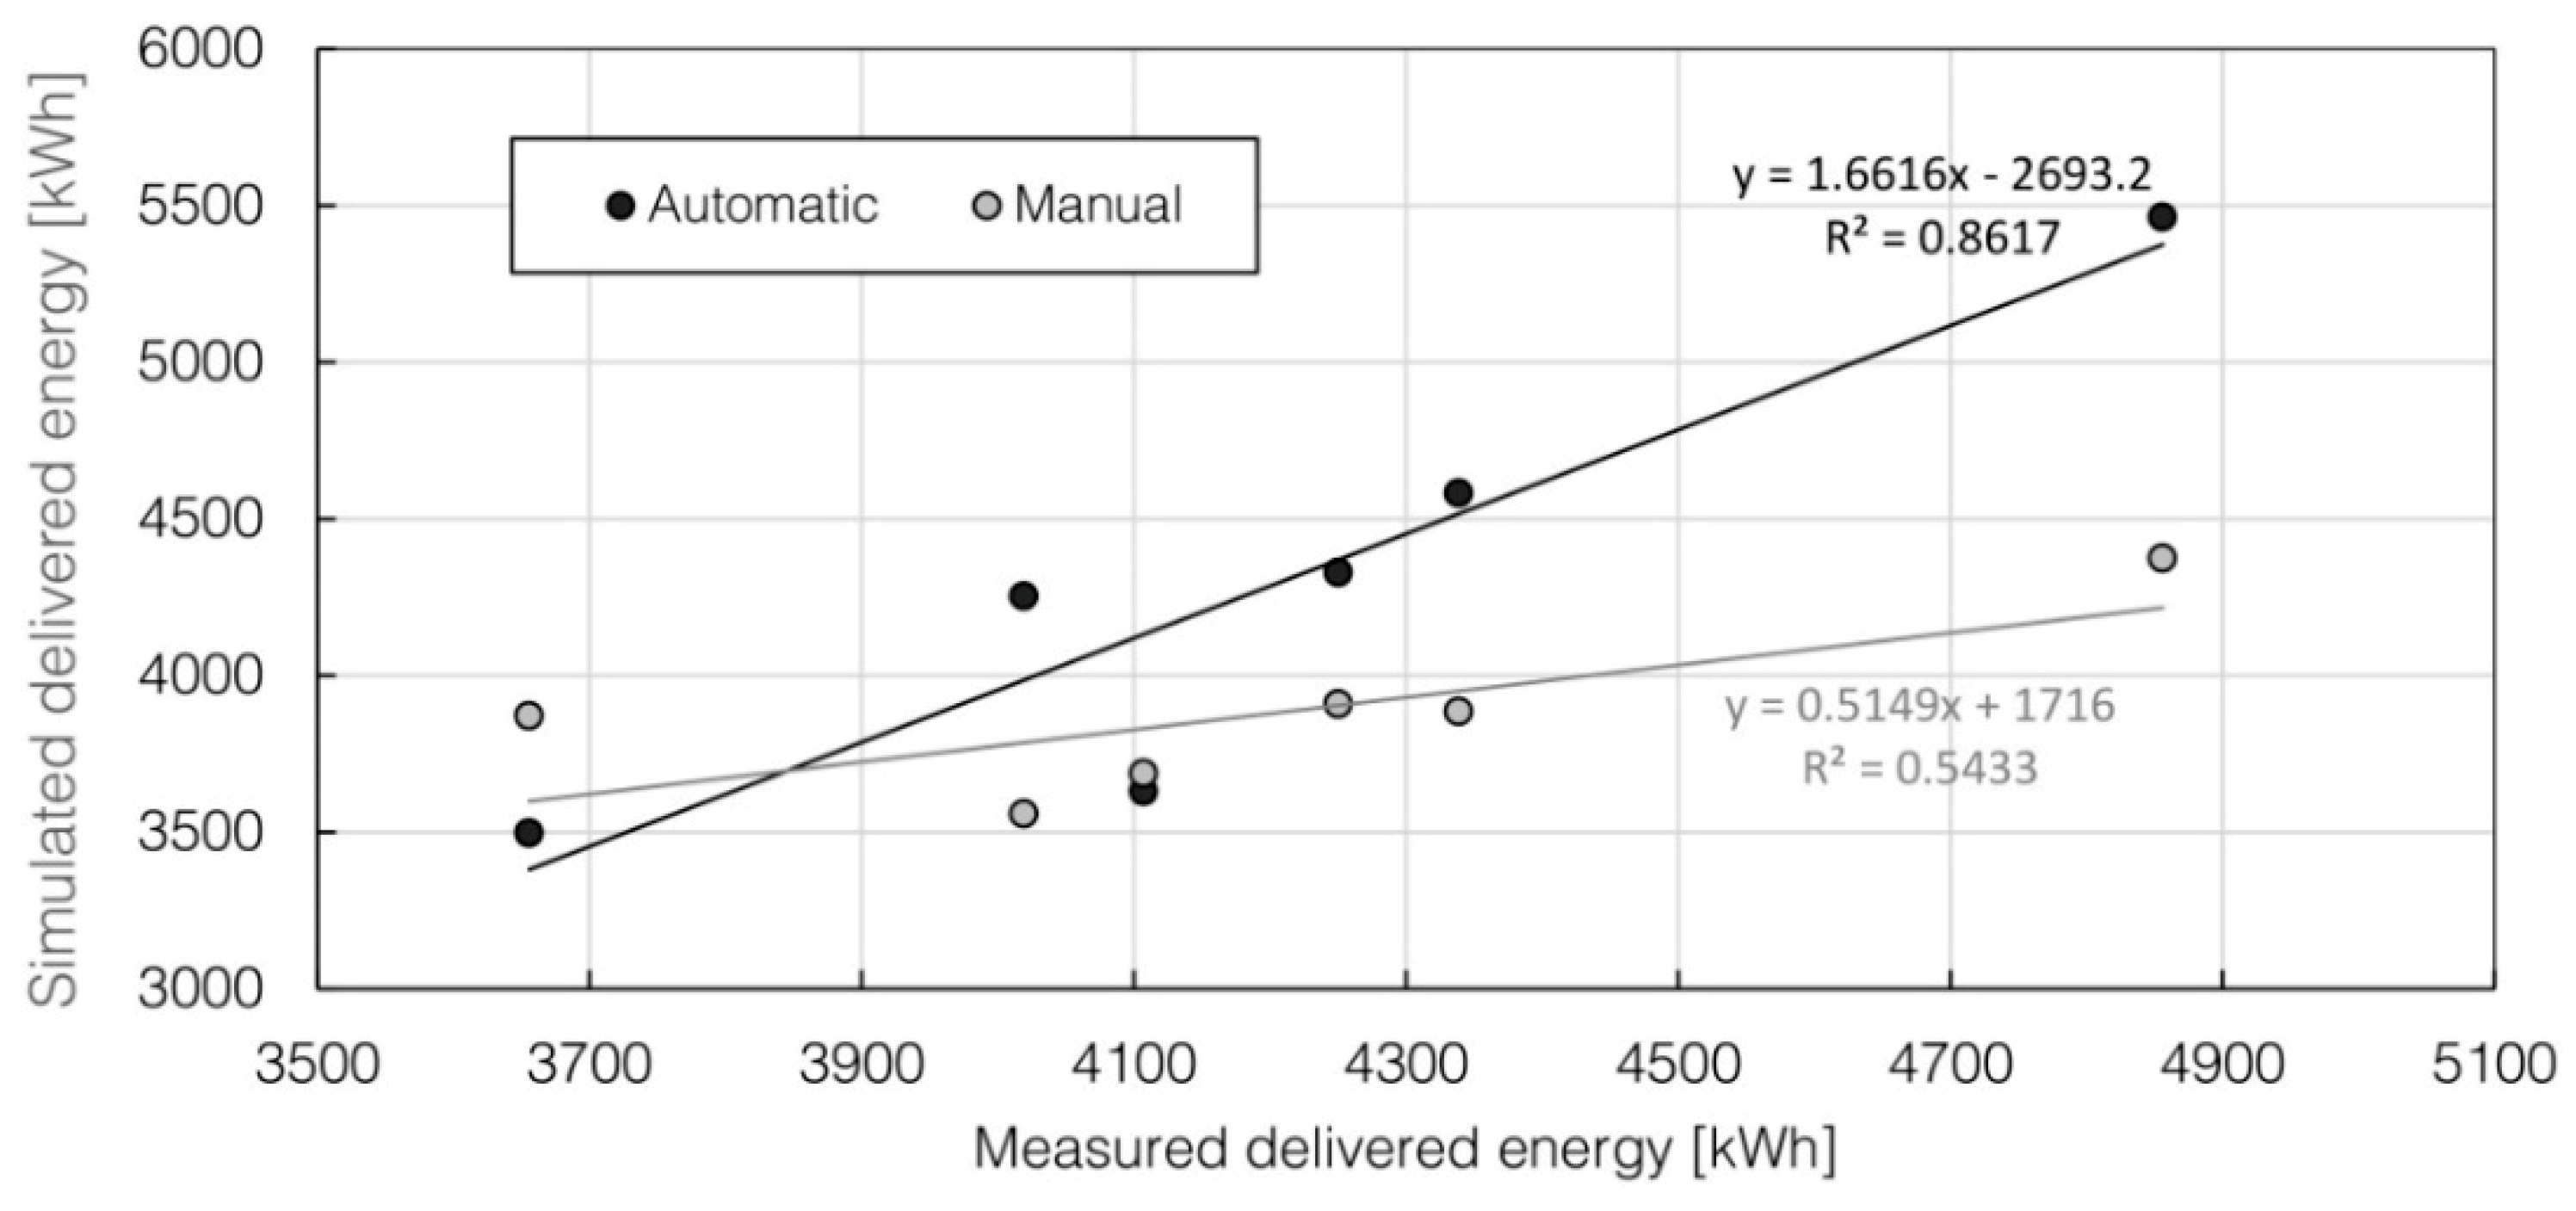
Figure 18.
Scatter plot of delivered energy from manual and automatic calibrated models compared with real consumption from bills.
Figure 18.
Scatter plot of delivered energy from manual and automatic calibrated models compared with real consumption from bills.
Table 1.
Limits of MBE and CVRMSE for the calibration of building simulation models defined by different standard/guideline.
Table 1.
Limits of MBE and CVRMSE for the calibration of building simulation models defined by different standard/guideline.
| Standard/Guideline | Monthly Limit (%) | Hourly Limit (%) |
|---|
| MBE | CVRMSE | MBE | CVRMSE |
|---|
| ASHRAE Guideline 14 [17] | ±5 | 10 | 10 | 30 |
| International Performance Measurement and Verification Protocol [18] | ±20 | - | 10 | 20 |
| Federal Energy Management Program [19] | ±5 | 15 | 10 | 30 |
Table 2.
Energy consumption data with conversion from scm to kWh.
Table 2.
Energy consumption data with conversion from scm to kWh.
| Period | Measured Heating Fuel [scm] | Measured Heating Fuel [kWh] |
|---|
| 1–27 November 2014 | 373 | 4107 |
| 28 November–23 December 2014 | 386 | 4250 |
| 24 December 2014–22 January 2015 | 441 | 4856 |
| 23 January–17 February 2015 | 394 | 4338 |
| 18 February–12 March 2015 | 332 | 3656 |
| 13 March–14 April 2015 | 365 | 4019 |
| Total | 2291 | 25,226 |
Table 3.
Material properties for database upload in IDA-ICE for first guess model.
Table 3.
Material properties for database upload in IDA-ICE for first guess model.
| Material | Conductivity [W/mK] | Density [kg/m3] | Specific Heat [J/kgK] |
|---|
| Bituminous membrane | 0.170 | 1200 | 1000 |
| Cement mortar | 1.400 | 2000 | 670 |
| Concrete | 1.060 | 1900 | 1000 |
| Concrete-Brick | 0.600 | 900 | 1000 |
| Gravel | 1.200 | 1700 | 1000 |
| Gres | 1.470 | 1700 | 710 |
| Perforated Brick | 0.387 | 690 | 840 |
| Plaster | 0.800 | 1800 | 790 |
| Structural concrete | 1.910 | 2400 | 1000 |
| Tuff | 0.550 | 1200 | 1000 |
| White marble | 3.000 | 2700 | 880 |
| Wood | 0.220 | 850 | 1660 |
Table 4.
Construction elements for first guess model.
Table 4.
Construction elements for first guess model.
| Doors |
| Element | s [cm] | Layer 1 |
| Internal door | 5 | Wood |
| External door | 7 | Wood |
| Internal shading |
| Element | Multiplier * | Multiplier * | Multiplier T * | Diffusion factor |
| Refurbished roller blind | 0.9 | 0.15 | 0.09 | 1 |
| Original roller blind | 0.9 | 0.15 | 0.09 | 1 |
| Slabs |
| Element | s [cm] | Layer 1 | Layer 2 | Layer 3 | Layer 4 | Layer 5 | Layer 6 | U [W/m2K] |
| Basement floor | 54.5 | Gravel (40 cm) | Concrete (13 cm) | Gres (1.5 cm) | - | - | - | 1.615 |
| Internal floor | 22.5 | Plaster (1 cm) | Joist (12 cm) | Slab (4 cm) | Concrete (4 cm) | Gres (1.5 cm) | - | 2.238 |
| Roof | 43 | Plaster (1 cm) | Joist (16 cm) | Slab (4 cm) | Air (4 cm) | Concrete (7 cm) | Bituminous membrane (1 cm) | 1.671 |
| Surfaces |
| Element | Emissivity | Reflectance |
| External wall brick cladding | 0.90 | 0.50 |
| External wall marble cladding | 0.90 | 0.50 |
| External wall tuff cladding | 0.90 | 0.50 |
| Roof | 0.90 | 0.50 |
| Walls |
| Element | s [cm] | Layer 1 | Layer 2 | Layer 3 | Layer 4 | Layer 5 | U [W/m2K] |
| External wall brick cladding | 30 | Plaster (2 cm) | Brick (12 cm) | Air (4 cm) | Brick (12 cm) | | 1.005 |
| External wall marble cladding | 34 | Plaster (2 cm) | Brick (12 cm) | Air (4 cm) | Brick (8 cm) | Marble (4 cm) | 1.041 |
| External wall tuff cladding | 30 | Plaster (2 cm) | Brick (12 cm) | Air (4 cm) | Tuff (12 cm) | | 1.043 |
| Windows |
| Element | [W/m2K] | [W/m2K] | | T | Internal shading |
| Refurbished Window | 2.6 | 2 | 0.39 | 0.31 | Refurbished roller blind |
| Original Window | 5.8 | 3 | 0.59 | 0.48 | Original roller blind |
| Glazed doors | 5.8 | 5.2 | 0.59 | 0.48 | - |
Table 5.
Infiltration and thermal bridges.
Table 5.
Infiltration and thermal bridges.
| Infiltrations |
| Element | Air tightness [ACH *] |
| Wind driven flow | 0.5 |
| Thermal Bridges |
| Element 1 | Element 2 | Linear transmittance of thermal bridge [W/mK] |
| External wall | Internal wall | 0.03 |
| External wall | External wall | 0.08 |
| External windows perimeter | - | 0.03 |
| External doors perimeter | - | 0.03 |
| Roof | External wall | 0.09 |
| Roof | Internal wall | 0.03 |
Table 6.
Parameters collection for Calibration A *.
Table 6.
Parameters collection for Calibration A *.
| Reference | Element | First Guess | Lower Bound | Upper Bound |
|---|
| Linear Transmittance of Thermal Bridges | Ext. Wall-Int. Wall [W/(K⋅m)] | 0.03 | 0.025 | 0.035 |
| Ext. Wall-Ext. Wall [W/(K⋅m)] | 0.08 | 0.06 | 0.09 |
| Window Perimeter [W/(K⋅m)] | 0.03 | 0.025 | 0.035 |
| Door Perimeter [W/(K⋅m)] | 0.03 | 0.025 | 0.035 |
| Ext. Wall-Roof [W/(K⋅m)] | 0.09 | 0.07 | 0.10 |
| Int.Wall-Roof [W/(K⋅m)] | 0.03 | 0.025 | 0.035 |
| Infiltration | ACH | 0.5 | 0.5 | 1.0 |
| Ext. Wall-Brick | s Int. Brick [m] | 0.12 | 0.08 | 0.12 |
| s Air [m] | 0.04 | 0.03 | 0.05 |
| s Ext. Brick [m] | 0.12 | 0.08 | 0.12 |
| Roof | s Screed [m] | 0.07 | 0.07 | 0.09 |
| s Air [m] | 0.04 | 0.04 | 0.08 |
| s Joist [m] | 0.16 | 0.16 | 0.24 |
| Material Properties | λ Brick [W/(m⋅K)] | 0.387 | 0.387 | 0.472 |
| Shading (original windows) | mult. g | 0.15 | 0.15 | 0.4 |
| mult. U | 0.9 | 0.8 | 1 |
| D | 1 | 0.5 | 1 |
Table 7.
Parameters collection for Calibration B *.
Table 7.
Parameters collection for Calibration B *.
| Reference | Element | First Guess | Lower Bound | Upper Bound |
|---|
| Ext. Wall-Marble | s Int. Brick [m] | 0.12 | 0.08 | 0.12 |
| s Air [m] | 0.04 | 0.04 | 0.08 |
| s Ext. Brick [m] | 0.08 | 0.08 | 0.12 |
| Ext. Wall-Tuff | s Int. Brick [m] | 0.12 | 0.08 | 0.12 |
| s Air [m] | 0.04 | 0.03 | 0.05 |
| Shading (refurbished windows) | mult. g | 0.15 | 0.15 | 0.4 |
| mult. U | 0.9 | 0.8 | 1 |
| D | 1 | 0.5 | 1 |
| Windows (refurbished) | U | 2.6 | 1.1 | 2.6 |
Table 8.
Parameters collection for Calibration C.
Table 8.
Parameters collection for Calibration C.
| Reference | Element | First Guess | Lower Bound | Upper Bound |
|---|
| Radiators | Exponent N | 1.28 | 1.28 | 1.33 |
| Parameter C | 22,500 | 22,500 | 28,100 |
Table 9.
Parameters collection for Sensitivity Analysis A *.
Table 9.
Parameters collection for Sensitivity Analysis A *.
| Reference | Element | First Guess | Lower Bound | Upper Bound |
|---|
| Linear Transmittance of Thermal Bridges | Ext. Wall-Int.l Wall [W/(K⋅m)] | 0.03 | 0.024 | 0.036 |
| Ext. Wall-Ext. Wall [W/(K⋅m)] | 0.08 | 0.064 | 0.096 |
| Window Perimeter [W/(K⋅m)] | 0.03 | 0.024 | 0.036 |
| Door Perimeter [W/(K⋅m)] | 0.03 | 0.024 | 0.036 |
| Ext. Wall-Roof [W/(K⋅m)] | 0.09 | 0.072 | 0.102 |
| Int.Wall-Roof [W/(K⋅m)] | 0.03 | 0.024 | 0.036 |
| Infiltration | ACH | 0.5 | 0.4 | 0.6 |
| Ext. Wall -Brick | s Int. Brick [m] | 0.12 | 0.1 | 0.14 |
| s Air [m] | 0.04 | 0.03 | 0.05 |
| s Ext. Brick [m] | 0.12 | 0.1 | 0.14 |
| E Ext. Surface | 0.9 | 0.72 | 1 |
| R Ext. Surf | 0.5 | 0.4 | 0.6 |
| Ext. Wall-Marble | s Int. Brick [m] | 0.12 | 0.1 | 0.14 |
| s Air [m] | 0.04 | 0.03 | 0.05 |
| s Ext. Brick [m] | 0.08 | 0.06 | 0.1 |
| E Ext. Surface | 0.9 | 0.72 | 1 |
| R Ext. Surf | 0.5 | 0.4 | 0.6 |
| Ext. Wall-Tuff | s Int. Brick [m] | 0.12 | 0.1 | 0.14 |
| s Air [m] | 0.04 | 0.03 | 0.05 |
| E Ext. Surface | 0.9 | 0.72 | 1 |
| R Ext. Surf | 0.5 | 0.4 | 0.6 |
| Roof | s Screed [m] | 0.07 | 0.05 | 0.09 |
| s Air [m] | 0.04 | 0.03 | 0.05 |
| s Slab [m] | 0.04 | 0.03 | 0.05 |
| s Joist [m] | 0.16 | 0.12 | 0.2 |
| E Ext. Surface | 0.9 | 0.72 | 1 |
| R Ext. Surf | 0.5 | 0.4 | 0.6 |
| Material Properties | λ Brick [W/(m⋅K)] | 0.387 | 0.3096 | 0.4644 |
| λ Concrete [W/(m⋅K)] | 1.23 | 0.984 | 1.476 |
| λ Str. Concrete [W/(m⋅K)] | 1.91 | 1.528 | 2.292 |
| λ Concrete-Brick [W/(m⋅K)] | 0.6 | 0.48 | 0.72 |
| Shading (original windows) | mult. g | 0.15 | 0.12 | 0.18 |
| mult. U | 0.9 | 0.72 | 1 |
Table 10.
Parameters collection for Sensitivity Analysis B *.
Table 10.
Parameters collection for Sensitivity Analysis B *.
| Reference | Element | First Guess | Lower Bound | Upper Bound |
|---|
| Ext. Wall-Brick | s Int. Brick [m] | 0.12 | 0.1 | 0.14 |
| s Air [m] | 0.04 | 0.03 | 0.05 |
| s Ext. Brick [m] | 0.12 | 0.1 | 0.14 |
| Ext. Wall-Marble | s Int. Brick [m] | 0.12 | 0.1 | 0.14 |
| s Air [m] | 0.04 | 0.03 | 0.05 |
| s Ext. Brick [m] | 0.08 | 0.06 | 0.1 |
| E Ext. Surface | 0.9 | 0.72 | 1 |
| R Ext. Surf | 0.5 | 0.4 | 0.6 |
| Ext. Wall-Tuff | s Int. Brick [m] | 0.12 | 0.1 | 0.14 |
| s Air [m] | 0.04 | 0.03 | 0.05 |
| E Ext. Surface | 0.9 | 0.72 | 1 |
| R Ext. Surf | 0.5 | 0.4 | 0.6 |
| Material Properties | λ Tuff [W/(m⋅K)] | 0.55 | 0.44 | 0.66 |
| λ Soil [W/(m⋅K)] | 1.23 | 0.984 | 1.476 |
| Shading (refurbished windows) | mult. G | 0.15 | 0.12 | 0.18 |
| mult. U | 0.9 | 0.72 | 1 |
| Soil | s Soil [m] | 2 | 1.6 | 2.4 |
Table 11.
Parameters collection for Calibration C.
Table 11.
Parameters collection for Calibration C.
| Reference | Element | First Guess | Lower Bound | Upper Bound |
|---|
| Controller for supply heating water temperature | Water T at ambient T = −30 °C [°C] | 45 | 45 | 55 |
| Water T at ambient T = 30 °C [°C] | 45 | 45 | 55 |
| Radiators emitted power | Exponent N | 1.28 | 1.26 | 1.30 |
| Internal gains | Equipment power [W] | 100 | 100 | 200 |
Table 12.
Infiltration and thermal bridges input for resulting model from manual and automatic calibration (bold when changed).
Table 12.
Infiltration and thermal bridges input for resulting model from manual and automatic calibration (bold when changed).
| Infiltrations |
| Element | Method | Air Tightness [ACH] |
| Wind driven flow | Manual | 0.5 |
| Automatic | 0.5 |
| Thermal Bridges |
| Element 1 | Element 2 | Method | Thermal bridge [W/mK] |
| External wall | Internal wall | Manual | 0.03 |
| Automatic | 0.03 |
| External wall | External wall | Manual | 0.08 |
| Automatic | 0.08 |
| External windows perimeter | - | Manual | 0.03 |
| Automatic | 0.03 |
| External doors perimeter | - | Manual | 0.03 |
| Automatic | 0.03 |
| Roof | External wall | Manual | 0.09 |
| Automatic | 0.09 |
| Roof | Internal wall | Manual | 0.03 |
| Automatic | 0.03 |
Table 13.
Plants and internal gains settings for resulting models from manual and automatic calibration (bold when changed).
Table 13.
Plants and internal gains settings for resulting models from manual and automatic calibration (bold when changed).
| Controller three-ways valve |
| Element | Method | Temperature [°C] |
| Air 1 | Manual | −26.0 |
| Automatic | −30.0 |
| Air 2 | Manual | 20.0 |
| Automatic | 30.0 |
| Water 1 | Manual | 70.0 |
| Automatic | 50.0 |
| Water 2 | Manual | 20.0 |
| Automatic | 47.0 |
| Radiators |
| Element | Method | q [W] | C [W/m2⋅K] | N |
| Refurbished radiators | Manual | 147.4 | - | 1.339 |
| Automatic | 147.4 | - | 1.339 |
| Original radiators | Manual | - | 28,100 | 1.330 |
| Automatic | - | 22,500 | 1.285 |
| Internal gains |
| Element | Mehtod | Equipment power [W] |
| Equipment | Manual | 100.0 |
| Automatic | 188.8 |
Table 14.
Construction elements for resulting models from manual and automatic calibration (bold when changed).
Table 14.
Construction elements for resulting models from manual and automatic calibration (bold when changed).
| Doors |
| Element | Method | s [cm] | Layer 1 |
| Internal door | Manual | 5 | Wood |
| Automatic | 5 | Wood |
| External door | Manual | 7 | Wood |
| Automatic | 7 | Wood |
| Internal Shading |
| Element | Method | Multiplier | Multiplier | Multiplier T | Diffusion factor |
| Refurbished roller blind | Manual | 0.9 | 0.4 | 0.09 | 0.5 |
| Automatic | 0.9 | 0.12 | 0.09 | 1 |
| Original roller blind | Manual | 0.8 | 0.2 | 0.09 | 0.5 |
| Automatic | 0.7 | 0.17 | 0.09 | 1 |
| Slabs |
| Element | Method | s [cm] | Layer 1 | Layer 2 | Layer 3 | Layer 4 | Layer 5 | Layer 5 | U [W/m2K] |
| Basement floor | Manual | 54.5 | Gravel (40 cm) | Concrete (13 cm) | Gres (1.5 cm) | - | - | - | 1.615 |
| Automatic | 54.5 | Gravel (40 cm) | Concrete (13 cm) | Gres (1.5 cm) | - | - | - | 1.615 |
| Internal floor | Manual | 22.5 | Plaster (1 cm) | Joist (12 cm) | Slab (4 cm) | Concrete (4 cm) | Gres (1.5 cm) | - | 2.238 |
| Automatic | 22.5 | Plaster (1 cm) | Joist (12 cm) | Slab (4 cm) | Concrete (4 cm) | Gres (1.5 cm) | - | 2.238 |
| Roof | Manual | 43 | Plaster (1 cm) | Joist (24 cm) | Slab (4 cm) | Air (4cm) | Concrete (9 cm) | Bitouminos membrane (1 cm) | 1.337 |
| Automatic | 30 | Plaster (1 cm) | Joist (12 cm) | Slab (4 cm) | Air (4cm) | Concrete (7 cm) | Bitouminos membrane (1 cm) | 1.325 |
| Surfaces |
| Element | Method | Emissivity | Reflectance |
| External wall brick cladding | Manual | 0.90 | 0.50 |
| Automatic | 0.95 | 0.56 |
| External wall marble cladding | Manual | 0.90 | 0.50 |
| Automatic | 0.96 | 0.50 |
| External wall tuff cladding | Manual | 0.90 | 0.50 |
| Automatic | 0.96 | 0.60 |
| Roof | Manual | 0.90 | 0.50 |
| Automatic | 0.80 | 0.45 |
| Walls |
| Element | Method | s [cm] | Layer 1 | Layer 2 | Layer 3 | Layer 4 | Layer 5 | U [W/m2K] |
| External wall brick cladding | Manual | 30 | Plaster (2 cm) | Brick (12 cm) | Air (4 cm) | Brick (12 cm) | | 1.005 |
| Automatic | 30 | Plaster (2 cm) | Brick (12 cm) | Air (4 cm) | Brick (12 cm) | | 0.834 |
| External wall marble cladding | Manual | 34 | Plaster (2 cm) | Brick (12 cm) | Air (4 cm) | Brick (8 cm) | Marble (4 cm) | 1.041 |
| Automatic | 34 | Plaster (2 cm) | Brick (12 cm) | Air (4 cm) | Brick (8 cm) | Marble (4 cm) | 0.824 |
| External wall tuff cladding | Manual | 30 | Plaster (2 cm) | Brick (12 cm) | Air (4 cm) | Tuff (12 cm) | | 1.043 |
| Automatic | 36 | Plaster (2 cm) | Brick (16 cm) | Air (6 cm) | Tuff (12 cm) | | 0.792 |
| Windows |
| Element | Method | [W/m2K] | [W/m2K] | | T | Internal shading |
| Refurbished Window | Manual | 1.1 | 2 | 0.39 | 0.31 | Refurbished roller blind |
| Automatic | 2.6 | 2 | 0.39 | 0.31 | Refurbished roller blind |
| Original Window | Manual | 5.8 | 3 | 0.59 | 0.48 | Original roller blind |
| Automatic | 5.8 | 3 | 0.59 | 0.48 | Original roller blind |
| Glazed doors | Manual | 5.8 | 5.2 | 0.59 | 0.48 | - |
| Automatic | 5.8 | 5.2 | 0.59 | 0.48 | - |
Table 15.
Multi-stage calibration results comparison for manual and automatic methods. In bold the best results.
Table 15.
Multi-stage calibration results comparison for manual and automatic methods. In bold the best results.
| Calibration | Calibration A | Calibration B | Calibration C |
|---|
| Period | 21 June 2015–26 June 2015 | 28 July 2015–1 August 2015 | 13 December 2015–18December 2015 |
| Method | Manual | Automatic | Manual | Automatic | Manual | Automatic |
| Time | 1 [mon] | 17 (SA) + 5 [h] | 2 [week] | 9 (SA) + 4.5 [h] | 3 [week] | 0 (SA) + 6 [h] |
| Simulations | 51 | 340 (SA) + 437 | 25 | 180 (SA) + 408 | 15 | 0 (SA) + 299 |
| RMSE | 0.350 | 0.270 | 0.624 | 0.417 | 0.554 | 0.390 |
| CVRMSE | 1.315 | 1.016 | 2.291 | 1.530 | 2.619 | 1.844 |
| NRMSE | 11.980 | 9.258 | 21.602 | 14.426 | 12.869 | 9.058 |
Table 16.
Monthly and seasonal heating fuel consumption as measured from bills and as simulated with MCM.
Table 16.
Monthly and seasonal heating fuel consumption as measured from bills and as simulated with MCM.
| Period | Measured Heating Fuel [scm] | Measured Primary Energy [kWh] | Simulated Primary Energy [kWh] | BE [%] | MBE [%] | CVRMSE [%] |
|---|
| 1–27 November 2014 | 373 | 4107 | 3687 | −10.23 | - | - |
| 28 November–23 December 2014 | 386 | 4250 | 3909 | −8.03 | - | - |
| 24 December 2014–22 January 2015 | 441 | 4856 | 4374 | −9.92 | - | - |
| 23 January–17 February 2015 | 394 | 4338 | 3885 | −10.45 | - | - |
| 18 February–12 March 2015 | 332 | 3656 | 3872 | 5.92 | - | - |
| 13 March–14 April 2015 | 365 | 4019 | 3559 | −11.45 | - | - |
| 1 November 2014–14 April 2015 | 2291 | 25,226 | 23,286 | - | −7.69 | 9.69 |
Table 17.
Monthly and seasonal heating fuel consumption as measured from bills and as simulated with ACM.
Table 17.
Monthly and seasonal heating fuel consumption as measured from bills and as simulated with ACM.
| Period | Measured Heating Fuel [scm] | Measured Primary Energy [kWh] | Simulated Primary Energy [kWh] | BE [%] | MBE [%] | CVRMSE [%] |
|---|
| 1–27 November 2014 | 373 | 4107 | 3631 | −11.59 | - | - |
| 28 November–23 December 2014 | 386 | 4250 | 4330 | 1.88 | - | - |
| 24 December 2014–22 January 2015 | 441 | 4856 | 5464 | 12.52 | - | - |
| 23 January–17 February 2015 | 394 | 4338 | 4582 | 5.62 | - | - |
| 18 February–12 March 2015 | 332 | 3656 | 3497 | −4.34 | - | - |
| 13 March–14 April 2015 | 365 | 4019 | 4254 | 5.85 | - | - |
| 1 November 2014–14 April 2015 | 2291 | 25,226 | 25,758 | - | 2.11 | 8.37 |

 ,
, 


