Article

Carbon Dioxide Adsorption on Porous and Functionalized Activated Carbon Fibers

Department of Mechanical Engineering, Yuan Ze University, Chung-Li, Taoyuan 32003, Taiwan
*
Author to whom correspondence should be addressed.
Appl. Sci. 2019, 9(10), 1977; https://doi.org/10.3390/app9101977
Submission received: 2 April 2019 / Revised: 16 April 2019 / Accepted: 9 May 2019 / Published: 14 May 2019
(This article belongs to the Special Issue Nanotechnologies for Environmental Remediation)

Abstract

:
Polyacrylonitrile-based activated carbon fibers (ACFs), modified using potassium hydroxide (KOH) or tetraethylenepentamine (TEPA), were investigated for carbon dioxide (CO2) adsorption, which is one of the promising alleviation approaches for global warming. The CO2 adsorption isotherms were measured, and the values of isosteric heat of adsorption were calculated. The results showed that the KOH-modified ACFs exhibited a great deal of pore volume, and a specific surface area of 1565 m2/g was obtained. KOH activation made nitrogen atoms easily able to escape from the surface of ACFs. On the other hand, the surface area and pore volume of ACFs modified with TEPA were significantly reduced, which can be attributed to the closing or blocking of micropores by the N-groups. The CO2 adsorption on the ACF samples was via exothermic reactions and was a type of physical adsorption, where the CO2 adsorption occurred on heterogeneous surfaces. The CO2 uptakes at 1 atm and 25 °C on KOH-activated ACFs reached 2.74 mmole/g. This study observed that microporosity and surface oxygen functionalities were highly associated with the CO2 uptake, implying the existence of O-C coordination, accompanied with physical adsorption. Well cyclability of the adsorbents for CO2 adsorption was observed, with a performance decay of less than 5% over up to ten adsorption-desorption cycles.

1. Introduction

The increase in the atmospheric carbon dioxide (CO2) level has been almost guaranteed as being responsible for global warming and climate change. According to statistical data, the emission of CO2 has mostly occurred from anthropogenic activities. In order to mitigate the increasing concentration of CO2, several CO2 capture technologies have been widely studied. Among them, adsorption techniques are effective processes to separate CO2 from exhaust. Based on this, selecting appropriate adsorbents is very important, and many porous materials have been considered as potential candidates for CO2 capture [1,2,3,4,5].
The affinity of the adsorbent surface to CO2 molecules determines the adsorption capacities of CO2 on the adsorbents. Several studies have shown that the CO2 adsorption performance arises from the synergetic effect of the micropores and the surface nitrogen functionalities [6,7]. The porosity of activated carbons was highly associated with the activation temperature, rather than the activation time [8]. It was found that the adsorption capacity of gas at a lower pressure was controlled by ultramicropores, but micropores and mesopores became dominant at a higher pressure [8,9]. Nevertheless, Xing et al. [10] observed that in addition to the micropore volume and specific surface area of the carbons, the CO2 uptake was dependent on other properties of the carbons. Maroto-Valer et al. [11] reported that the CO2 adsorption capacity was positively associated with the microporosity of the carbons. They suggested that only pore sizes of less than 1.0 nm were effective in CO2 adsorption at atmospheric pressure, based on the molecular size of CO2 being 0.209 nm. At present, a value of 0.33 nm is usually used as the kinetic diameter of CO2 molecules [12,13,14]. Referring to the study of Im et al. [15], the hydrogen adsorption capacity was primarily subject to the pore volume, with a width of about 0.6–0.7 nm. Accordingly, several studies have found that high CO2 capacity can mainly be attributed to the presence of small micropores (<0.8 nm) [16] or ultramicropores (<0.7 nm) [13], because the adsorption potential in the pores was enhanced. A high CO2 capacity of 8.9 mmole/g at 0 °C and 1 bar on activated phenolic resin-derived carbon spheres has been obtained [16].
As a general rule, doping a Lewis-base onto the surface of adsorbents could improve their CO2 adsorption capacities, because CO2 is regarded as a weak Lewis acidic gas. Reacting with N-containing compounds was commonly a useful and effective method for providing Lewis-base active sites on the surface of adsorbents. The electron-donor properties induced by these N-functionalities could go towards CO2 capture [17,18]. The CO2 adsorption capacities on the polyetherimide impregnated activated carbons positively depend on the adsorption temperature, which is indicative of chemical adsorption [11]. The activated carbons modified at a high temperature with ammonium gas exhibited lower CO2 capacities, which could be ascribed to the total or partial blinding of micropores by N-functionalities [11]. Plaza et al. [19] also found that alkylamine coating increased the nitrogen content and basic sites on the activated carbons, but the microporous volumes and the CO2 adsorption capacities of the activated carbons were significantly decreased. Tetraethylenepentamine (TEPA) has been grafted onto the surface of carboxyl-rich porous carbons, and a nitrogen content of 11.56 wt% was obtained [20]. Although the CO2 uptake achieved was about 3.2 mmole/g at 25 °C and 1 bar, the N-rich adsorbents were not heat-treated such that the N-functionalities might be unstable, and would probably be released under desorption with high temperatures.
It has been shown repeatedly that nitrogen atoms, possessing a pair of lone electrons, can act as a Lewis base and are able to facilitate the adsorption of CO2 through the interactions between the quadrupole moment of CO2 molecules and the polar N-species [6]. Specifically, the nitrogen groups on the adsorbents that have a basic character were amine groups and imine groups, so the presence of these groups would lead to higher CO2 capacities, probably partially from chemisorption [11]. Hao et al. [21] also reported that pyrrolic N might function as polar sites for CO2 capture. As for pyridonic N, its nitrogen atom is positioned just next to the −OH group, such that this nitrogen atom is surrounded with a higher electron density and behaves as a strong Lewis base [22], promoting a high CO2 adsorption capacity.
Even though most studies have utilized acid-base interactions to interpret the high CO2 adsorption capacities of N-rich carbons, Xing et al. [10] proposed another point of view. They thought that the importance of the hydrogen-bonding interactions between the CO2 molecules and the hydrogen atoms on the N-doped carbons should be taken seriously, as they may override the effects of acid-base interactions. Fan et al. [22] believed that the pyridonic N groups play an important role in CO2 adsorption because the position of the N atom enhances its Lewis basicity, and the pole-pole interactions between the CO2 molecules and the carbon surface. Bandosz et al. [23] suggested that, besides the nitrogen functionalities, the hydrogen bonding or polar interactions of CO2 within the confined pores of carbonaceous adsorbents may originate from other heteroatomic functional groups. If these chemical interactions were inevitable, the adsorption phenomena would be complicated and the performance of the adsorbents in long-term applications could be unpredictable.
Among the known adsorbents, activated carbon fibers (ACFs) have unique characteristics compared with powder or granular activated carbons. A small fiber diameter ensures fast intraparticle adsorption kinetics, and the fibrous form is favored because of ease in handling when it is used in fabric or felt forms [24]. Recently, several special structures of carbon materials have been studied to serve as CO2 adsorbents [25]. However, some have complicated manufacturing processes, some were expensive, and there was often a challenge in realizing mass production and commercialization. In terms of practical applications, ACFs should be a feasible adsorbent, and how to improve their CO2 uptake is a relevant question. The studies regarding the CO2 uptake of ACFs published in literature have almost always focused on the discussion of capacities and porosity. Only a few studies have talked about the effect of the chemical properties of ACFs on CO2 adsorption, and almost no studies have investigated the role of surface functional groups on CO2 adsorption performance. Therefore, this paper is intended to investigate the material properties of ACFs modified with potassium hydroxide (KOH) or TEPA, determine their adsorption capacities of CO2, and discuss the dependence of CO2 uptake on the primary parameters.

2. Materials and Methods

2.1. Preparation of the Adsorbents

One ACF in fabric form was supplied by Taiwan Carbon Technology Co. (Taichung, Taiwan), whose precursor was polyacrylonitrile (PAN), and it was denoted by ACF. The as-received ACF samples were modified with KOH (Sigma-Aldrich Chemie GmbH, Steinheim, Germany) to increase the porosity or TEPA (Sigma-Aldrich Chemie GmbH, Steinheim, Germany) to complement the nitrogen content. An appropriate amount of ACF sample was immersed in a KOH aqueous solution, where KOH: ACF = 2:1 (w/w). In order to make sure the ACF was completely filled with KOH solution, the solution was mixed in ultrasonic cleaning equipment for 10 min at room temperature, and then dried in an oven for 24 h at 100 °C. The mixture was heat-treated to 800 °C and kept for 1 h in a tubular furnace under flowing N2, at a heating rate of 10 °C/min. The obtained product was rinsed thoroughly using 1 M hydrochloric acid (Sigma-Aldrich Chemie GmbH, Steinheim, Germany) and abundant deionized water to remove the excess KOH, and then dried in an oven at 100 °C for 24 h. This sample was denoted as aACF. The treatment with TEPA ((NH2CH2CH2NHCH2CH2)2NH) was carried out as follows. A portion of ACF sample was weighed and soaked with a liquor of TEPA solution (10 wt% in alcohol), with a ratio of 0.07 g/mL. The solution was sonicated in ultrasonic cleaning equipment for 90 min at 60 °C, and then dried in an oven for 24 h at 50 °C. Next, the mixture was thermal-treated at 500 °C for 1 h in a tubular furnace under flowing N2, at a heating rate of 10 °C/min. An amount of deionized water was used to clean the product to get rid of free TEPA, and was then dried in an oven at 100 °C for 24 h. This sample was denoted as nACF.

2.2. Characterizations

Surface textural characteristics of the adsorbents were acquired from the adsorption-desorption isotherms of nitrogen gas, measured at −196 °C, which was conducted using an accelerated surface area and porometry (ASAP) apparatus—Micromeritics ASAP 2020 (Norcross, GA, USA). Before the measurements, the samples were degassed at 350 °C for 24 h. The equilibrium interval for each adsorption point was set as 45 s. The specific surface area of each sample was determined using the Brunauer-Emmett-Teller (BET) method, which was denoted as SBET. The total pore volume (Vt) of the adsorbent was obtained from the adsorption amount of nitrogen gas at P/Po ~0.99. The micropore volume (<2 nm, Vmi), micropore area (Smi), ultramicropore volume (<0.7 nm, Vultra) and mesopore volume (2 ~ 50 nm, Vme) were calculated from the density functional theory (DFT) method. Field emission scanning electron microscopy (FESEM) was used to probe the morphology of the filaments using a microscope (Hitachi S-4800, Hitachi, Krefeld, Germany). To understand the surface chemistry of the adsorbents, X-ray photoelectron spectroscopy (XPS) was applied and a spectrophotometer (PHI 5000 VersaProbe II, ULVAC-PHI, Kanagawa, Japan) was used to measure the XPS spectra on the surface of the adsorbent. A scanning X-ray monochromator of Al source was used. The kinetic energy and electrons emitted from the top 1–10 nm of the sample surface were collected. C1s electron binding energy corresponding to graphitic carbon was set at 284.6 eV for calibration purposes. The XPSPEAK software (version 4.1, The Chinese University of Hong Kong, Hong Kong, China) was utilized for deconvolution of the XPS spectra, which was a nonlinear least squares curve-fitting program. Prior to quantification, a Shirley-type background was selected to be subtracted. After the baseline was subtracted, curve fitting was performed using a Gaussian function fitting program under an optimized peak shape. The thermogravimetric analysis (TGA) was applied to evaluate the oxidation resistance of the adsorbents. A thermogravimetric analyzer (Q500, TA Instrument, New Castle, DE, USA) was selected to measure how the weight of the sample varied with the temperature in air, and the dependence of the rate of weight loss on the temperature.

2.3. CO2 Adsorption

The Micromeritics ASAP 2020 was also used to measure the adsorption isotherms of CO2 gas on the adsorbents. To eliminate the humidity and some trace impurities adsorbed on the surface, the sample was outgassed at 350 °C for 24 h prior to the measurement. A circulating water bath was used to control the water temperature in the adsorption dewar, where the temperature was set at 25, 40, or 55 °C. The equilibration interval for each pressure point was set as 45 s. The experimental equilibrium data were fitted with the Freundlich equation (Equation (1)), which is a well-known empirical equation for describing adsorption phenomena taking place on a heterogeneous surface with a diversity of adsorption sites:
q e = K F P 1 / n
where qe (mmol/g) is the equilibrium adsorption capacity at each pressure point, KF [(mmol/g)(1/kPa)1/n] is the Freundlich adsorption coefficient, p (kPa) is the gas pressure, and n is a constant associated with the curvature of the isotherm. The goodness of fit of the above isotherm model to the experimental data was quantified using two different error functions: the nonlinear regression coefficient (R2) and the average relative errors (ARE). The value of R2 indicates the percentage of deviation that can be explained by this fitting equation. On the other hand, the deviation between the experimental adsorption data and the fitting values could be calculated by ARE according to Equation (2) [26], where qj,exp and qj,cal (mmol/g) are the experimental and calculated adsorption capacity, and N is the number of the measured data.
ARE   ( % ) =   j = 1 N [ | q j ,   exp q j ,   cal | q j ,   exp ] × 100 N
The adsorption-desorption cycle tests of the adsorbents were also measured using ASAP2020. The same adsorption processes were conducted repeatedly for ten cyclic runs to evaluate the feasibility of their practical application for CO2 adsorption. The isosteric heat of adsorption (Qst, kJ/mol) was determined according to the Clausius-Clapeyron equation (Equation (3)), where A is the coefficient, R (=8.314 J/mol/K) is the universal gas constant, and T (K) is the adsorption temperature.
ln P = A Q st R ( 1 T )

3. Results and Discussion

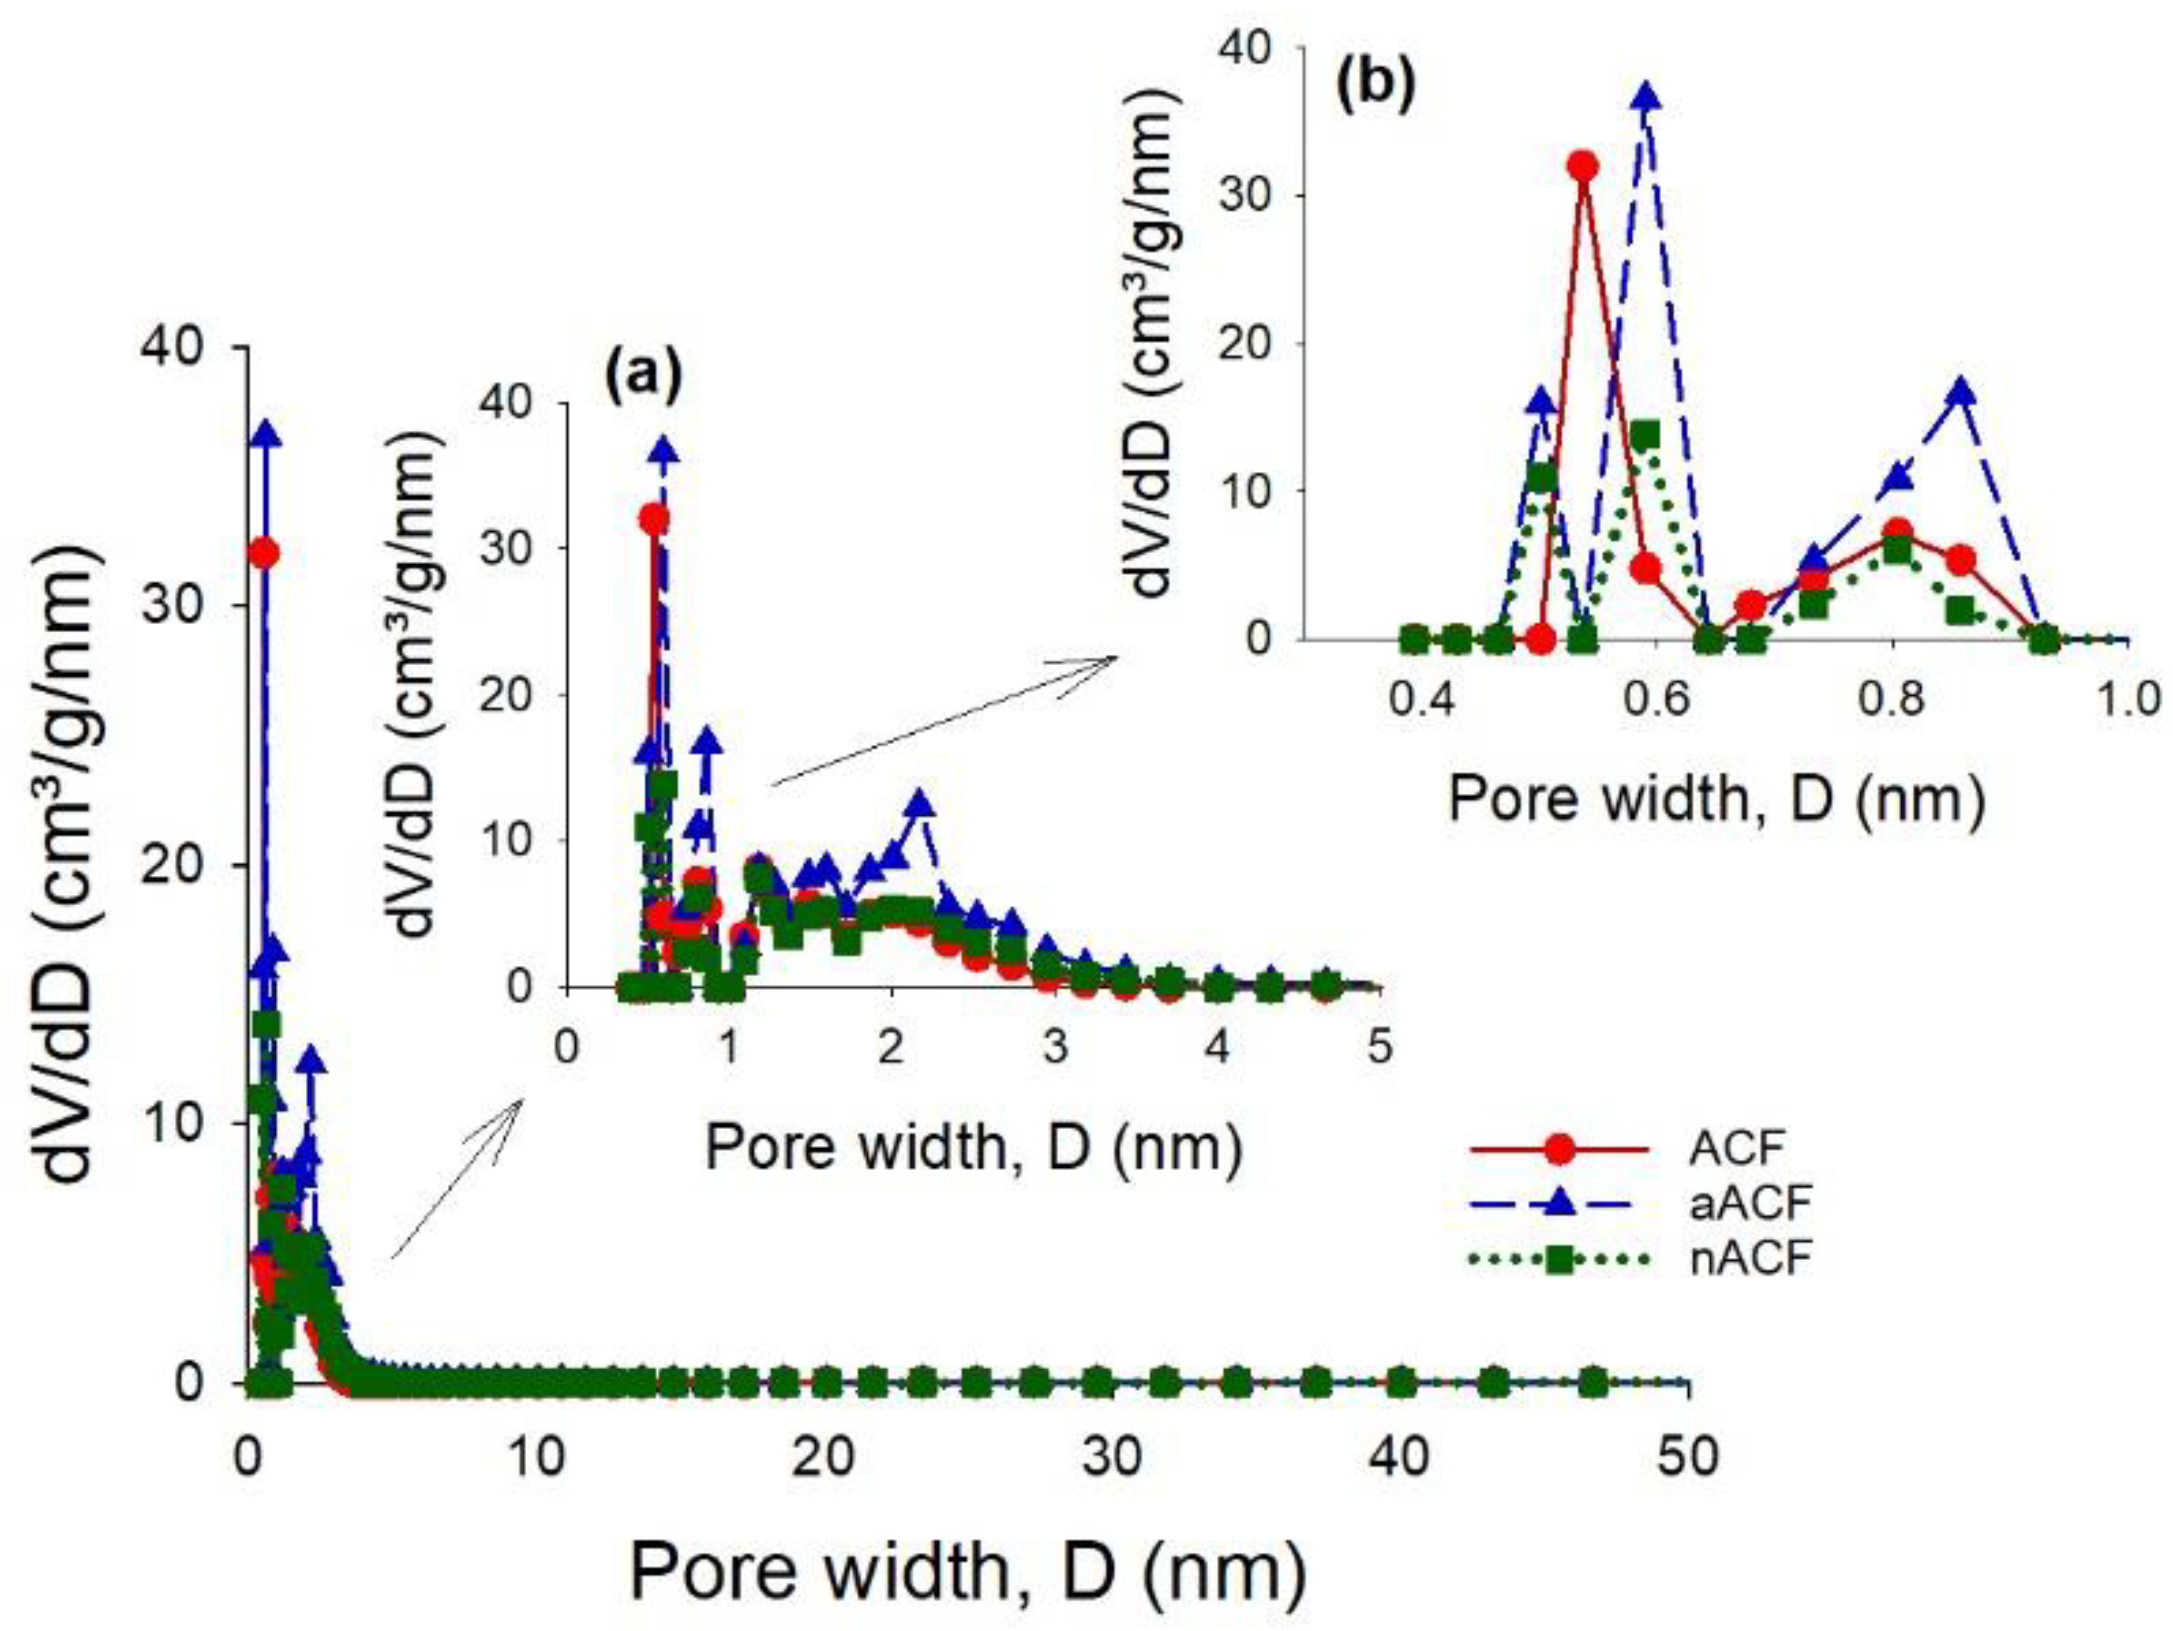
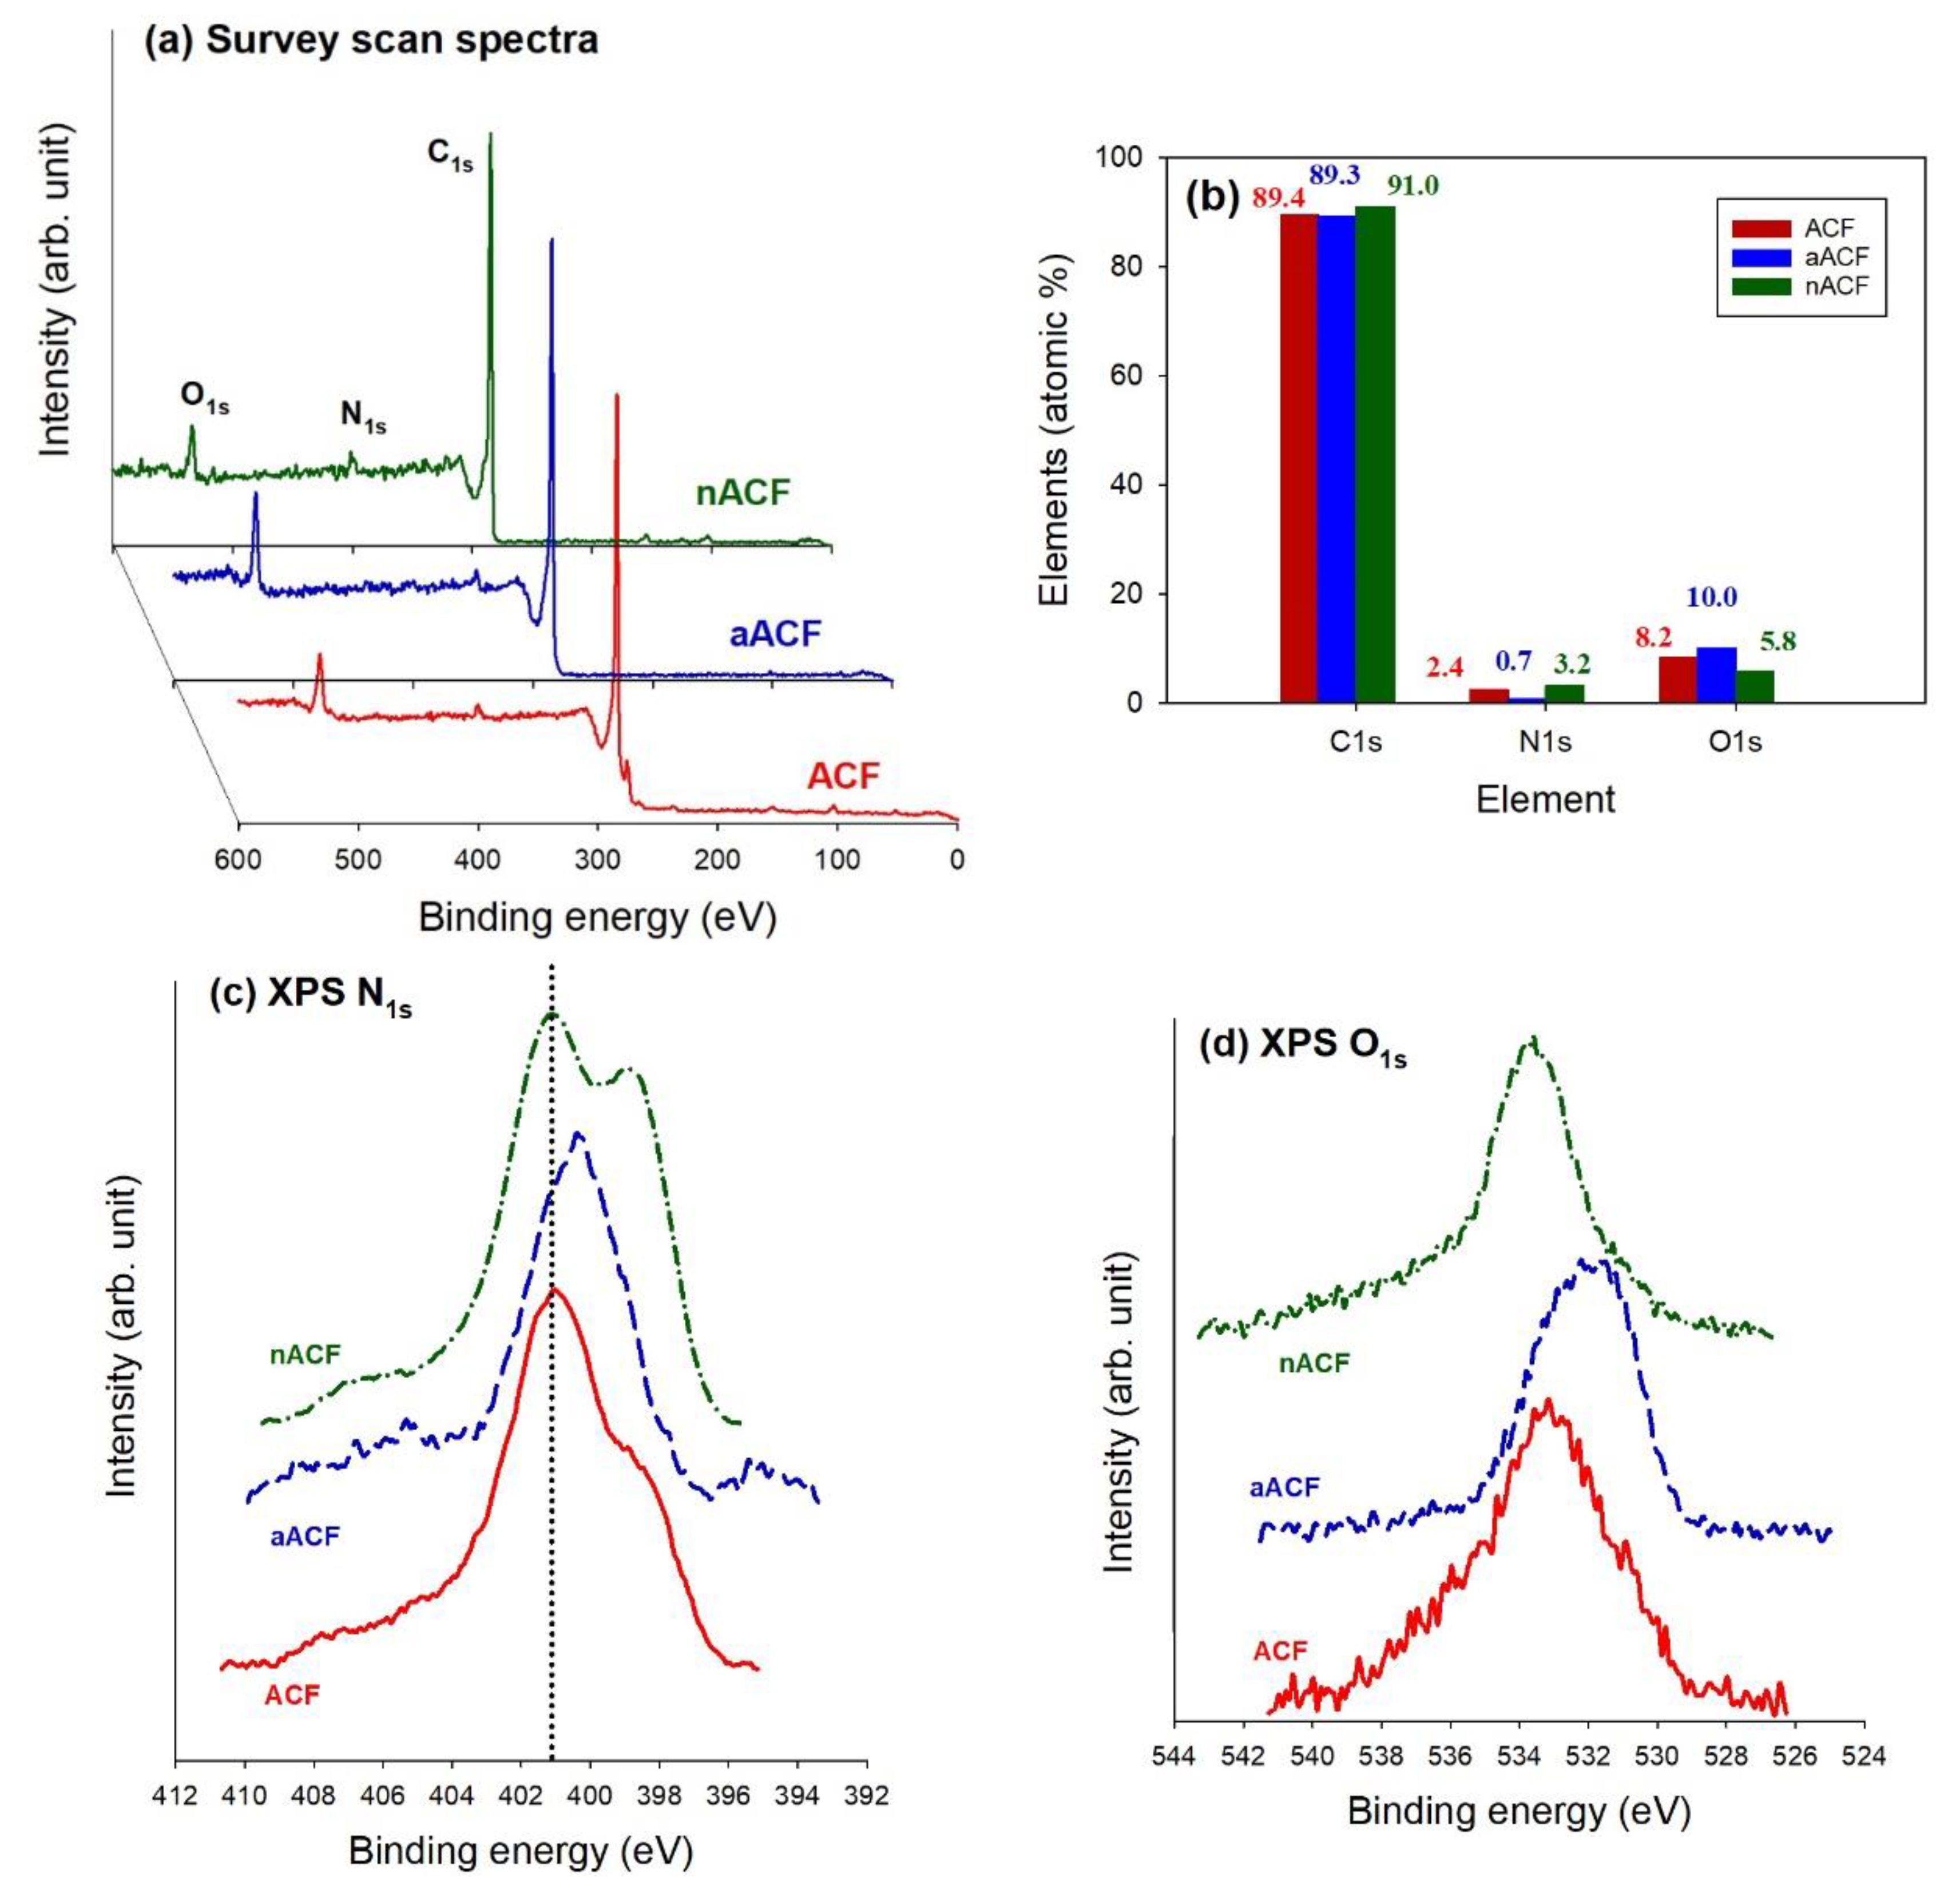
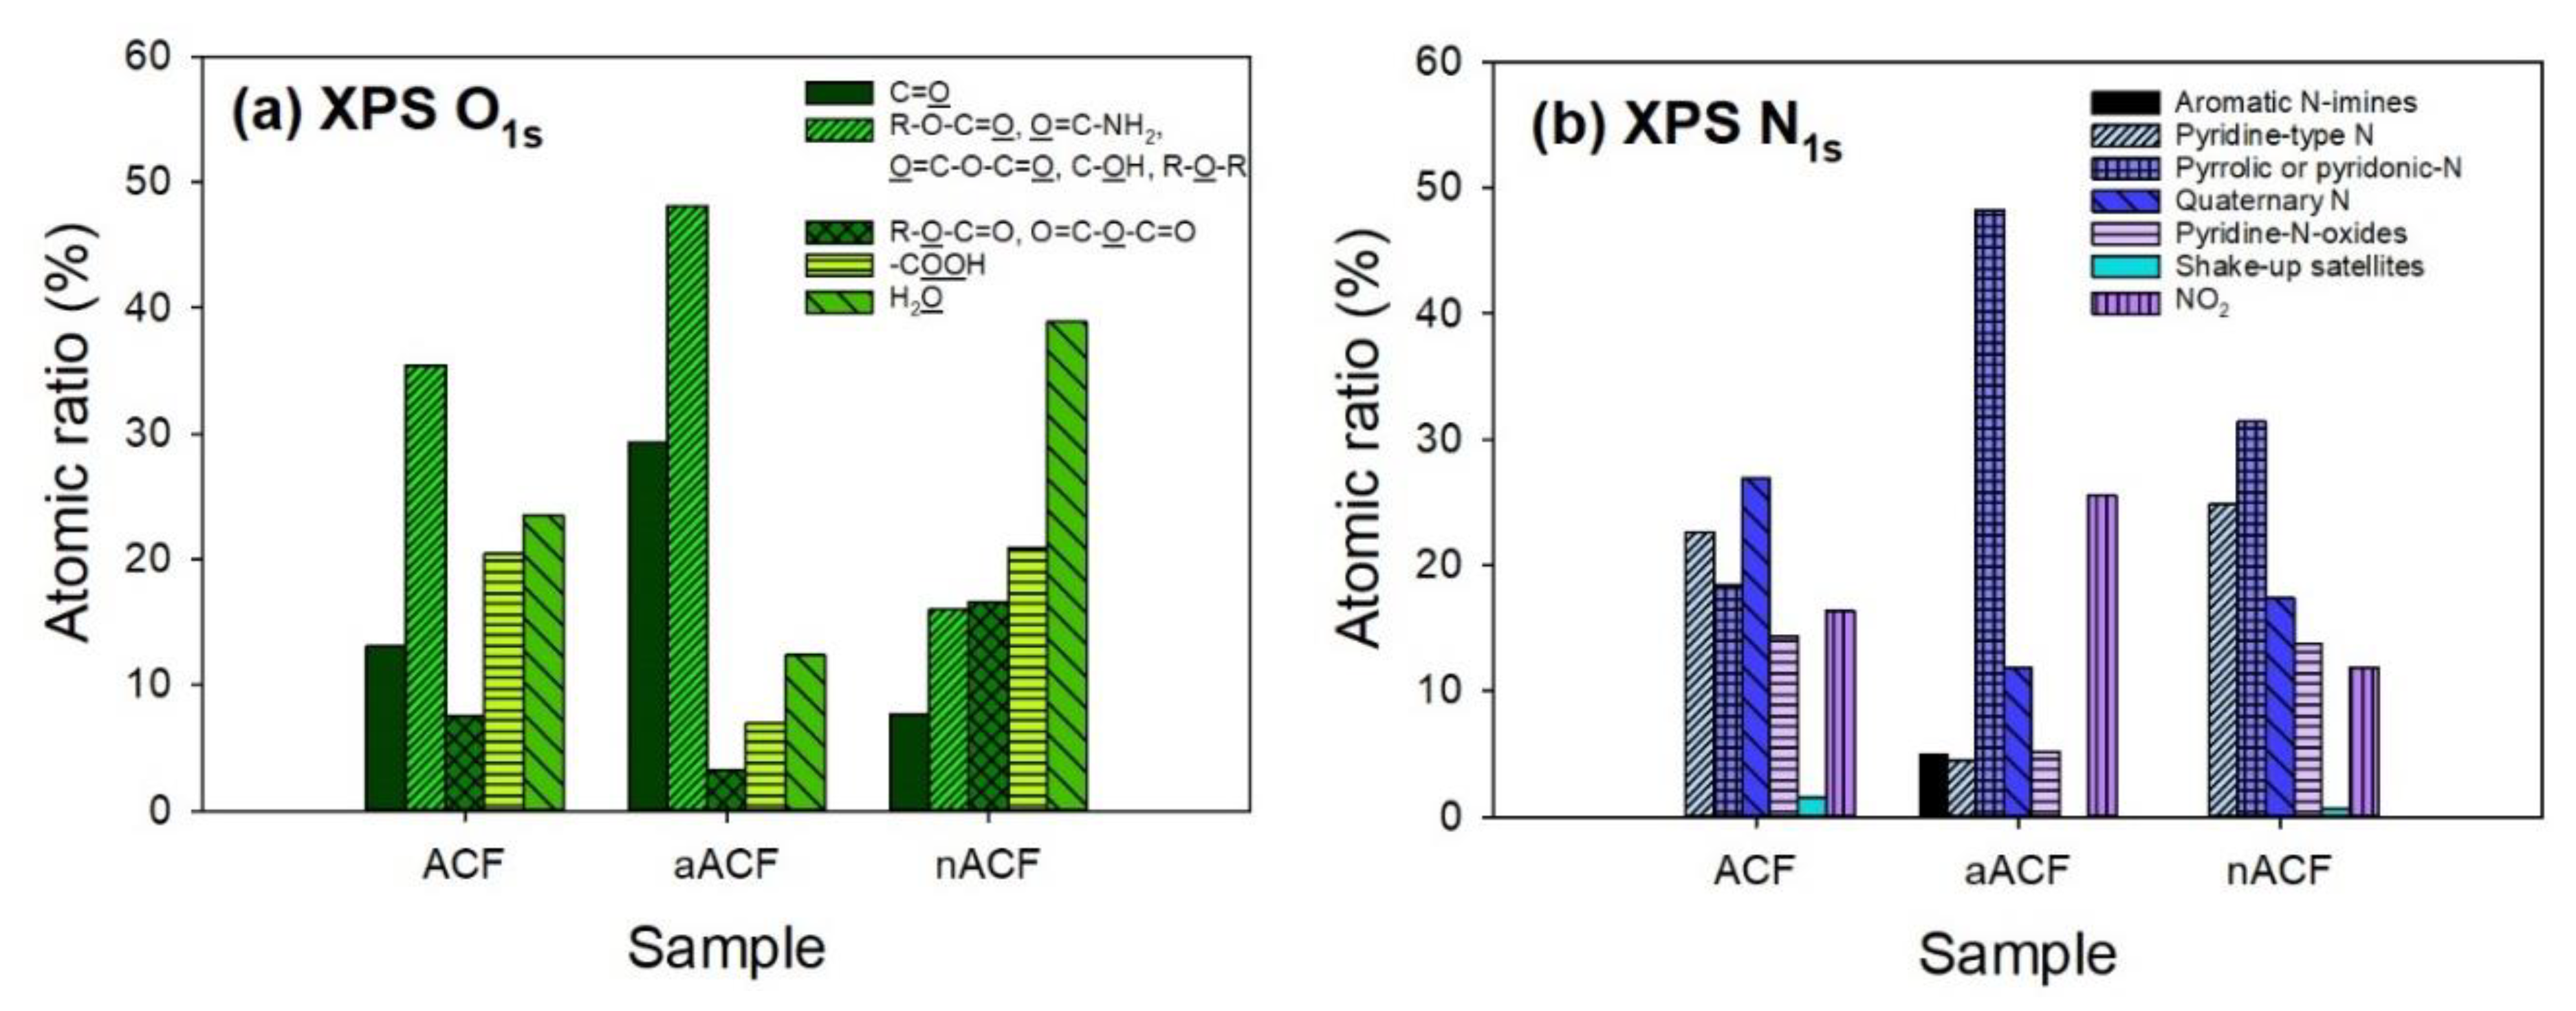
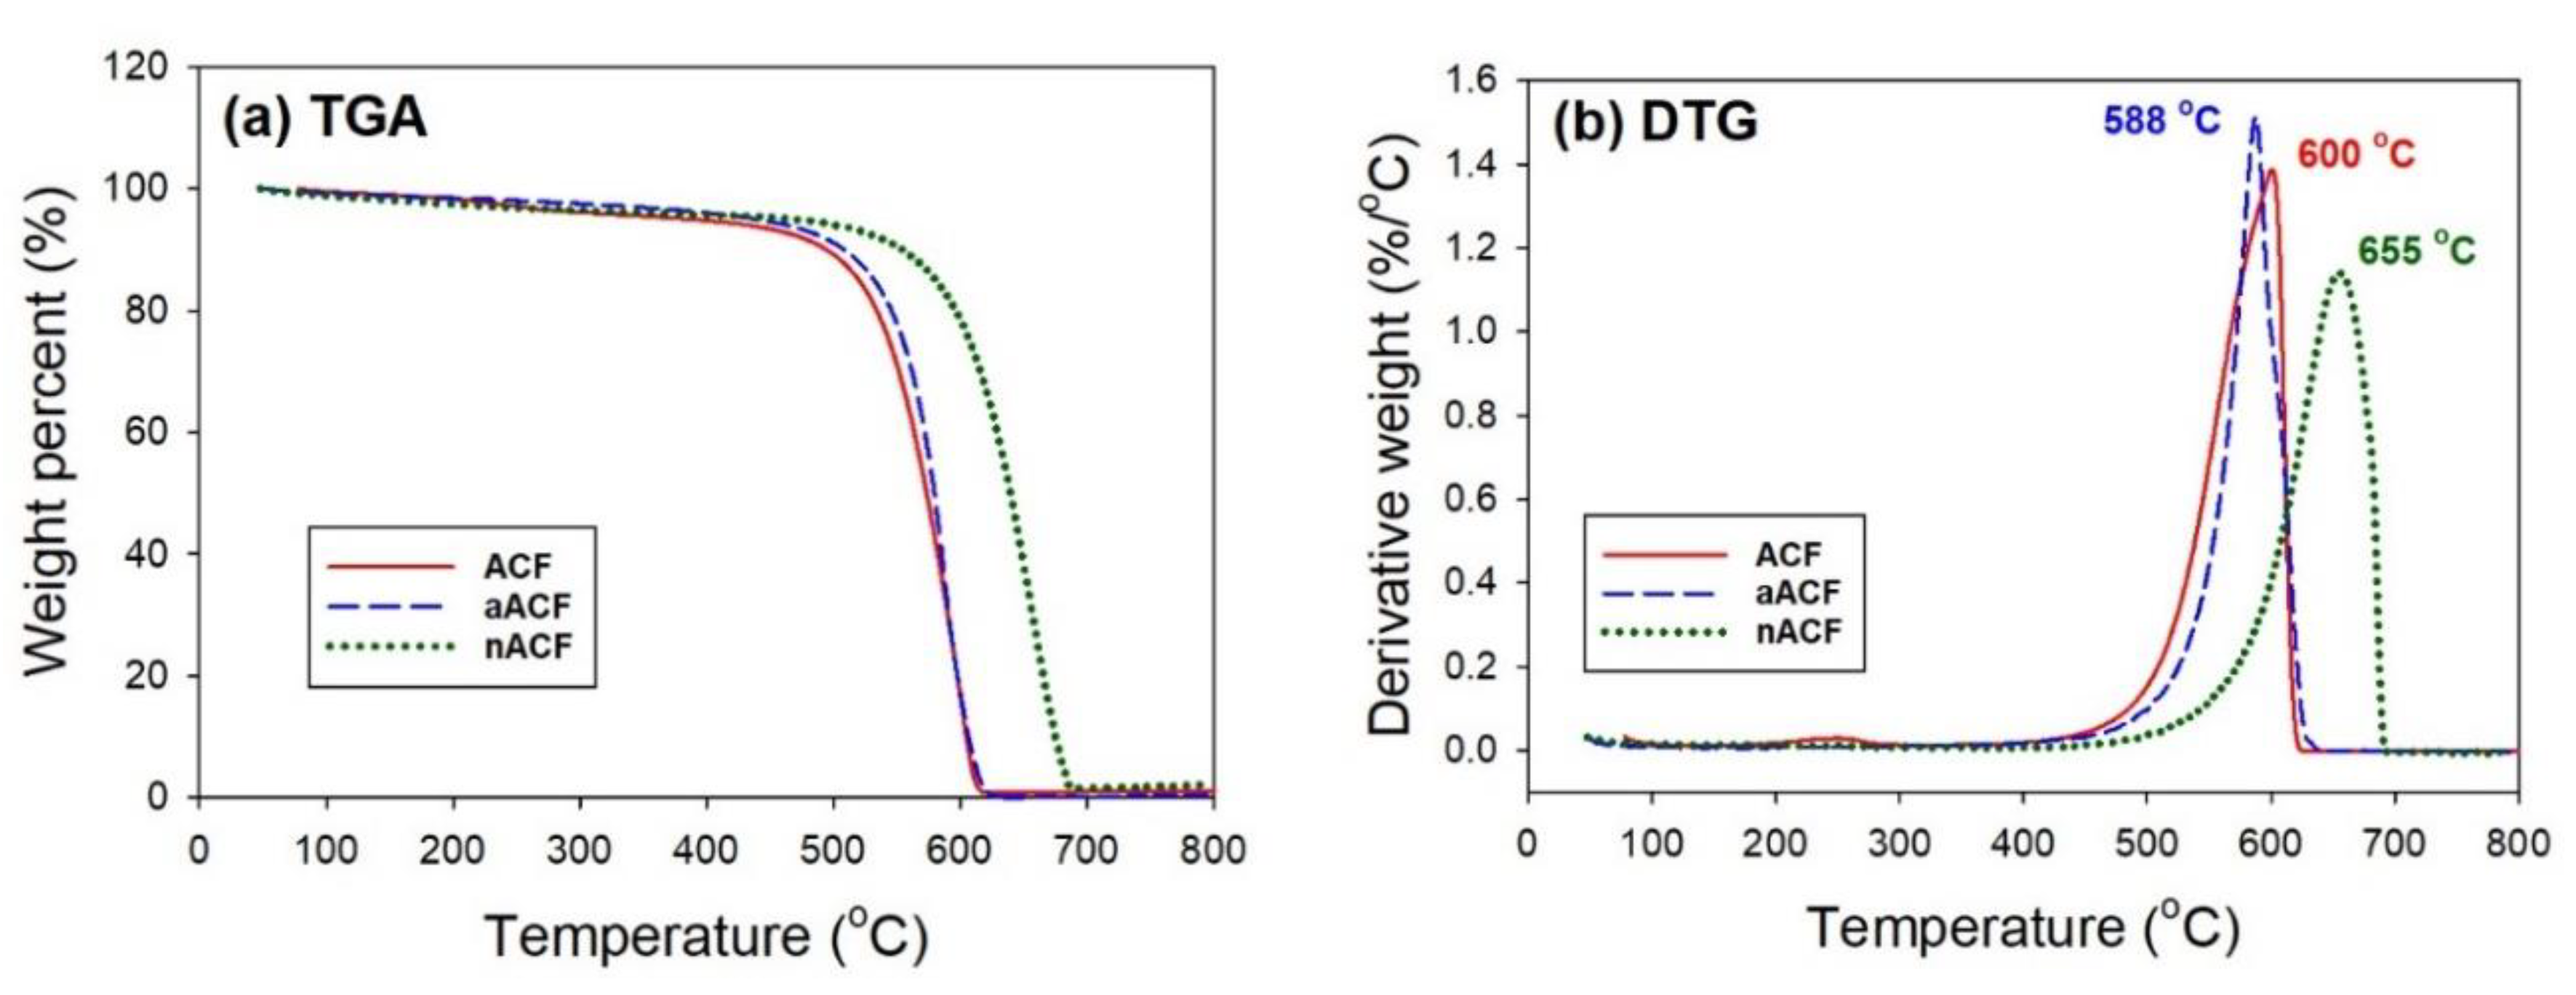
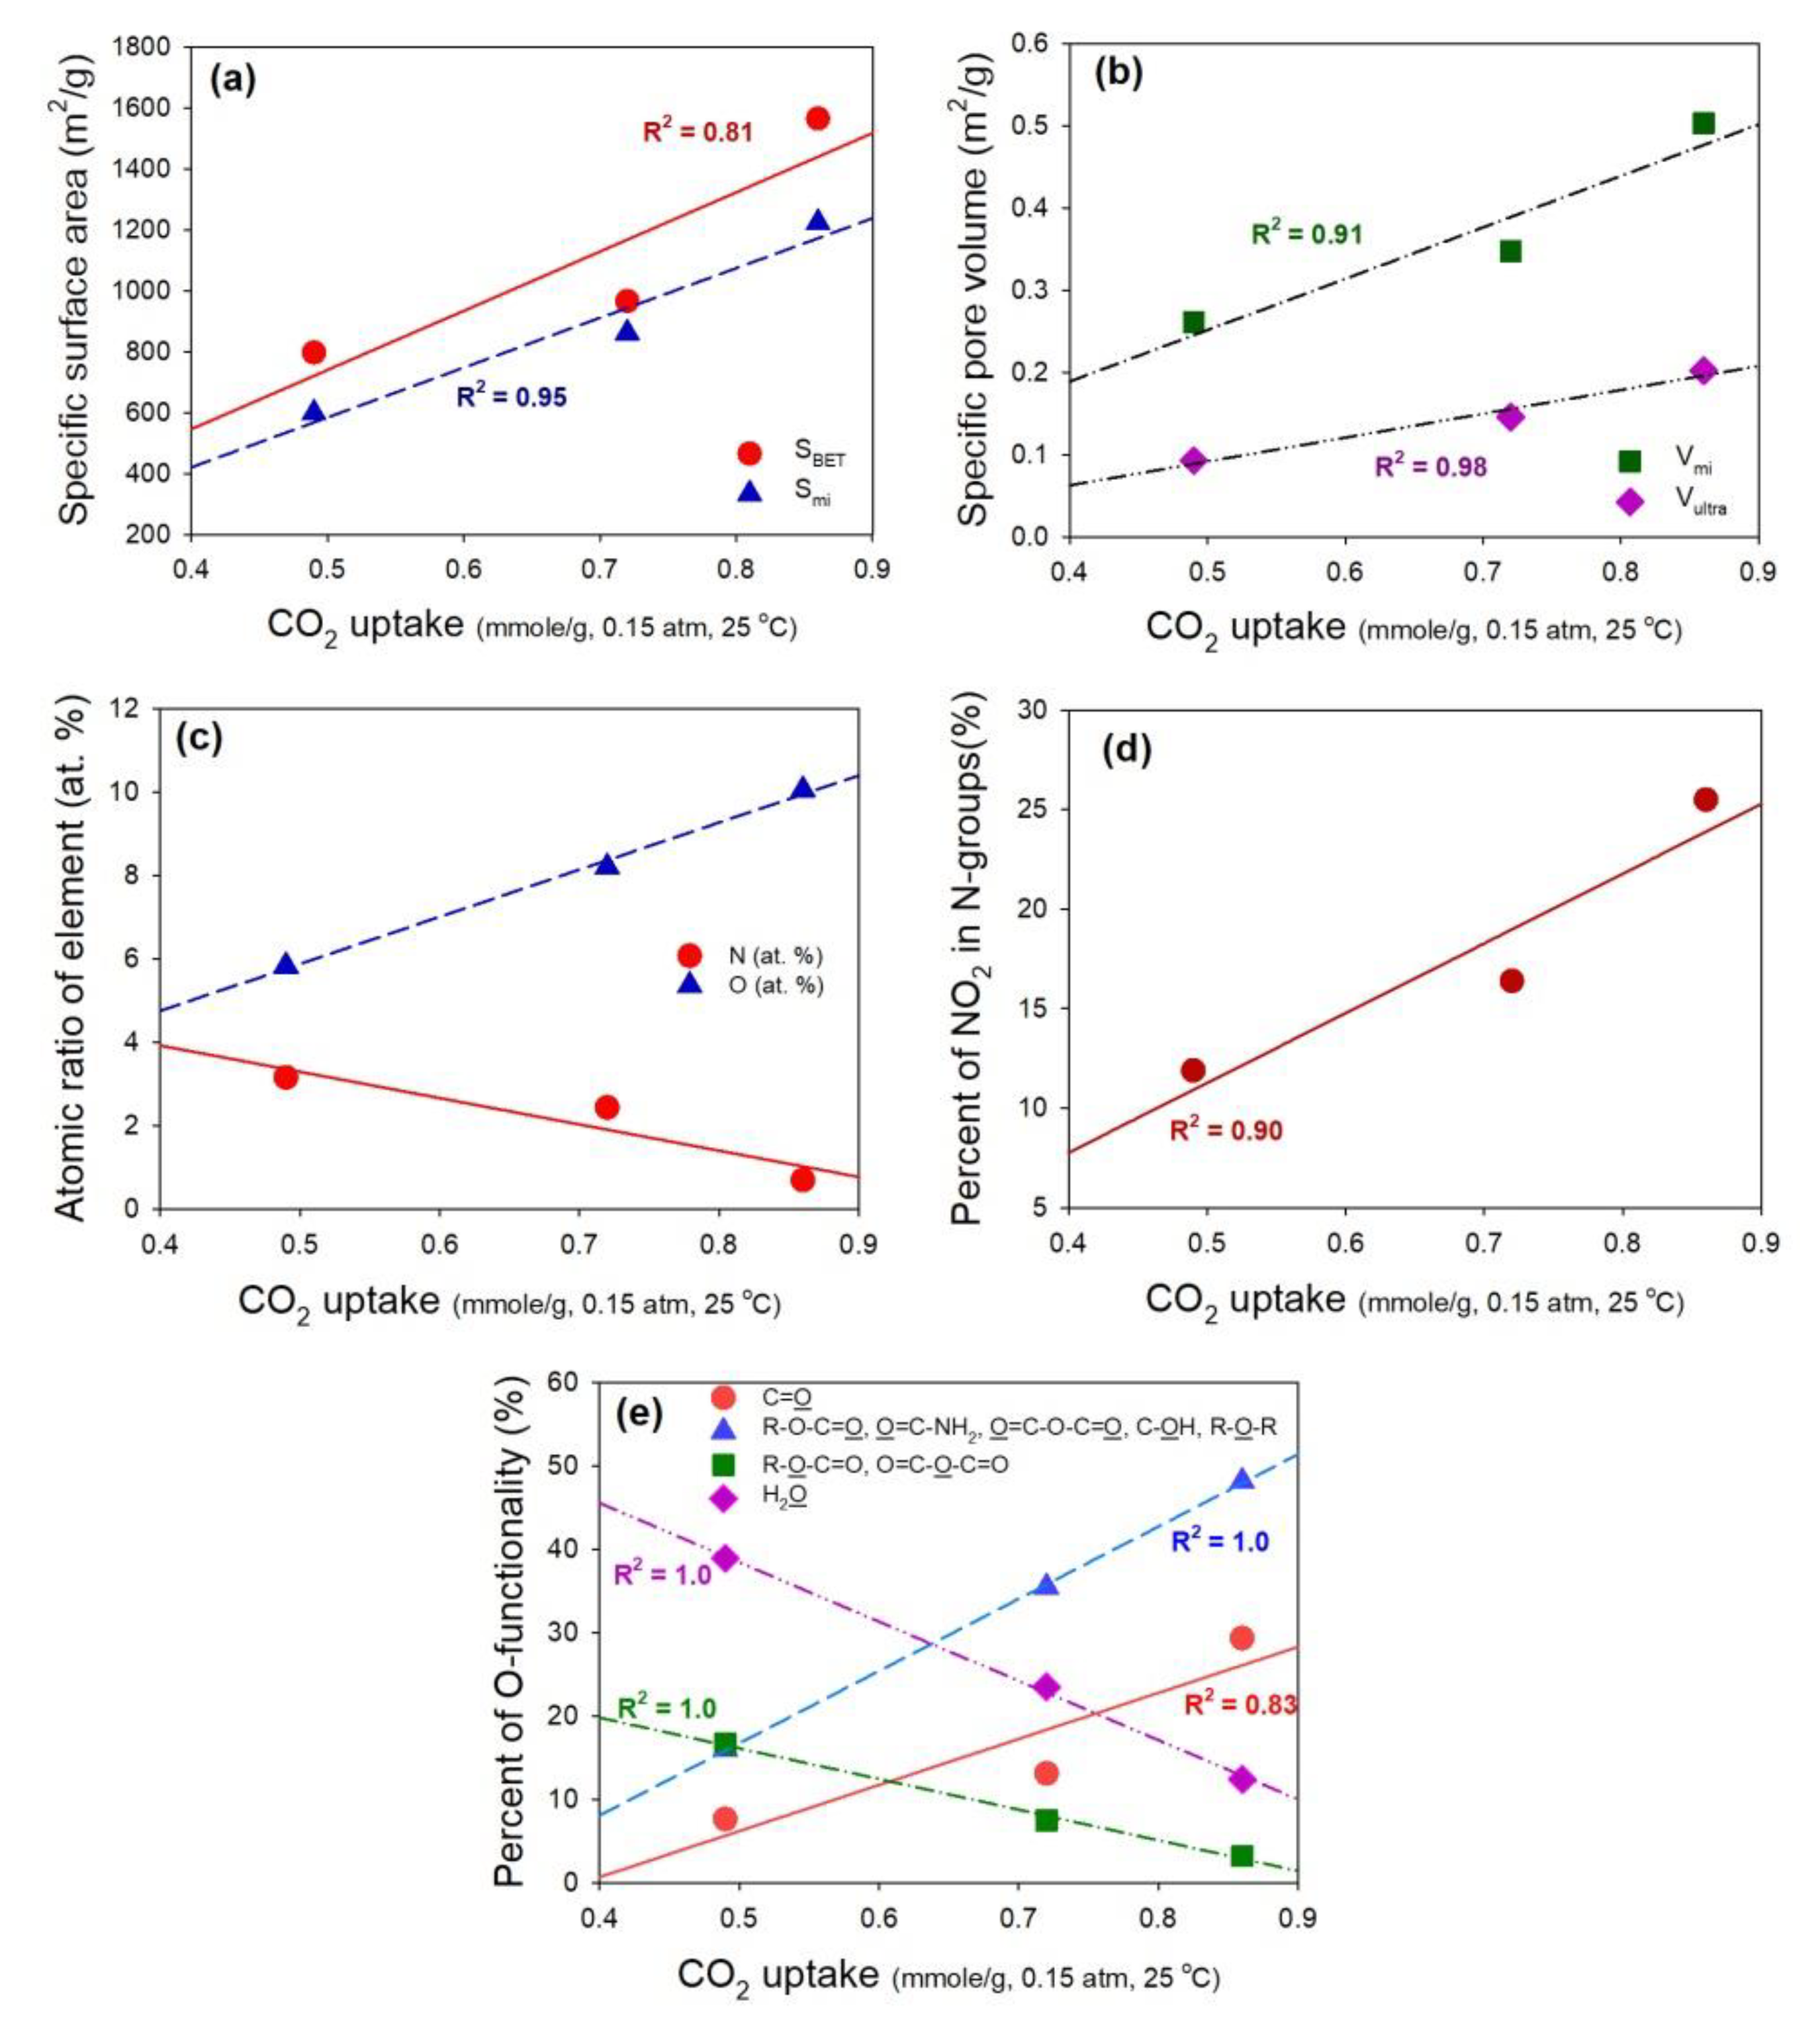
3.1. Textural and Chemical Characterization of the Adsorbents

The adsorption-desorption isotherms of N2 were acquired at −196 °C to shed light on the effect of surface modifications on porous features of the adsorbents. Table 1 shows the surface textural properties of the adsorbents. The values of SBET for ACF, aACF and nACF were 966, 1565, and 797 m2/g, respectively. The highest Vt and Vmi occurred for the aACF sample, reaching 0.7357 and 0.5028 cm3/g. Specifically, ACF modified with KOH boosted the appearance of mesopores and micropores. The values of Vultra are also listed in Table 1, which follow the order aACF (0.2020 cm3/g) > ACF (0.1456 cm3/g) > nACF (0.0923 cm3/g). The KOH chemical activation of ACF gave rise to the formation of a pore skeleton, the development of porosity, and the intercalation of metallic potassium into the carbon matrix. At the activation temperature, the lattices of the carbon matrix expanded due to the action of very active and mobile metallic potassium, to give rise to a large amount of micropores [27,28]. The decrease in SBET, Vt and Vmi of ACF after TEPA modification could be attributed to the fact that the micropores were totally or partially blinded by N-functionalities [11]. The TEPA has a bulk and long-chain structure. Thus, the graft of TEPA on ACFs could hinder the gas molecules from getting access to the pores or depositing on the carbon surface. Moreover, if the TEPA was attached inside the pores of the ACFs, the pore would be filled with TEPA molecules and the available adsorption surface or volume would be reduced. Even though the surface area and pore volume of aACF was increased compared with the as-received ACF, the ratios of Smi/SBET, Vmi/Vt, and Vultra/Vt for aACF and nACF were less than those of ACF. On the other hand, the Vme for aACF and nACF raised to 2 and 1.2 times of that of ACF, respectively. It is believed that TEPA modification would block half of the macropores and close one fourth of the micropores, based on the data shown in Table 1. Several investigations have reported that KOH activation mainly generates micropores [10]; the results in this study revealed that KOH activation not only created new pores, but also widened the existing ones such that the increase of pore volume covered all pore size ranges. Figure 1 illustrates the pore size distributions (PSD) of the ACFs samples in the micropore and mesopore ranges. The previous discussion is strongly supported by Figure 1. The insets (a) and (b) of Figure 1 clearly present that, compared with ACF, the peaks of the PSD for aACF have shifted to the right, and there is a new peak at about 0.5 nm. Although nACF also has a new peak at about 0.5 nm, all peaks on its PSD are weakened, especially in the pores smaller than 0.7 nm.
Figure 2 shows the FESEM images of the adsorbents. The width of a filament of ACF was micro-scaled and the well-defined striations parallel to the fibrous axis were filled on the surface of the ACF (Figure 2a). The reaction with KOH made the longitudinal striations and corroded grooving more significant, and the surface of the filament was clean (Figure 2b). The redox reactions between various potassium-based compounds with ACFs were responsible for the change in the morphology of the ACFs [27]. On the other hand, the TEPA modification of ACFs did not cause any perceptible variation in the filament appearance (Figure 2c).
Previous studies have shown that CO2 adsorption capacities are closely linked to surface heteroatomic species of the adsorbents, especially to N-functionalities [11,19,29]. Accordingly, XPS was conducted to examine the surface chemical states. As seen from Figure 3a, the primary characteristic peaks in the survey scan spectra of the adsorbents are due to the photoelectrons of C1s, O1s, and N1s. The KOH activation of ACF resulted in a significant loss of nitrogen atoms during activation (Figure 3b), consistent with findings from Xing et al. [10]. The surface of ACF consisted of 8.2 at% of O1s and 2.4 at% of N1s, where the nitrogen originated from its PAN precursor (Figure 3b). The nitrogen content on nACF was not significantly increased, which could be ascribed to it undergoing a heat treatment at 500 °C after immersion. Nevertheless, the results confirmed that the surface of ACF has been decorated with nitrogen-based groups from TEPA. Figure 3c–d show a comparison of the N1s and O1s regions for the adsorbents. It is evident that the major groups of N−and O-functionalities have transformed to others after modifications.
In order to understand the chemical bonding states, deconvolution of high-resolution XPS O1s, and N1s peaks of the adsorbents was carried out. Deconvolution of the O1s region provided information on the distribution of the surface oxygen-functionalities. The optimal results were used to calculate the values of the atomic percent of oxygen-functionalities after curve fitting of the O1s region for the samples (Figure 4a). Four distinct types of O-functionalities including –C=O (531.1 eV); R-O-C=O, O=C-NH2, O=C-O-C=O, C-OH, R-O-R (532.3 eV), R-O-C=O, O=C-O-C=O (533.3 eV), and -COOH (534.2 eV), as well as the contribution of chemisorbed H2O (536.1 eV), can be identified [30]. This indicated that the oxygen atoms on aACF were primarily present as −OH and C = O groups. It is noted that on the surface on nACF, the existence of a great amount of chemisorbed water was detected, which is likely to be related to the introduction of nitrogen functionalities.
The composition and the atomic percent of N-functionalities on the surface of the adsorbents are shown in Figure 4b. Six nitrogen-based compounds were identified [31], including the aromatic N-imines (395.7 eV), the pyridine-type N (398.4 eV), the pyrrolic N or pyridonic N (400.1 eV), the quarternary N (401.2 eV), the pyridine N oxides (402.4 eV), and the chemisorbed NO2 (405 eV). Pyridonic N and pyrrolic N could not be differentiated from each other based on the current measurement technology [32]. In view of the fact that oxygen existed on the surface of the adsorbents and the pyrrolic N was much more unstable than pyridonic N at an elevated temperature [33], the functional groups occurring at 400.1 eV were probably pyridonic N. Arising from the precursor of ACF, the major N-functionalities were featured with the quarternary N and the pyridine type N. Even though the evolution of nitrogen took place significantly during the KOH activation process, pyridonic N was much more heat-resistant compared with other species. Since the nitrogen on the aACF originated totally from the ACF, it is believed that the pyridonic N was a more stable form. The distribution of N-functionalities on nACF displayed an increase in pyridonic N, which could be due to the functional groups in TEPA.
The TGA profiles are illustrated in Figure 5a, and the temperatures for the maximum rate of weight loss for ACF, aACF, and nACF were 600, 588, and 655 °C, respectively (in Figure 5b). Comparing the profiles of aACF with ACF, the oxidation resistance of the samples was not significantly changed after KOH activation. Possibly due to the total or partial blinding of micropores by N-functionalities, the oxidation resistance of ACF modified with TEPA was improved significantly.

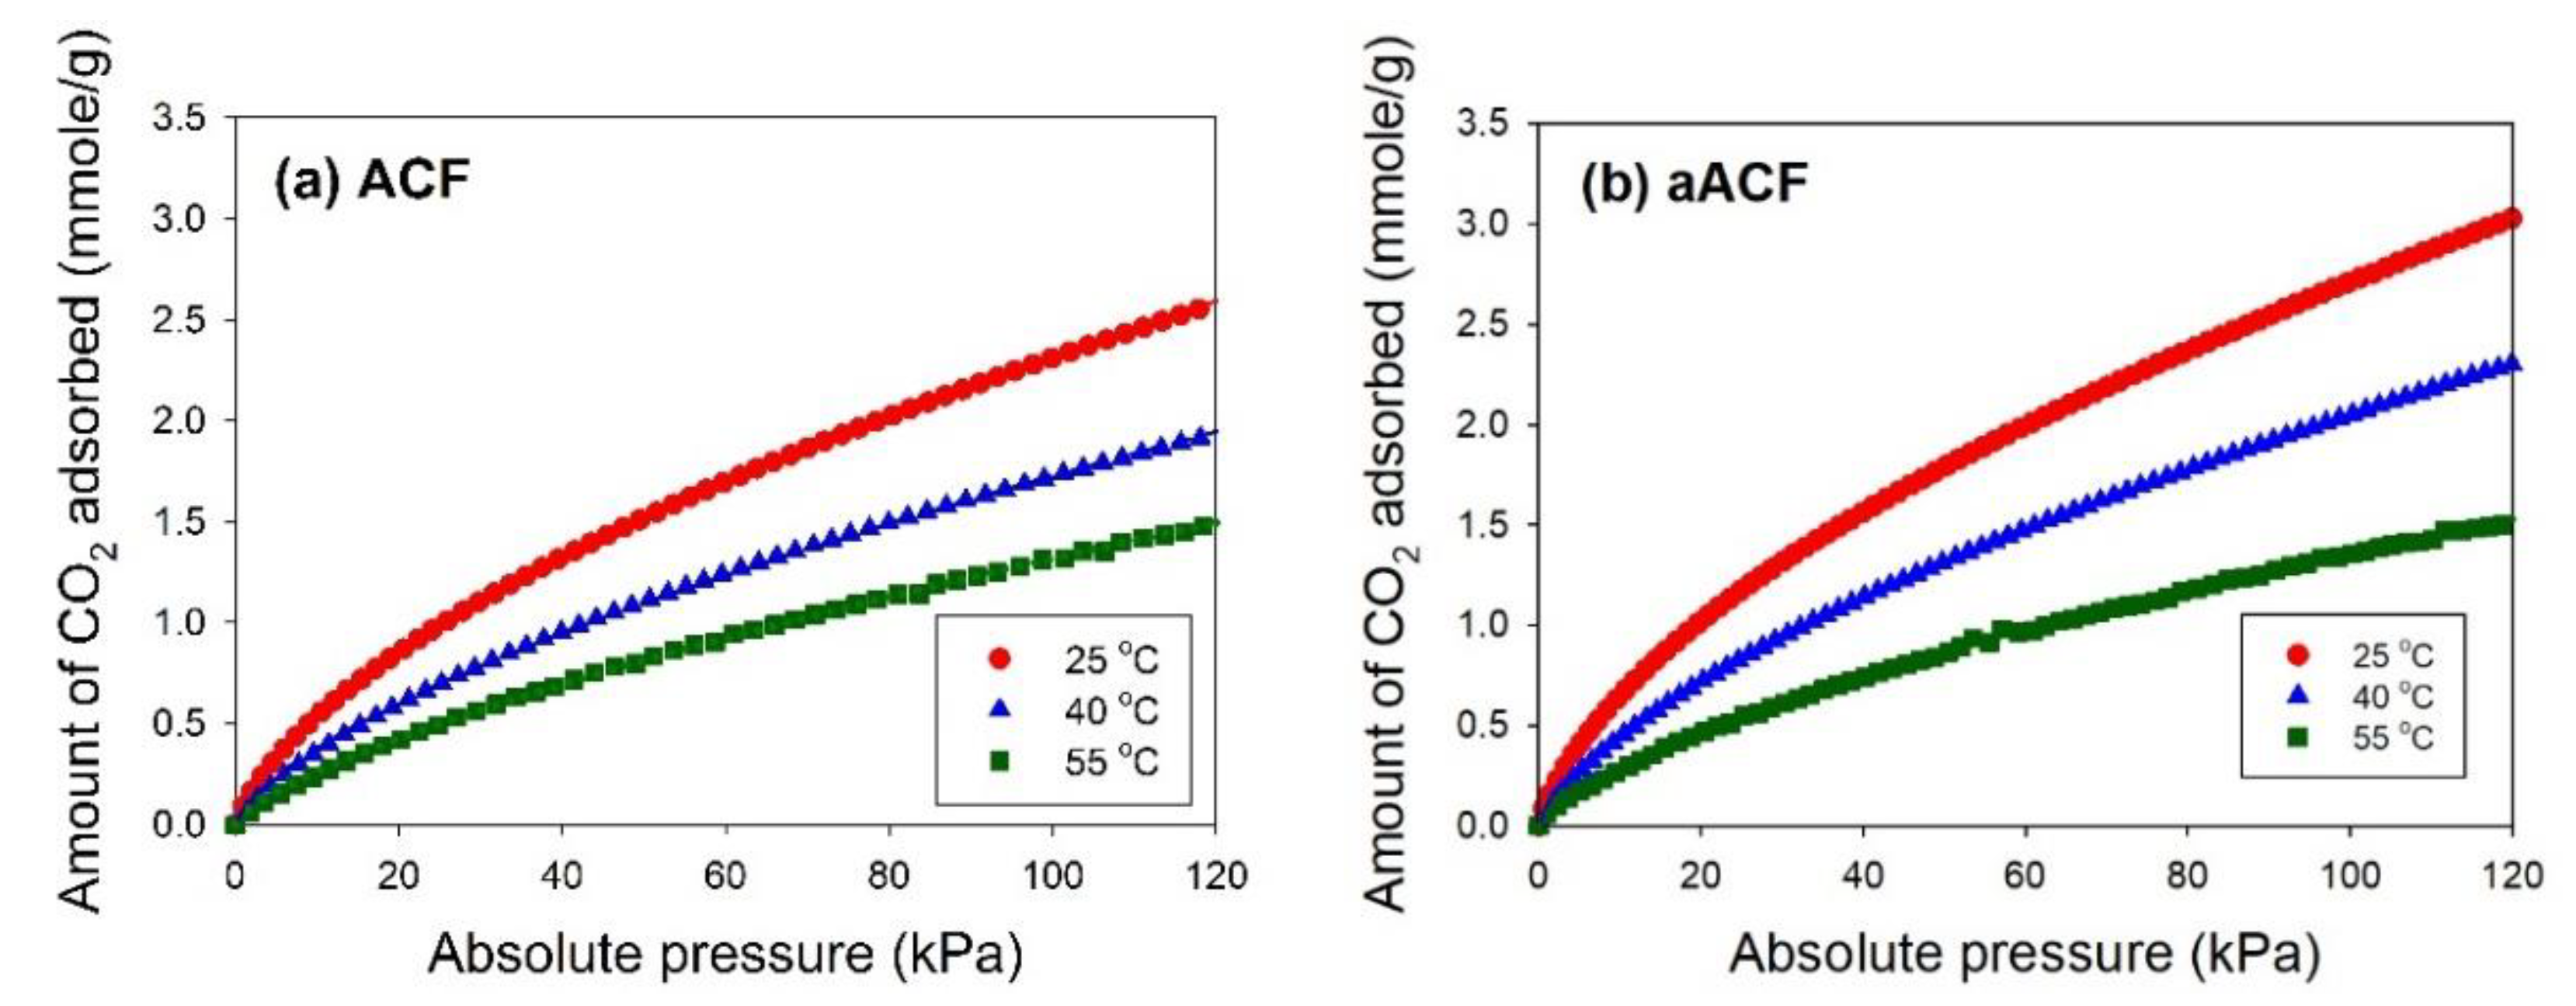
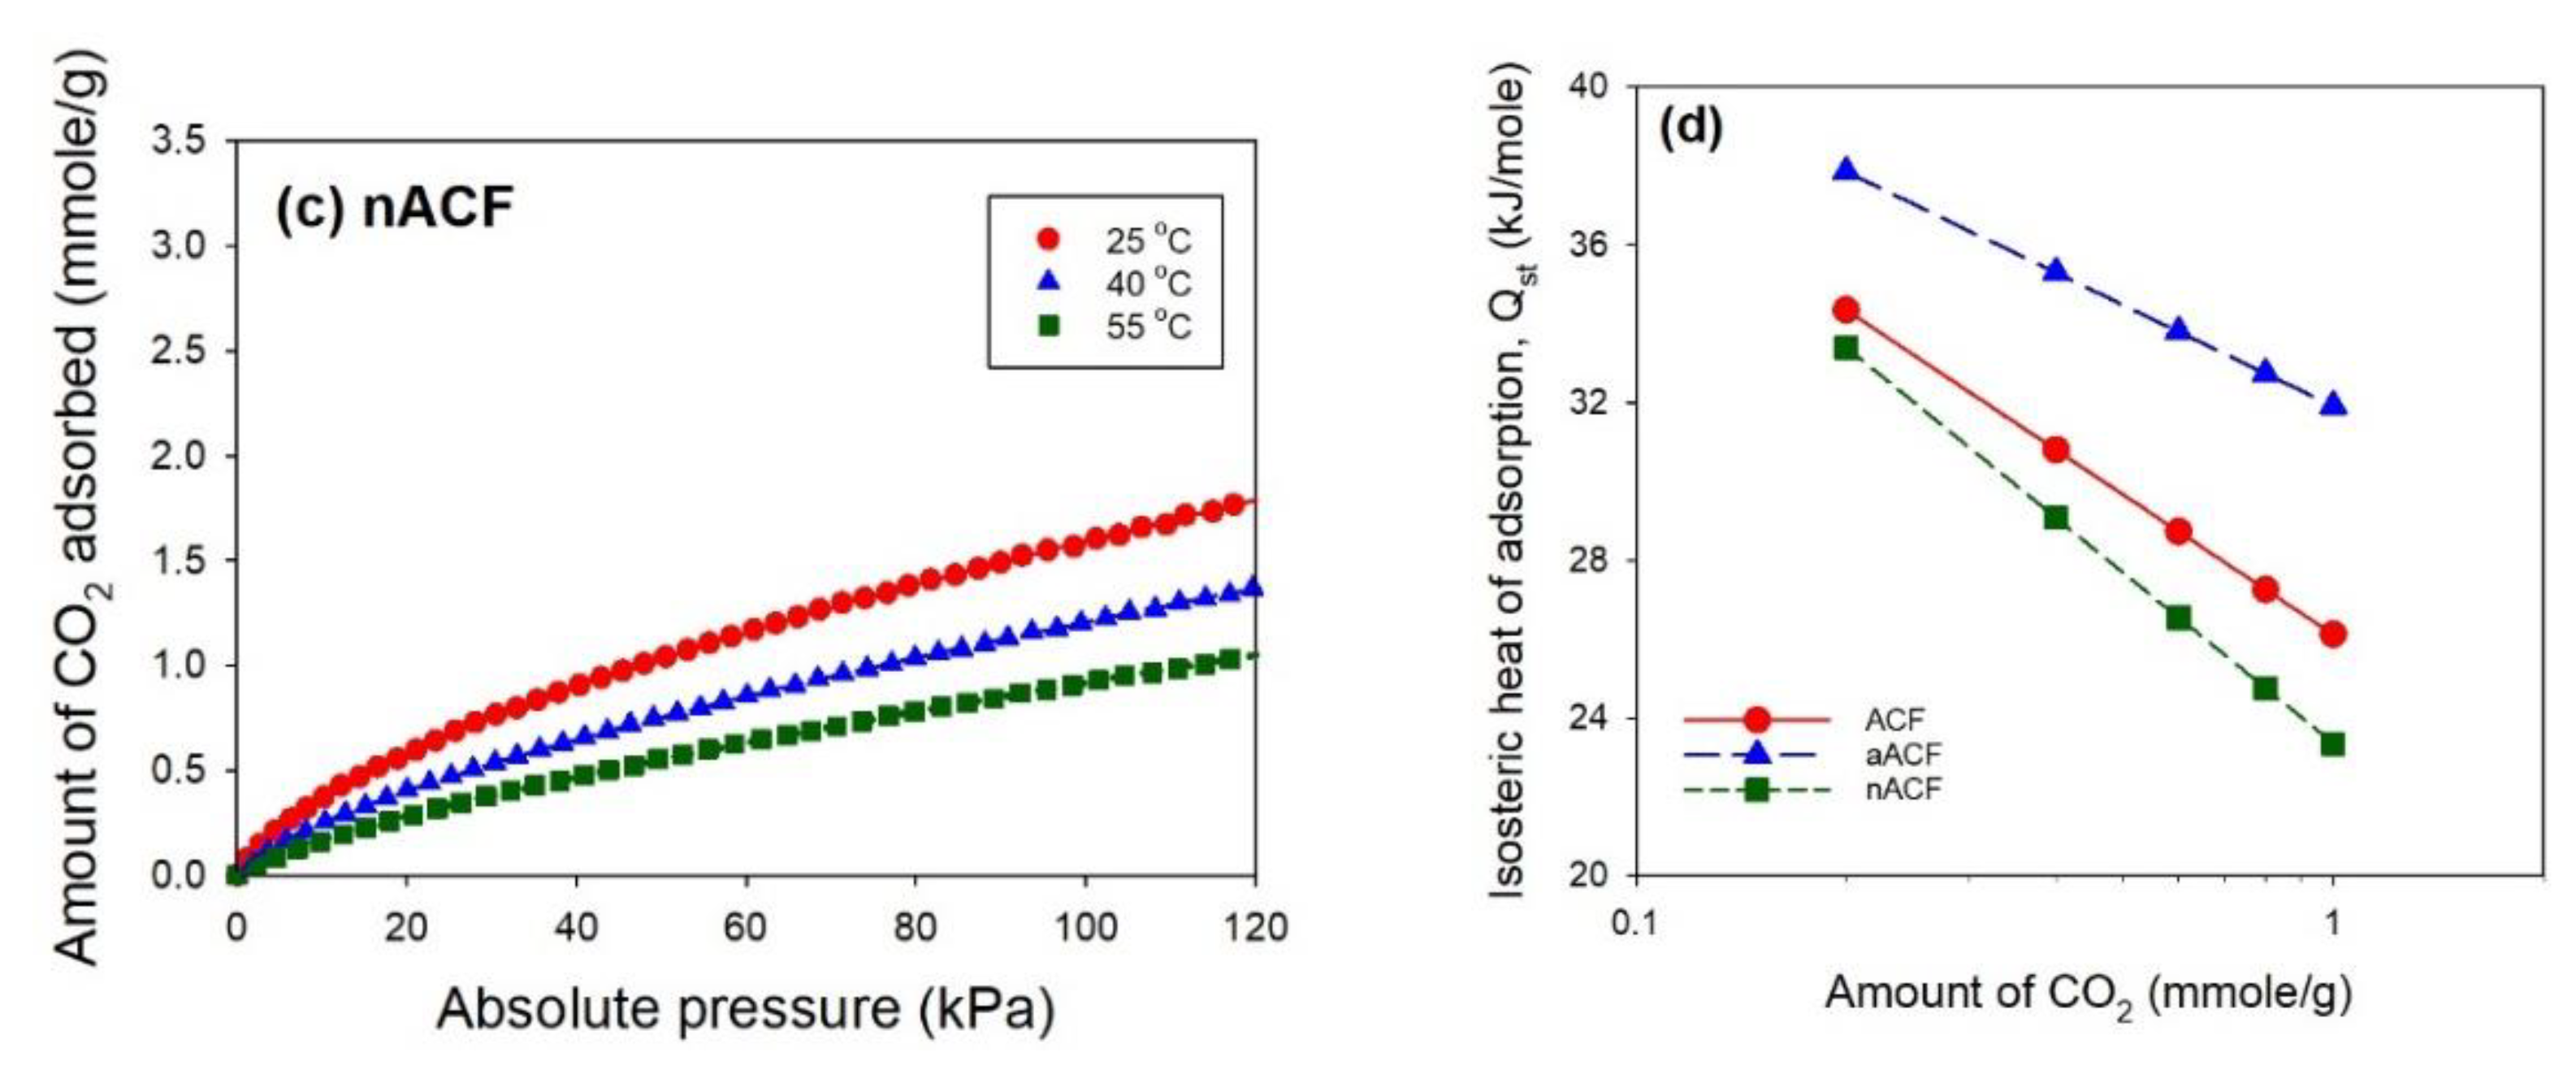
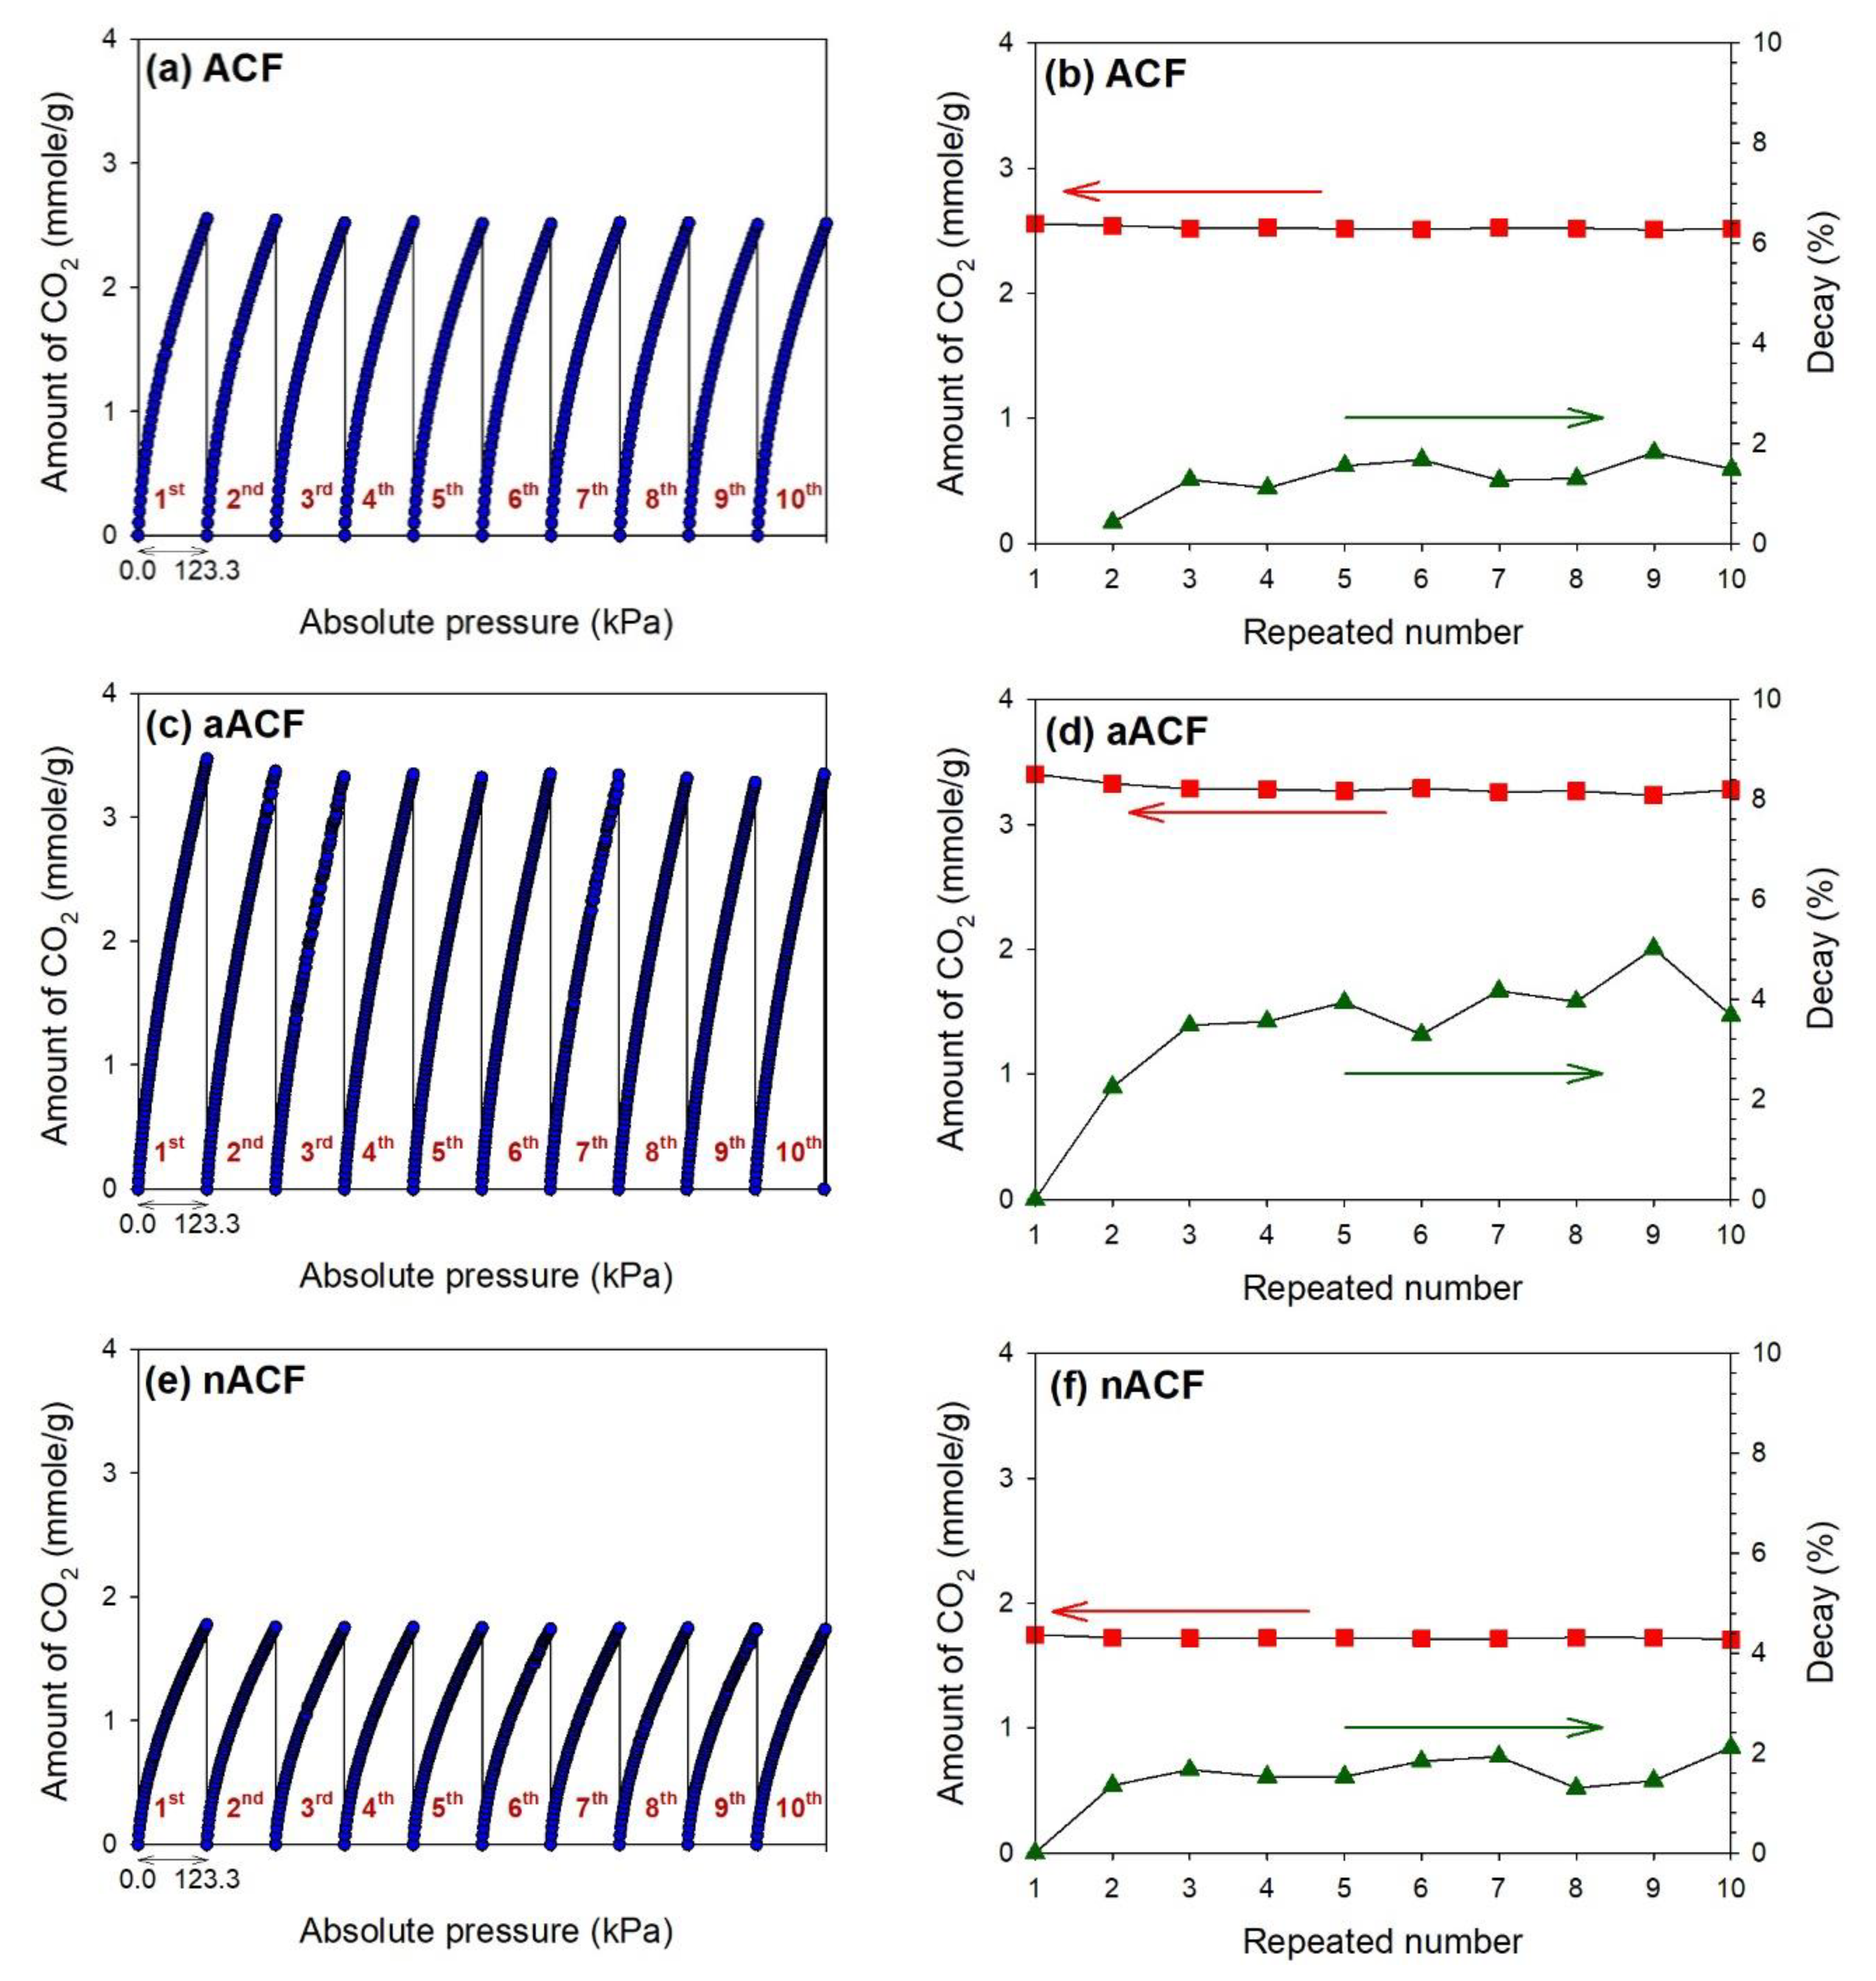
3.2. CO2 Adsorption Performance

The adsorption equilibrium data of CO2 on the adsorbents under a pressure of less than 120 kPa at different temperatures (25, 40, or 55 °C) are shown in Figure 6a–c. The equilibrium time for each measured point was held to 45 s after achieving the respective pressure value. The highest CO2 uptake of 2.74 mmole/g was observed on aACF at 25 °C and 1 atm, which was higher than those of ACF (2.33 mmole/g) and nACF (1.61 mmole/g). As the adsorption temperature increased, the adsorbed amounts of CO2 decreased. The temperature dependence of CO2 adsorption capacity was consistent with the behavior of an exothermic reaction.
The nitrogen content, though, was limited; aACF exhibited the highest percentage of imine groups and pyridonic groups. The presence of these groups might lead to its higher CO2 capacities. This implied that the CO2 adsorption capacities might be subject to not only the nitrogen content but also the type and the location of N-functionalities [6,21,34]. According to the results of Qst (Figure 6d), estimated from the adsorption data, the CO2 adsorption on aACF still behaved as a physical process. The calculated values of Qst for all adsorbents were under 40 kJ/mol, indicative of physical adsorption in the low CO2 uptake range of 0.2–1.0 mmol/g. The values of Qst decreased with increasing CO2 uptake, implying CO2 adsorption occurred on an energetically heterogeneous surface [35]. A linear relationship between Qst and the CO2 uptake was observed if the logarithmic scale of the amount of CO2 adsorbed was used. The value of Qst followed the order aACF > ACF > nACF, which indicated that the micropores in the adsorbents could have a more important role than the nitrogen functionalities.
The adsorption model has a significant effect on the characteristic of Qst [21]. According to previous experience, the Freundlich model was selected to curve-fit the experimental adsorption data, and Figure 6a–c also portrays the fitted curves. The fitted results are summarized in Table 2. The values of R2 were higher than 0.9993 and the ARE ranged from 1.0 to 2.4, indicating that the Freundlich equation provided a satisfactory fit for the adsorbents. The values of parameter n were greater than 1.3, implying the CO2 molecules had an affinity for the surface of the adsorbents. As seen from the data, the values of KF and n varied inversely with adsorption temperature, but took on a similar tendency with the CO2 uptake.
Further, in examining the correlation of CO2 uptake at a lower pressure (0.15 atm) and at 25 °C with the physical and chemical properties of the adsorbents, it was obvious that the CO2 adsorption capacity was highly associated with the micropores, especially the ultramicropore volume (Figure 7a–b), which indicated the importance of ultramicropores in CO2 adsorption at low pressures. It is noteworthy that the CO2 uptake changed positively with the surface oxygen content, but negatively with the surface nitrogen content (Figure 7c). In further analysis, for the N-functionalities, the percentage of NO2 groups was the only significant factor influencing the CO2 adsorption capacities (Figure 7d). However, for the O-functionalities, except for the −COOH group, all other O-groups were highly associated with the CO2 uptake. This indicated that the O-C coordination could be an adsorption mechanism for CO2 adsorption on ACFs, where the CO2 molecules (as an acidic gas) prefer to bind to the surface O-functionalities of ACFs [36]. For the purpose of comparison, Table 3 shows the CO2 adsorption capacities in this study and on various supporting materials, with or without modifications, from the literature. This comparison indicates that the CO2 adsorption on ACFs in this research were comparable or superior to other porous carbons.
The adsorption technique applied in gas separation required the cyclic regeneration of the adsorbents. Thus, multiple CO2 adsorption-desorption cyclic tests were conducted on the adsorbents to evaluate further practical applications. Figure 8 displayed ten cycles of adsorption-desorption experiments for CO2 adsorption at 25 °C. Within each cycle, the adsorbents were desorbed by subjecting them to the conditions of a dynamic vacuum. The adsorption capacities of CO2 were decayed by about 1.8% (ACF), 5.0% (aACF) and 2.1% (nACF) after 10 cyclic runs, respectively. Therefore, the adsorbents were judged to exhibit an excellent cyclability. The results presented in Figure 8 seem to suggest that the decay in adsorption efficiency was mostly taking place after the first adsorption cycle. It was expected that CO2 molecules could get into all pores in the first adsorption cycle, especially the ultramicropores. When the adsorbents were desorbed in a vacuum, some CO2 molecules could not escape effectively, most probably in the ultramicropores, because of the confinement effect. Thus, aACF, having the largest Vultra, exhibited the highest decay of the adsorption capacity after the first adsorption cycle.

4. Conclusions

For ease in practical applications, microporous ACFs for CO2 adsorption have been investigated. The KOH activation of ACFs generated increased pore volume, not only in the micropore but also in the mesopore ranges. A microporosity of 68% and ultra-micro-porosity of 28% were obtained in KOH-activated ACFs. Due to the total or partial blinding of micropores by N-functionalities, the TEPA-modified ACFs had a lower surface area and pore volume. Surface modification of ACFs gave rise to a change of the predominant surface functional groups. An increase in the amount of chemisorbed water on ACFs treated with TEPA should be the outcome of the introduction of polar nitrogen functionalities. The existence of basic nitrogen-containing functionalities was thought to lead to higher CO2 uptakes; however, there was no explicit relationship between them in our findings. Instead, the O-functionalities showed a highly associated linear relationship between the functional groups and the CO2 uptake. Despite this, the values of isosteric heat of adsorption still confirmed that in this study, the influence of micro-porosity on CO2 adsorption was prevailing. Moreover, the ACF samples exhibited excellent CO2 capture cyclability. Further studies should aim to find the optimal conditions for KOH activation of ACFs in order to improve their CO2 adsorption performance.

Author Contributions

Y.-C.C. conceived and designed the experiments, prepared, reviewed and edited this manuscript; C.-Y.Y. and C.-H.W. performed the experiments and analyzed the data. All authors have read and approved the final version of the manuscript to be submitted.

Funding

This research was funded by the Ministry of Science and Technology of Taiwan, grant number MOST 104-2221-E-0155-002.

Acknowledgments

The authors appreciated National Taiwan University and National Tsing Hau University to provide the technical support.

Conflicts of Interest

The authors declare no conflict of interest.

References

  1. Siriwardane, R.V.; Shen, M.S.; Fisher, E.P.; Poston, J.A. Adsorption of CO2 on molecular sieves and activated carbon. Energy Fuels 2001, 15, 279–284. [Google Scholar] [CrossRef]
  2. Lee, S.Y.; Park, S.J. Determination of the optimal pore size for improved CO2 adsorption in activated carbon fibers. J. Colloid Interface Sci. 2013, 389, 230–235. [Google Scholar] [CrossRef] [PubMed]
  3. Jadhav, P.D.; Chatti, R.V.; Biniwale, R.B.; Labhsetwar, N.K.; Devotta, S.; Rayalu, S.S. Monoethanol amine modified zeolite 13× for CO2 adsorption at different temperatures. Energy Fuels 2007, 21, 3555–3559. [Google Scholar] [CrossRef]
  4. Gray, M.L.; Soong, Y.; Champagne, K.J.; Pennline, H.; Baltrus, J.P.; Stevens, R.W., Jr. Improved immobilized carbon dioxide capture sorbents. Fuel Process. Technol. 2005, 86, 1449–1455. [Google Scholar] [CrossRef]
  5. Su, F.; Lu, C.; Chen, W.; Bai, H.; Hwang, J.F. Capture of CO2 from flue gas via multiwalled carbon nanotubes. Sci. Total Environ. 2009, 407, 3017–3023. [Google Scholar] [CrossRef]
  6. Sevilla, M.; Valle-Vigón, P.; Fuertes, A.B. N-doped polypyrrole-based porous carbons for CO2 capture. Adv. Funct. Mater. 2011, 21, 2781–2787. [Google Scholar] [CrossRef]
  7. Xiao, P.W.; Guo, D.; Zhao, L.; Han, B.H. Soft templating synthesis of nitrogen-doped porous hydrothermal carbons and their applications in carbon dioxide and hydrogen adsorption. Microporous Mesoporous Mater. 2016, 220, 129–135. [Google Scholar] [CrossRef]
  8. Lozano-Castelló, D.; Cazorla-Amorós, D.; Linares-Solano, A. Usefulness of CO2 adsorption at 273 K for the characterization of porous carbons. Carbon 2004, 42, 1233–1242. [Google Scholar] [CrossRef]
  9. Yang, R.; Liu, G.; Li, M.; Zhang, J.; Hao, X. Preparation and N2, CO2 and H2 adsorption of super activated carbon derived from biomass source hemp (Cannabis sativa L.) stem. Microporous Mesoporous Mater. 2012, 158, 108–116. [Google Scholar] [CrossRef]
  10. Xing, W.; Liu, C.; Zhou, Z.; Zhang, L.; Zhou, J.; Zhuo, S.; Yan, Z.; Gao, H.; Wang, G.; Qiao, S.Z. Superior CO2 uptake of N-doped activated carbon through hydrogen-bonding interaction. Energy Environ. Sci. 2012, 5, 7323–7327. [Google Scholar] [CrossRef]
  11. Maroto-Valer, M.M.; Tang, Z.; Zhang, Y. CO2 capture by activated and impregnated anthracites. Fuel Process. Technol. 2005, 86, 1487–1502. [Google Scholar] [CrossRef]
  12. Wu, X.; Yuan, B.; Bao, Z.; Deng, S. Adsorption of carbon dioxide, methane and nitrogen on an ultramicroporous copper metal–organic framework. J. Colloid Interface Sci. 2014, 430, 78–84. [Google Scholar] [CrossRef]
  13. De Souza, K.C.; Wickramaratne, N.P.; Ello, A.S.; Costa, M.J.F.; da Costa, C.E.F.; Jaroniec, M. Enhancement of CO2 adsorption on phenolic resin-based mesoporous carbons by KOH activation. Carbon 2013, 65, 334–340. [Google Scholar] [CrossRef]
  14. Vorokhta, M.; Morávková, J.; Řimnáčová, D.; Pilař, R.; Zhigunov, A.; Švábová, M.; Sazama, P. CO2 capture using three-dimensionally ordered micromesoporous carbon. J. CO₂ Util. 2019, 31, 124–134. [Google Scholar] [CrossRef]
  15. Im, J.S.; Park, S.J.; Kim, T.J.; Kim, Y.H.; Lee, Y.S. The study of controlling pore size on electrospun carbon nanofibers for hydrogen adsorption. J. Colloid Interface Sci. 2008, 318, 42–49. [Google Scholar] [CrossRef]
  16. Wickramaratne, N.P.; Jaroniec, M. Importance of small micropores in CO2 capture by phenolic resin-based activated carbon spheres. J. Mater. Chem. A 2013, 1, 112–116. [Google Scholar] [CrossRef]
  17. Pevida, C.; Drage, T.C.; Snape, C.E. Silica-templated melamine–formaldehyde resin derived adsorbents for CO2 capture. Carbon 2008, 46, 1464–1474. [Google Scholar] [CrossRef]
  18. Sevilla, M.; Falco, C.; Titirici, M.M.; Fuertes, A.B. High-performance CO2 sorbents from algae. RSC Adv. 2012, 2, 12792–12797. [Google Scholar] [CrossRef]
  19. Plaza, M.G.; Pevida, C.; Arenillas, A.; Rubiera, F.; Pis, J.J. CO2 capture by adsorption with nitrogen enriched carbons. Fuel 2007, 86, 2204–2212. [Google Scholar] [CrossRef]
  20. Yang, H.; Yuan, Y.; Tsang, S.C.E. Nitrogen-enriched carbonaceous materials with hierarchical micro-mesopore structures for efficient CO2 capture. Chem. Eng. J. 2012, 185, 374–379. [Google Scholar] [CrossRef]
  21. Hao, G.P.; Li, W.C.; Qian, D.; Lu, A.H. Rapid synthesis of nitrogen-doped porous carbon monolith for CO2 capture. Adv. Mater. 2010, 22, 853–857. [Google Scholar] [CrossRef]
  22. Fan, X.; Zhang, L.; Zhang, G.; Shu, Z.; Shi, J. Chitosan derived nitrogen-doped microporous carbons for high performance CO2 capture. Carbon 2013, 61, 423–430. [Google Scholar] [CrossRef]
  23. Bandosz, T.J.; Seredych, M.; Rodríguez-Castellón, E.; Cheng, Y.; Daemen, L.L.; Ramírez-Cuesta, A.J. Evidence for CO2 reactive adsorption on nanoporous S- and N-doped carbon at ambient conditions. Carbon 2016, 96, 856–863. [Google Scholar] [CrossRef]
  24. Suzuki, M. Activated carbon fiber: Fundamentals and applications. Carbon 1994, 32, 577–586. [Google Scholar] [CrossRef]
  25. Wang, Y.; Wang, J.; Ma, C.; Qiao, W.; Ling, L. Fabrication of hierarchical carbon nanosheet-based networks for physical and chemical adsorption of CO2. J. Colloid Interface Sci. 2019, 534, 72–80. [Google Scholar] [CrossRef]
  26. Foo, K.Y.; Hameed, B.H. Insights into the modeling ofadsorption isotherm systems. Chem. Eng. J. 2010, 156, 2–10. [Google Scholar] [CrossRef]
  27. Wang, J.; Kaskel, S. KOH activation of carbon-based materials for energy storage. J. Mater. Chem. 2012, 22, 23710–23725. [Google Scholar] [CrossRef]
  28. Otowa, T.; Tanibata, R.; Ltoh, M. Production and adsorption characteristics of MAXSORB: High-surface-area active carbon. Gas Sep. Purif. 1993, 7, 241–245. [Google Scholar] [CrossRef]
  29. Li, Y.; Xu, R.; Wang, B.; Wei, J.; Wang, L.; Shen, M.; Yang, J. Enhanced N-doped porous carbon derived from KOH-activated waste wool: A promising material for selective adsorption of CO2/CH4 and CH4/N2. Nanomaterials 2019, 9, 266. [Google Scholar] [CrossRef] [PubMed]
  30. Chiang, Y.C.; Lin, W.H.; Chang, Y.C. The influence of treatment duration on multi-walled carbon nanotubes functionalized by H2SO4/HNO3 oxidation. Appl. Surf. Sci. 2011, 257, 2401–2410. [Google Scholar] [CrossRef]
  31. Chiang, Y.C.; Lee, C.Y.; Lee, H.C. Surface chemistry of polyacrylonitrile- and rayon-based activated carbon fibers after post-heat treatment. Mater. Chem. Phys. 2007, 101, 199–210. [Google Scholar] [CrossRef]
  32. Pels, J.R.; Kapteijn, F.; Moulijn, J.A.; Zhu, Q.; Thomas, K.M. Evolution of nitrogen functionalities in carbonaceous materials during pyrolysis. Carbon 1995, 33, 1641–1653. [Google Scholar] [CrossRef]
  33. Marek, A.W.; Pels, J.R.; Moulijn, J.A. The fate of nitrogen functionalities in coal during pyrolysis and combustion. Fuel 1995, 74, 507–516. [Google Scholar]
  34. Díez, N.; Álvarez, P.; Granda, M.; Blanco, C.; Santamaría, R.; Menéndez, R. CO2 adsorption capacity and kinetics in nitrogen-enriched activated carbon fibers prepared by different methods. Chem. Eng. J. 2015, 281, 704–712. [Google Scholar] [CrossRef]
  35. Toth, J. Isotherm equations for monolayer adsorption of gases on heterogeneous solid surfaces. In Fundamentals of Adsorption; Myers, A., Belfort, G., Eds.; Engineering Foundation: New York, NY, USA, 1984; pp. 657–665. [Google Scholar]
  36. Chowdhury, S.; Parshetti, G.K.; Balasubramanian, R. Post-combustion CO2 capture using mesoporous TiO2/graphene oxide nanocomposites. Chem. Eng. J. 2015, 263, 374–384. [Google Scholar] [CrossRef]
  37. Shen, W.; Zhang, S.; He, Y.; Li, J.; Fan, W. Hierarchical porous polyacrylonitrile-based activated carbon fibers for CO2 capture. J. Mater. Chem. 2011, 21, 14036–14040. [Google Scholar] [CrossRef]
  38. Burchell, T.D.; Judkins, R.R. Passive CO2 removal using a carbon fiber composite molecular sieve. Energy Convers. Manag. 1996, 37, 947–954. [Google Scholar] [CrossRef]
  39. An, H.; Feng, B.; Su, S. CO2 capture capacities of activated carbon fibre-phenolic resin composites. Carbon 2009, 47, 2396–2405. [Google Scholar] [CrossRef]
  40. Moon, S.H.; Shim, J.W. A novel process for CO2/CH4 gas separation on activated carbon fibers—electric swing adsorption. J. Colloid Interface Sci. 2006, 298, 523–528. [Google Scholar] [CrossRef]
  41. Li, Q.; Yang, J.; Feng, D.; Wu, Z.; Wu, Q.; Park, S.S.; Ha, C.S.; Zhao, D. Facile synthesis of porous carbon nitride spheres with hierarchical three-dimensional mesostructures for CO2 capture. Nano Res. 2010, 3, 632–642. [Google Scholar] [CrossRef]
  42. Lee, M.S.; Park, S.J. Silica-coated multi-walled carbon nanotubes impregnated with polyethyleneimine for carbon dioxide capture under the flue gas condition. J. Solid State Chem. 2015, 226, 17–23. [Google Scholar] [CrossRef]
Figure 1. Pore size distributions of the activated carbon fiber samples obtained from the DFT method, where: inset (a) micropore range; inset (b) ultramicropore range.
Applsci 09 01977 g001
Figure 2. FESEM images of the samples: (a) as-received ACF; (b) KOH-activated ACF (aACF); (c) TEPA-modified ACF (nACF).
Applsci 09 01977 g002
Figure 3. The X-ray photoelectron spectroscopy (XPS) of the samples: (a) survey scan spectra; (b) atomic ratios; (c) N1s peaks; (d) O1s peaks.
Applsci 09 01977 g003
Figure 4. Results of the fits of the high resolutions X-ray photoelectron spectroscopy (XPS): (a) O1s region; (b) N1s region. The values were given in the atomic ratio (%) of total intensity.
Applsci 09 01977 g004
Figure 5. The profiles of (a) thermogravimetric analysis (TGA) and (b) differential thermogravimetry (DTG) of the samples.
Applsci 09 01977 g005
Figure 6. Adsorption isotherms of CO2 of the samples: (a) as-received ACF; (b) KOH-activated ACF (aACF); (c) TEPA-modified ACF (nACF) and (d) the isosteric heat of adsorption (Qst) of CO2.
Applsci 09 01977 g006aApplsci 09 01977 g006b
Figure 7. Correlation of equilibrium CO2 uptake at CO2 = 0.15 atm and 25 °C with the (a) BET surface area (SBET) and micropore area (S mi); (b) micropore volume (V mi) and ultramicropore volume (Vultra); (c) surface N and O content; (d) NO2 (%) in N-groups; (e) percentage of O-functionalities.
Applsci 09 01977 g007
Figure 8. Successive cyclic adsorption/desorption curves and the variation of adsorption capacities at 25 °C: (a, b) as-received ACF; (c, d) KOH-activated ACF (aACF); (e, f) TEPA-modified ACF (nACF).
Applsci 09 01977 g008
Table 1. Textural properties of the samples determined from the adsorption-desorption isotherms of N2 at −196 °C.
SampleSBET (m2/g)Smi α
(m2/g)
Vt β
(cm3/g)
Vme α
(cm3/g)
Vmi α
(cm3/g)
Vultra α
(cm3/g)
Smi/SBETVmi/VtVultra/Vt
ACF966 ± 168620.46350.04270.34720.14560.8920.7490.314
aACF1565 ± 2612240.73570.11350.50280.20200.7820.6830.275
nACF797 ± 105990.38480.06120.26100.09230.7520.6780.240
α Micropore area, micropore volume, ultramicropore volume, and mesopore volume were determined by the density functional theory (DFT) method, where an ultramicropore was defined as a pore size less than 0.7 nm. β Total pore volume (Vt) represented the single point total pore volume at P/Po ≈ 0.99.
Table 2. Curve-fitting of the Frenudlich equation for the CO2 adsorption data at different temperatures.
SampleTemperature (°C)KF (mmole/g/kPa1/n)nR2ARE (%)
ACF250.1341.610.99972.26
400.0841.520.99962.37
550.0521.430.99952.38
aACF250.1641.640.99981.89
400.1021.540.99981.76
550.0631.500.99931.54
nACF250.0891.590.99981.48
400.0521.470.99991.06
550.0311.360.99991.23
Table 3. Comparisons of CO2 uptake on the adsorbents in this study with various supporting materials from the literature.
Support MaterialsSurface ModificationSBET (m2/g)Concentration of CO2Adsorption Temp. (°c)CO2 Uptake (mmole/g)Reference
ACFsKOH15651 atm252.74This study
ACFsKOH527~17201 bar251.9~2.6[34]
ACFsKOH7801 atm25~1.0[37]
ACFs 14611 atm252.80[38]
ACFs 140~9251 atm200.55–2.28[39]
ACFs 907~19141 bar250.6~0.7 [40]
Carbon 13431 bar251.50[14]
Hierarchical carbon nanosheetKOH15561 bar253.10[25]
Carbon sphereEthylenediamine5501 atm252.90[41]
CarbonSOCl2, TEPA8231 bar253.2[20]
CarbonKOH, urea8621 bar252.91[29]
Silica-coated MWCNTsPolyethylene-imine3751 bar251.41[42]

