Abstract
The effects of rare earth yttrium (Y) additions and the heat treatment process on the microstructure and mechanical properties of as-cast ADC12 aluminum alloy have been investigated. The results showed that the primary Si crystals were significantly refined from long axis to fibrous or granular when the Y content was 0.2 wt%. Compared to the matrix, the mean area and aspect ratio were decreased by 92% and 75%, respectively. Moreover, the Si and Fe-rich phases were spheroidized and refined with a small average size during the solid solution. It was also noted that the copper-rich phases were dissolved into the matrix. Correspondingly, it was found that after metamorphic and heat treatment the ultimate tensile strength (UTS), elongation, and, hardness increased by 81.9%, 69.7%, and 74.8%, respectively, compared to the matrix. The improved mechanical properties can primarily be attributed to the optimization of the microstructure and the refinement of various phases.
1. Introduction
Due to its excellent castability and mechanical properties, ADC12 alloy has attracted the attention of the automotive and aviation industry [1]. However, the coarse or lamellar shape of eutectic Si and long needle-like iron-rich phases exists in the alloy and reduces the mechanical properties and elongation [2]. Thus, ADC12 aluminum alloy applications are also severely limited.
The microstructure of the alloy has been improved by the addition of some special elements. Currently, some reports indicate that the distribution of eutectic silicon, or other phases in the matrix, were improved effectively by adding rare earth [3] or alkali metal [4] to the melt. The coarse or lamellar shape eutectic Si was changed into fine or short rod-like particles and the acicular β-Al5FeSi was modified into short rods. Among them, rare earth Y has attracted much attention from scholars due to its low price and remarkable effect. Li. et al. [5] studied the effect of rare earth Y on the hot-tearing behavior of Al-Cu alloy. They revealed that Y has a distinct grain refining effect on the alloy, which decreased the liquidus temperature and shortened the crystallization range. Zhang et al. [6] found that the grains of an Al-Zn-Mg-Cu-Zr alloy were significantly refined by adding a mix of rare earth elements (Gd and Y). Several researchers [7,8] demonstrated that the rare earth Y has an excellent refining effect on Si and iron-rich phases while also reducing alloy defects.
However, the microstructure of the alloy can still be further optimized, even if an appropriate amount of rare earth has been added. Recently, some researchers found that a heat treatment process could further improve the microstructure of aluminum alloy containing rare earths. Yan et al. [9] demonstrated that an excellent microstructure could be obtained by heat treatment on an AlSi10Cu3 alloy with the rare earths La and Yb. The heat treatment process promotes solid solution and precipitation strengthening. Furthermore, the La3Al11 and Si phases acted as strengthening phases in the alloy and were spheroidized and dispersed.
In this study, the effect of Y addition and solid solution, and Y addition on the microstructure of ADC12 alloy was investigated. The purpose was to find the optimum Y content, study the modification mechanism of rare earth, and study the effects of heat treatment on the various phases of the ADC12 alloy.
2. Materials and Methods
Commercial ADC12 alloy was selected as the matrix. An electrical resistance furnace and a graphite crucible were chosen for preparation of the alloys. The ADC12 alloy was melted at 750 °C and held for 10 min. Then, the Al-10Y master alloy was added into the melt at 720 °C to prepare the composites with various contents of Y (0 wt%, 0.1 wt%, 0.2 wt%, and 0.3 wt%). The fabricated alloy was then deslagged and poured into a preheated mold (400 °C). An illustration of the mold used is shown in Figure 1. To evaluate the tensile properties, the test samples were machined into tensile test bars with a diameter of 6 mm and a gauge length of 30 mm, as seen in Figure 1, in accordance with China Standard GB/T228-2002. In order to ensure the uniformity of the various phases in the alloys, the amount of ADC12 alloy per casting was controlled at approximately 300 g. The tests were carried out at room temperature using a SUNC UM5105 electro-servo testing machine. A controlled tensile speed of 1 mm/min and a 100 KN load cell were used. In addition, the compositions of the fabricated alloys in this study were analyzed by inductively coupled plasma-atomic emission spectrometry (ICP-AES, as shown in Table 1.
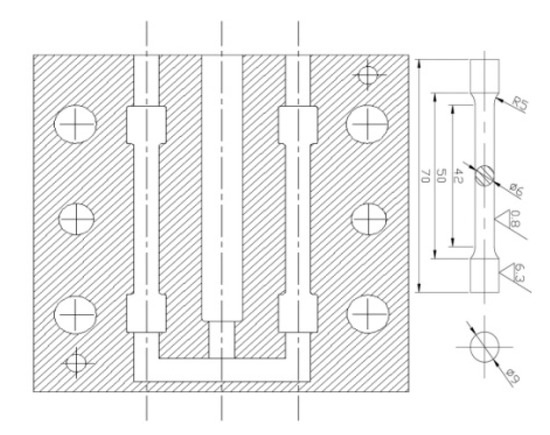
Figure 1.
Illustration of the mold and tensile test sample.

Table 1.
Chemical composition of the alloys (wt.%).
The microstructure and mechanical properties of the composites were then investigated, and the optimum amount of added Y was selected. The composite samples with the optimal Y addition amounts were placed into an SX24-13 type resistance furnace. The holding time was 8 h and the solution temperature was set to 500, 520 and 540 °C. Immediately, the samples were taken out and placed in water to cool.
The microstructures of all samples selected were observed with an optical microscope (OM, OLYMPUS BX51 microscope, Olympus Metrology, Inc., Tokyo, Japan) and a scanning electron microscope (SEM, Quanta 200 FEI Metrology, Inc., Hillsboro, OR, US) equipped with energy disperse spectroscopy (EDS, FEI Metrology, Inc., Hillsboro, OR, USA) after being etched by 0.5 vol pct hydrofluoric acid in water. The software IPP6.0 image (Media Cybernetics Co., Rockville, MD, USA) and OriginPro 8.5 (OriginLab Co., Northampton, MA, USA) were used for quantitative and data analysis, respectively. The calculation methods [10] of these parameters were as follows:
where is the area of a single silicon particle, is the ratio of the longest to shortest dimensions of a single silicon particle of a single field, is the length of a single β-Fe phase or α-Al phase secondary dendrite arm spacing (SDAS), is the number of a single field and is the number of the fields.
3. Results
3.1. Effects of Y Addition on the α-Al Phases
Figure 2 is the SEM image of the matrix without Y addition. Figure 3 represents the optical micrographs of as-cast ADC12 alloys with various Y additions, and demonstrates a substantial difference in the microstructure in terms of the size and morphology of the α-Al phases. As shown in Figure 2 and Figure 3, the outline of the α-Al phases of the alloy without Y addition was not clear. The eutectic silicon exhibited either a coarse needle or plate shape. The Al2Cu and iron-rich γ phase show the plate-like and skeleton-like attributes, respectively. In comparison, the α-Al phases of the alloy containing 0.1 wt% Y had a very clear outline and the SDAS value decreased from 48.5 to 33.5 μm. In accordance with Figure 3b,c, the α-Al primary phase exhibited an ellipsoidal shape and the SDAS value further reduced to 20.3 μm when Y addition was 0.2 wt%. This phenomenon means that the α-Al phases were further refined due to the addition of Y. However, as shown in Figure 3d, the refined α-Al primary phase increased when the amount of Y was further increased up to 0.3 wt%.
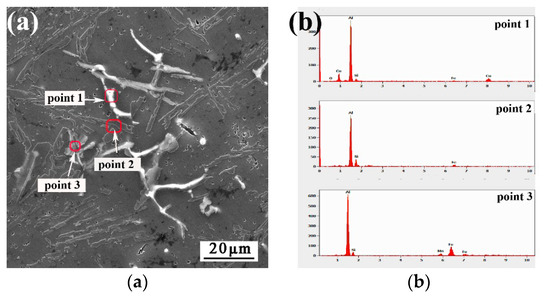
Figure 2.
SEM images and EDS of ADC12 alloys. (a) SEM image; (b) Corresponding EDS results.
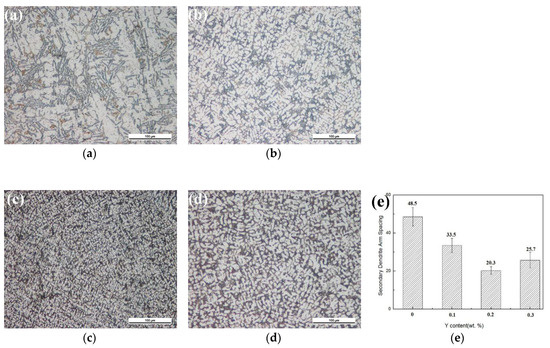
Figure 3.
Optical micrographs of as-cast ADC12 alloys with different contents of Y addition: (a) unmodified; (b) 0.1 wt% Y; (c) 0.2 wt% Y; (d) 0.3 wt% Y; and, (e) SDAS of α-Al phases with different additions Y.
According to the Hume-Rothery rules, almost no solid solubility can be formed in the alloy unless the atomic radius difference between the solvent and the solute is <15%. As we know, the atomic radius of Y and Al are 0.182 and 0.143 nm, respectively. The atomic radius difference is 27%. Hence, the Y element has difficulty entering the crystal lattice of primary phase α-Al. Instead, the rare earth element concentrates in the front of the solid–liquid interface. This phenomenon restricts the growth of α-Al grains and leads to a strong constitutional undercooling that promotes the nucleation of grains [11,12]. On the other hand, rare earth Y may react with O and Al2O3 to produce Y2O3 according to Yu et al. [8]. The lattice structure of Y2O3 was similar to the lattice of the α-Al phases. Y2O3 could act as the nucleus of α-Al and increase the number of α-Al dendrites, resulting in a decrease in α-Al dendrite size.
3.2. Effects of Y Addition on the Si and Fe-Rich Phases
Figure 4 exhibits the morphology of the eutectic Si and Fe-rich phases in ADC12 alloy with different amounts of Y addition. The aspect ratio and mean area of the eutectic Si phases are illustrated in Figure 4e,f. In Figure 4a we can see that the eutectic Si phases of unmodified alloy presented a coarse acicular or long axis morphology. The mean area and aspect ratio were 44 μm2 and 15.2 μm, respectively. In contrast, the microstructures of the alloy were significantly optimized after the addition of Y. As shown in Figure 4b, the eutectic Si particles exhibited a short rod structure when Y addition was 0.1 wt%. Correspondingly, the mean area and aspect ratio decreased to 11.9 μm2 and 3.8 μm, respectively. As seen in Figure 4c, the eutectic Si particles were clearly spheroidized with a small fibrous or granular morphology. The mean area and aspect ratio further declined to 3.2 μm2 and 2.2 μm, respectively, which was 92% and 75% lower than the matrix, respectively. However, as the Y addition amount increased to 0.3 wt%, the mean area and length–width ratio of the eutectic Si phase exhibited a slight increase.
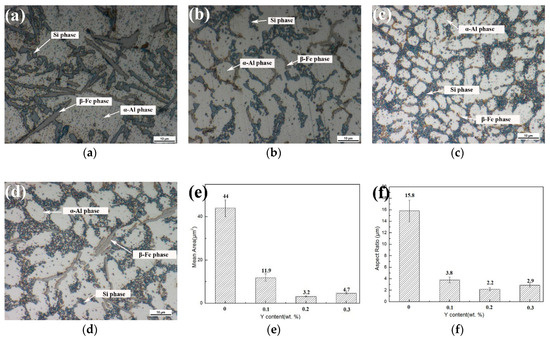
Figure 4.
High magnification morphology of primary Si crystals and Fe-rich phases in ADC12 alloy: (a) 0 wt%; (b) 0.1 wt%; (c) 0.2 wt%; (d) 0.3 wt%; and, (e, f) the mean area and aspect ratio of the eutectic Si phases.
According to the impurity-induced twinning mechanism (IIT) [13,14,15,16] and the restricted twin plane reentrant edge growth mechanism (TPRE) [17], the modified Y atoms easily concentrate near the Si solid–liquid interface or Si grooves. This phenomenon may change the growth mode and eventually lead to the isotropic growth of grain. Thereby, the Y atoms of the modification agents will refine the eutectic Si and change its morphology from the coarse acicular or long axis shape to a small fibrous or granular shape. Moreover, the previous works conducted by Kang et al [18] and Nogit et al. [19] revealed that the large degree of negative mixing between Y and Si led to a decrease in the eutectic temperature and an improvement of the microstructure.
Additionally, Figure 5 reveals typical SEM images of ADC12 alloys with different amounts of Y addition. The results indicate that the Y-rich phases mainly contain three elements (Al, Si and Y). This phase is Al2Si2Y, according to Wan et al. [7]. As can be seen from Figure 5a,b, the Al2Si2Y phase displayed a coarser microstructure when the rear earth Y addition reached 0.8 wt.%. This phenomenon indicates that an excessive amount of rare earth Y may cause the phase to grow sharply. When the amount of Y reached 0.8 wt%, a large amount of Y and Si atoms were consumed and coarse Y-rich phases were formed, as shown in Figure 5b. This greatly reduced the modification effect. Therefore, the metamorphic effect would get worse when too much rare earth Y was added to the alloy. Similar results after adding Zr to A356 casting alloy have been reported by Liu et al. [20].
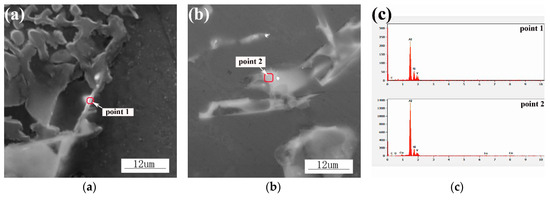
Figure 5.
SEM images of ADC12 alloys with different Y additions: (a) 0.2 wt%; (b) 0.8 wt%; and, (c) EDS results of point 1, 2.
Figure 6 represents the average length of the Fe-rich phases with different Y additions. The average length of the Fe-rich phases gradually decreased while the Y content increased from 0 to 0.2 wt%. The average length of the Fe-rich phases in the unmodified alloy was approximately 22.3 μm and the phases were characterized by a coarse needle-like morphology, as shown in Figure 4a. When the amount of Y was 0.1%, the average length decreased to 7.9 μm and the morphology of the Fe-rich phases changed from needle-like to small flake, as shown in Figure 4b. The microstructures were significantly modified when the amount of rare earth Y was 0.2 wt%. The Fe-rich phases displayed a finer structure with an average length of 2.8 μm. However, the Fe-rich phase structure became coarser and the length had also increased—rather than decreased—when the Y addition further increased to 0.3 wt%
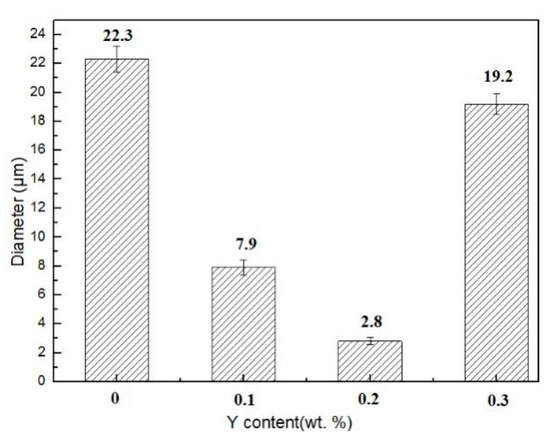
Figure 6.
The average length of the Fe-rich phases.
During solidification, the introduction of the Y element caused the formation of Al2Si2Y phases, which led to the increase of the heterogeneous nucleation sites for the Fe-rich phases [21] and the depletion of Si in the alloy. The increase of the nucleation sites promoted the formation of the phases, and the reduction of the Si phase near the solidifying front where those phases precipitate can hinder the growth [22]. Moreover, the Y element was easily absorbed onto the Fe-rich phases and had an inhibitory effect on the independent growth of the Fe-rich phases [7]. Thus, Fe-rich phases were effectively refined due to the addition of the Y element.
3.3. Effects of Solid Solution on Microstructures
Figure 7 represents optical microstructures of 0.2 wt% Y/ADC12 at different solid solution temperatures. As shown in Figure 7a, the Si phases were partially spheroidized and Fe-rich phases were present in the form of short rod-like structures when the solution treated condition was 500 °C. According to Figure 7b, when the solution temperature reaches 520 °C, the rod-like Fe-rich phases were refined to the smaller size. The Si phases also displayed the globular and rounded structure. Meanwhile, the degree of difference in particle size decreased. Nevertheless, the eutectic Si phase appeared to increase. However, it was worth noticing that the eutectic Si became coarser when the solution temperature reached 540 °C and even some cavities appeared, as shown in Figure 7c. These cavities were primarily caused by the melted Cu-rich compounds. Al-Cu nucleation and growth temperatures were below 510 °C [3]. When the temperature increased to 540 °C the Al-Cu eutectic phases melted directly, rather than forming a solid solution during the heat treatment. As a result, the cavities were created. Therefore, from the comparison of the results, the optimum solution temperature was 520 °C.

Figure 7.
Optical microstructures of 0.2 wt% Y/ADC12 alloy at different solid solution temperatures: (a) 500 °C; (b) 520 °C; and, (c) 540 °C.
Figure 8 exhibits SEM-EDS elemental maps of the distribution of Si and Cu elements after heat treatment. The Si and Fe-rich phases in 0.2 wt% Y/ADC12 alloy show a uniform distribution with a smaller size than that of the alloy without Y. This again confirms the validity of rare earth Y metamorphism. Moreover, according to Figure 8a, the scanning results display some agglomerated Cu atoms in alloy without Y addition which indicates that many undissolved copper-rich phases may still exist after solution treatment. In comparison, the Cu atoms in alloy with 0.2 wt% Y addition were more uniform, as shown in Figure 8b. This indicates that more copper-rich phases were dissolved in the matrix during the solid solution. This difference was caused by the different dissolution rates of the Al2Cu phases in the alloy. Cu atoms diffuse from the outer layer of the Al2Cu phases into the matrix [23]. The Al2Cu particles in 0.2 wt% Y/ADC12 alloy were smaller than those in the non-added alloy due to the metamorphism. This led to the Al2Cu phases in alloy having a larger total surface area. Therefore, the dissolution rate of these phases increased due to the addition of Y.


Figure 8.
The distribution of Si, Cu and Fe elements of alloys with Y addition on SEM-EDS elemental maps: (a) 0 wt%; and, (b) 0.2 wt%.
3.4. Mechanical Properties
Figure 9 represents mechanical properties of ADC12 alloys with different Y contents. It can be observed from the figure that the UTS of the unmodified alloy was 172.4 MPa, the elongation was 1.9%, and the hardness was 75.9 HV. When the amount of Y addition was <0.2 wt%, the UTS, elongation, and hardness of the alloys were significantly improved with the increase of Y addition. The 0.2 wt% Y/ADC12 alloy showed the best UTS (255.6 MPa), elongation (3.3%), and hardness (94.6 HV), which were 48.3%, 72.9%, and 24.6% higher than those of the matrix, respectively. An appropriate increase in the hardness of the alloy is beneficial to the subsequent secondary processing due to the softness of the aluminum alloy [24,25]. However, further increasing the Y content caused a decline in the UTS, elongation, and hardness. Moreover, the UTS and hardness of the alloys with different Y contents were all significantly improved after heat treatment. The UTS and microhardness of the alloy with 0.2 wt% Y were enhanced by 57.9 MPa and 38.1 HV, respectively. A further increase in temperature of the solid solution to 540 °C resulted in a decrease in both UTS and elongation. After the rare earth modification and solid solution process, the 0.2 wt% Y/ADC12 alloy revealed the best UTS (313.5 MPa), elongation (3.2%), and hardness (132.7 HV), which were 81.9%, 69.7%, and 74.8% higher than those of the as-cast ADC12 alloys without any treatment, respectively.

Figure 9.
Mechanical properties of alloys with different concentrations of Y.
The mechanical behavior of the alloy primarily depends on a sound microstructure. The refinement of the β-phases reduces the probability of these particles tearing the matrix under applied stress. On the other hand, the internal defects of the fine-grained eutectic Si phases were less than the coarse-grained Si phases, which leads to the maintenance of intrinsic fracture stress. As mentioned before, the Si, Fe, and α-Al phases were refined due to the addition of Y. When the amount of added Y was 0.2 wt%, the eutectic Si phases completely transformed into fibrous or granular structures. The flaky Fe-rich phases exhibited the smallest size compared to the others. Thus, the mechanical properties were greatly improved. Meanwhile, the mechanical properties of the alloy also been improved due to the refinement of α-Al phases. According to the Hall–Petch equation, grain boundaries are obstacles to dislocation movement. Therefore, the finer the grain, the higher the mechanical properties of the alloy. Thus, the mechanical properties of the alloy after heat treatment were further improved. However, the excessively high temperature led to a decrease in mechanical properties due to the rapid growth of Si phases, grains, and even the appearance of cavities. This phenomenon weakens the effect of the particle’s morphology and the distribution of the mechanical properties.
3.5. Fracture Characteristics
Figure 10 illustrates the fractographs of the ADC12 alloys with various Y contents. The phases marked Point 1 are the coarse primary Si phases, according to Li et al. [26]. In Figure 10a, aside from a few stretching holes, the fracture surfaces of the ADC12 alloys without Y addition are mainly covered by cleavage plane. Furthermore, a clear crack in the coarse primary Si phases, as shown in Figure 10a, was observed. These phenomena indicated a typical characteristic of brittle fracture. It was generally accepted that this was due to the rupture of primary Si cracks that originated in the rupture and propagated along the primary Si/matrix interfaces immediately. Subsequently, the neighboring cracks linked and ultimately caused the fracture of the material [26,27,28].
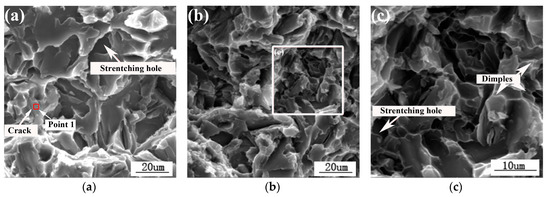
Figure 10.
Fractographs of the tensile samples of ADC12 alloys with different Y contents: (a) 0 wt%; (b) 0.2 wt%; and, (c) magnified image of the local area in (b).
Figure 10c reveals that the fracture surface of ADC12 alloys with 0.2 wt% Y addition also has some cleavage planes and stretching holes. Meanwhile, aggregated dimples appeared on the fracture face and the proportion of the cleavage plane decreased. Hence, the type of this fracture was a ductile failure. Therefore, an appropriate amount of Y addition has an active effect on the fracture properties of the alloy.
4. Conclusions
(1) The addition of the rare earth Y causes significant refinement of the microstructure, not only reducing the average size of the α-Al phase and SDAS, but also refining the coarse Si and Fe-rich phases.
(2) The suitable solution temperature for the alloy with 0.2 wt% Y was approximately 520 °C. During the solid solution, the eutectic silicon particles were spheroidized and the copper-rich phases were dissolved in the matrix.
(3) The addition of Y and heat treatment significantly improved the mechanical properties of the alloy. Compared with the matrix without any treatment, the UTS, elongation ratio, and hardness of ADC12 with 0.2 wt% Y addition were increased by 81.9%, 69.7%, and 74.8%, respectively.
Author Contributions
J.L., Q.W. and H.Y. conceived and designed the experiments; S.Z. and Z.H. performed the experiments; Q.W. and H.Y. analyzed the data; J.L., Q.W., H.Y. and S.Z. contributed reagents/materials/analysis tools; Q.W., S.Z. and Z.H. wrote the paper.
Funding
Projects (20181BAB206026 and 20171BAB206034) supported by the Natural Science Foundation of Jiangxi Province.
Conflicts of Interest
The authors declare no conflict of interest.
References
- Okayasu, M.; Ota, K.; Takeuchi, S.; Ohfuji, H.; Shiraishi, T. Influence of microstructural characteristics on mechanical properties of ADC12 aluminum alloy. Mater. Sci. Eng. A 2014, 592, 189–200. [Google Scholar] [CrossRef]
- Tang, P.; Li, W.; Wang, K.; Du, J.; Chen, X.; Zhao, Y.; Li, W. Effect of Al-Ti-C master alloy addition on microstructures and mechanical properties of cast eutectic Al-Si-Fe-Cu alloy. Mater. Des. 2014, 115, 147–157. [Google Scholar] [CrossRef]
- Farahany, S.; Ourdjini, A.; Idrsi, M.H.; Shabestari, S.G. Evaluation of the effect of Bi, Sb, Sr and cooling condition on eutectic phases in an Al-Si-Cu alloy (ADC12) by in situ thermal analysis. Thermochim. Acta 2013, 559, 59–68. [Google Scholar] [CrossRef]
- Rao, Y.S.; Yan, H.; Hu, Z. Modification of eutectic silicon and β-Al5FeSi phases in as-cast ADC12 alloys by using samarium addition. J. Rare Earths 2013, 31, 916–922. [Google Scholar] [CrossRef]
- Li, M.; Wang, H.W.; Wei, Z.J.; Zhu, Z.J. The effect of Y on the hot-tearing resistance of Al-5 wt% Cu based alloy. Mater. Des. 2010, 31, 2483–2487. [Google Scholar] [CrossRef]
- Zhang, X.G.; Mei, F.Q.; Zhang, H.Y.; Wang, S.H.; Fang, C.F. Effects of Gd and Y additions on microstructure and properties of Al-Zn-Mg-Cu-Zr alloys. Mater. Sci. Eng. A 2012, 552, 230–235. [Google Scholar] [CrossRef]
- Wan, B.B.; Chen, W.P.; Liu, L.S.; Cao, X.Y.; Zhou, L. Effect of trace yttrium addition on the microstructure and tensile properties of recycled Al-7Si-0.3Mg-1.0Fe casting alloys. Mater. Sci. Eng. A 2016, 666, 165–175. [Google Scholar] [CrossRef]
- Yu, S.R.; Jin, Y.Z.; Xiong, W.; Liu, Y. Study on microstructure and mechanical properties of ZL107 alloy added with yttrium. J. Rare Earths 2013, 31, 198–203. [Google Scholar] [CrossRef]
- Yan, H.; Chen, F.H.; Li, Z.H. Microstructure and mechanical properties of AlSi10Cu3 alloy with (La+Yb) addition processed by heat treatment. J. Rare Earths 2016, 34, 938–944. [Google Scholar] [CrossRef]
- Qiu, H.X.; Yan, H.; Hu, Z. Effect of samarium (Sm) addition on the microstructures and mechanical properties of Al-7Si-0.7Mg alloys. J. Alloys Compd. 2013, 567, 77–81. [Google Scholar] [CrossRef]
- Chen, Y.; Pan, Y.; Lu, T.; Tao, S.W.; Wu, J.L. Effects of combinative addition of lanthanum and boron on grain refinement of Al-Si casting alloys. Mater. Des. 2014, 64, 423–426. [Google Scholar] [CrossRef]
- Song, X.C.; Yan, H.; Zhang, X.J. Microstructure and mechanical properties of Al-7Si-0.7Mg alloy formed with an addition of (Pr+Ce). J. Rare Earths 2017, 35, 412–418. [Google Scholar] [CrossRef]
- Lu, S.Z.; Hellawell, A. The mechanism of silicon modification in aluminu-silicon alloys: Impurity induced twinning. Metall. Trans. A 1987, 18, 1721–1733. [Google Scholar] [CrossRef]
- Liu, X.R.; Zhang, Y.D.; Beausir, B.; Liu, F.; Esling, C. Twin-controlled growth of eutectic Si in unmodified and Sr-modified Al-12.7% Si alloys investigated by SEM/EBSD. Acta Mater. 2015, 97, 338–344. [Google Scholar] [CrossRef]
- Patakham, U.; Kajornchaiyakul, J.; Limmaneevichitr, C. Modification mechanism of eutectic silicon in Al–6Si-0.3Mg alloy with Scandium. J. Alloys Compd. 2013, 575, 273–284. [Google Scholar] [CrossRef]
- Lu, S.Z.; Hellawell, A. Growth mechanisms of silicon in Al-Si alloys. J. Cryst. Growth 1985, 73, 316–328. [Google Scholar] [CrossRef]
- Shamsuzzoha, M.; Hogan, L.M. Crystal morphology of unmodified aluminu-silicon eutectic microstructures. J. Cryst. Growth 1986, 76, 429–439. [Google Scholar] [CrossRef]
- Kang, H.S.; Yoon, W.Y.; Kim, K.H.; Cho, I.S. Effective parameter for the selection of modifying agent for Al-Si alloy. Mat. Sci. Eng. A 2007, 449, 334–337. [Google Scholar] [CrossRef]
- Nogita, K.; Mcdonald, S.D.; Dahle, A.K. Eutectic Modification of Al-Si Alloys with Rare Earth Metals. Mater. Trans. 2004, 45, 323. [Google Scholar] [CrossRef]
- Liu, W.Y.; Xiao, W.L.; Xu, C.; Liu, M.W.; Ma, C.L. Synergistic effects of Gd and Zr on grain refinement and eutectic Si modification of Al-Si cast alloy. Mater. Sci. Eng. A 2017, 693, 93–100. [Google Scholar] [CrossRef]
- Ashtari, P.; Tezuka, H.; Sato, T. Modification of Fe-containing intermetallic compounds by K addition to Fe-rich AA319 aluminum alloys. Scripta Mater. 2005, 53, 937–942. [Google Scholar] [CrossRef]
- Mao, F.; Yan, G.Y.; Xuan, Z.J.; Cao, Z.Q.; Wang, T.G. Effect of Eu addition on the microstructures and mechanical properties of A356 aluminum alloys. J. Alloys Compd. 2015, 650, 896–906. [Google Scholar] [CrossRef]
- Sjolander, E.; Seifeddine, S. The heat treatment of Al-Si-Cu-Mg casting alloys. J. Mater. Process. Technol. 2010, 210, 1249–1259. [Google Scholar] [CrossRef]
- Beranoagirre, A.; Olvera, D.; López de Lacalle, L.N. Milling of gamma titanium–aluminum alloys. Int. J. Adv. Manuf. Technol. 2012, 62, 83–88. [Google Scholar] [CrossRef]
- Alberdi, A.; Rivero, A.; López de Lacalle, L.N. Effect of process parameter on the kerf geometry in abrasive water jet milling. Int. J. Adv. Manuf. Technol. 2010, 51, 467–480. [Google Scholar] [CrossRef]
- Li, Q.L.; Xia, T.D.; Lan, Y.F.; Li, P.F.; Fan, L. Effects of rare earth Er addition on microstructure and mechanical properties of hypereutectic Al-20% Si alloy. Mater. Sci. Eng. A 2013, 588, 97–102. [Google Scholar] [CrossRef]
- Xu, C.L.; Wang, H.Y.; Yang, Y.F.; Jiang, Q.C. Effect of Al–P–Ti–TiC–Nd2O3 modifier on the microstructure and mechanical properties of hypereutectic Al–20wt.%Si alloy. Mater. Sci. Eng. A 2007, 452, 341–346. [Google Scholar] [CrossRef]
- Tong, X.C.; Ghosh, A.K. Fabrication of in situ TiC reinforced aluminum matrix composites. J. Mater. Sci. 2001, 36, 4059–4069. [Google Scholar] [CrossRef]
© 2018 by the authors. Licensee MDPI, Basel, Switzerland. This article is an open access article distributed under the terms and conditions of the Creative Commons Attribution (CC BY) license (http://creativecommons.org/licenses/by/4.0/).