Computer-Aided Design and Manufacturing Technology for Identification of Optimal Nuss Procedure and Fabrication of Patient-Specific Nuss Bar for Minimally Invasive Surgery of Pectus Excavatum


Abstract
1. Introduction
2. Materials and Methods
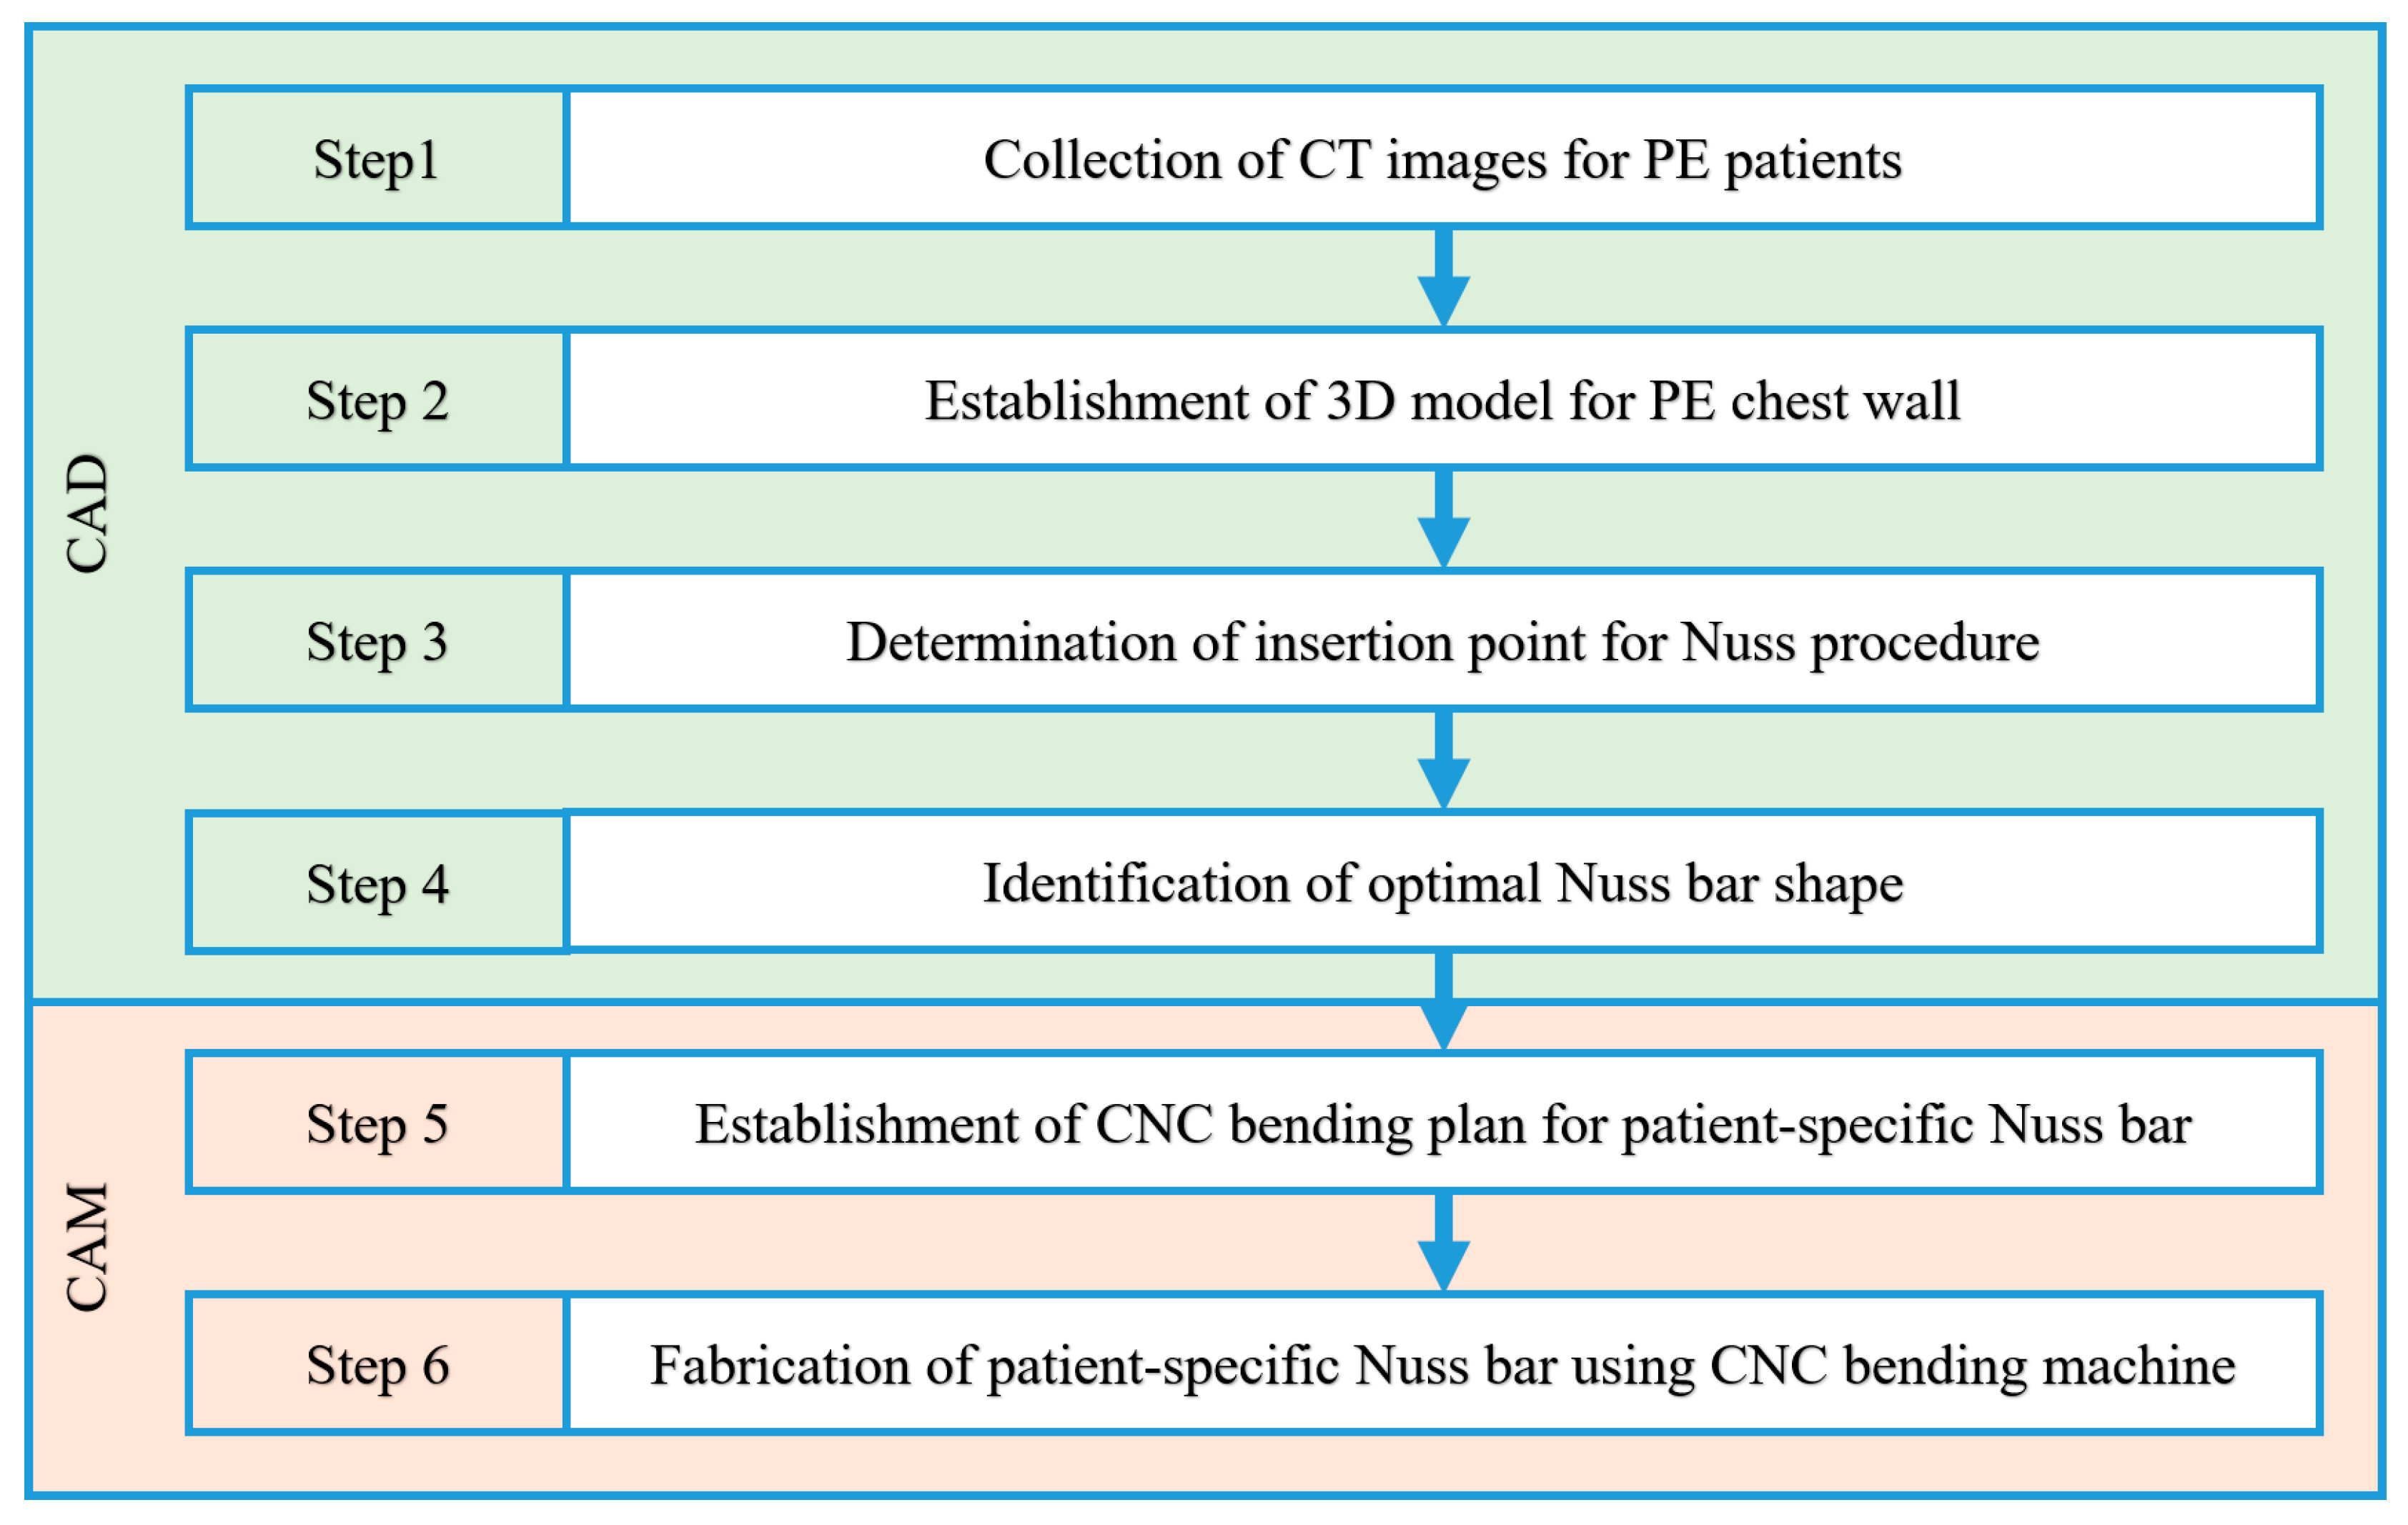
2.1. Fabrication Procedure for the Patient-Specific Nuss Bar via CAD and CAM
2.2. Modeling of the Three-Dimensional (3D) Chest Wall for a Pectus Excavatum Patient
2.2.1. Collection of CT Images for PE Patients
2.2.2. Establishment of 3D Model for PE Chest Wall
- Step 1: The CT file of a patient is loaded into the program (MIMICS). The loaded CT image is displayed in black and white depending on the density of each tissue. Thus, the density differences between tissues are used to select the desired body organ on the screen. The density range is specified using the “Thresholding” feature. The 3D surface can be obtained by selecting the rib and sternum tissues easily using the default value (bone region) of each tissue provided by the “Region growing” function of the program.
- Step 2: A 3D model is created from the obtained 3D surface using the “3D calculation” feature. The spine or any other unnecessary tissues are removed using “Edit mask” or similar features because the Nuss bar is not applied to them.
- Step 3: A separate selection task must be performed to obtain the 3D surface of costal cartilage because the costal cartilage region cannot be taken with the Bone default value due to its low density compared to the rib and sternum. A 3D model is created from the 3D surface of the costal cartilage obtained through this separate process.
- Step 4: A smooth-shaped chest wall model is produced finally by modifying the 3D chest wall models of the rib, sternum, and costal cartilage using the “Wrap” and “Smoothing” features.
2.3. Virtual Surgery Scenario for Nuss Procedure
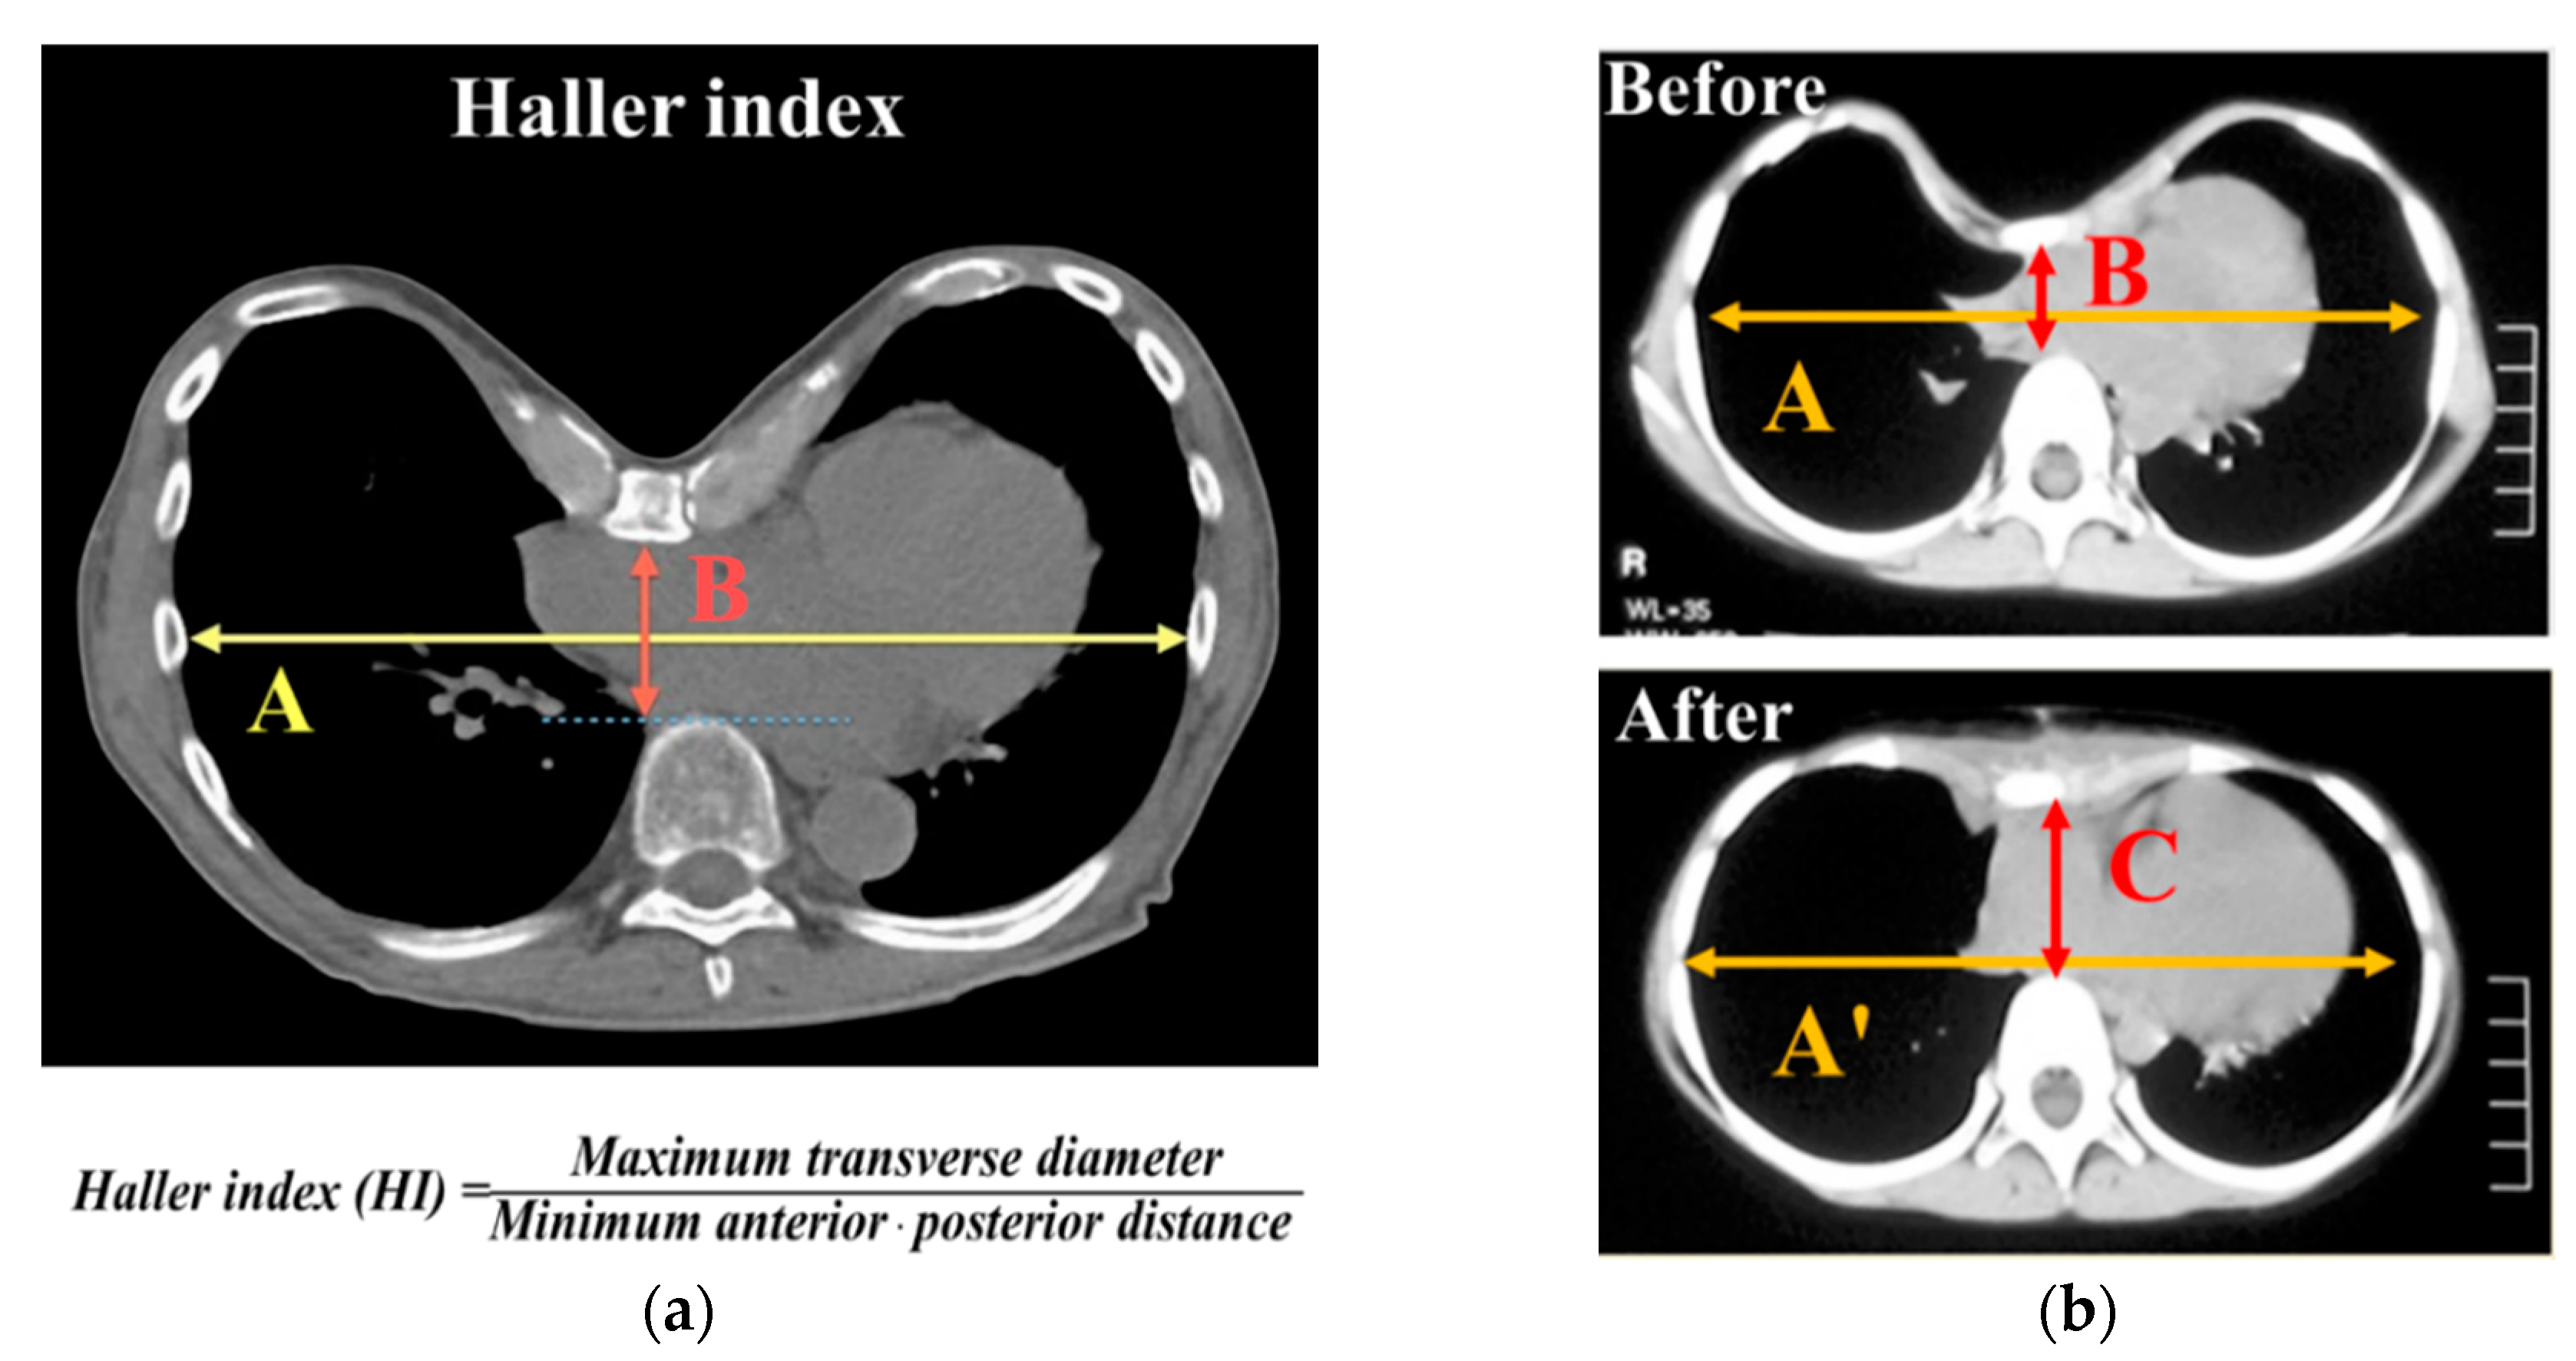
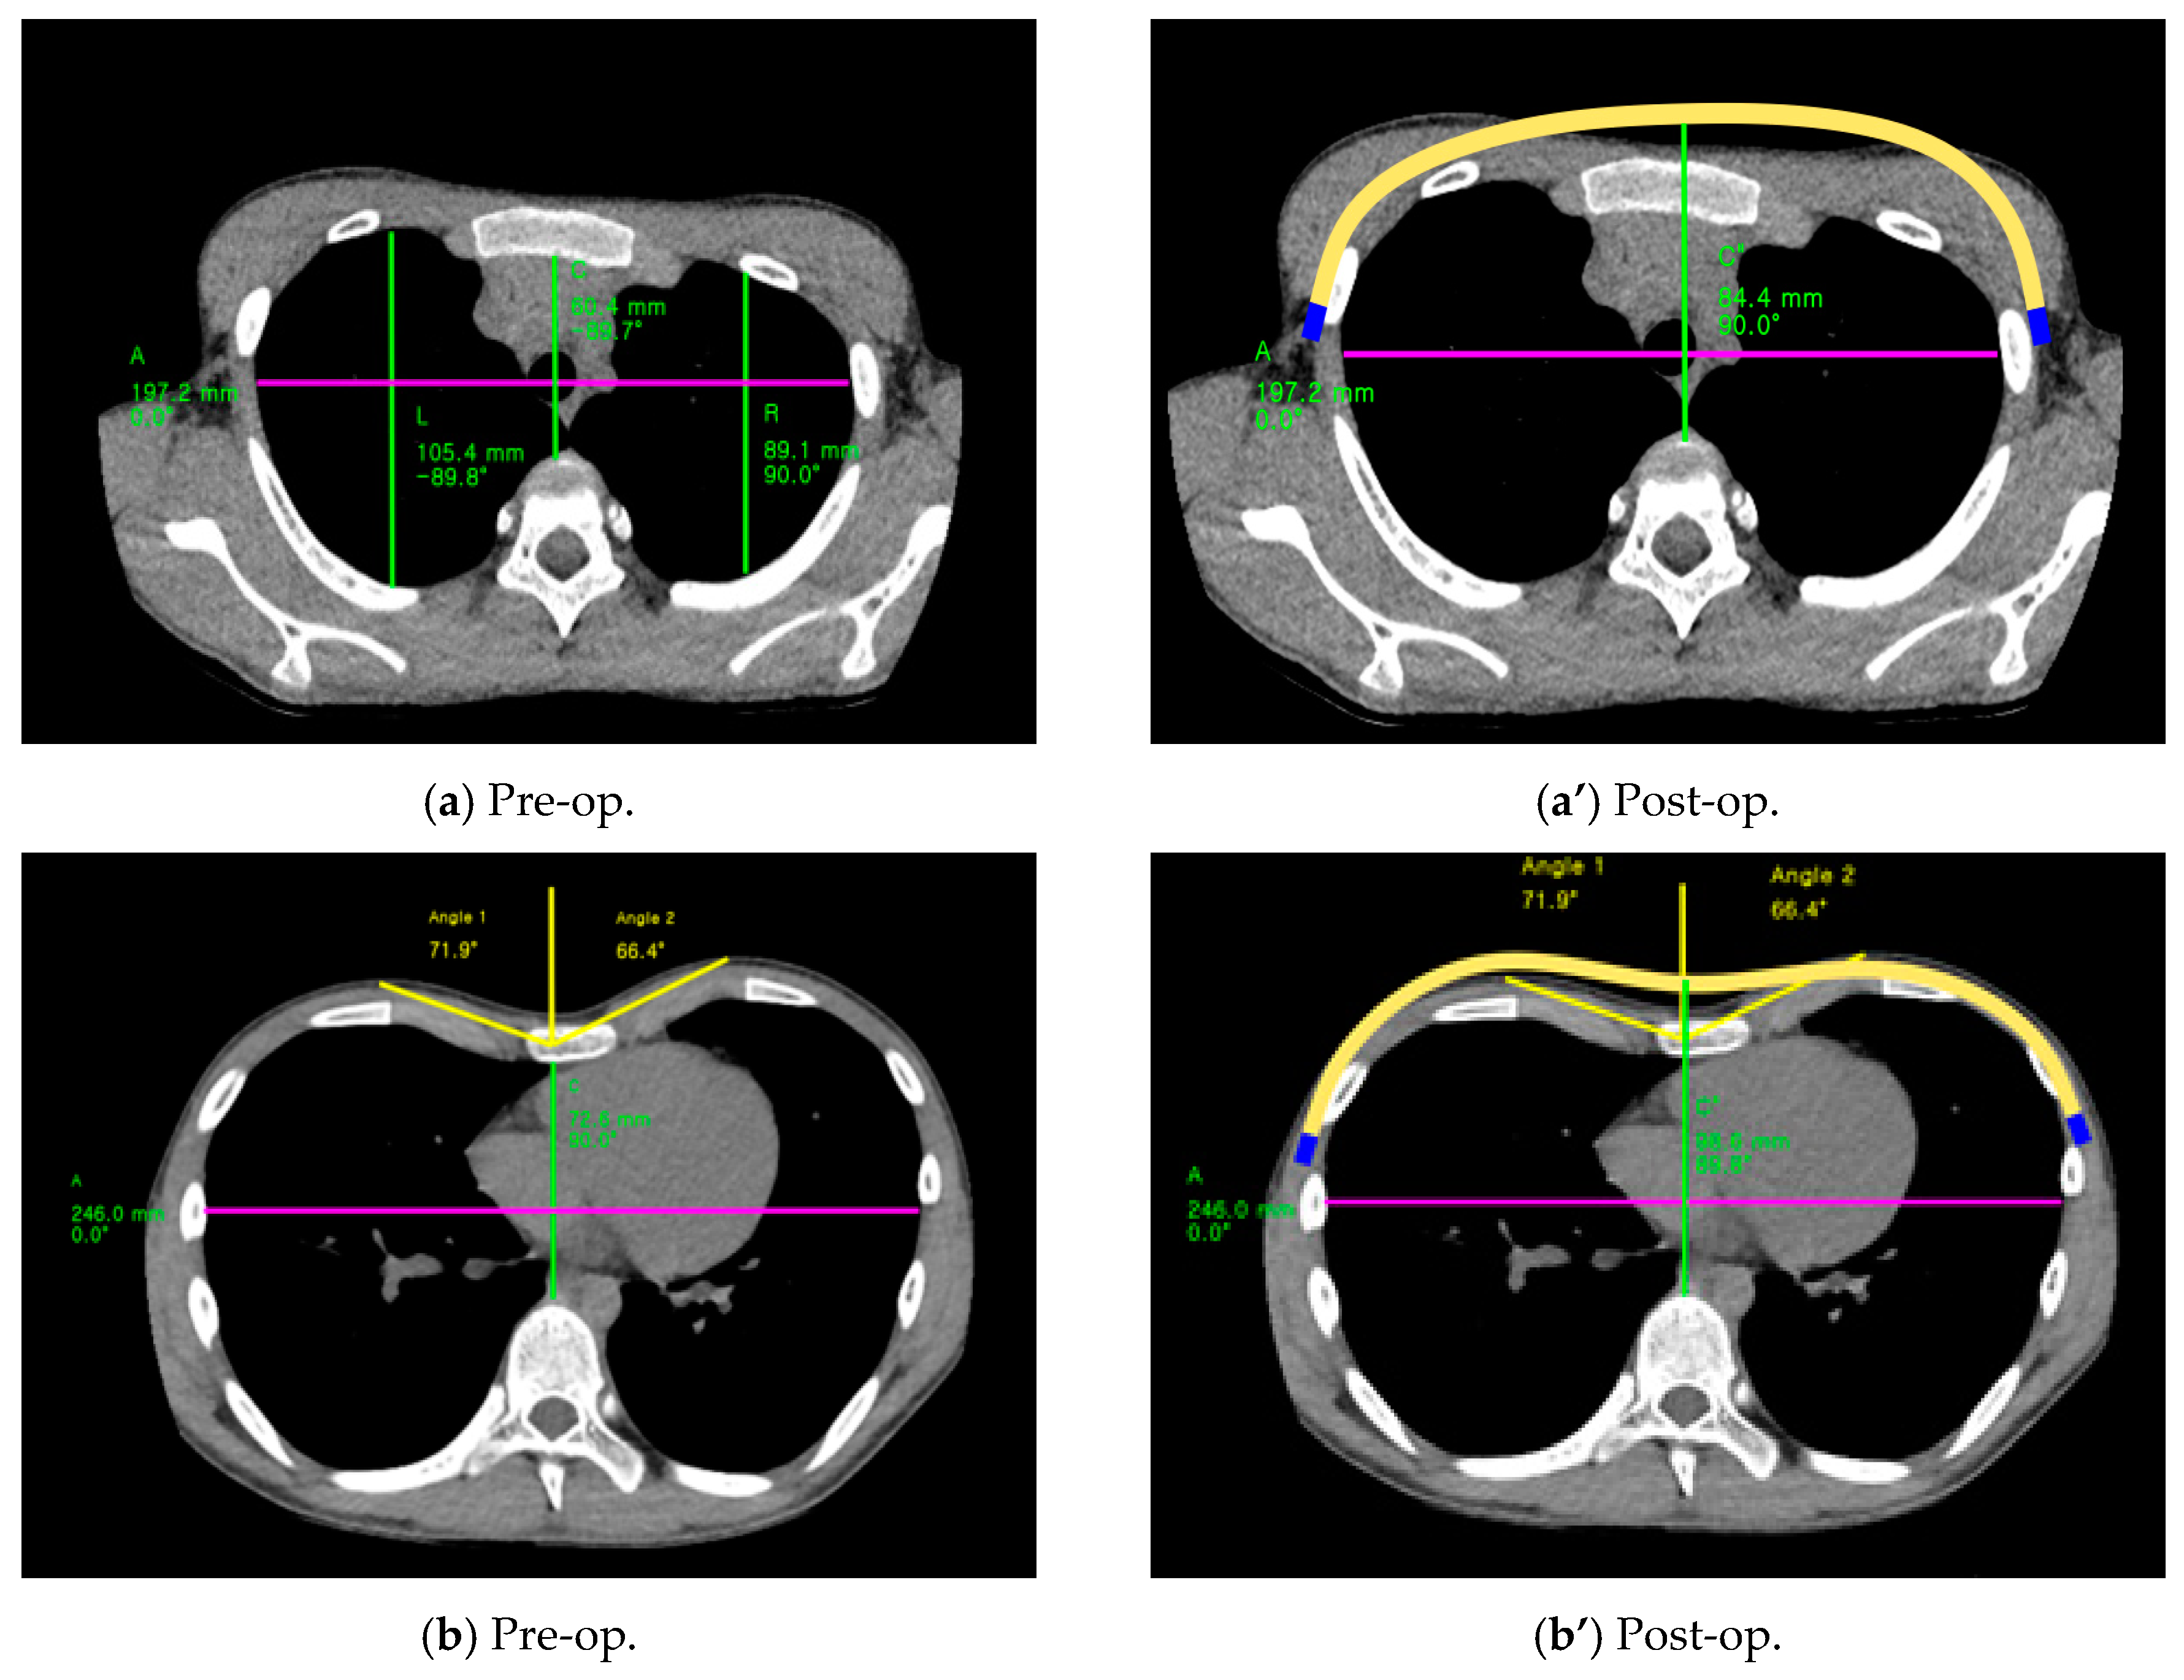
2.3.1. Definition of Haller Index
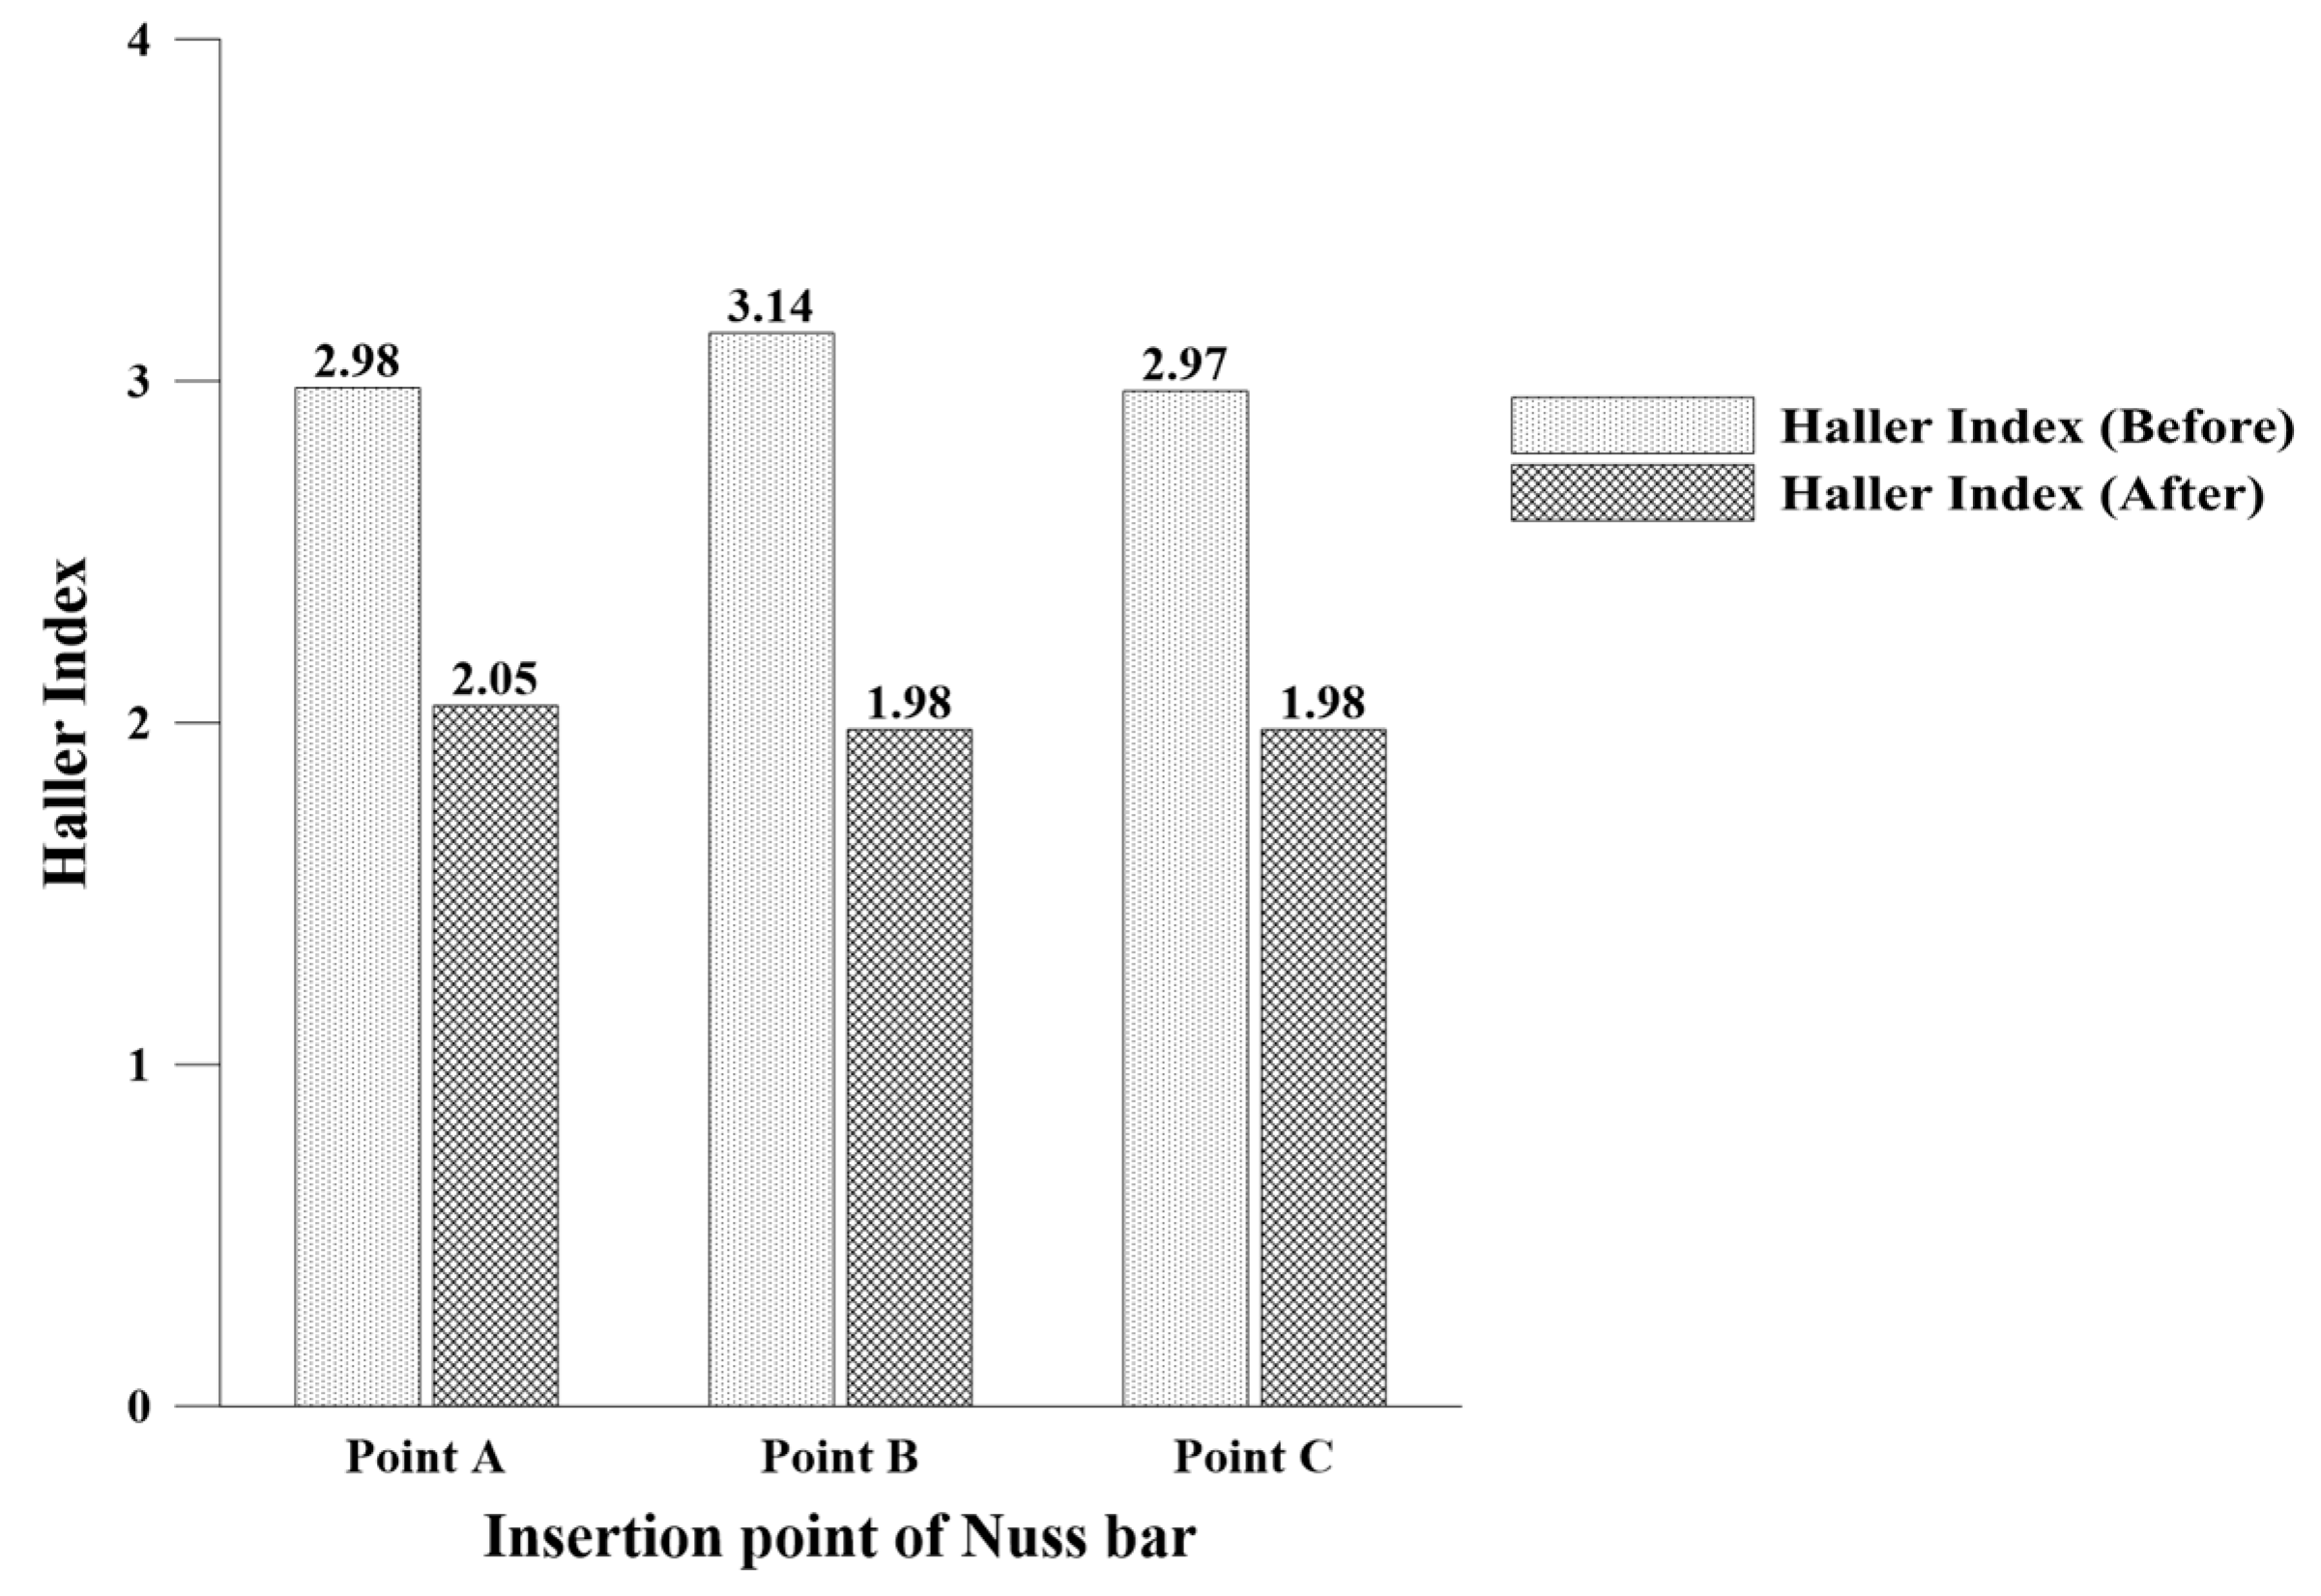
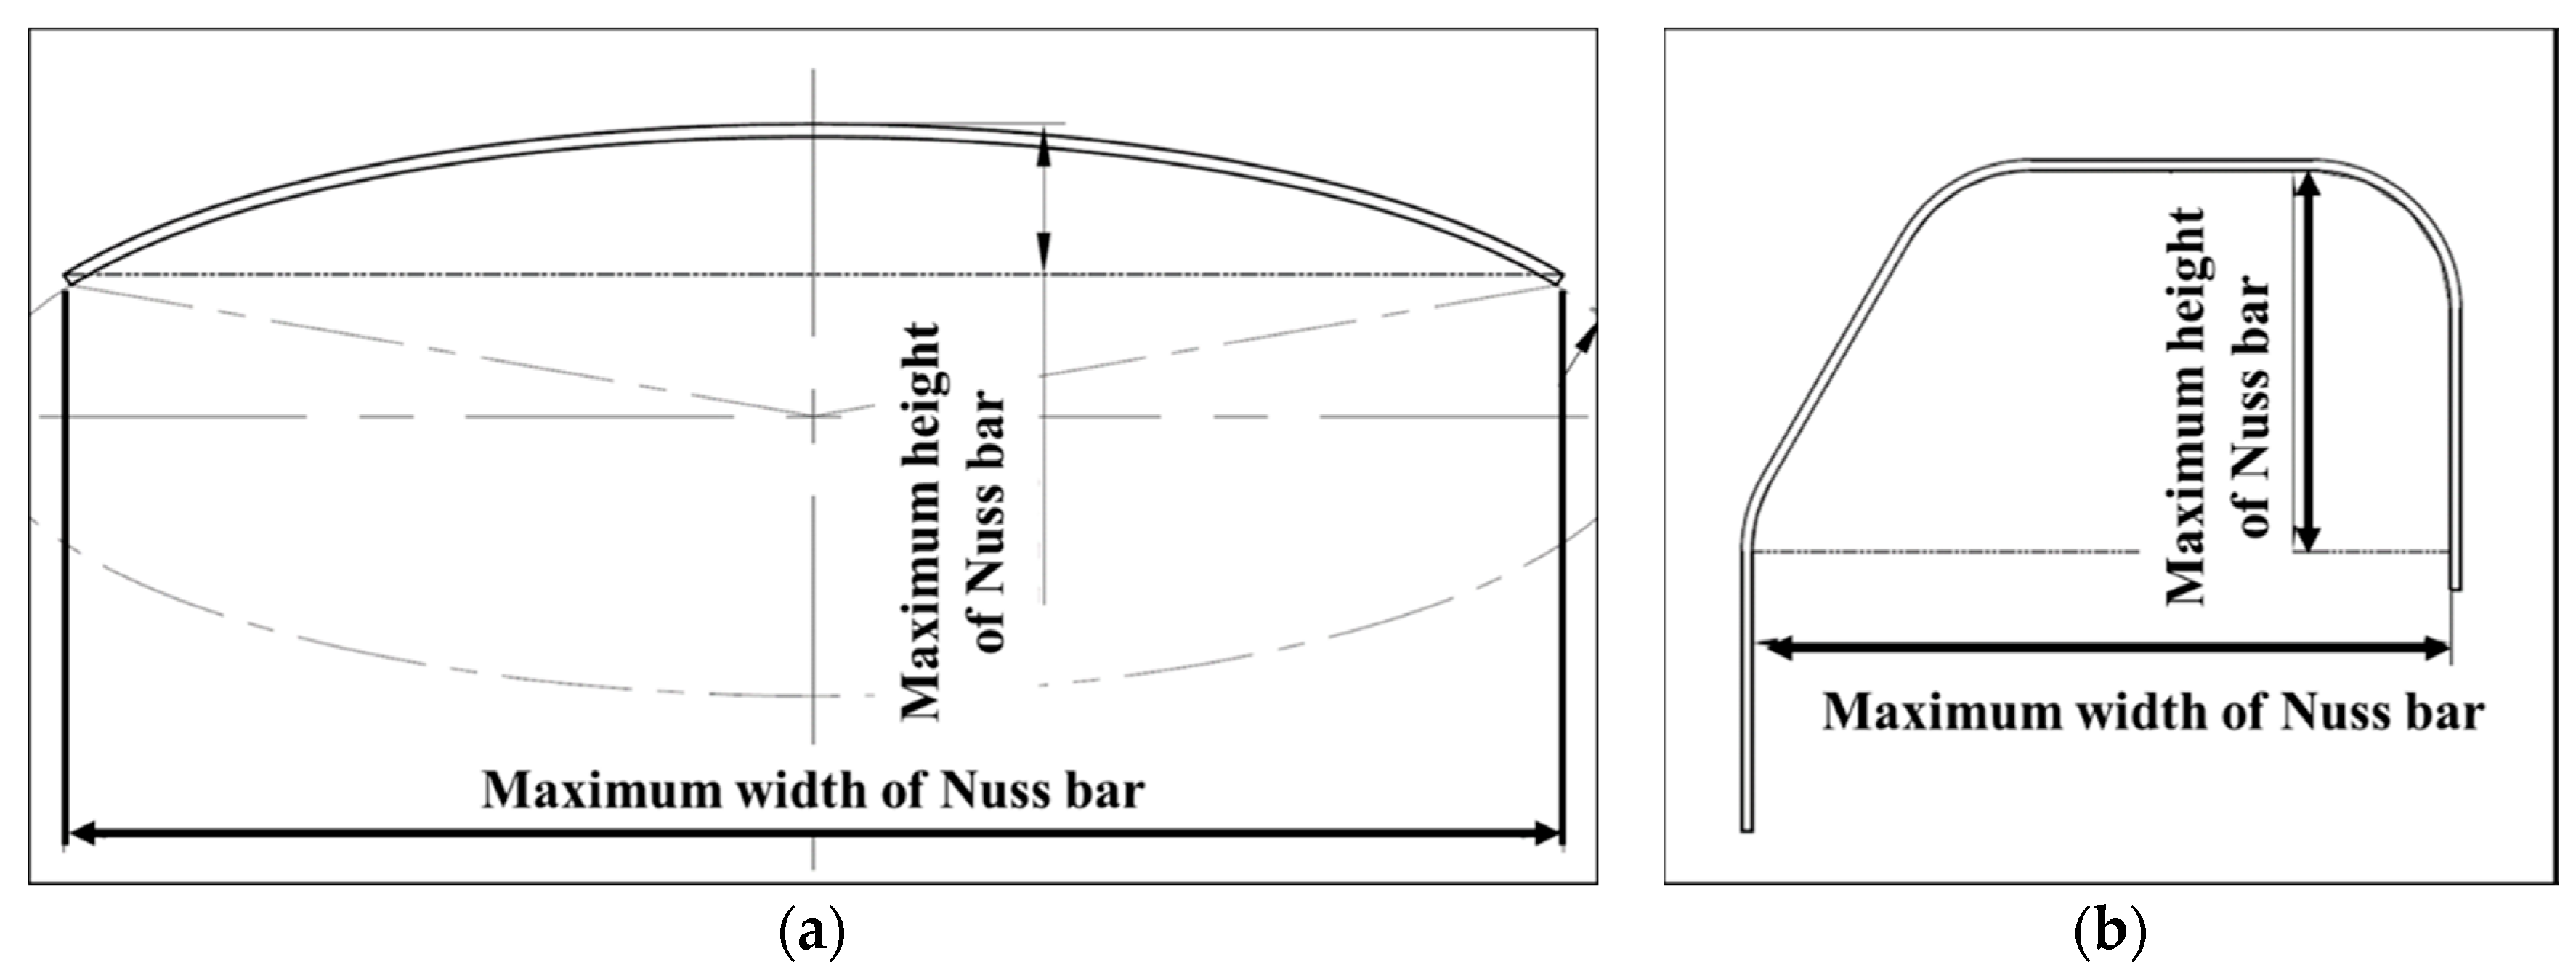
2.3.2. Virtual Surgery Scenario for Insertion Point and Shape Design of Nuss Bar
2.4. Establishment of Computerized Numerical Control (CNC) Bending Machine for Patient-Specific Nuss Bar
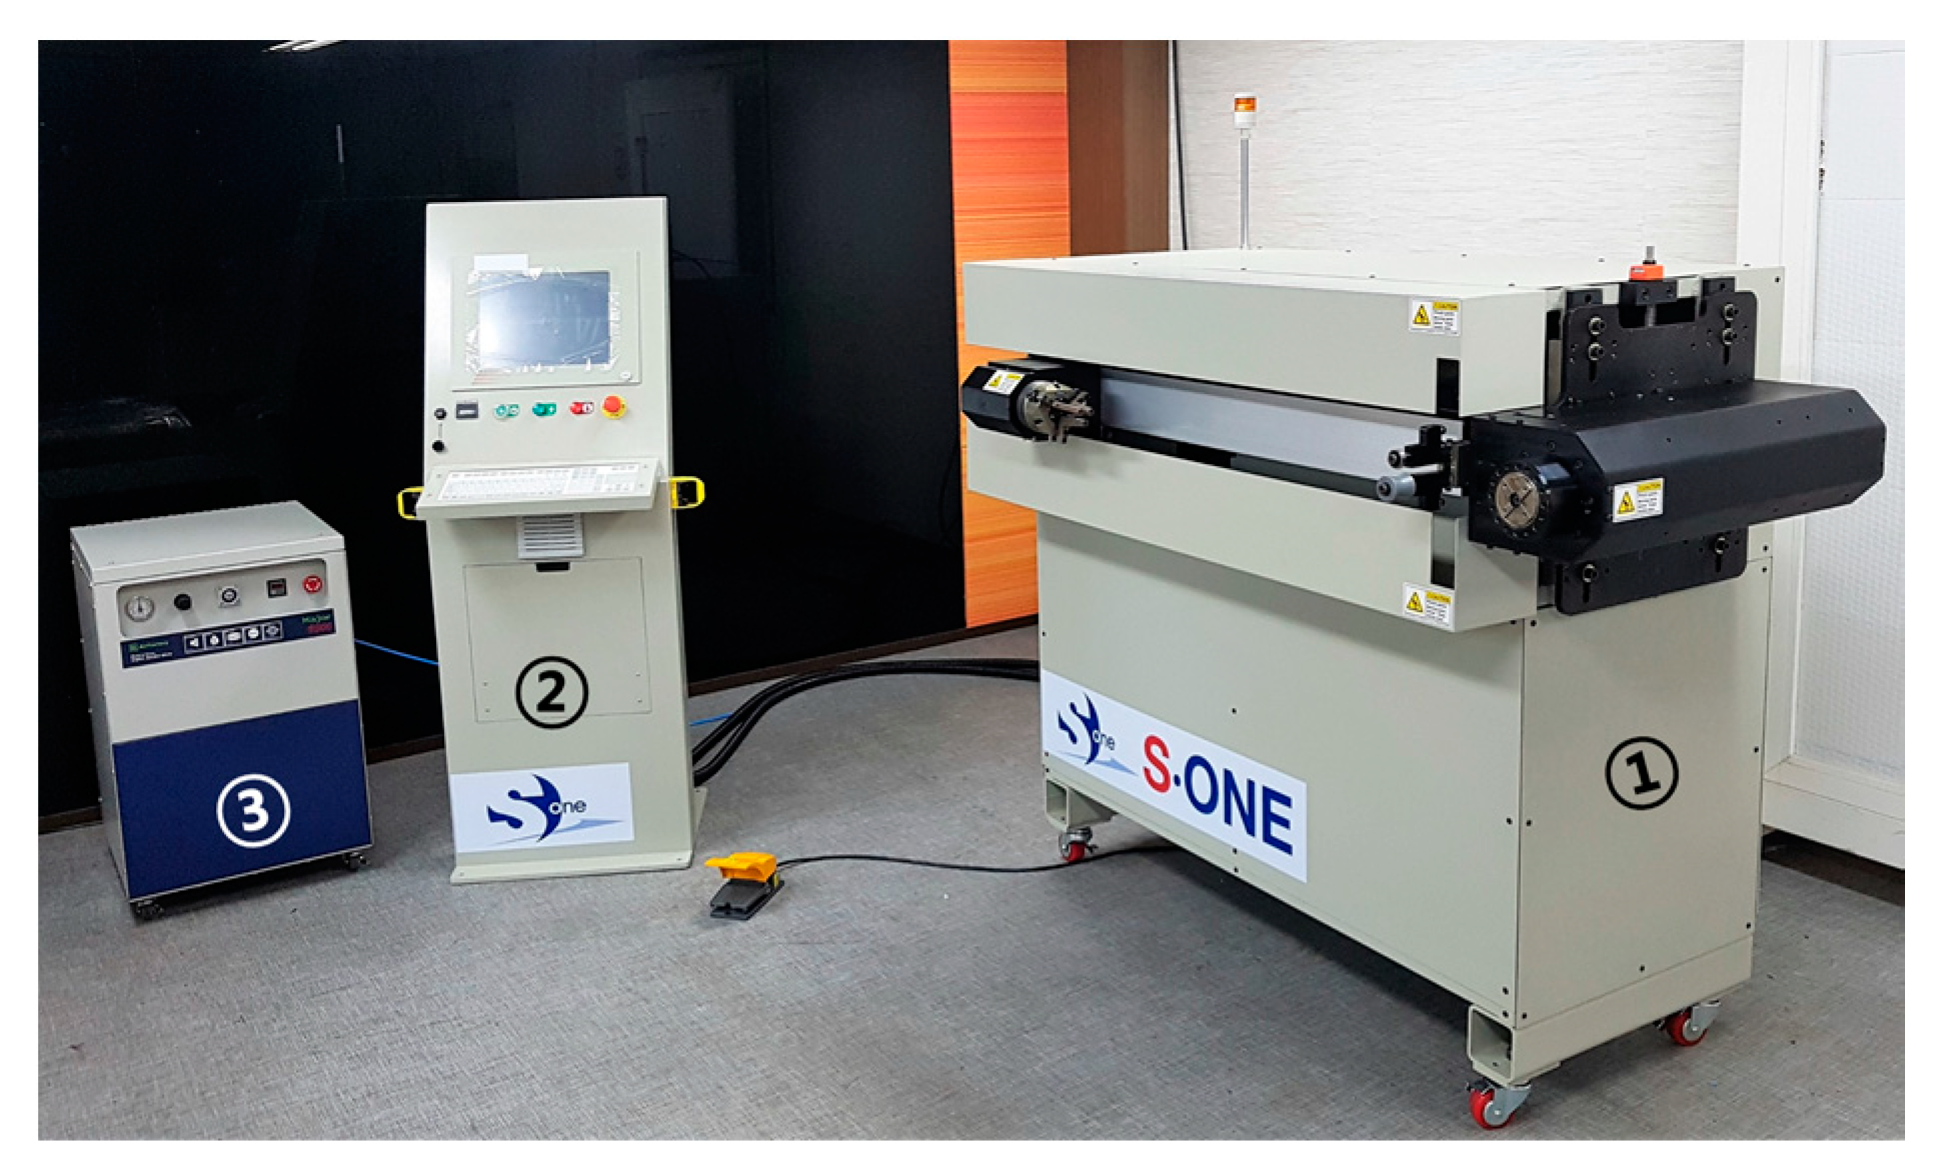
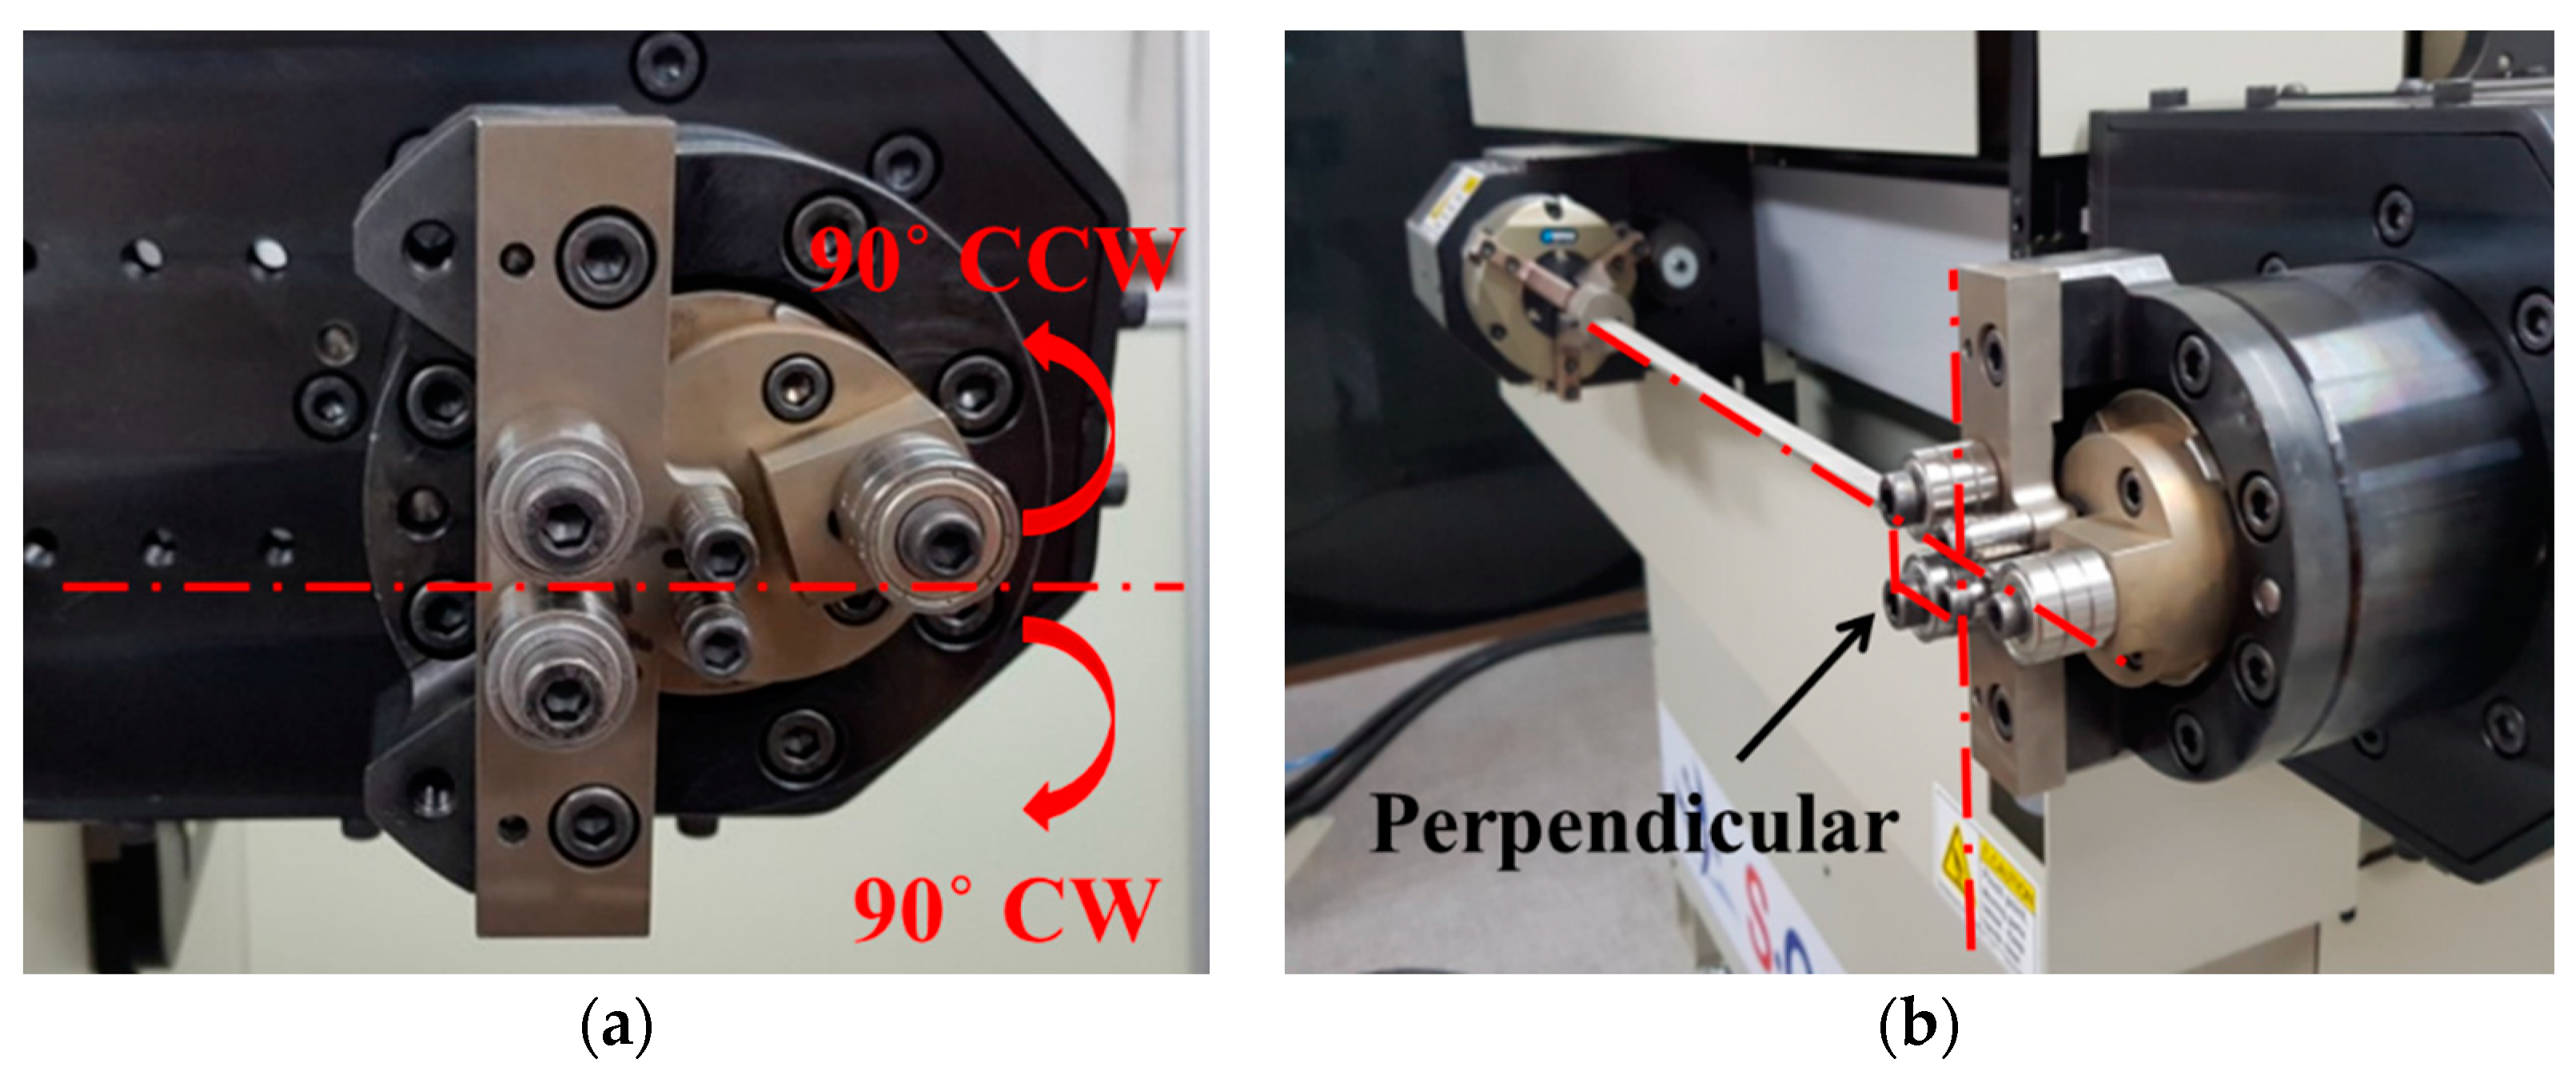
2.4.1. Components and Modification of CNC Bending Machine
2.4.2. Installation and Specification of CNC Bending Machine
2.4.3. Operation Parameters of CNC Bending Machine
3. Results
3.1. Validation of CAD-Based Patient-Specific Nuss Bar Design Technology
3.2. Validation of CAM-Based Patient-Specific Nuss Bar Fabrication Technology
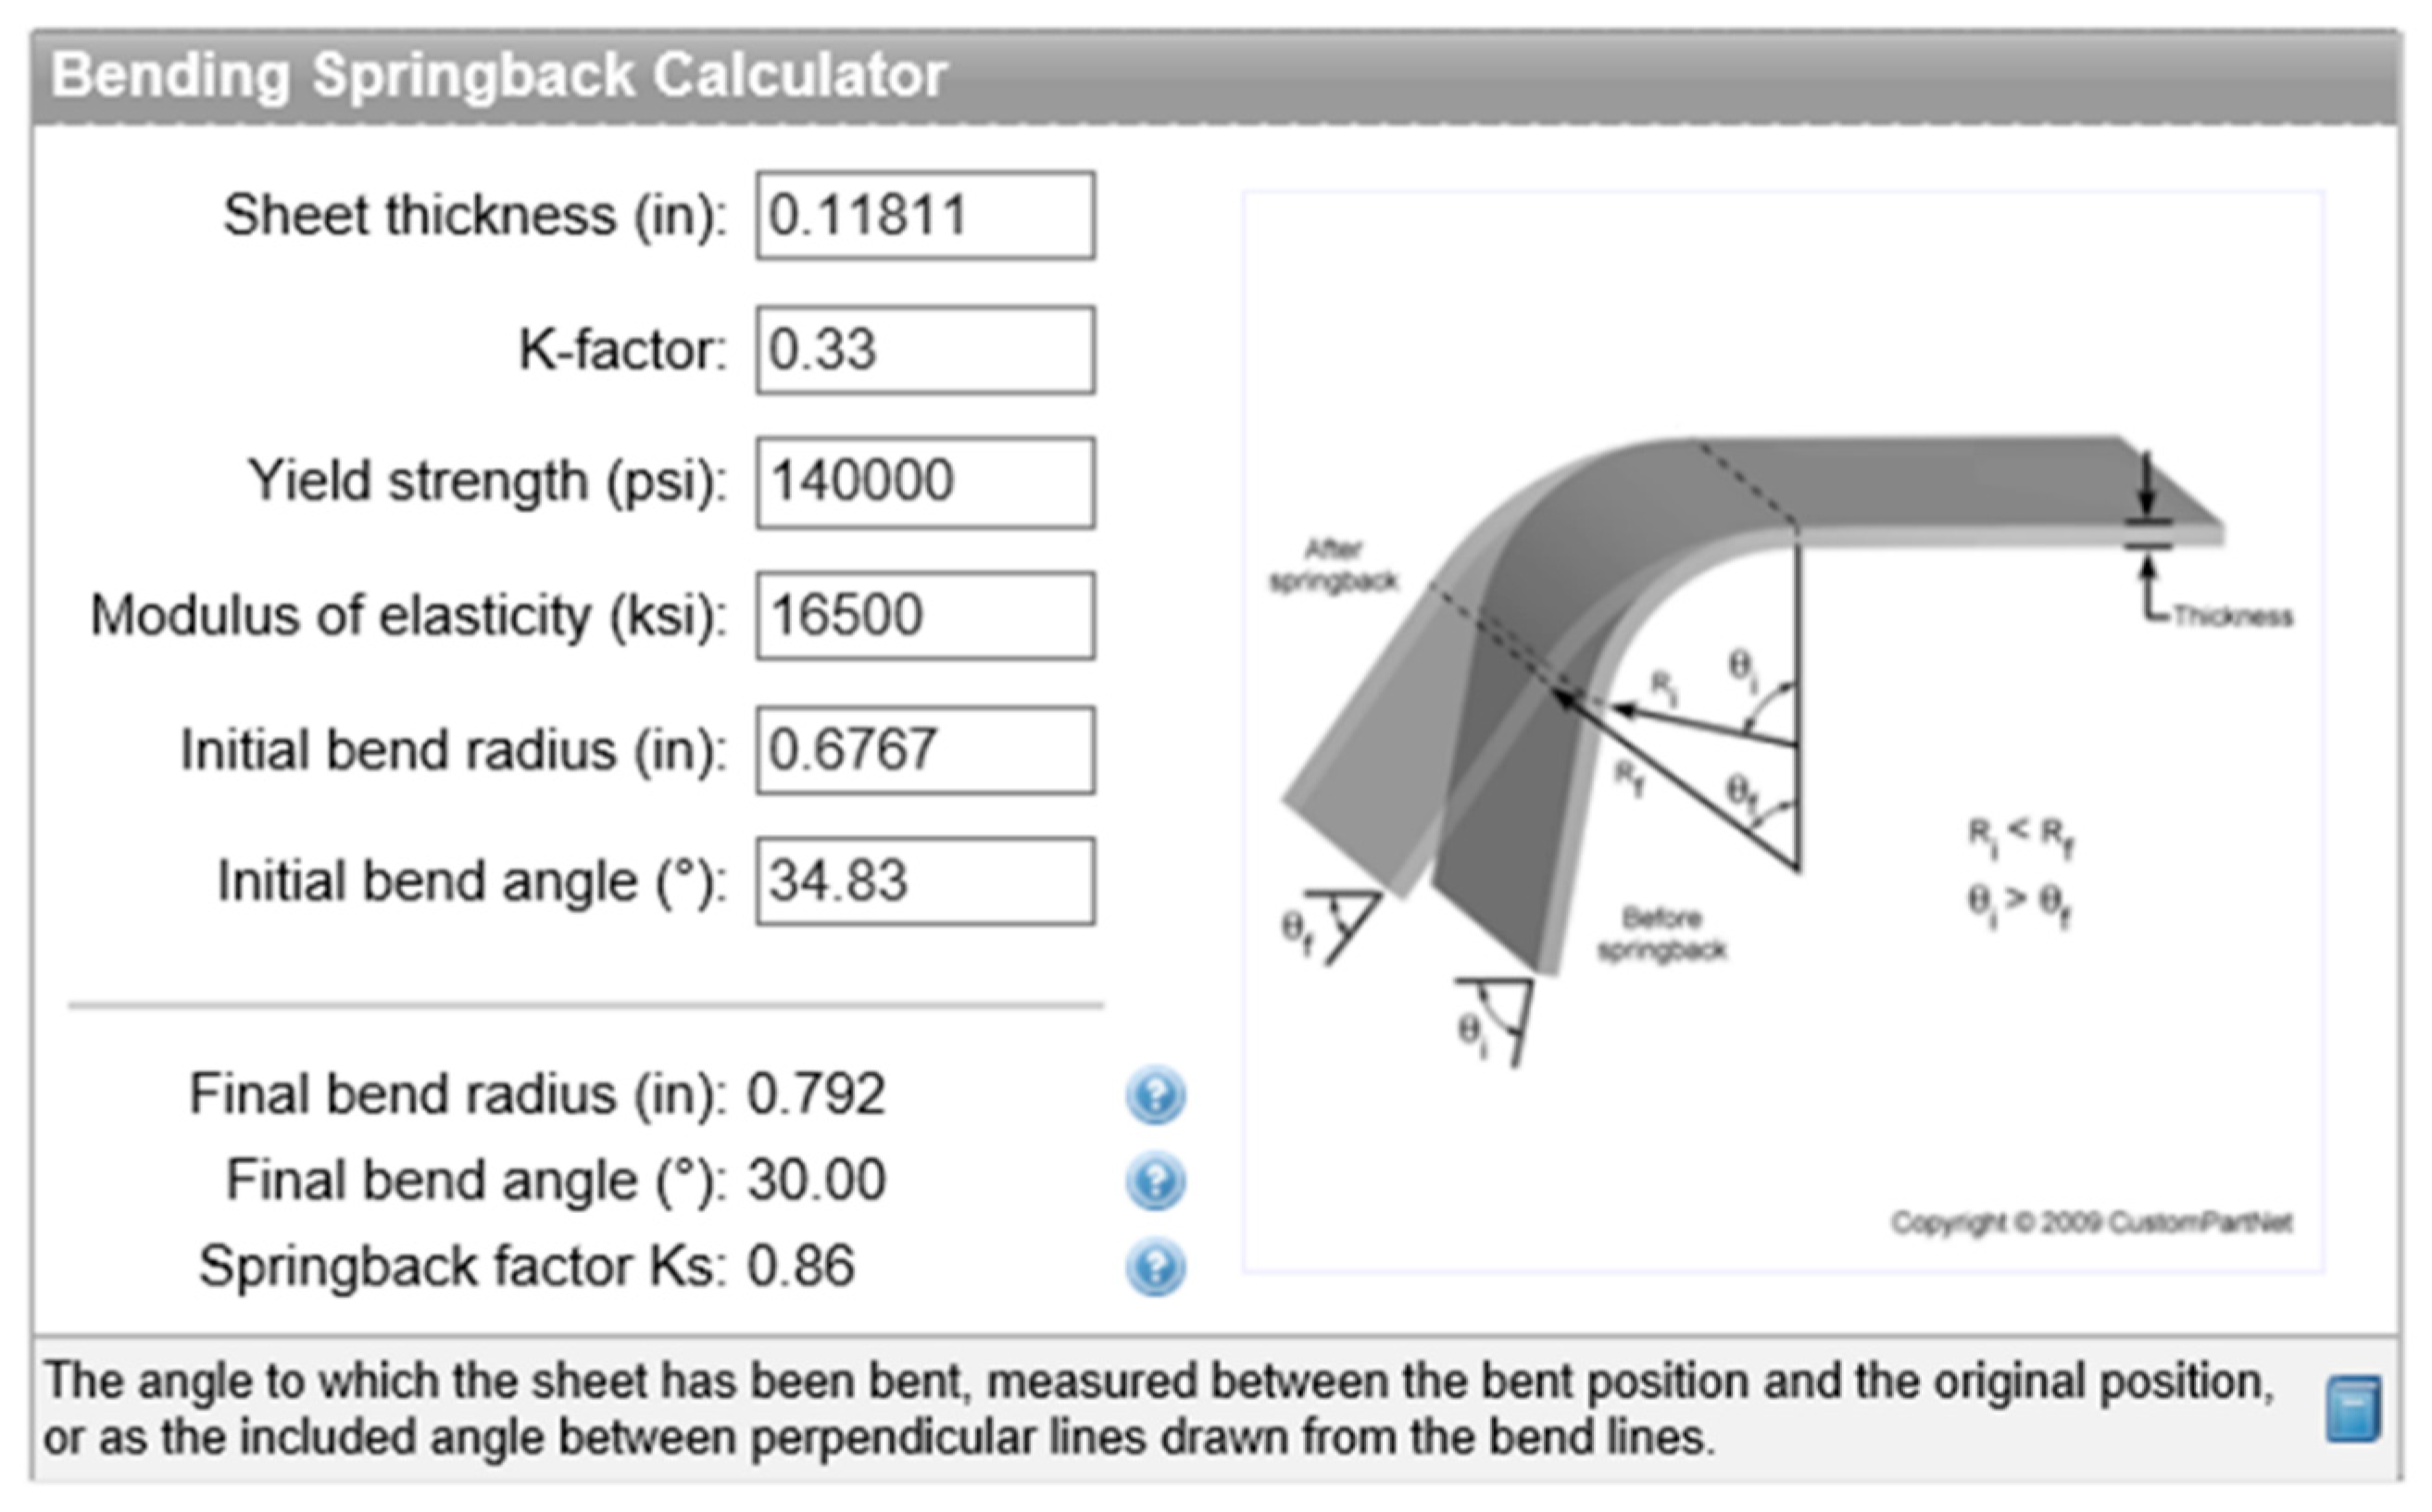
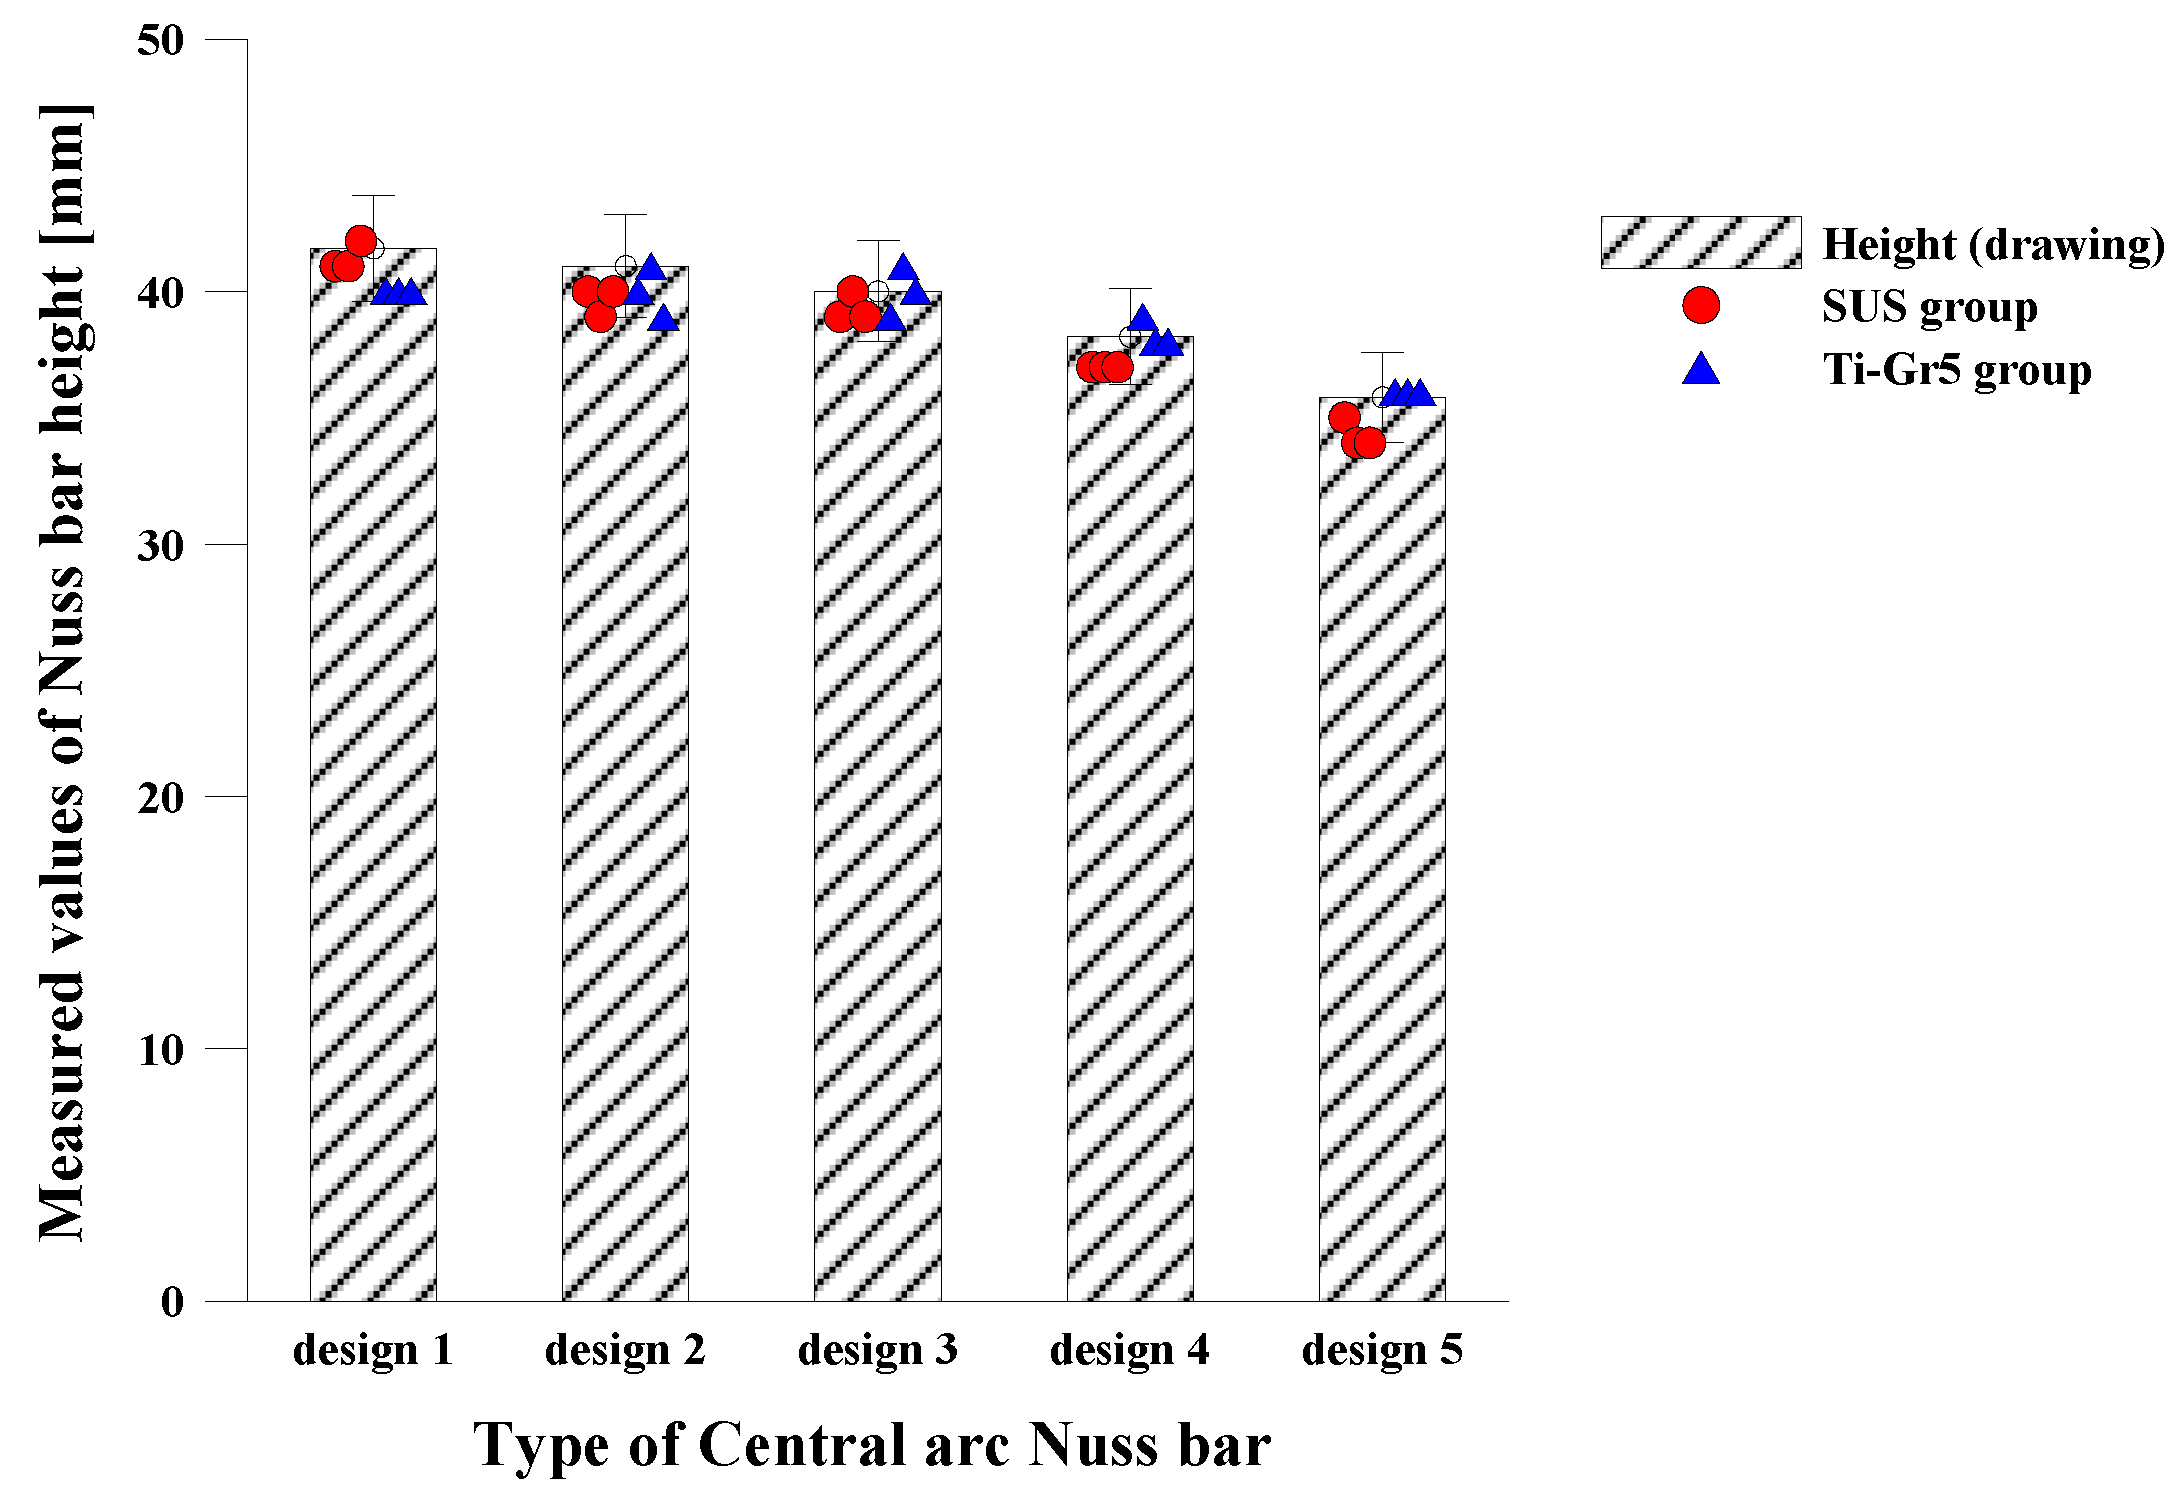
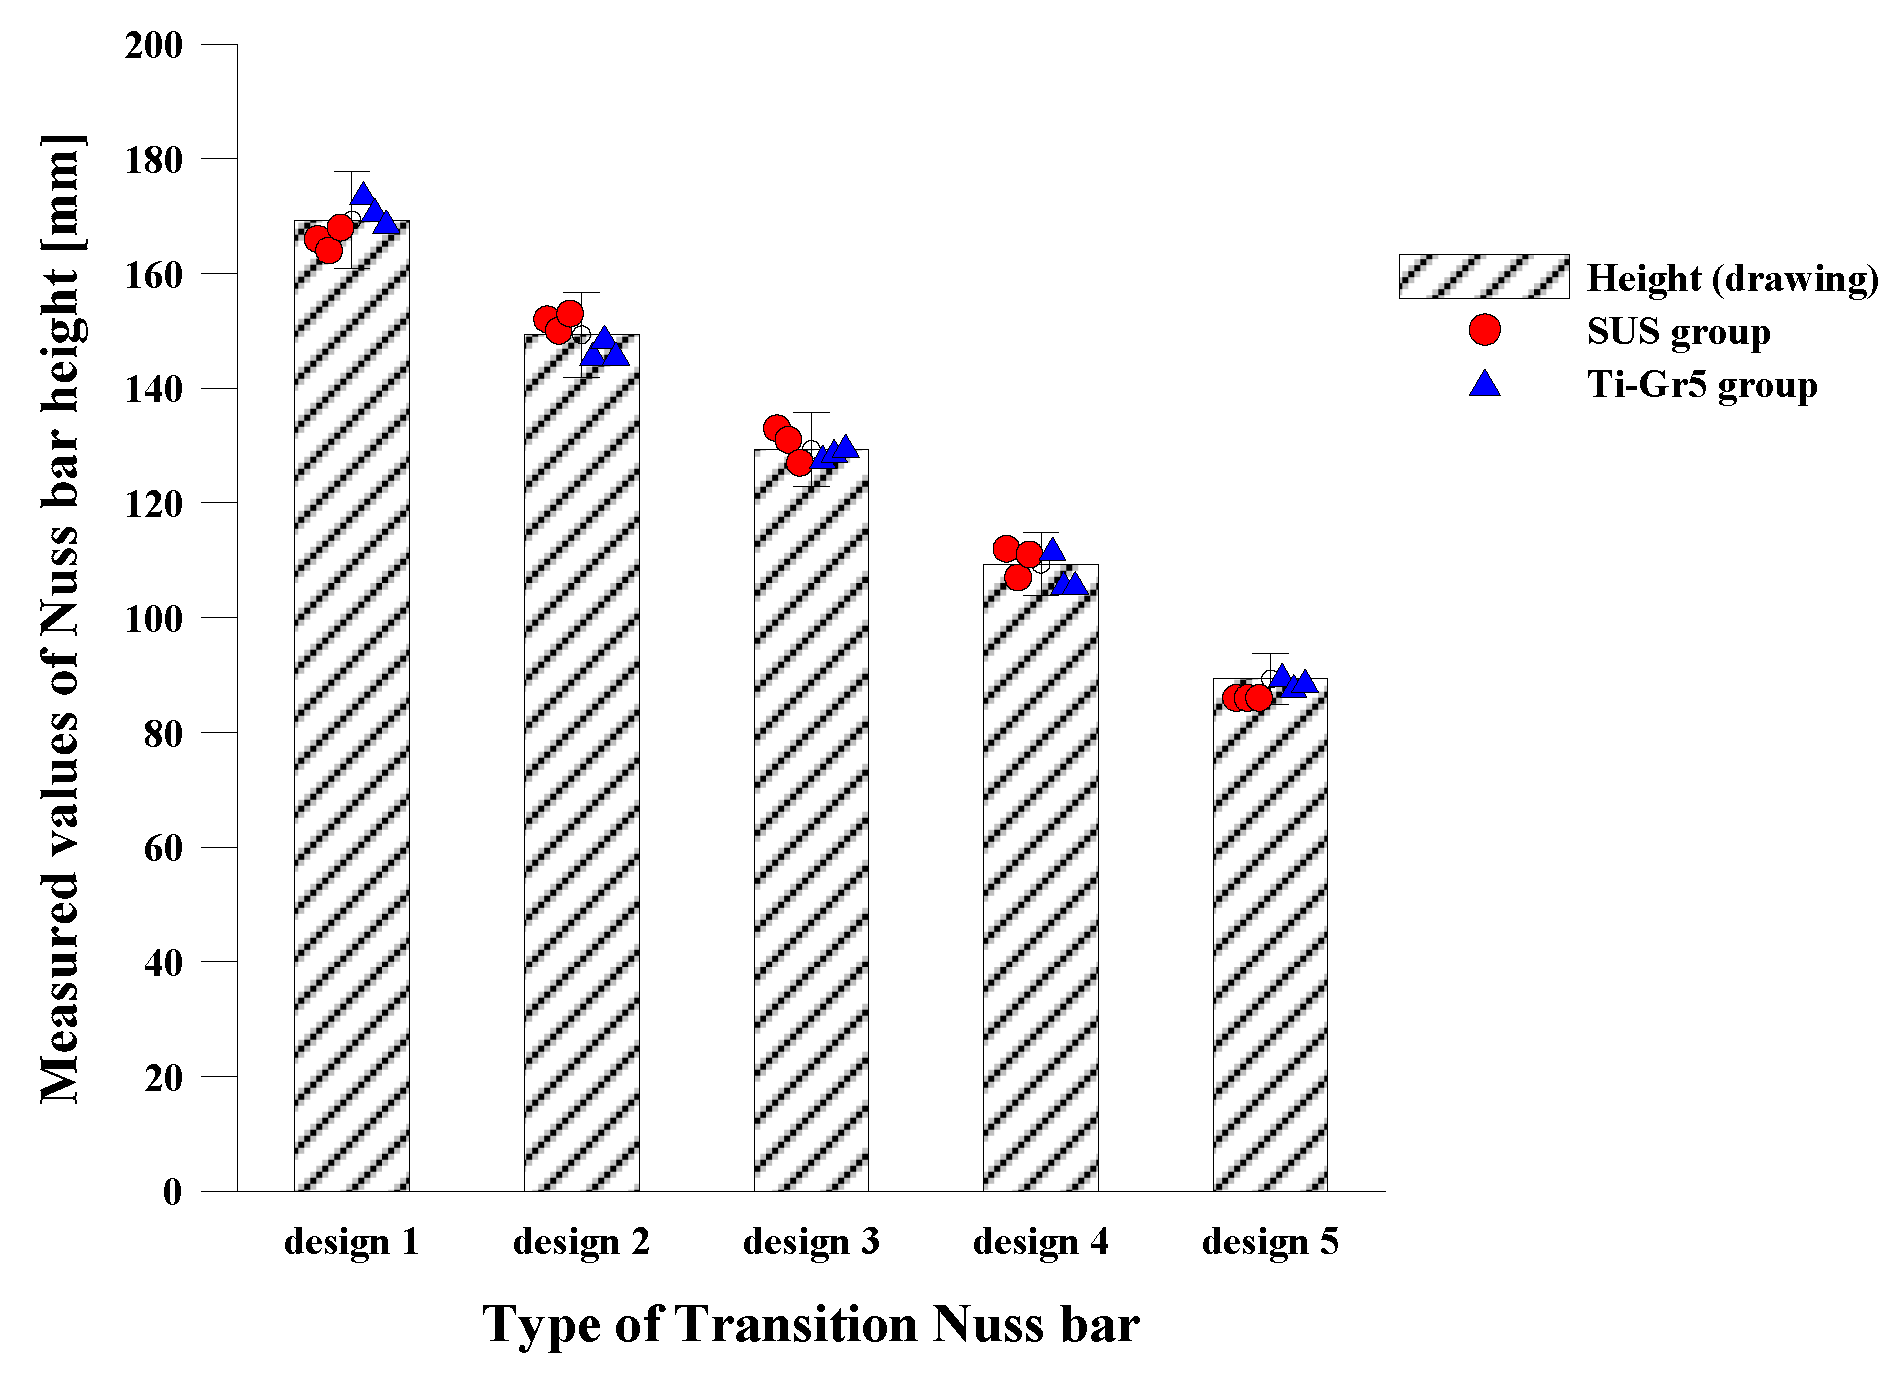
3.2.1. Bending Test for Patient-Specific Nuss Bar Fabrication
3.2.2. Manufacture of Patient-Specific Nuss Bar
4. Discussion
5. Conclusions
Author Contributions
Funding
Conflicts of Interest
References
- Kilda, A.; Basevicius, A.; Barauskas, V.; Lukosevicius, S.; Ragaisis, D. Radiological assessment of children with pectus excavatum. Indian J. Pediatr. 2007, 74, 143–147. [Google Scholar] [CrossRef] [PubMed]
- Park, H. Minimally Invasive Surgery for Pectus Excavatum&58; Park Technique. J. Clin. Anal. Med. 2011, 2, 84–90. [Google Scholar]
- Lee, J.H.; Kim, S.J.; Kang, J.H.; Chung, W.S.; Kim, H.; Chon, S.H. Silastic molding method for pectus excavatum correction using a polyvinyl alcohol (Ivalon) sponge. Korean J. Thorac. Cardiovasc. Surg. 2012, 45, 418–420. [Google Scholar] [CrossRef] [PubMed]
- Uemura, S.; Nakagawa, Y.; Yoshida, A.; Choda, Y. Experience in 100 cases with the Nuss procedure using a technique for stabilization of the pectus bar. Pediatr. Surg. Int. 2003, 19, 186–189. [Google Scholar] [PubMed]
- Yoon, Y.S.; Kim, H.K.; Choi, Y.S.; Kim, K.; Shim, Y.M.; Kim, J. A modified Nuss procedure for late adolescent and adult pectus excavatum. World J. Surg. 2010, 34, 1475–1480. [Google Scholar] [CrossRef] [PubMed]
- Nagasao, T.; Miyamoto, J.; Tamaki, T.; Ichihara, K.; Jiang, H.; Taguchi, T.; Yozu, R.; Nakajima, T. Stress distribution on the thorax after the Nuss procedure for pectus excavatum results in different patterns between adult and child patients. J. Thorac. Cardiovasc. Surg. 2007, 134, 1502–1507. [Google Scholar] [CrossRef] [PubMed]
- Park, H.J.; Song, C.M.; Her, K.; Jeon, C.W.; Chang, W.; Park, H.-G.; Lee, S.Y.; Lee, C.S.; Youm, W.; Lee, K.R. Minimally Invasive Repair of Pectus Excavatum Based on the Nuss Principle:An Evolution of Techniques and Early Results on 322 Patients. Korean J. Thorac. Cardiovasc. Surg. 2003, 36, 164–174. [Google Scholar]
- Lin, K.-H.; Huang, Y.-J.; Hsu, H.-H.; Lee, S.-C.; Huang, H.-K.; Chen, Y.-Y.; Chang, H.; Chen, J.-E.; Huang, T.-W. The Role of Three-Dimensional Printing in the Nuss Procedure: Three-Dimensional Printed Model-Assisted Nuss Procedure. Ann. Thorac. Surg. 2018, 105, 413–417. [Google Scholar] [CrossRef] [PubMed]
- Bonacina, L.; Froio, A.; Conti, D.; Marcolin, F.; Vezzetti, E. Automatic 3D foetal face model extraction from ultrasonography through histogram processing. J. Med. Ultrasound 2016, 24, 142–149. [Google Scholar] [CrossRef]
- Archer, J.E.; Gardner, A.; Berryman, F.; Pynsent, P. The measurement of the normal thorax using the Haller index methodology at multiple vertebral levels. J. Anat. 2016, 229, 577–581. [Google Scholar] [CrossRef] [PubMed]
- Robbins, L.P. Pectus excavatum. Radiol. Case Rep. 2011, 6, 460. [Google Scholar] [CrossRef] [PubMed]
- Khanna, G.; Jaju, A.; Don, S.; Keys, T.; Hildebolt, C.F. Comparison of Haller index values calculated with chest radiographs versus CT for pectus excavatum evaluation. Pediatr. Radiol. 2010, 40, 1763–1767. [Google Scholar] [CrossRef] [PubMed]
- Poston, P.M.; Patel, S.S.; Rajput, M.; Rossi, N.O.; Ghanamah, M.S.; Davis, J.E.; Turek, J.W. The correction index: setting the standard for recommending operative repair of pectus excavatum. Ann. Thorac. Surg. 2014, 97, 1176–1180. [Google Scholar] [CrossRef] [PubMed]
- Radiopaedia: Haller Index. Available online: https://radiopaedia.org/articles/haller-index (accessed on 5 March 2018).
- Daunt, S.W.; Cohen, J.H.; Miller, S.F. Age-related normal ranges for the Haller index in children. Pediatr. Radiol. 2004, 34, 326–330. [Google Scholar] [CrossRef] [PubMed]
- Ewert, F.; Syed, J.; Wagner, S.; Besendoerfer, M.; Carbon, R.T.; Schulz-Drost, S. Does an external chest wall measurement correlate with a CT-based measurement in patients with chest wall deformities? J. Pediatr. Surg. 2017, 52, 1583–1590. [Google Scholar] [CrossRef] [PubMed]
- Rha, E.Y.; Kim, J.H.; Yoo, G.; Ahn, S.; Lee, J.; Jeong, J.Y. Changes in thoracic cavity dimensions of pectus excavatum patients following Nuss procedure. J. Thorac. Dis. 2018, 10, 4255–4261. [Google Scholar] [CrossRef] [PubMed]
- Wall, C.; Group, I.; Chest, O.N.; Diseases, W. Effect of radiotherapy after mastectomy and axillary surgery on 10-year recurrence and 20-year breast cancer mortality: meta-analysis of individual patient data for 8135 women in 22 randomised trials. Lancet 2014, 383, 2127–2135. [Google Scholar]
- Rebeis, E.B.; de Campos, J.R.M.; Fernandez, Â.; Moreira, L.F.P.; Jatene, F.B. Anthropometric index for pectus excavatum. Clinics 2007, 62, 599–606. [Google Scholar] [CrossRef] [PubMed]
- Damián-Noriega, Z.; Pérez-Moreno, R.; Villanueva-Pruneda, S.A.; Domínguez-Hernández, V.M.; Puerta-Huerta, J.P.A.; Huerta-Muñoz, C. A new equation to determine the springback in the bending process of metallic sheet. In Proceedings of the ICCES: International Conference on Computational & Experimental Engineering and Sciences, Crete, Greece, 25–30 September 2008; Volume 8, pp. 25–30. [Google Scholar]
- Narita, K.; Niinomi, M.; Nakai, M.; Akahori, T.; Tsutsumi, H.; Oribe, K. Bending fatigue and spring back properties of implant rods made of β-type titanium alloy for spinal fixture. In Advanced Materials Research; Trans Tech Publications: Stafa-Zurich, Switzerland, 2010; Volume 89, pp. 400–404. [Google Scholar]
- Adamus, J.; Lacki, P.; Motyka, M.; Nitkiewicz, Z. Analysis of titanium sheet bending process. Inż. Mater. 2010, 31, 716–719. [Google Scholar]
- CUSTOMPART.NET: Spring Back Calculator. Available online: https://www.custompartnet.com/calculator/bending-springback (accessed on 12 April 2018).
- SM: Spring Back. Available online: http://sheetmetal.me/tooling-terminology/spring-back/ (accessed on 2 April 2018).
- Brown, A.L.; Cook, O. Cardio-respiratory studies in pre and post operative funnel chest (Pectus excavatum). Dis. Chest 1951, 20, 378–391. [Google Scholar] [CrossRef] [PubMed]


| Degree of Pectus Excavatum | Range of Haller Index |
|---|---|
| Normal chest | <2.0 |
| Mild excavatum | 2.0–3.2 |
| Moderate excavatum | 3.2–3.5 |
| Severe excavatum | >3.5 |
| Average Power Consumption | Electrical Requirement | Installed Power | Air Requirement |
|---|---|---|---|
| 1.9 KW/h | 230 Volts/single-phase/50–60 Hz | 5 kVA | Dry air 100 psi (min. 80 psi) |
| Index | Description | Value |
|---|---|---|
| 0 | Default Units | 0.0000 |
| 1 | Stop Machine if done | 0.0000 |
| 6 | Return Bender Speed | 100.0000 |
| 7 | Delay at the end of program | 0.0000 |
| 12 | Cut at the end of program | 3.0000 |
| 16 | Negative Z-axis limit | −200.0000 |
| 17 | Positive Z-axis limit | 200.0000 |
| 18 | Initial Feeder position * | 756.750 |
| 19 | Initial Bender position | 0.0000 |
| 20 | Output ON Delay | 80.0000 |
| 21 | Output OFF Delay | 80.0000 |
| 23 | Feeder Clamp move to grip | 0.0000 |
| 24 | Arm Collision detection Rotation Default | 5.0000 |
| Index | Description | Value |
|---|---|---|
| 0 | Inner bending roller diameter (mm) | 19.050 |
| 1 | Outer bending roller diameter (mm) | 19.050 |
| 3 | Upper Roller Center to X (mm) | 27.305 |
| 10 | Tool type (#) | 5 (=Mandrel cluster) |
| 11 | Tool Cluster Diameter | 75.001 |
| Point | A (mm): Pre-Op. | A’ (mm): Post-Op. | B (mm): Pre-Op. | C (mm): Post-Op. | HI: Pre-Op. | ICI: Post-Op. |
|---|---|---|---|---|---|---|
| A | 217.86 | 206.97 | 73.01 | 101.11 | 2.98 | 2.05 |
| B | 215.22 | 204.46 | 68.61 | 103.49 | 3.14 | 1.98 |
| C | 217.57 | 206.70 | 73.30 | 104.15 | 2.97 | 1.98 |
| Type | A (mm): Pre-Op. | A’ (mm): Post-Op. | C (mm): Pre-Op. | C’ (mm): Post-Op. | HI: Pre-Op. | ICI: Post-Op. |
|---|---|---|---|---|---|---|
| Eccentric (Patient No. 2) | 197.2 | 187.34 | 60.4 | 84.4 | 3.26 | 2.22 |
| Unbalanced (Patient No. 3) | 246.0 | 233.7 | 72.6 | 98.6 | 3.39 | 2.37 |
| Material | Sheet Thickness (mm) | K-Factor | Yield Strength (psi *) | Elastic Modulus (psi) * | Initial Bend Radius (mm) | Initial Bend Angle (°) |
|---|---|---|---|---|---|---|
| Ti-Gr5 | 3 | 0.33 | 140,000 | 16,500 | Up to transition values | |
| SUS | 3 | 0.33 | 116,000 | 28,000 | ||
| Symmetric | Eccentric | Unbalanced | |||||
|---|---|---|---|---|---|---|---|
| SUS | Ti-Gr5 | SUS | Ti-Gr5 | SUS | Ti-Gr5 | ||
| Drawing (mm) | Width (A) | 298.1 | 304.2 | 297.8 | |||
| Height (B) | 86.3 | 84.4 | 78.6 | ||||
| Specimen 1 (mm) | Width (A) | 297.5 | 298 | 303 | 305 | 299 | 297 |
| Height (B) | 85 | 86 | 86 | 85 | 82 | 80.5 | |
| Specimen 2 (mm) | Width (A) | 298.5 | 298 | 302 | 304 | 296 | 298 |
| Height (B) | 86 | 85 | 86 | 86 | 82 | 79.5 | |
| Specimen 3 (mm) | Width (A) | 300 | 300 | 303 | 302 | 297 | 299 |
| Height (B) | 86 | 85 | 87 | 85 | 82.5 | 81.5 | |
© 2018 by the authors. Licensee MDPI, Basel, Switzerland. This article is an open access article distributed under the terms and conditions of the Creative Commons Attribution (CC BY) license (http://creativecommons.org/licenses/by/4.0/).
Share and Cite
Kim, Y.-J.; Heo, J.-Y.; Hong, K.-H.; I, H.; Lim, B.-Y.; Lee, C.-S. Computer-Aided Design and Manufacturing Technology for Identification of Optimal Nuss Procedure and Fabrication of Patient-Specific Nuss Bar for Minimally Invasive Surgery of Pectus Excavatum. Appl. Sci. 2019, 9, 42. https://doi.org/10.3390/app9010042
Kim Y-J, Heo J-Y, Hong K-H, I H, Lim B-Y, Lee C-S. Computer-Aided Design and Manufacturing Technology for Identification of Optimal Nuss Procedure and Fabrication of Patient-Specific Nuss Bar for Minimally Invasive Surgery of Pectus Excavatum. Applied Sciences. 2019; 9(1):42. https://doi.org/10.3390/app9010042
Chicago/Turabian StyleKim, Yoon-Jin, Jin-Young Heo, Ki-Hyun Hong, Hoseok I, Beop-Yong Lim, and Chi-Seung Lee. 2019. "Computer-Aided Design and Manufacturing Technology for Identification of Optimal Nuss Procedure and Fabrication of Patient-Specific Nuss Bar for Minimally Invasive Surgery of Pectus Excavatum" Applied Sciences 9, no. 1: 42. https://doi.org/10.3390/app9010042
APA StyleKim, Y.-J., Heo, J.-Y., Hong, K.-H., I, H., Lim, B.-Y., & Lee, C.-S. (2019). Computer-Aided Design and Manufacturing Technology for Identification of Optimal Nuss Procedure and Fabrication of Patient-Specific Nuss Bar for Minimally Invasive Surgery of Pectus Excavatum. Applied Sciences, 9(1), 42. https://doi.org/10.3390/app9010042