Dynamic Monitoring of the Water Flowing Fractured Zone during the Mining Process under a River


Abstract
:1. Introduction
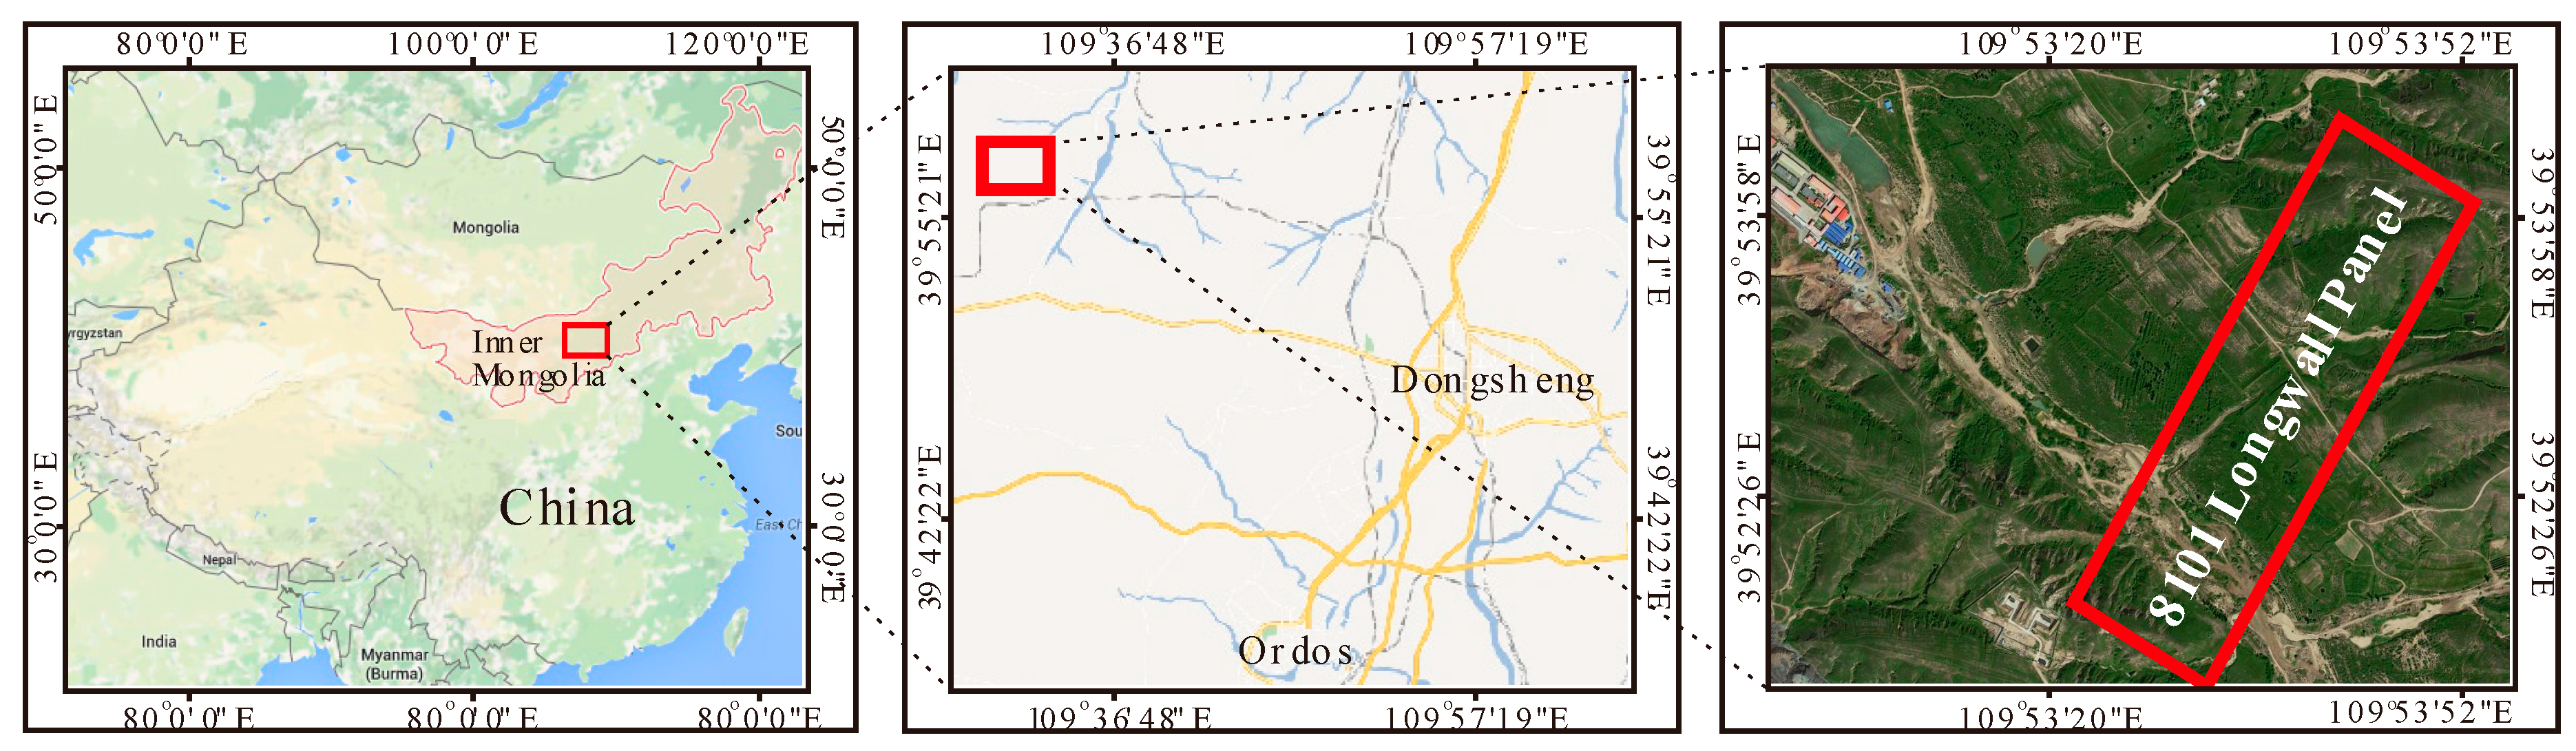
2. Survey Area
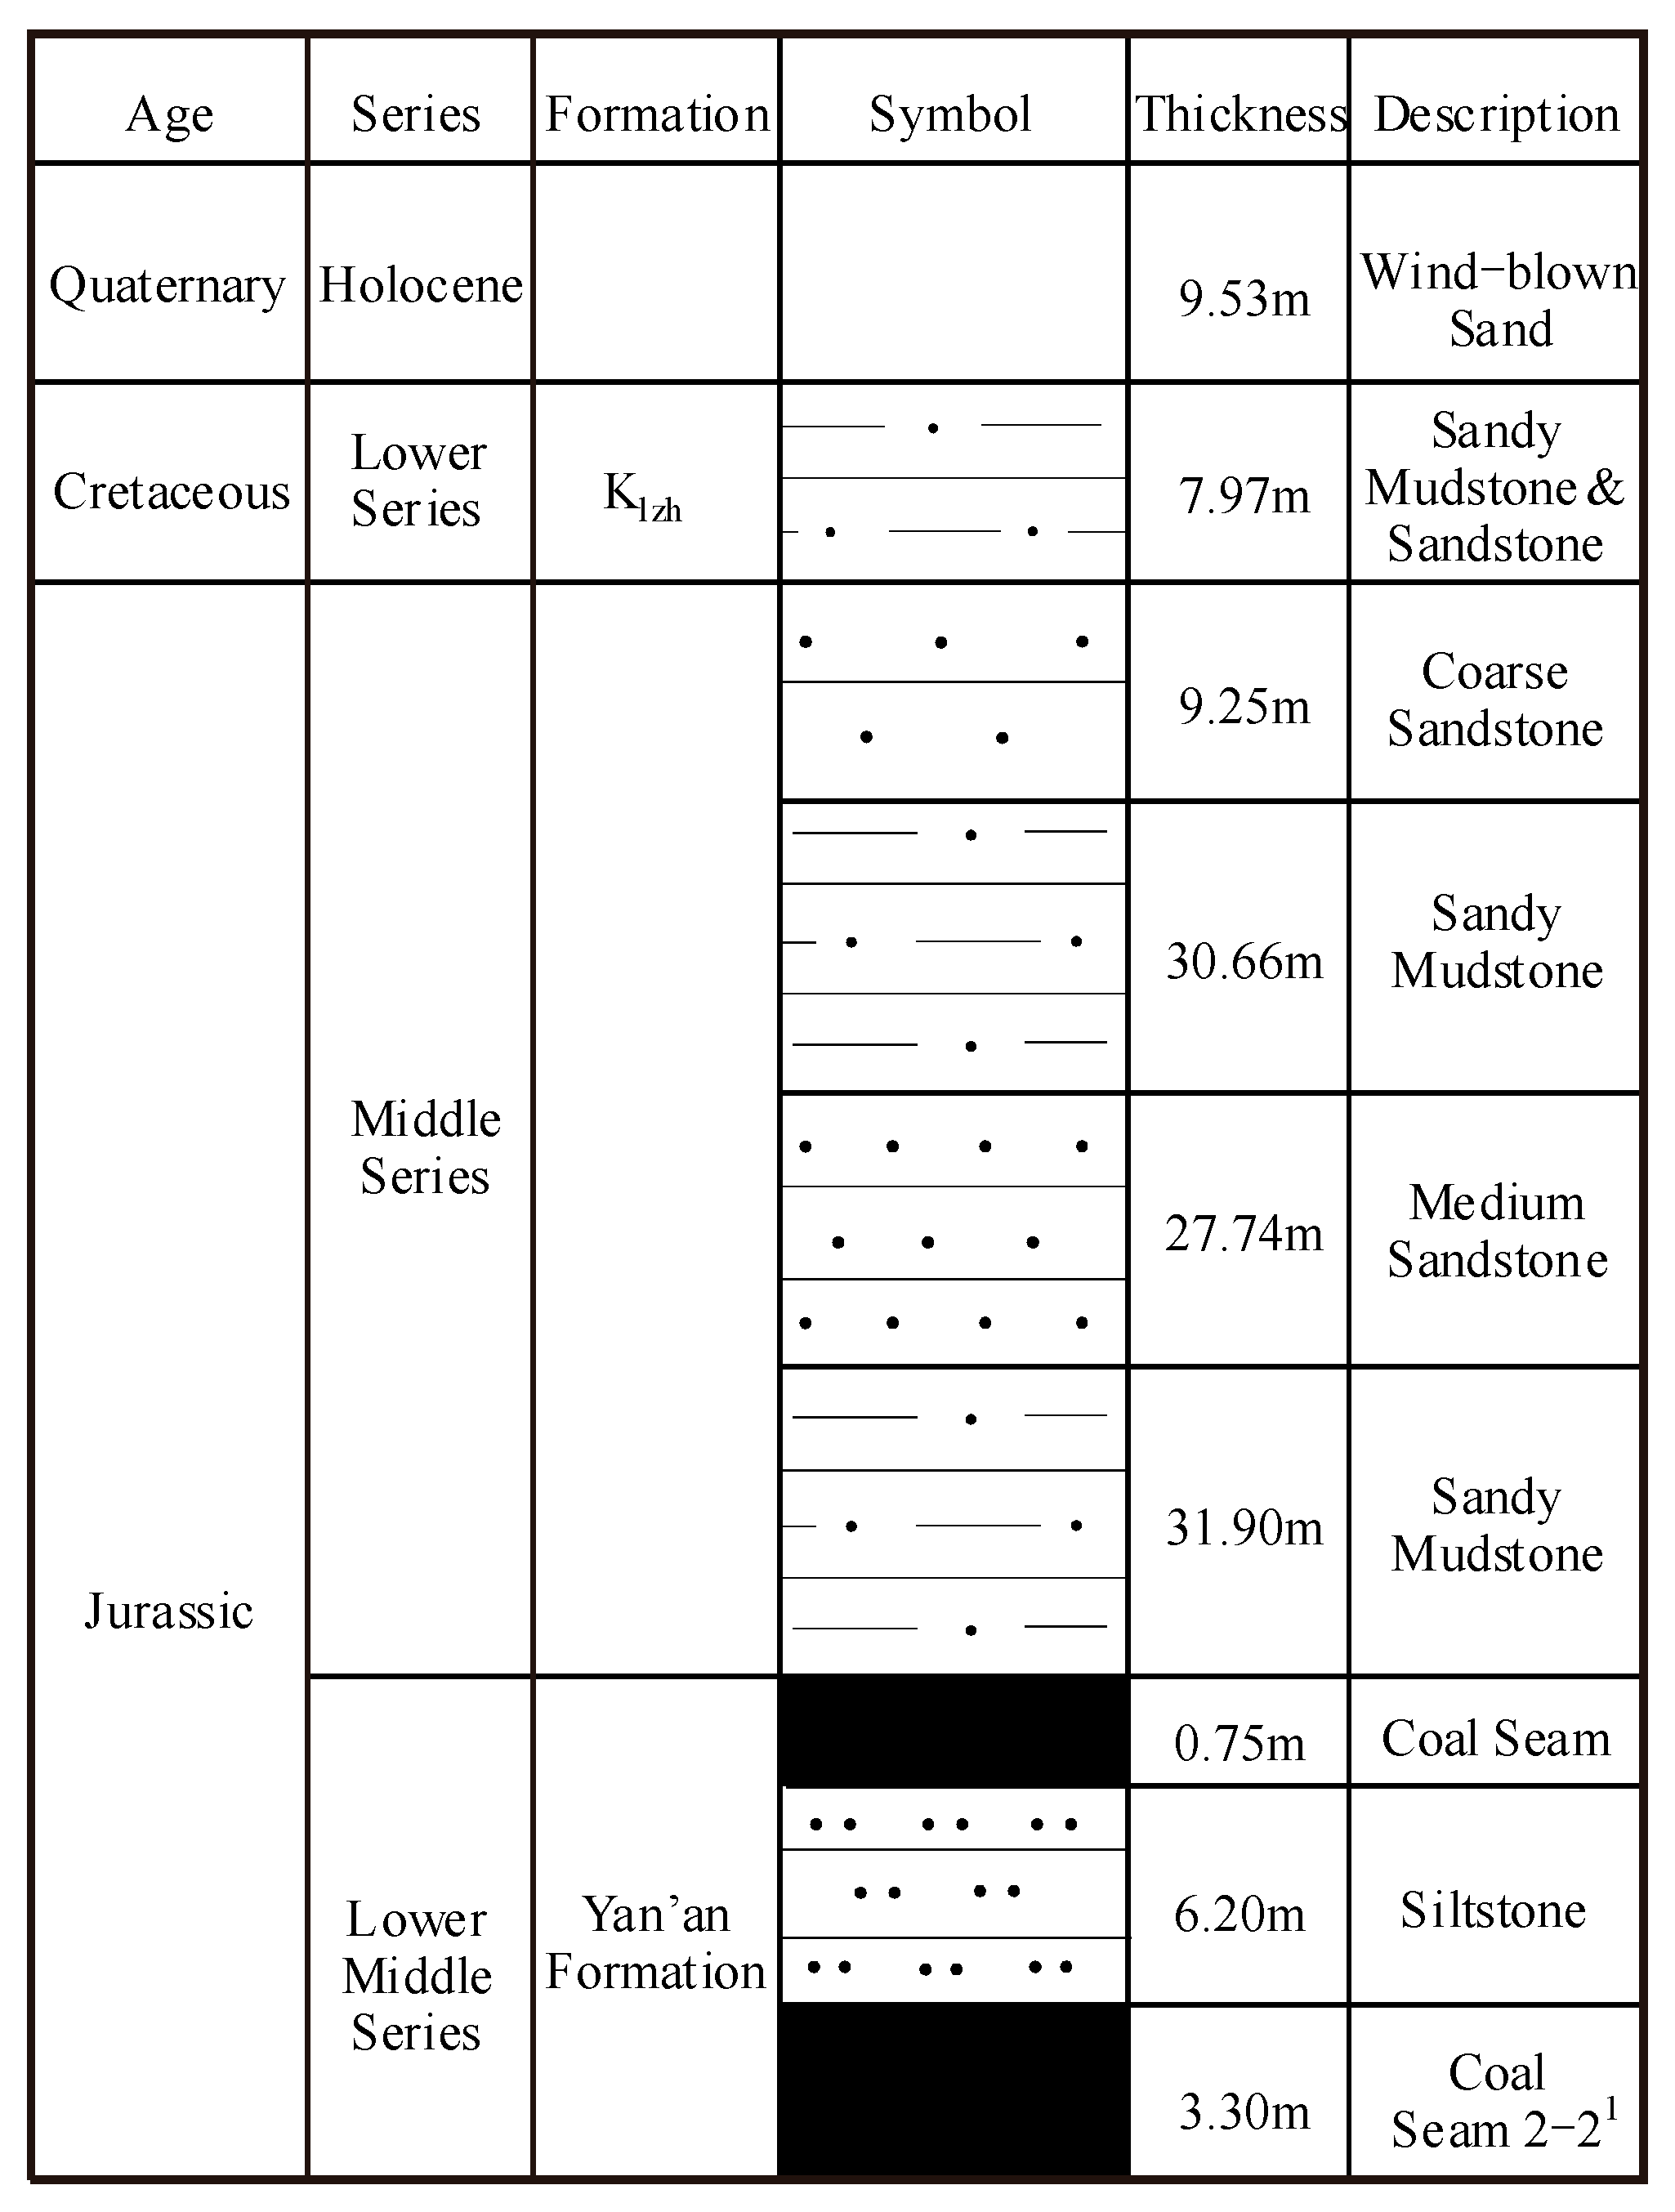
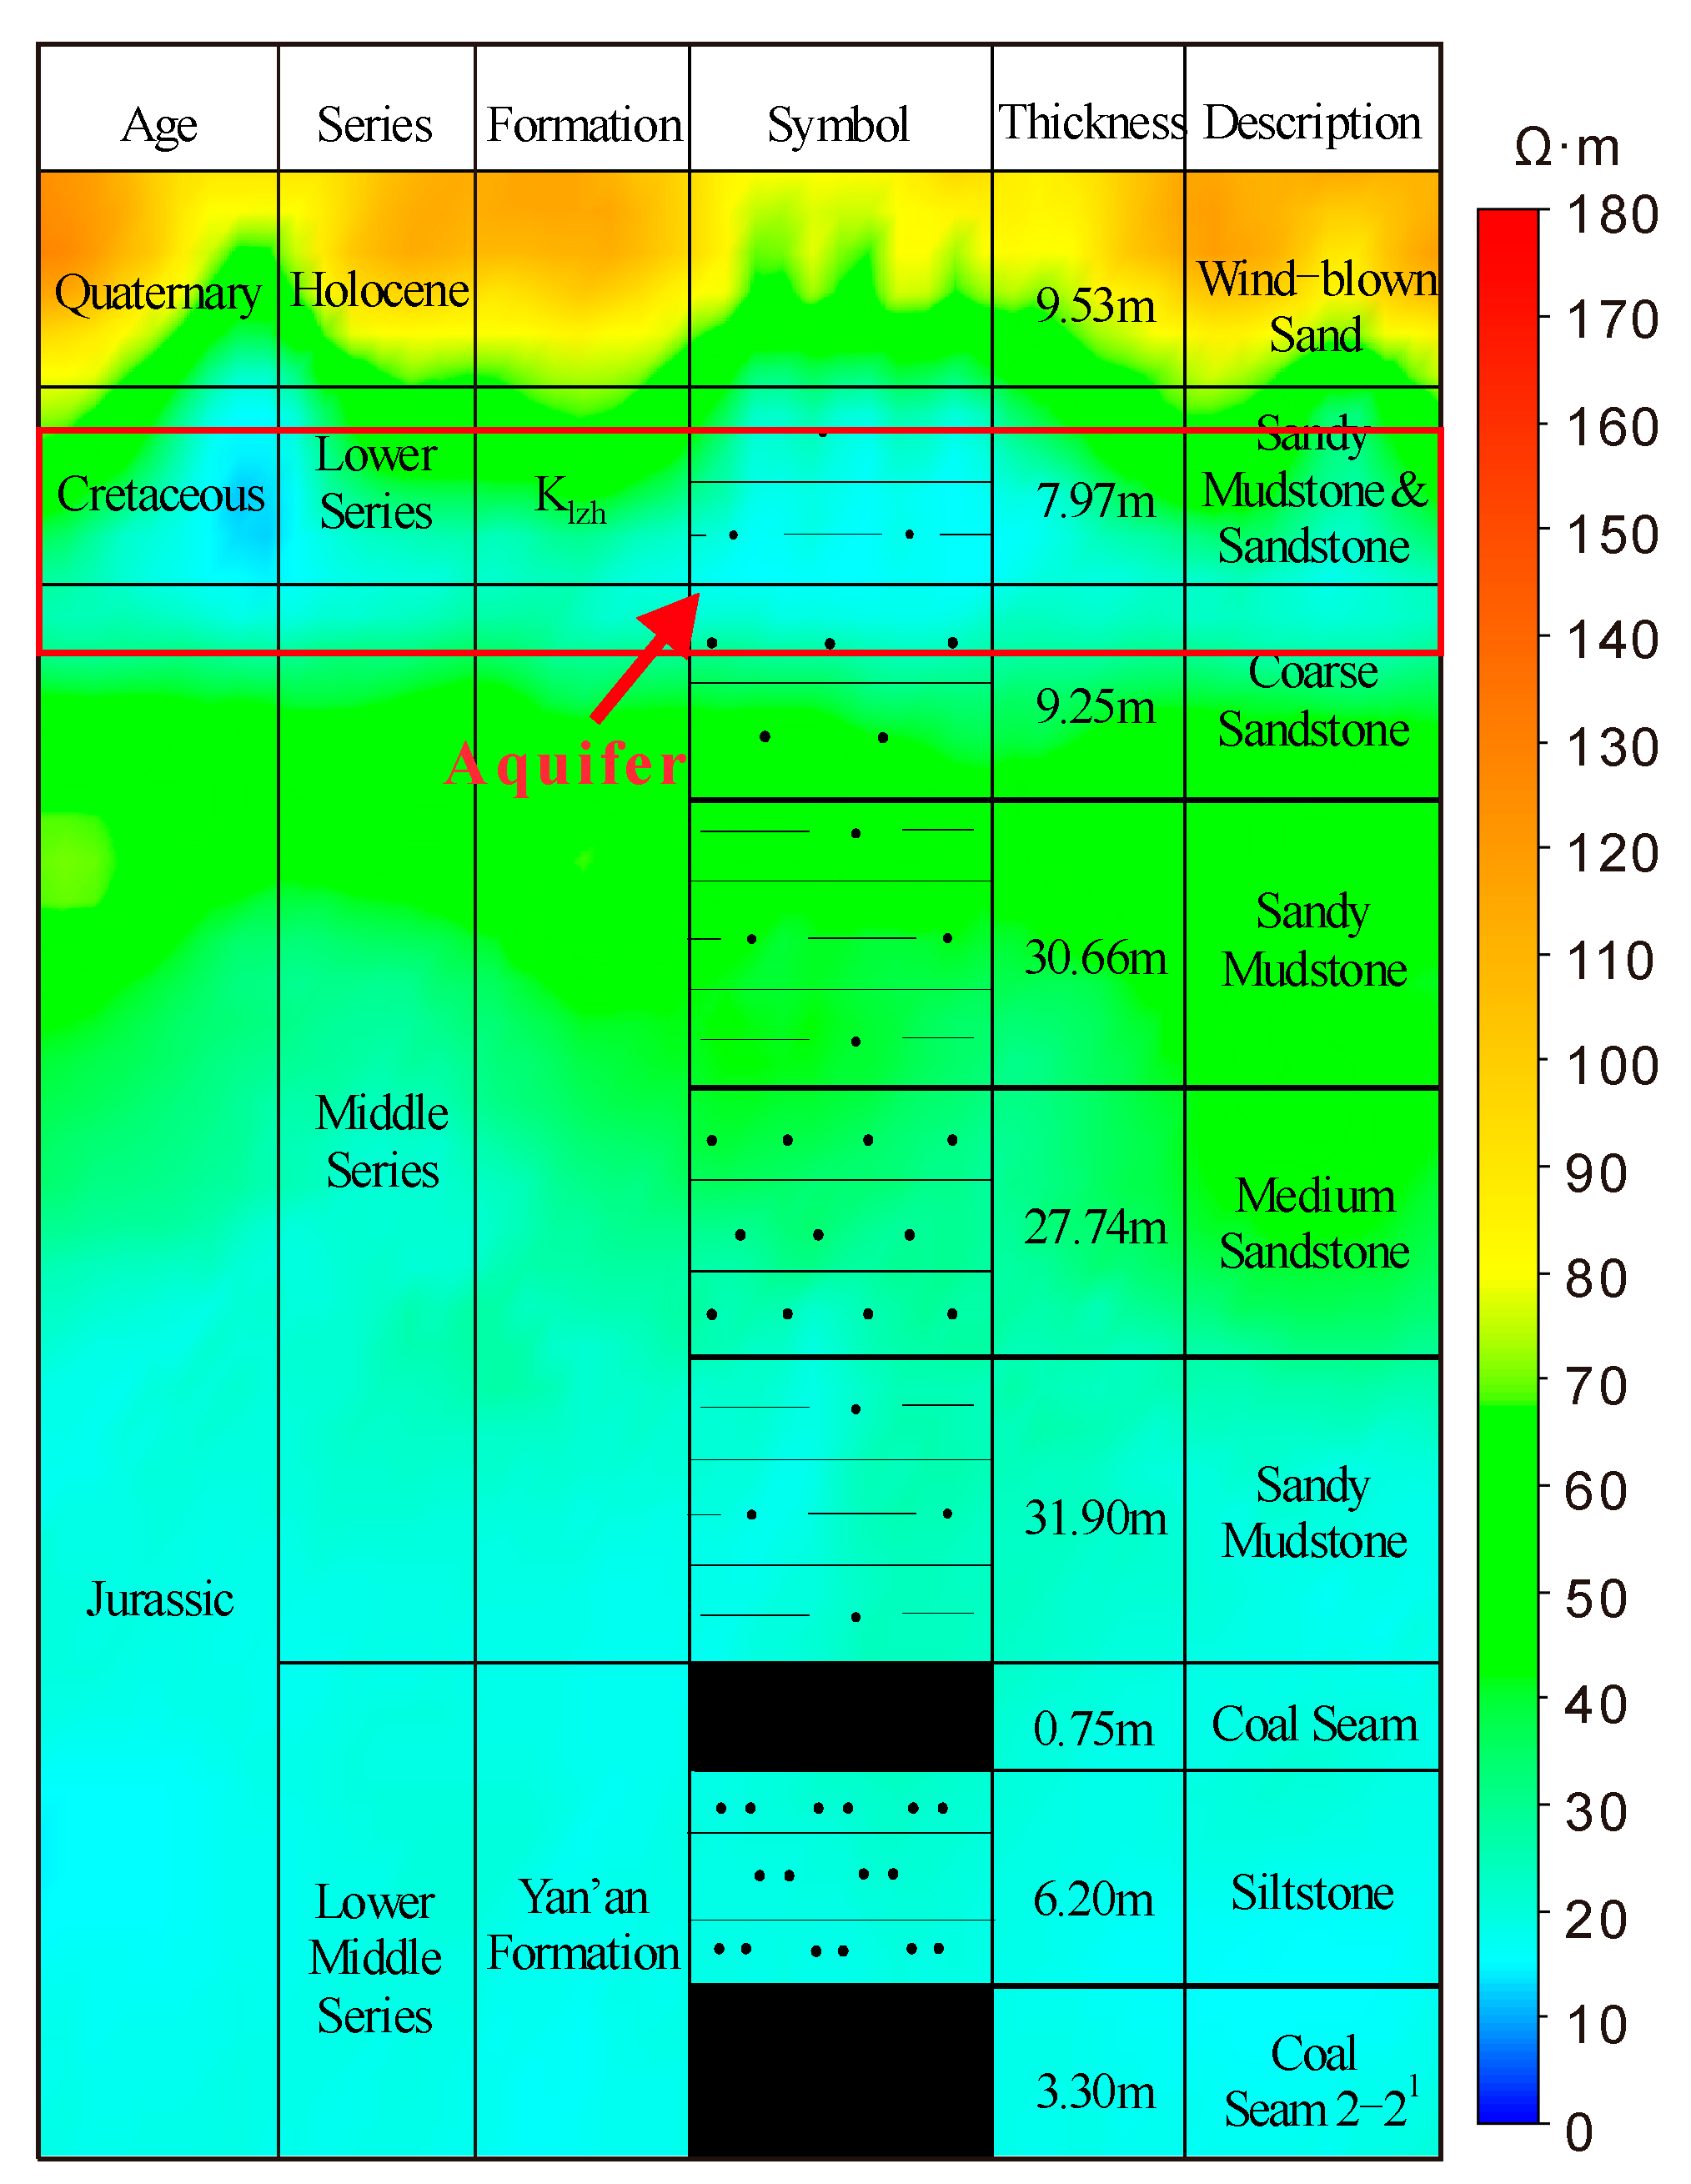
2.1. Geological Conditions
2.2. Failure Characteristics of the Overburden Strata
3. Materials and Methods
3.1. Determination Methods of the Height of the WFFZ
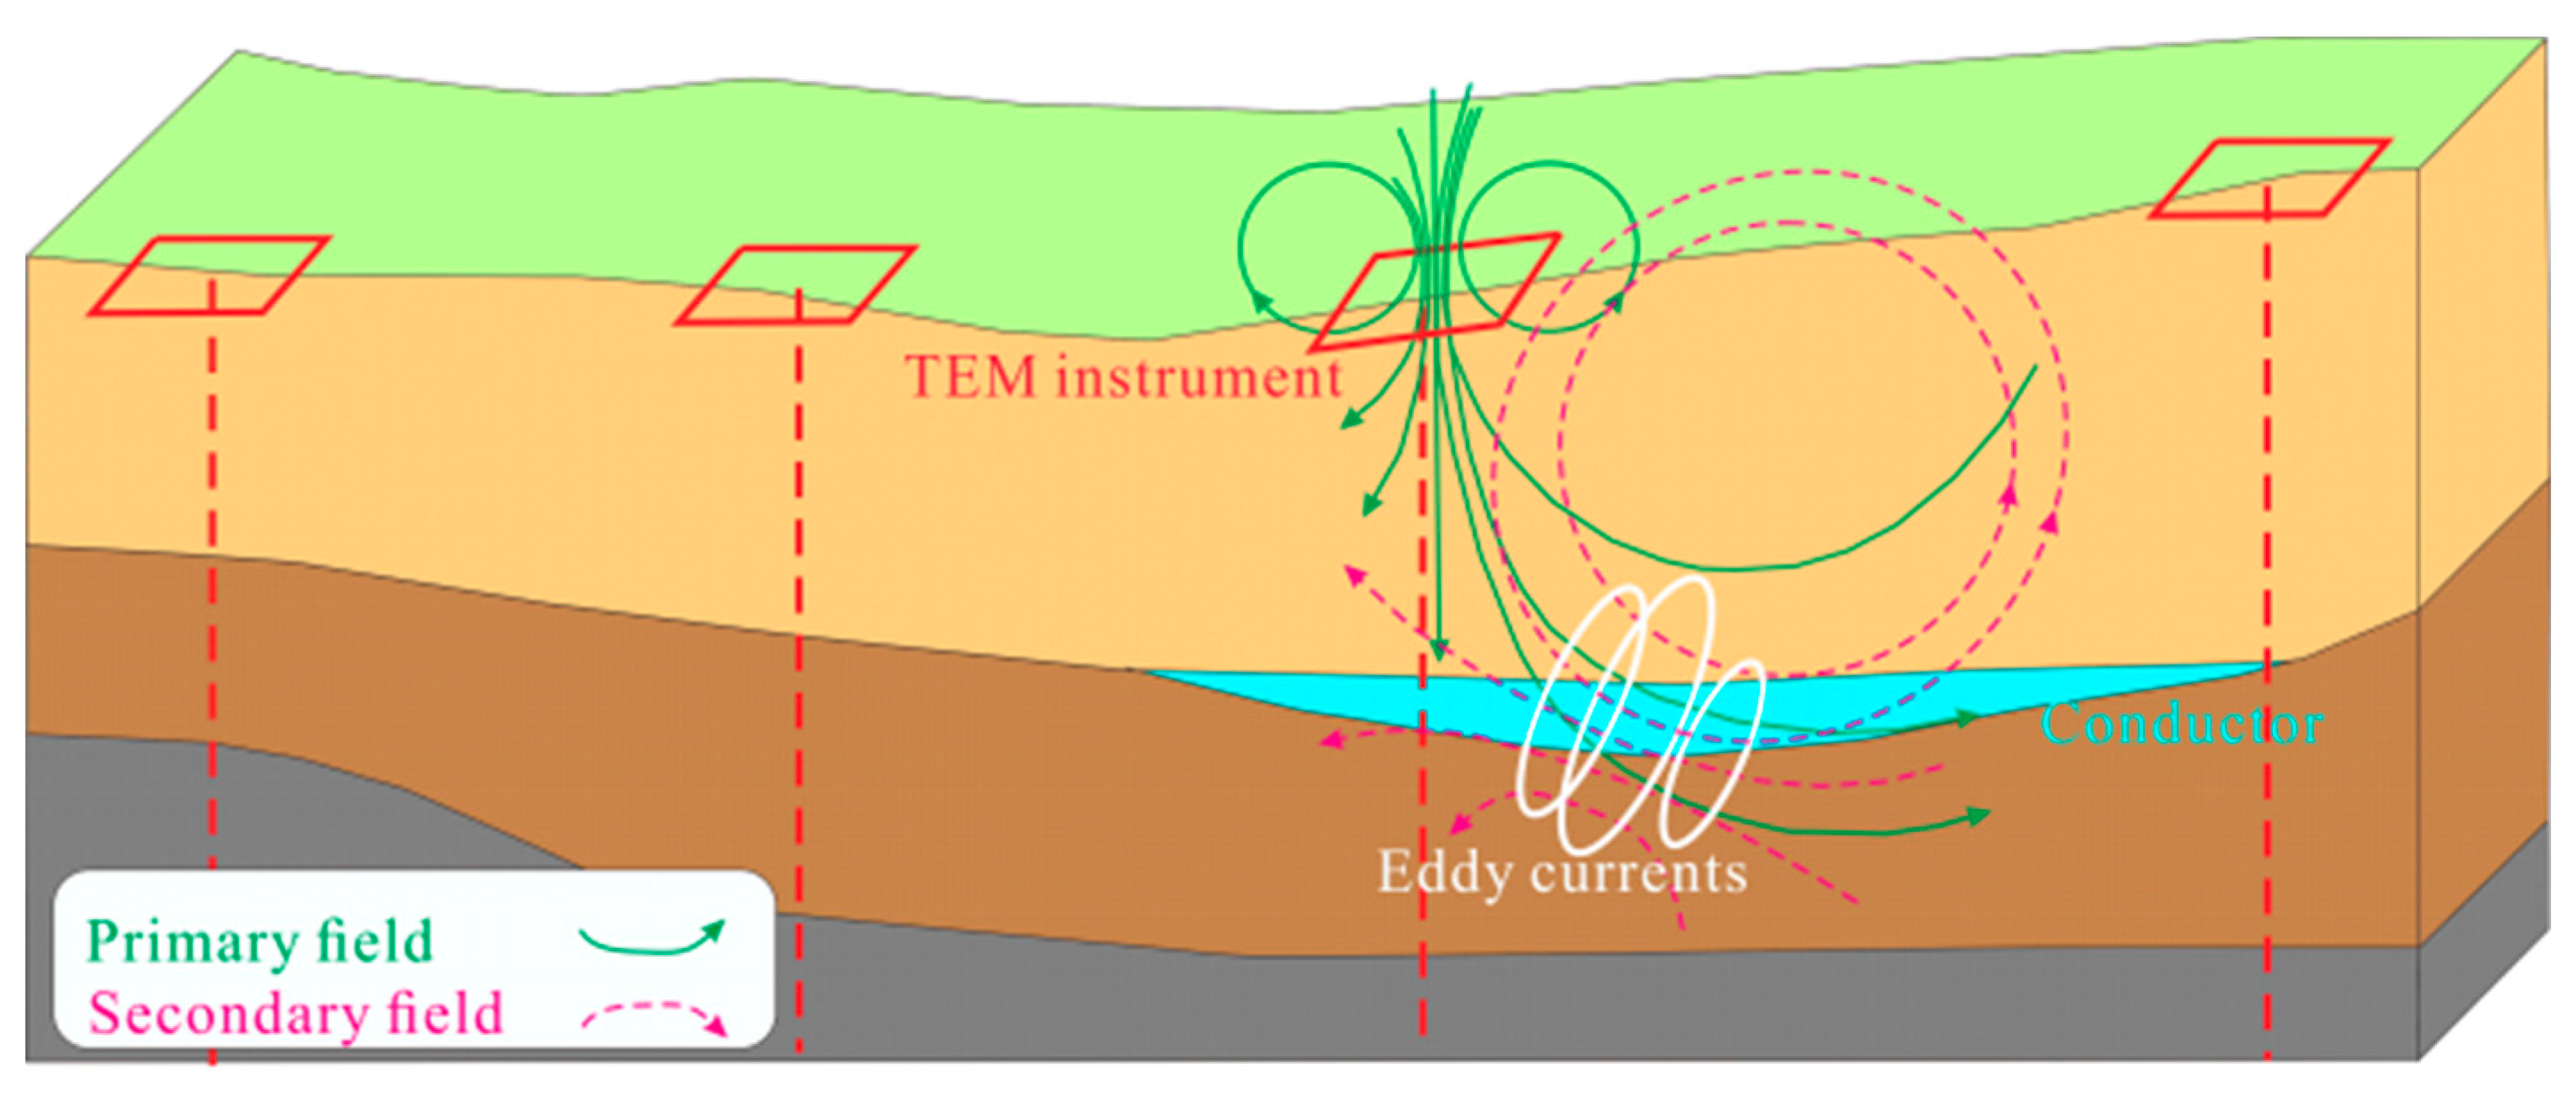
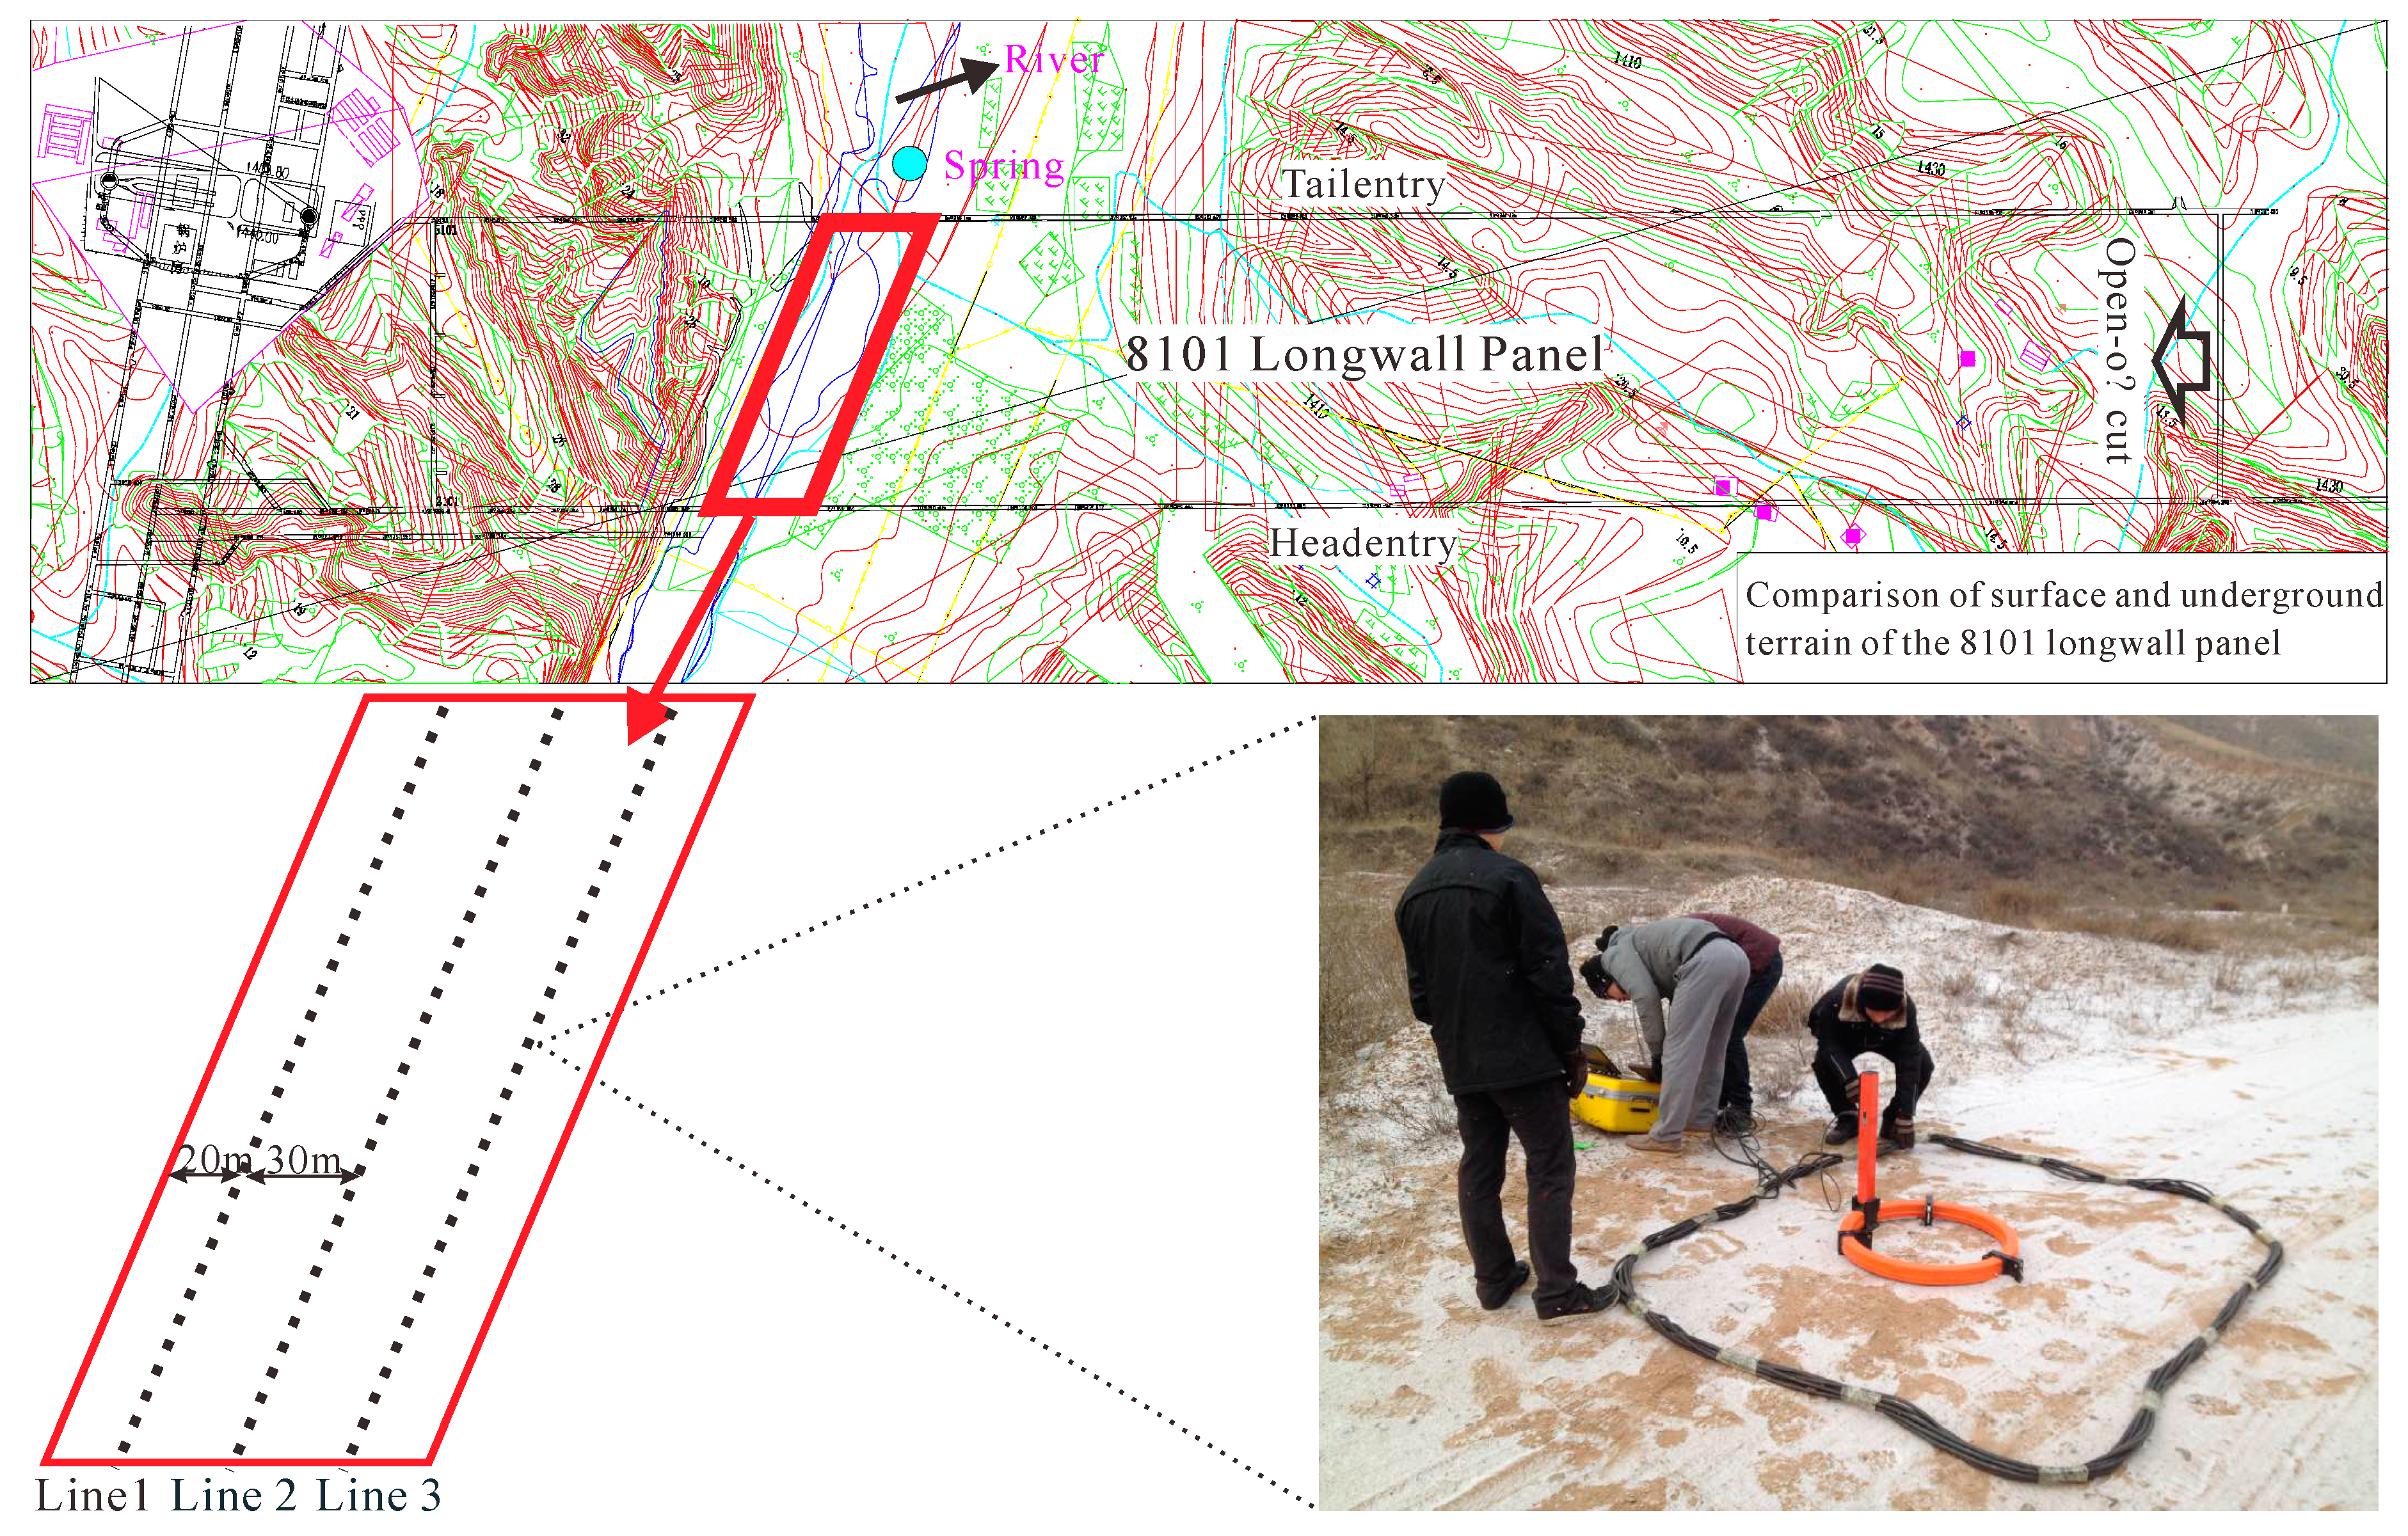
3.2. TEM Method and Field Setup
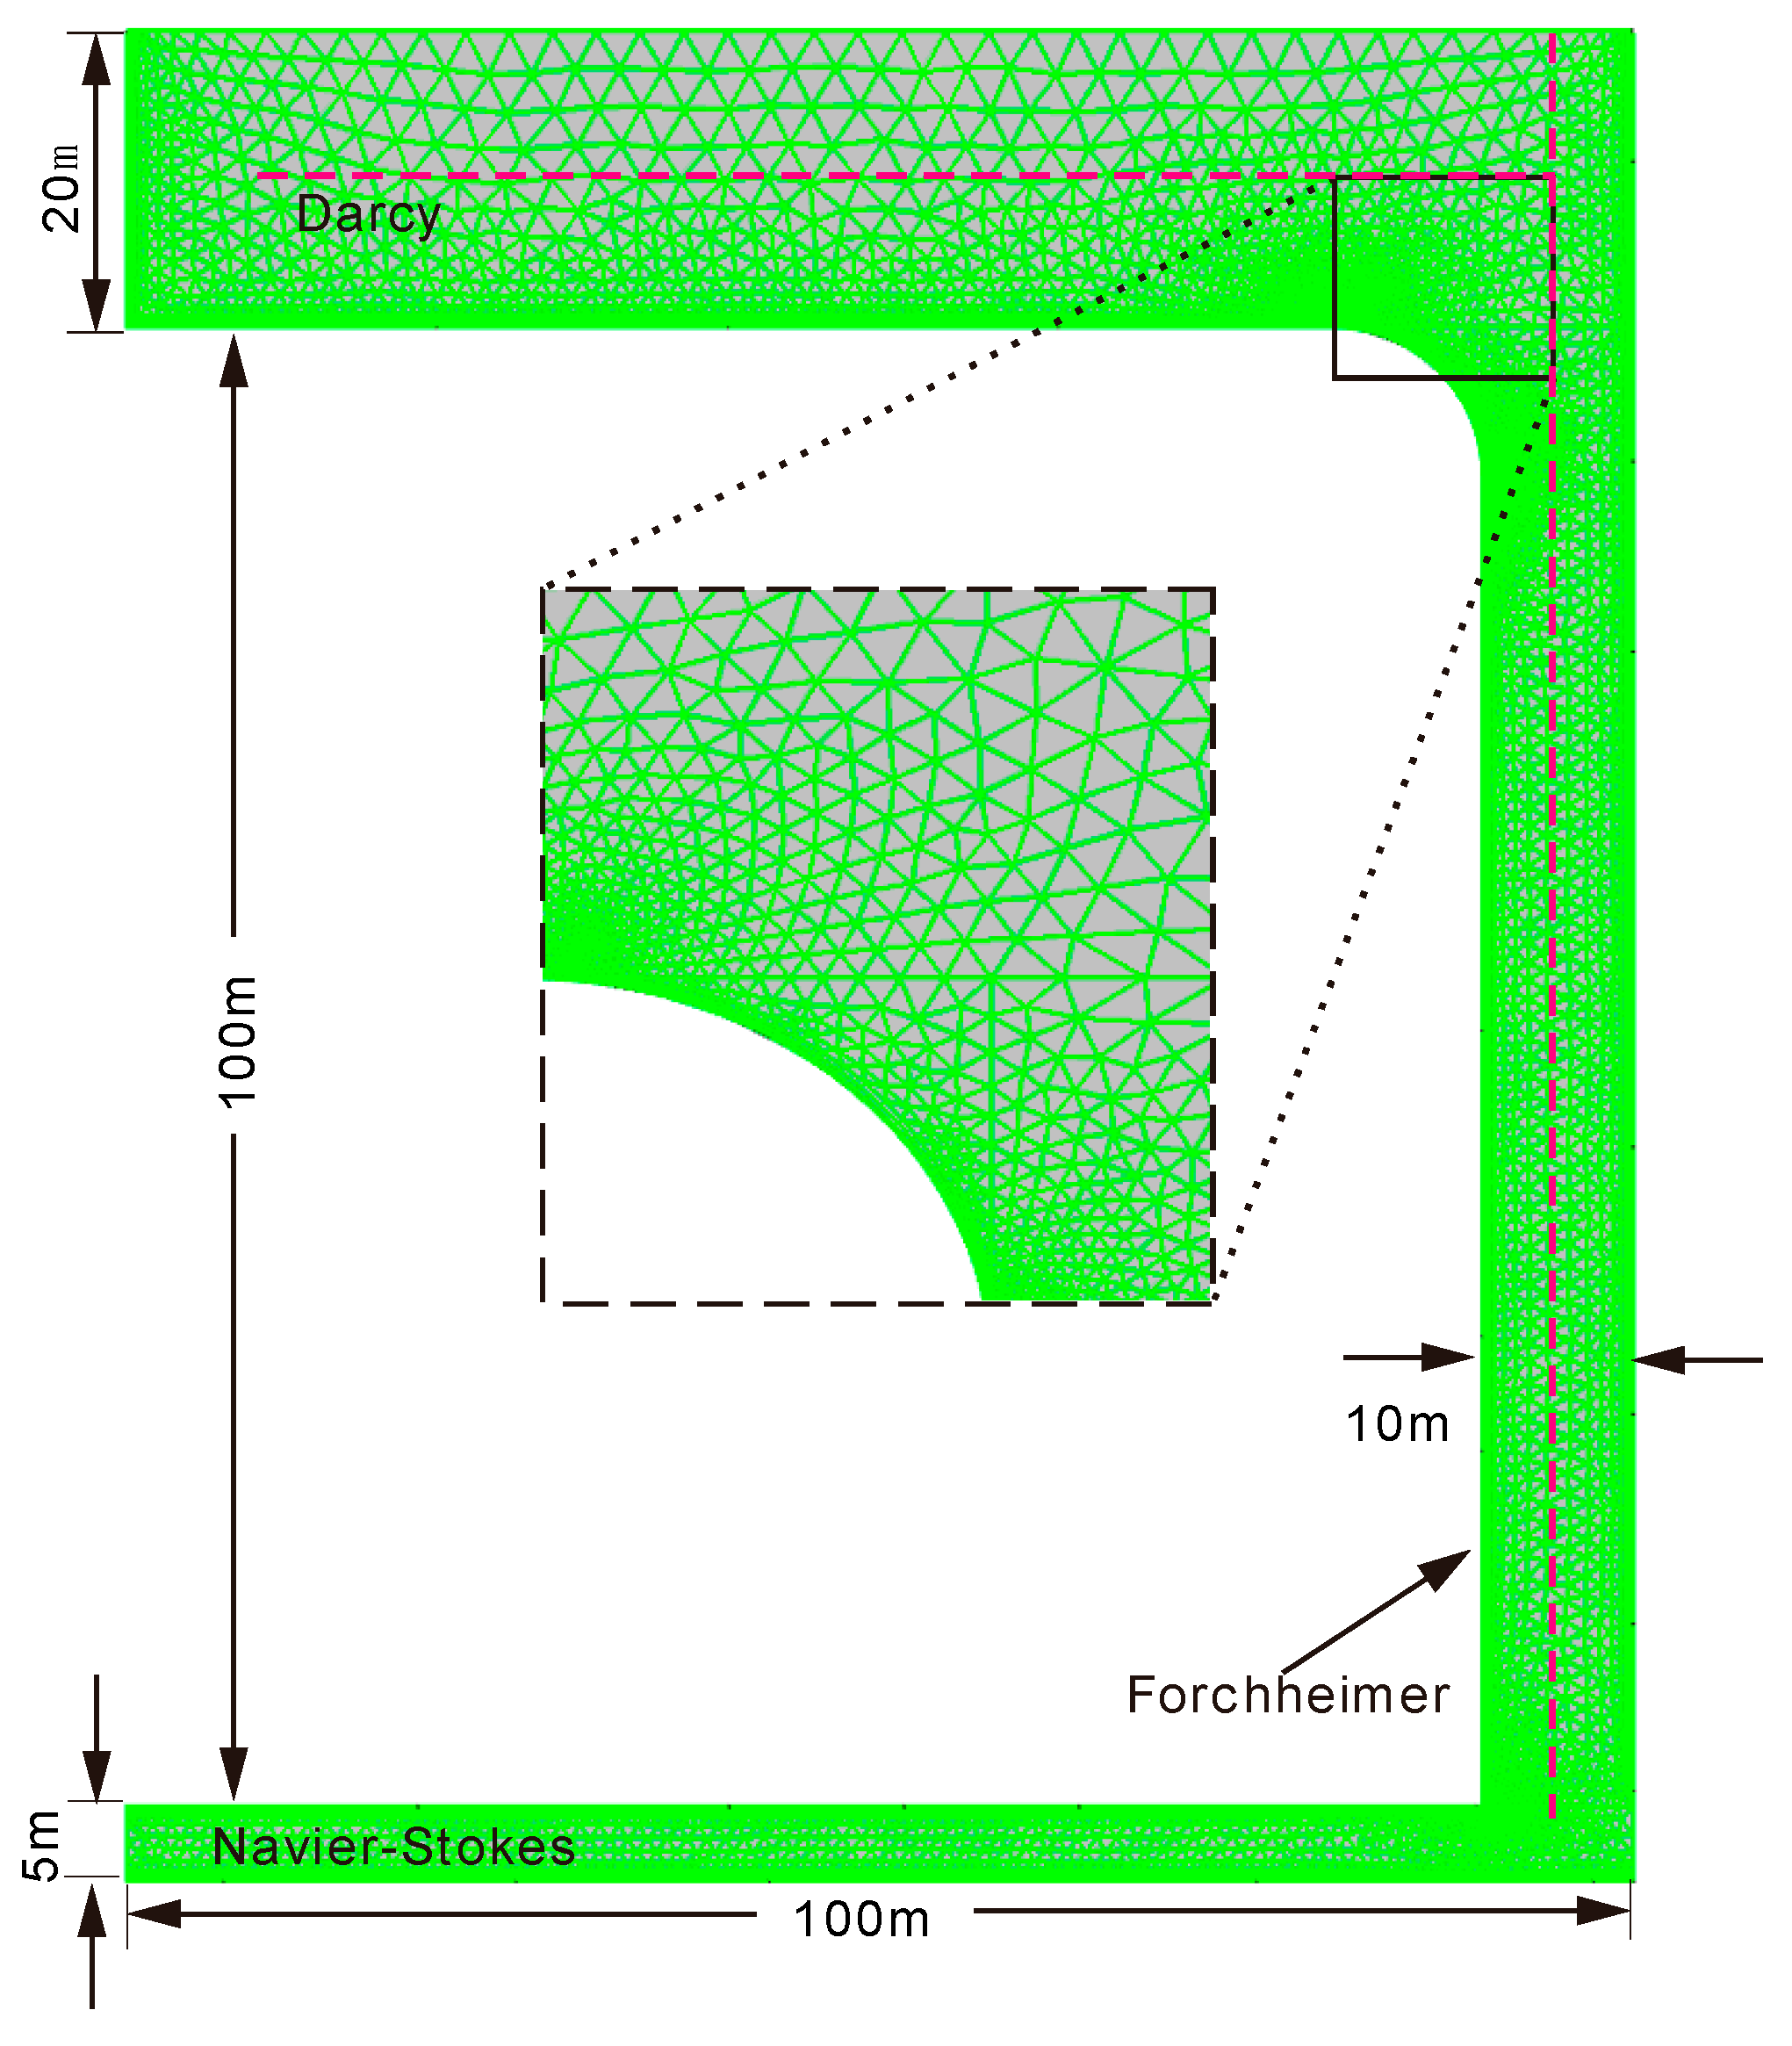
3.3. Curve Fitting and Numerical Modeling Method
4. Results and Discussion
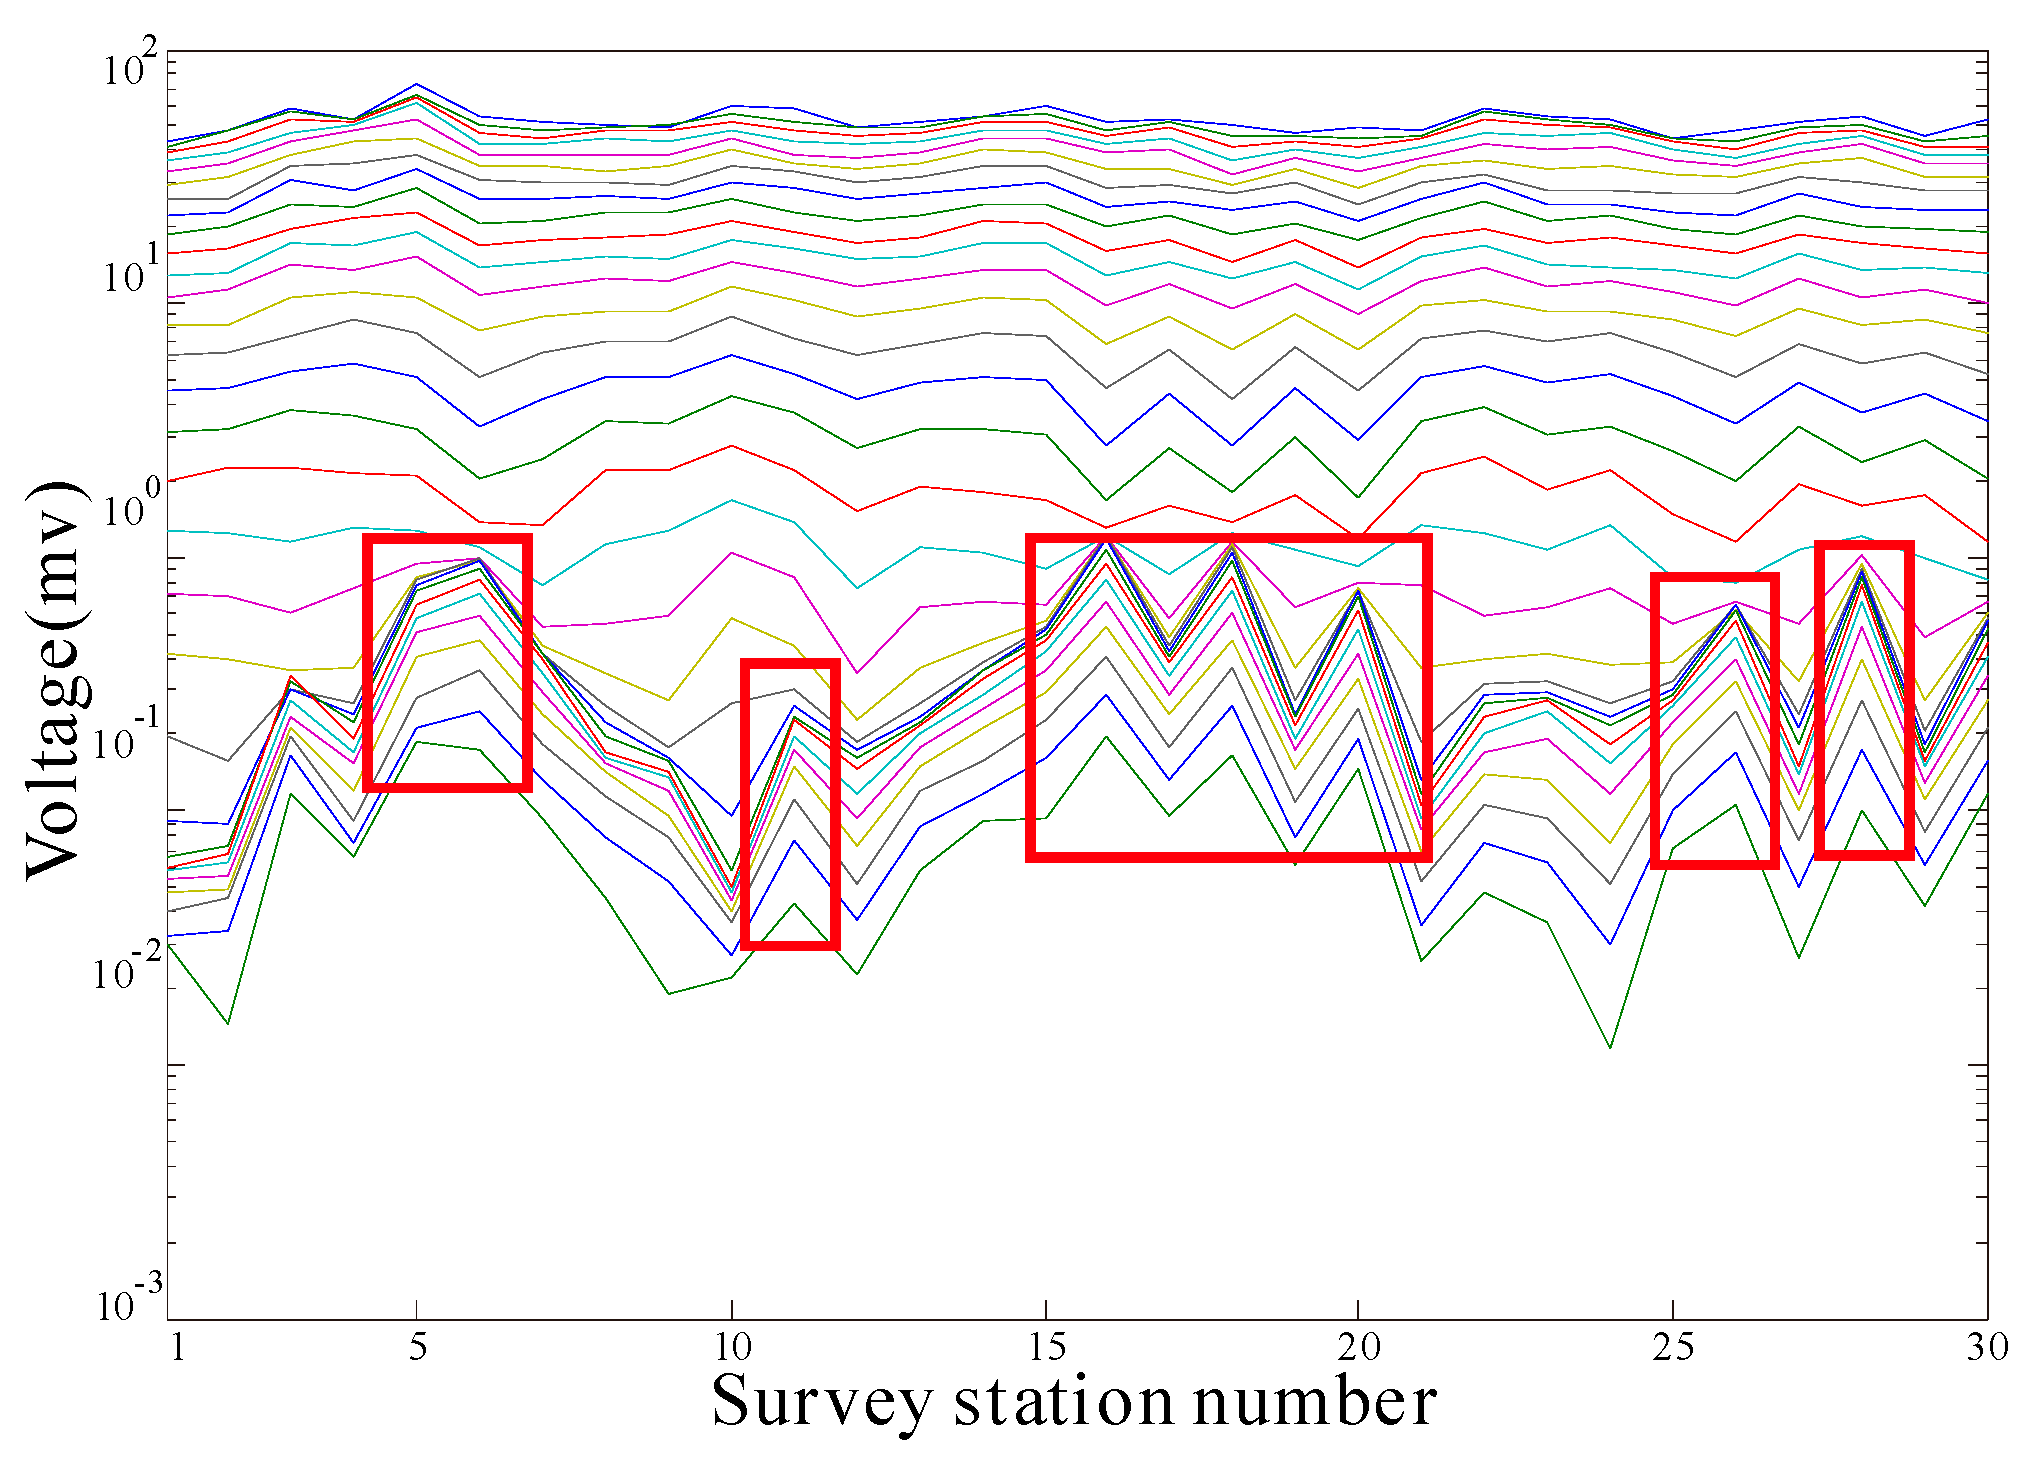
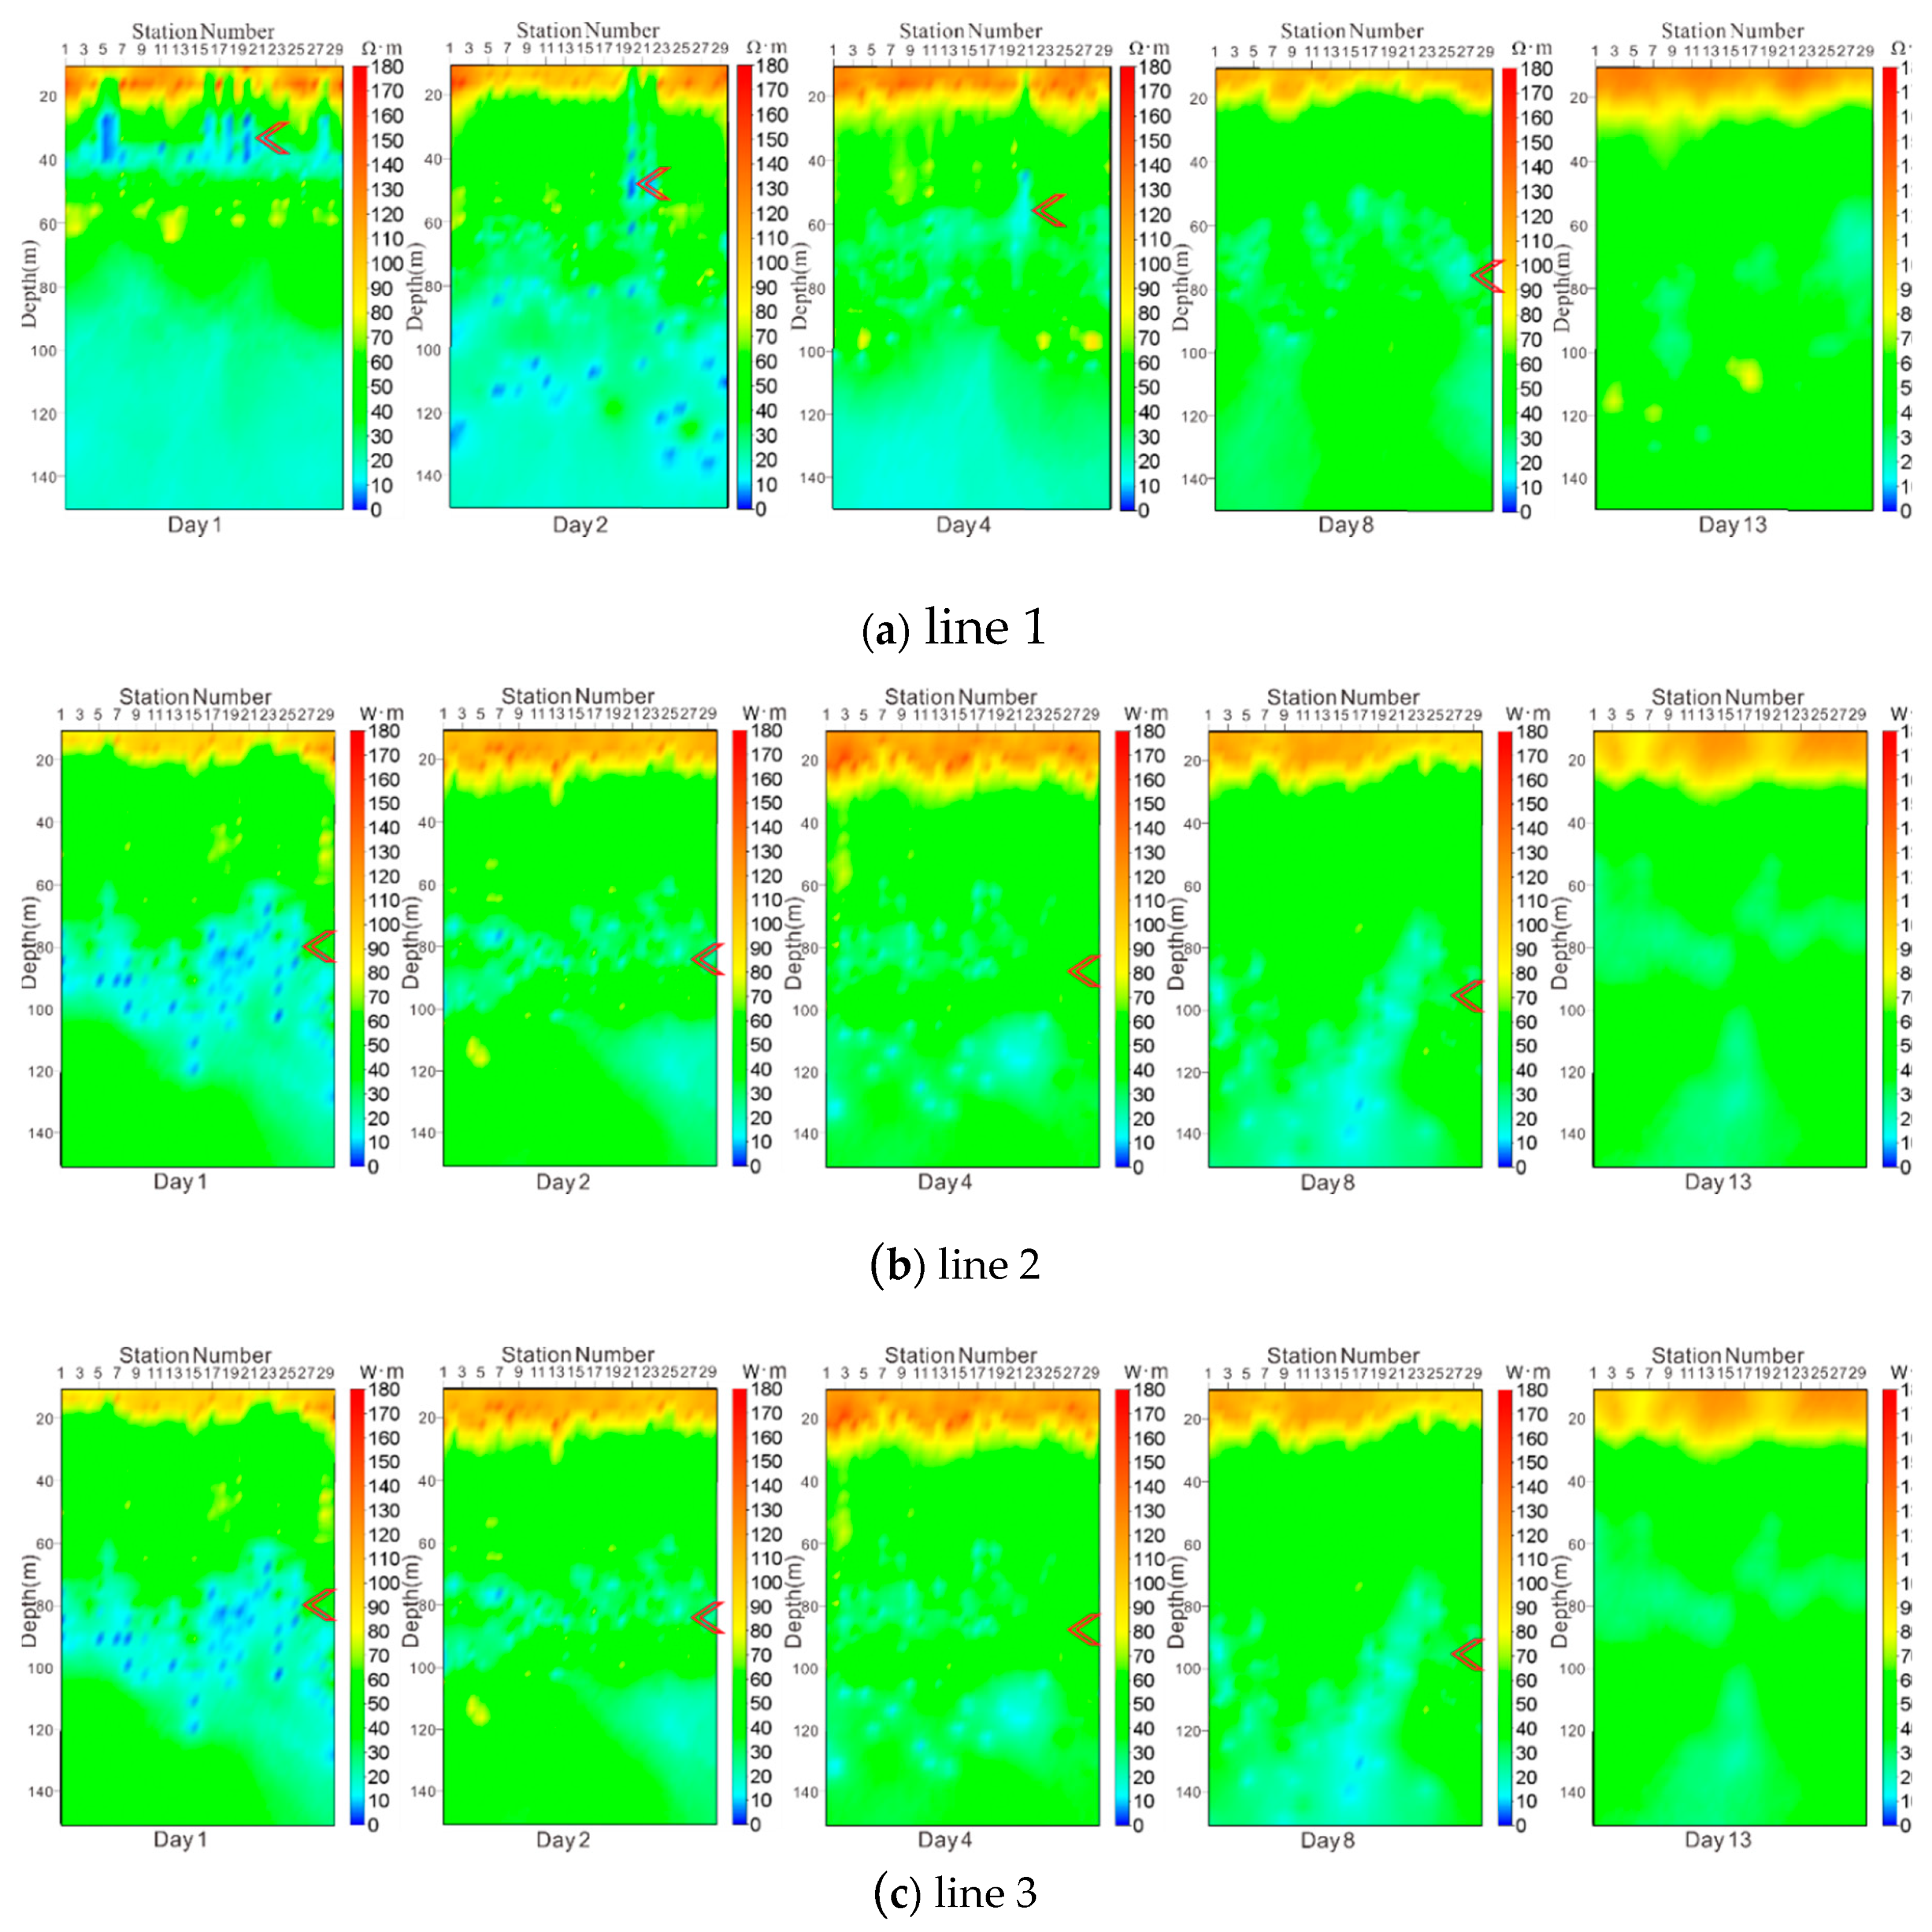
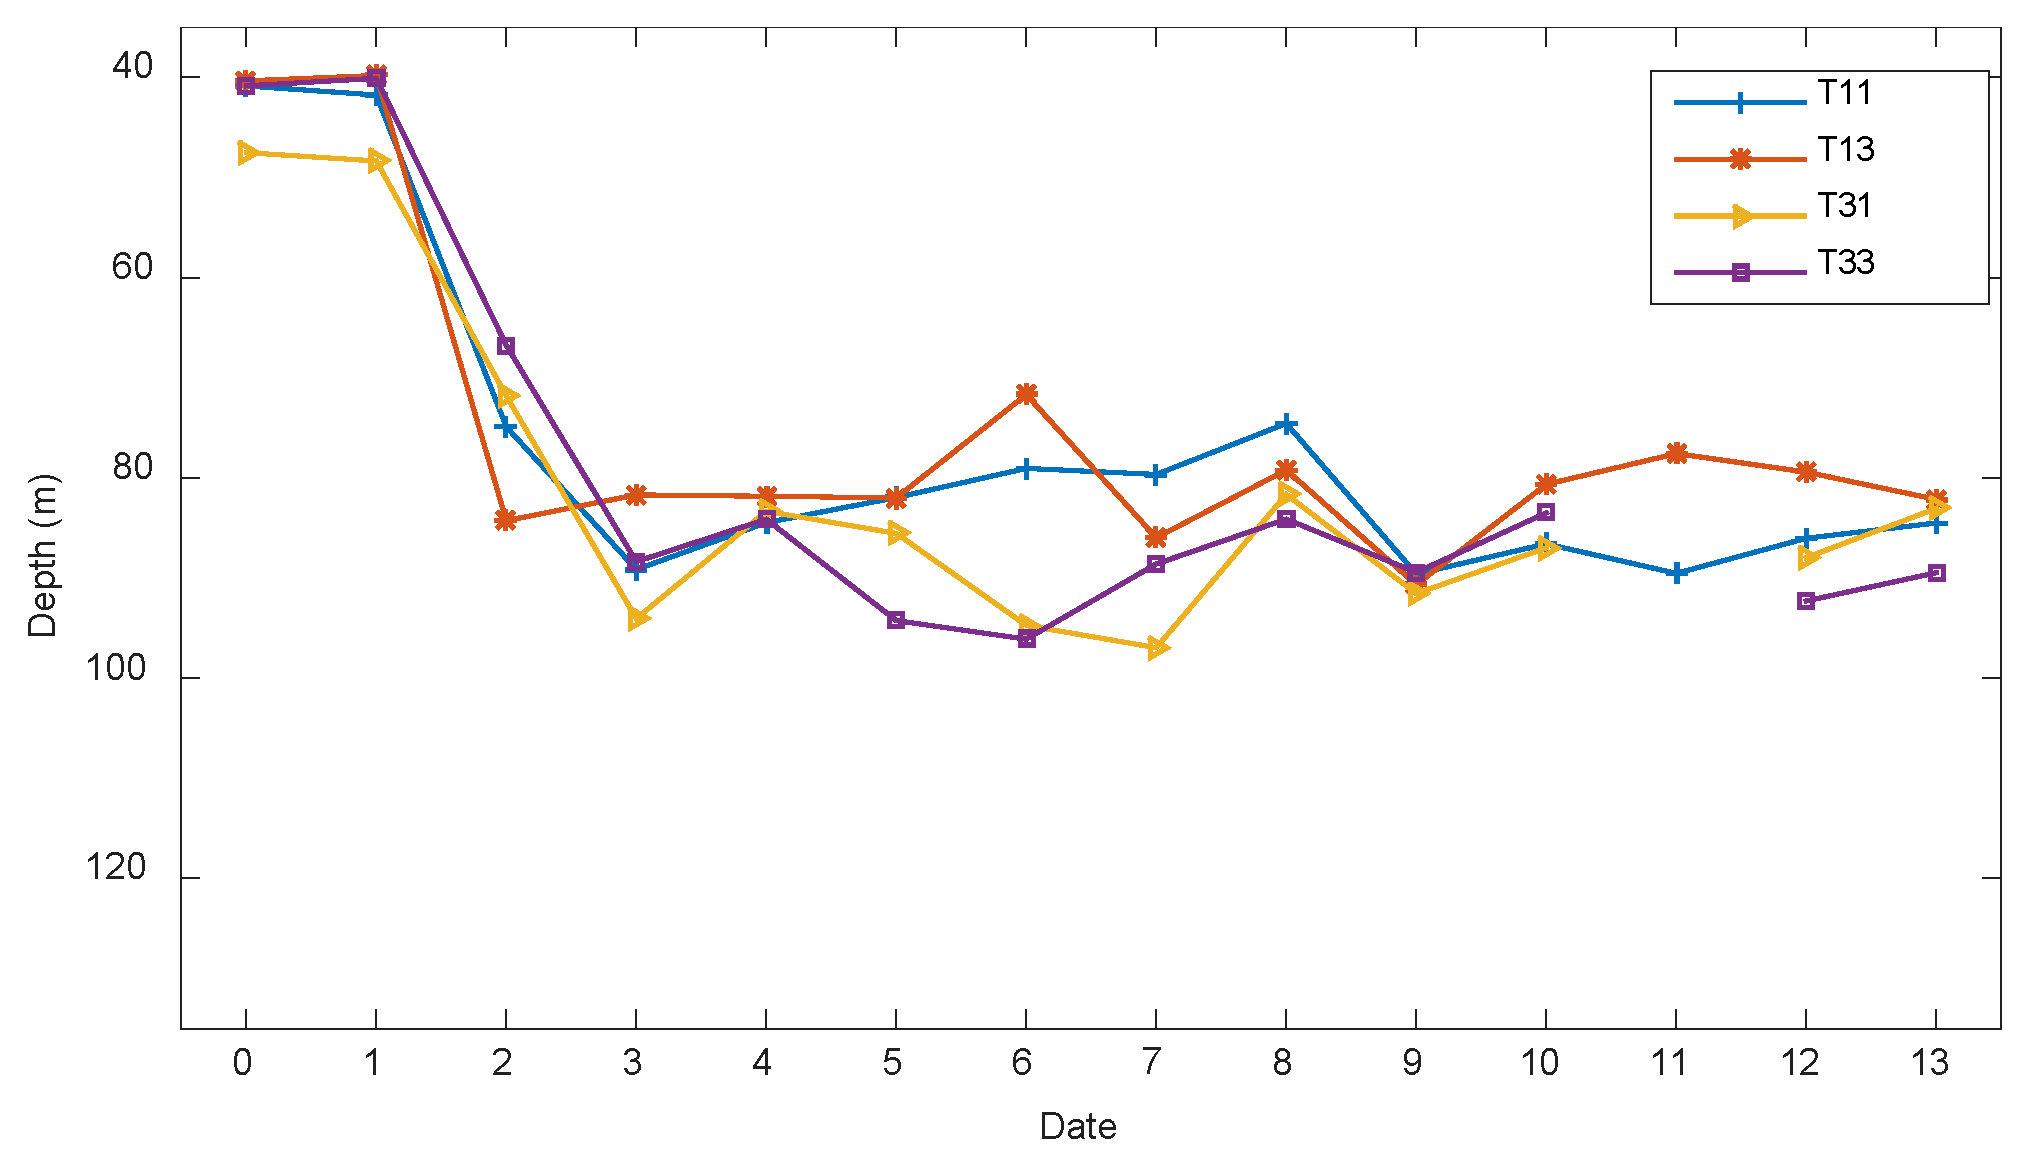
4.1. TEM Survey Results
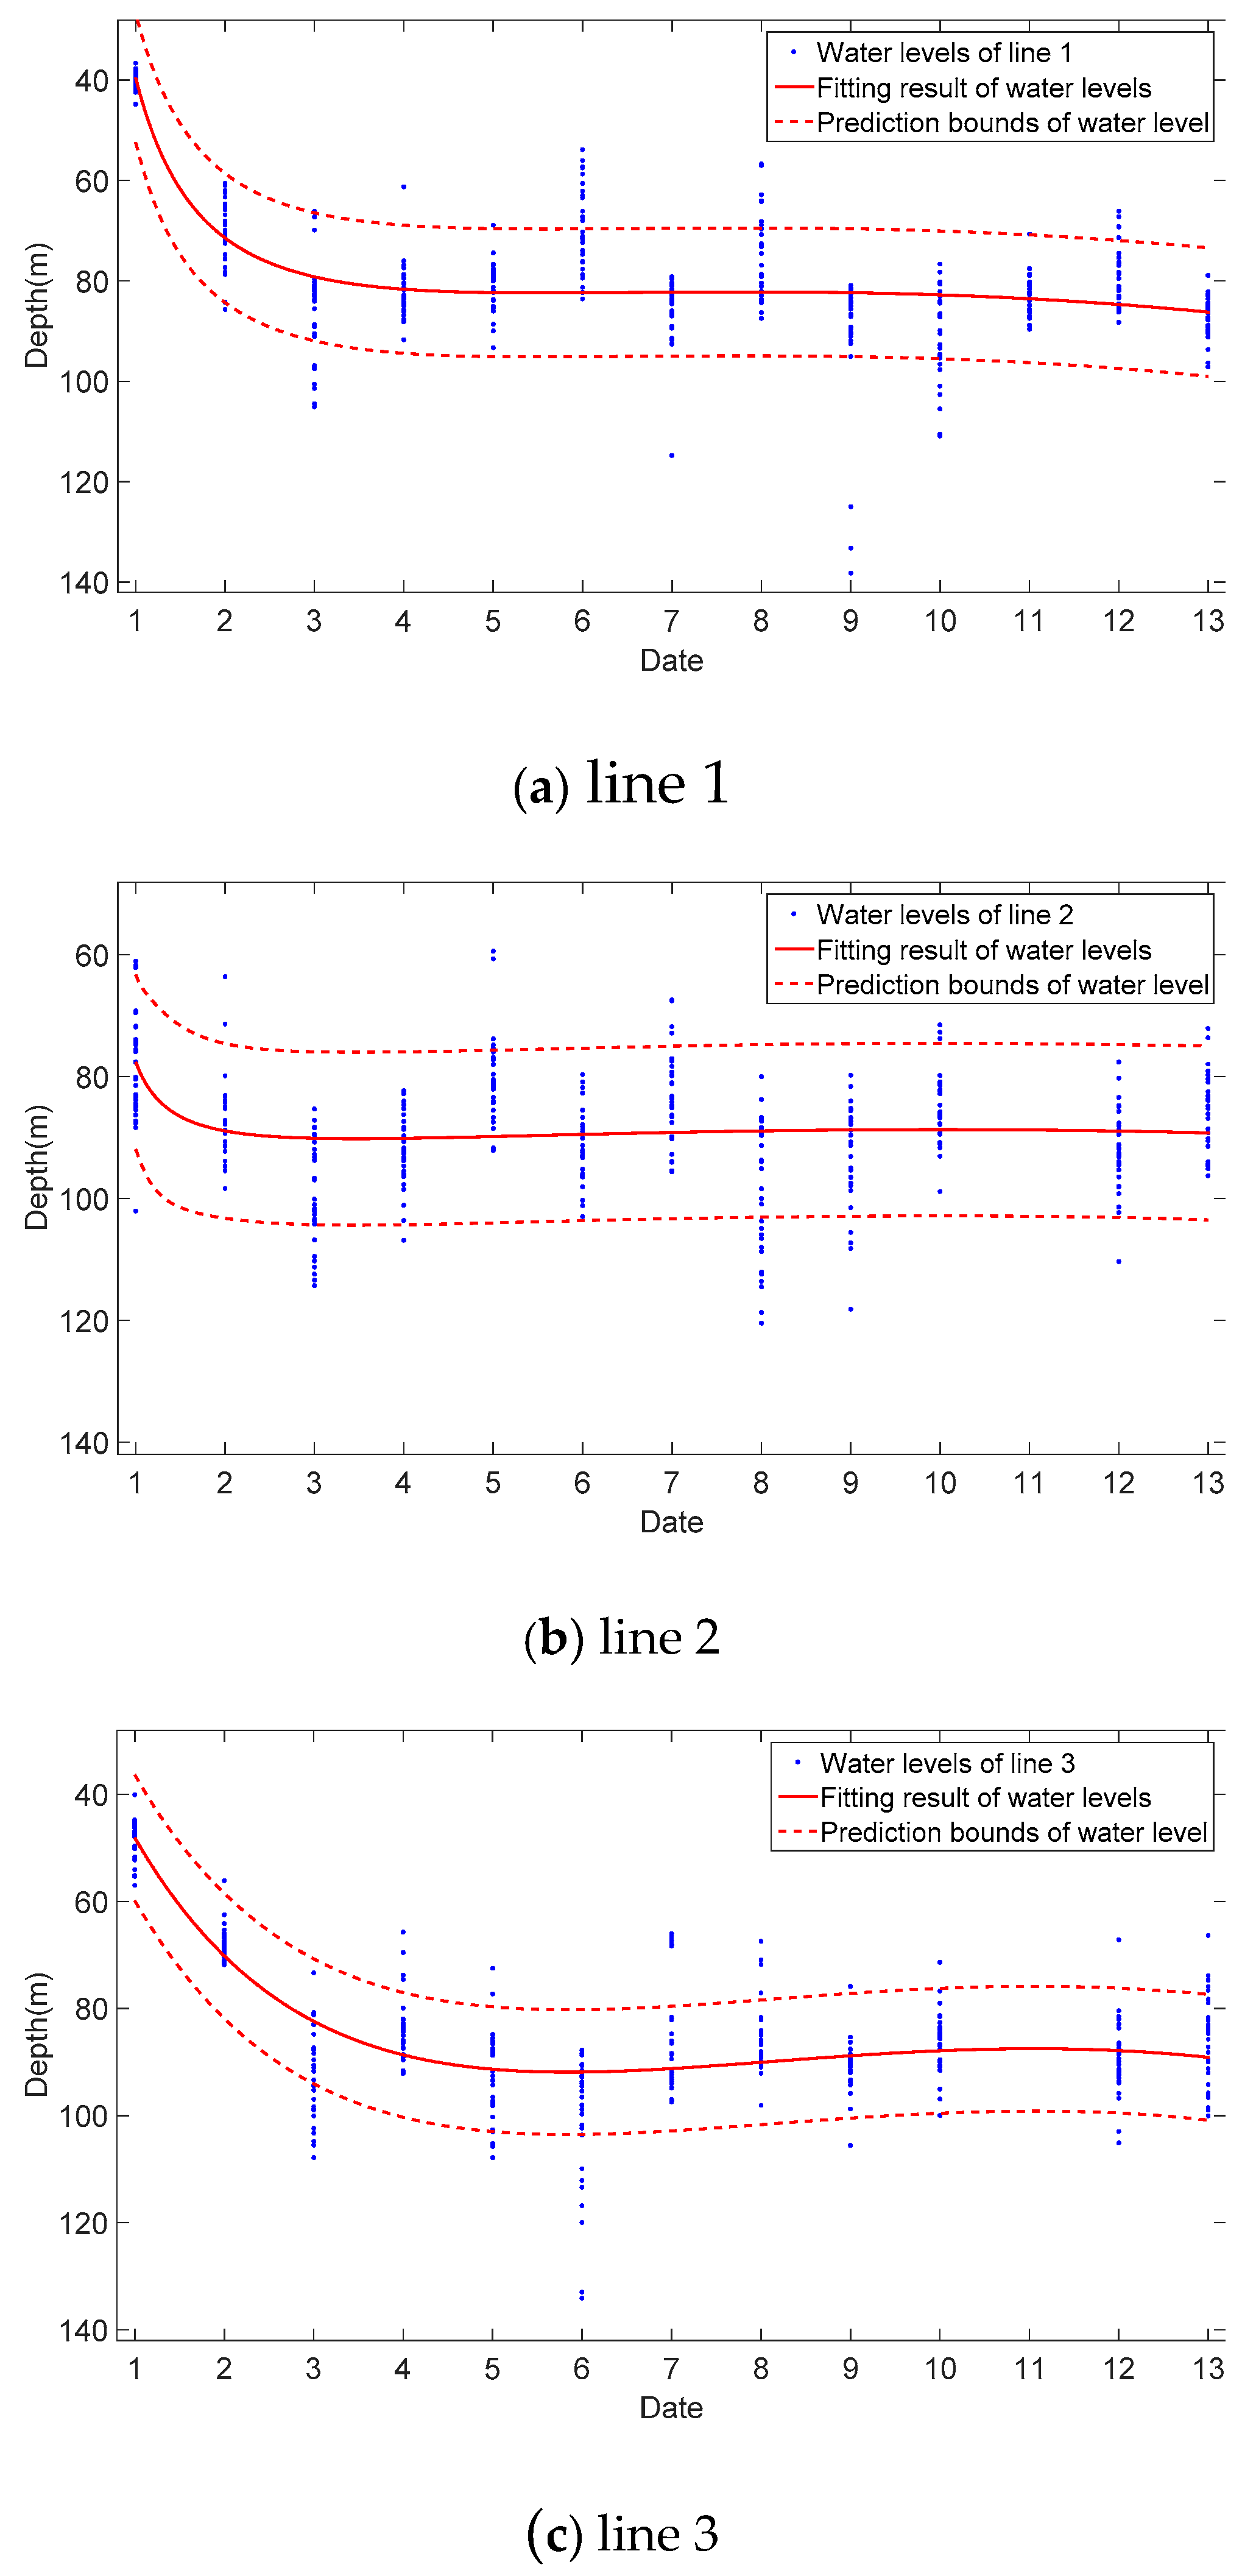
4.2. Curve Fitting of the Water Levels
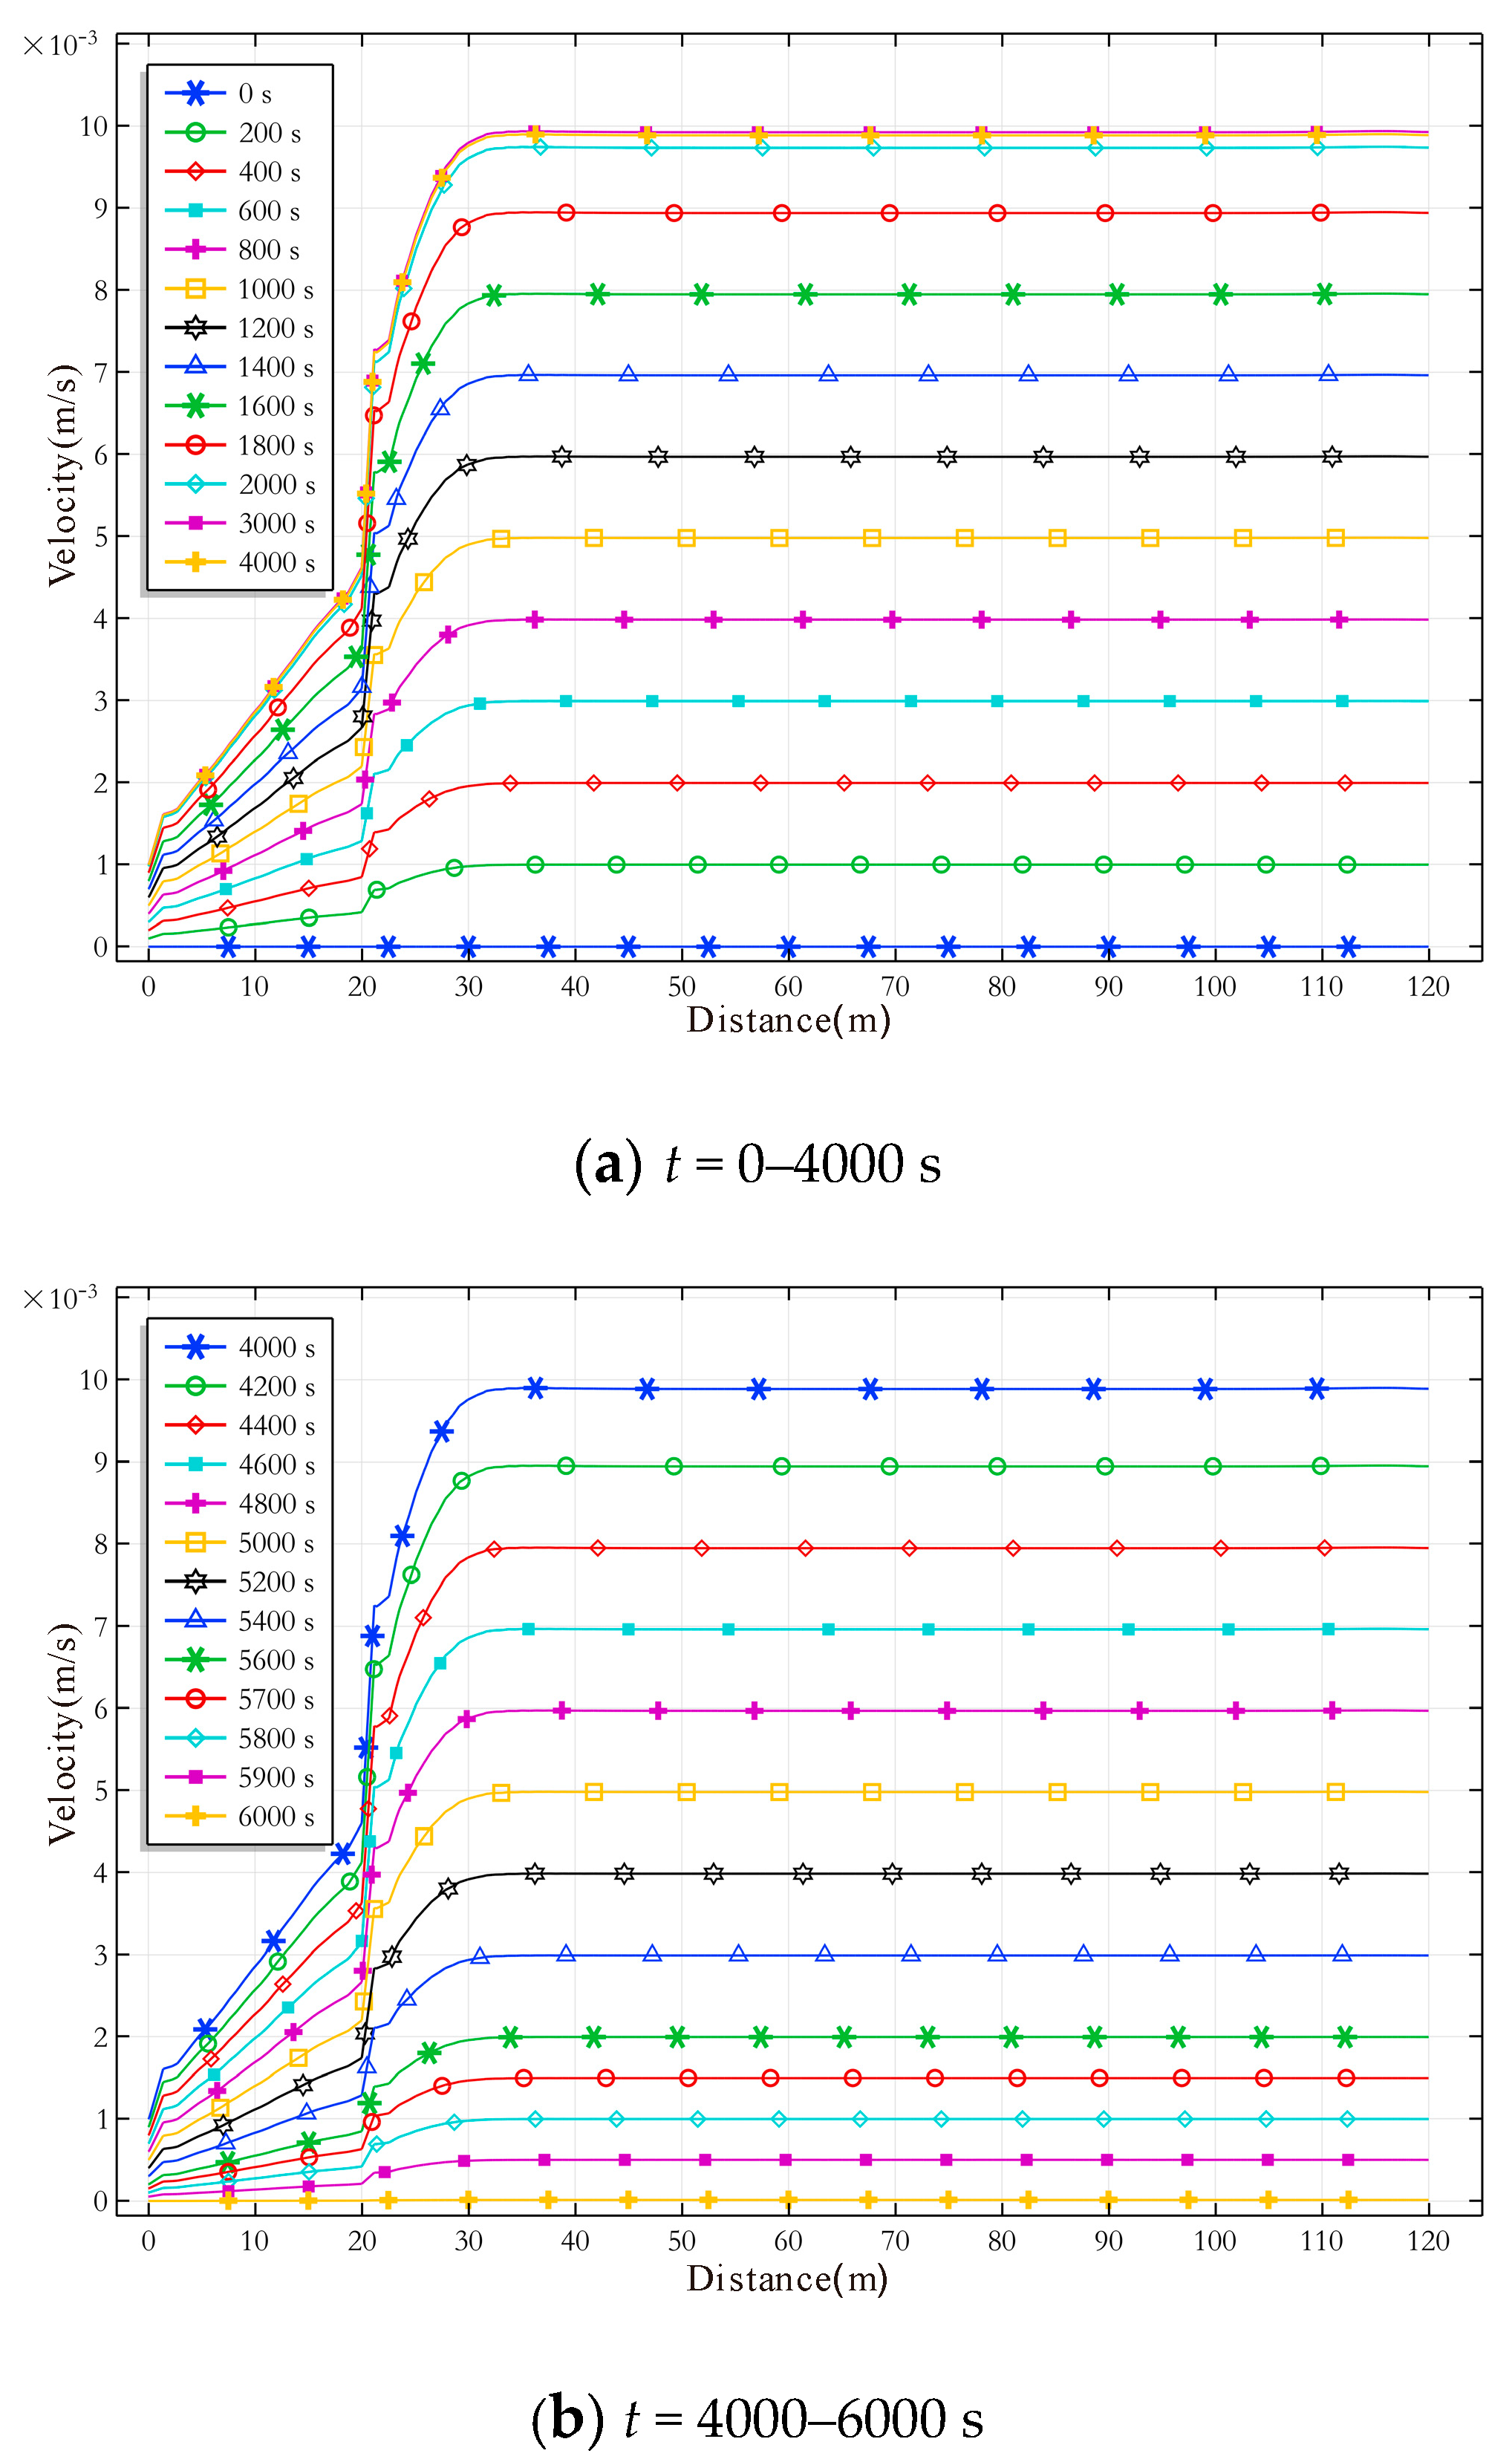
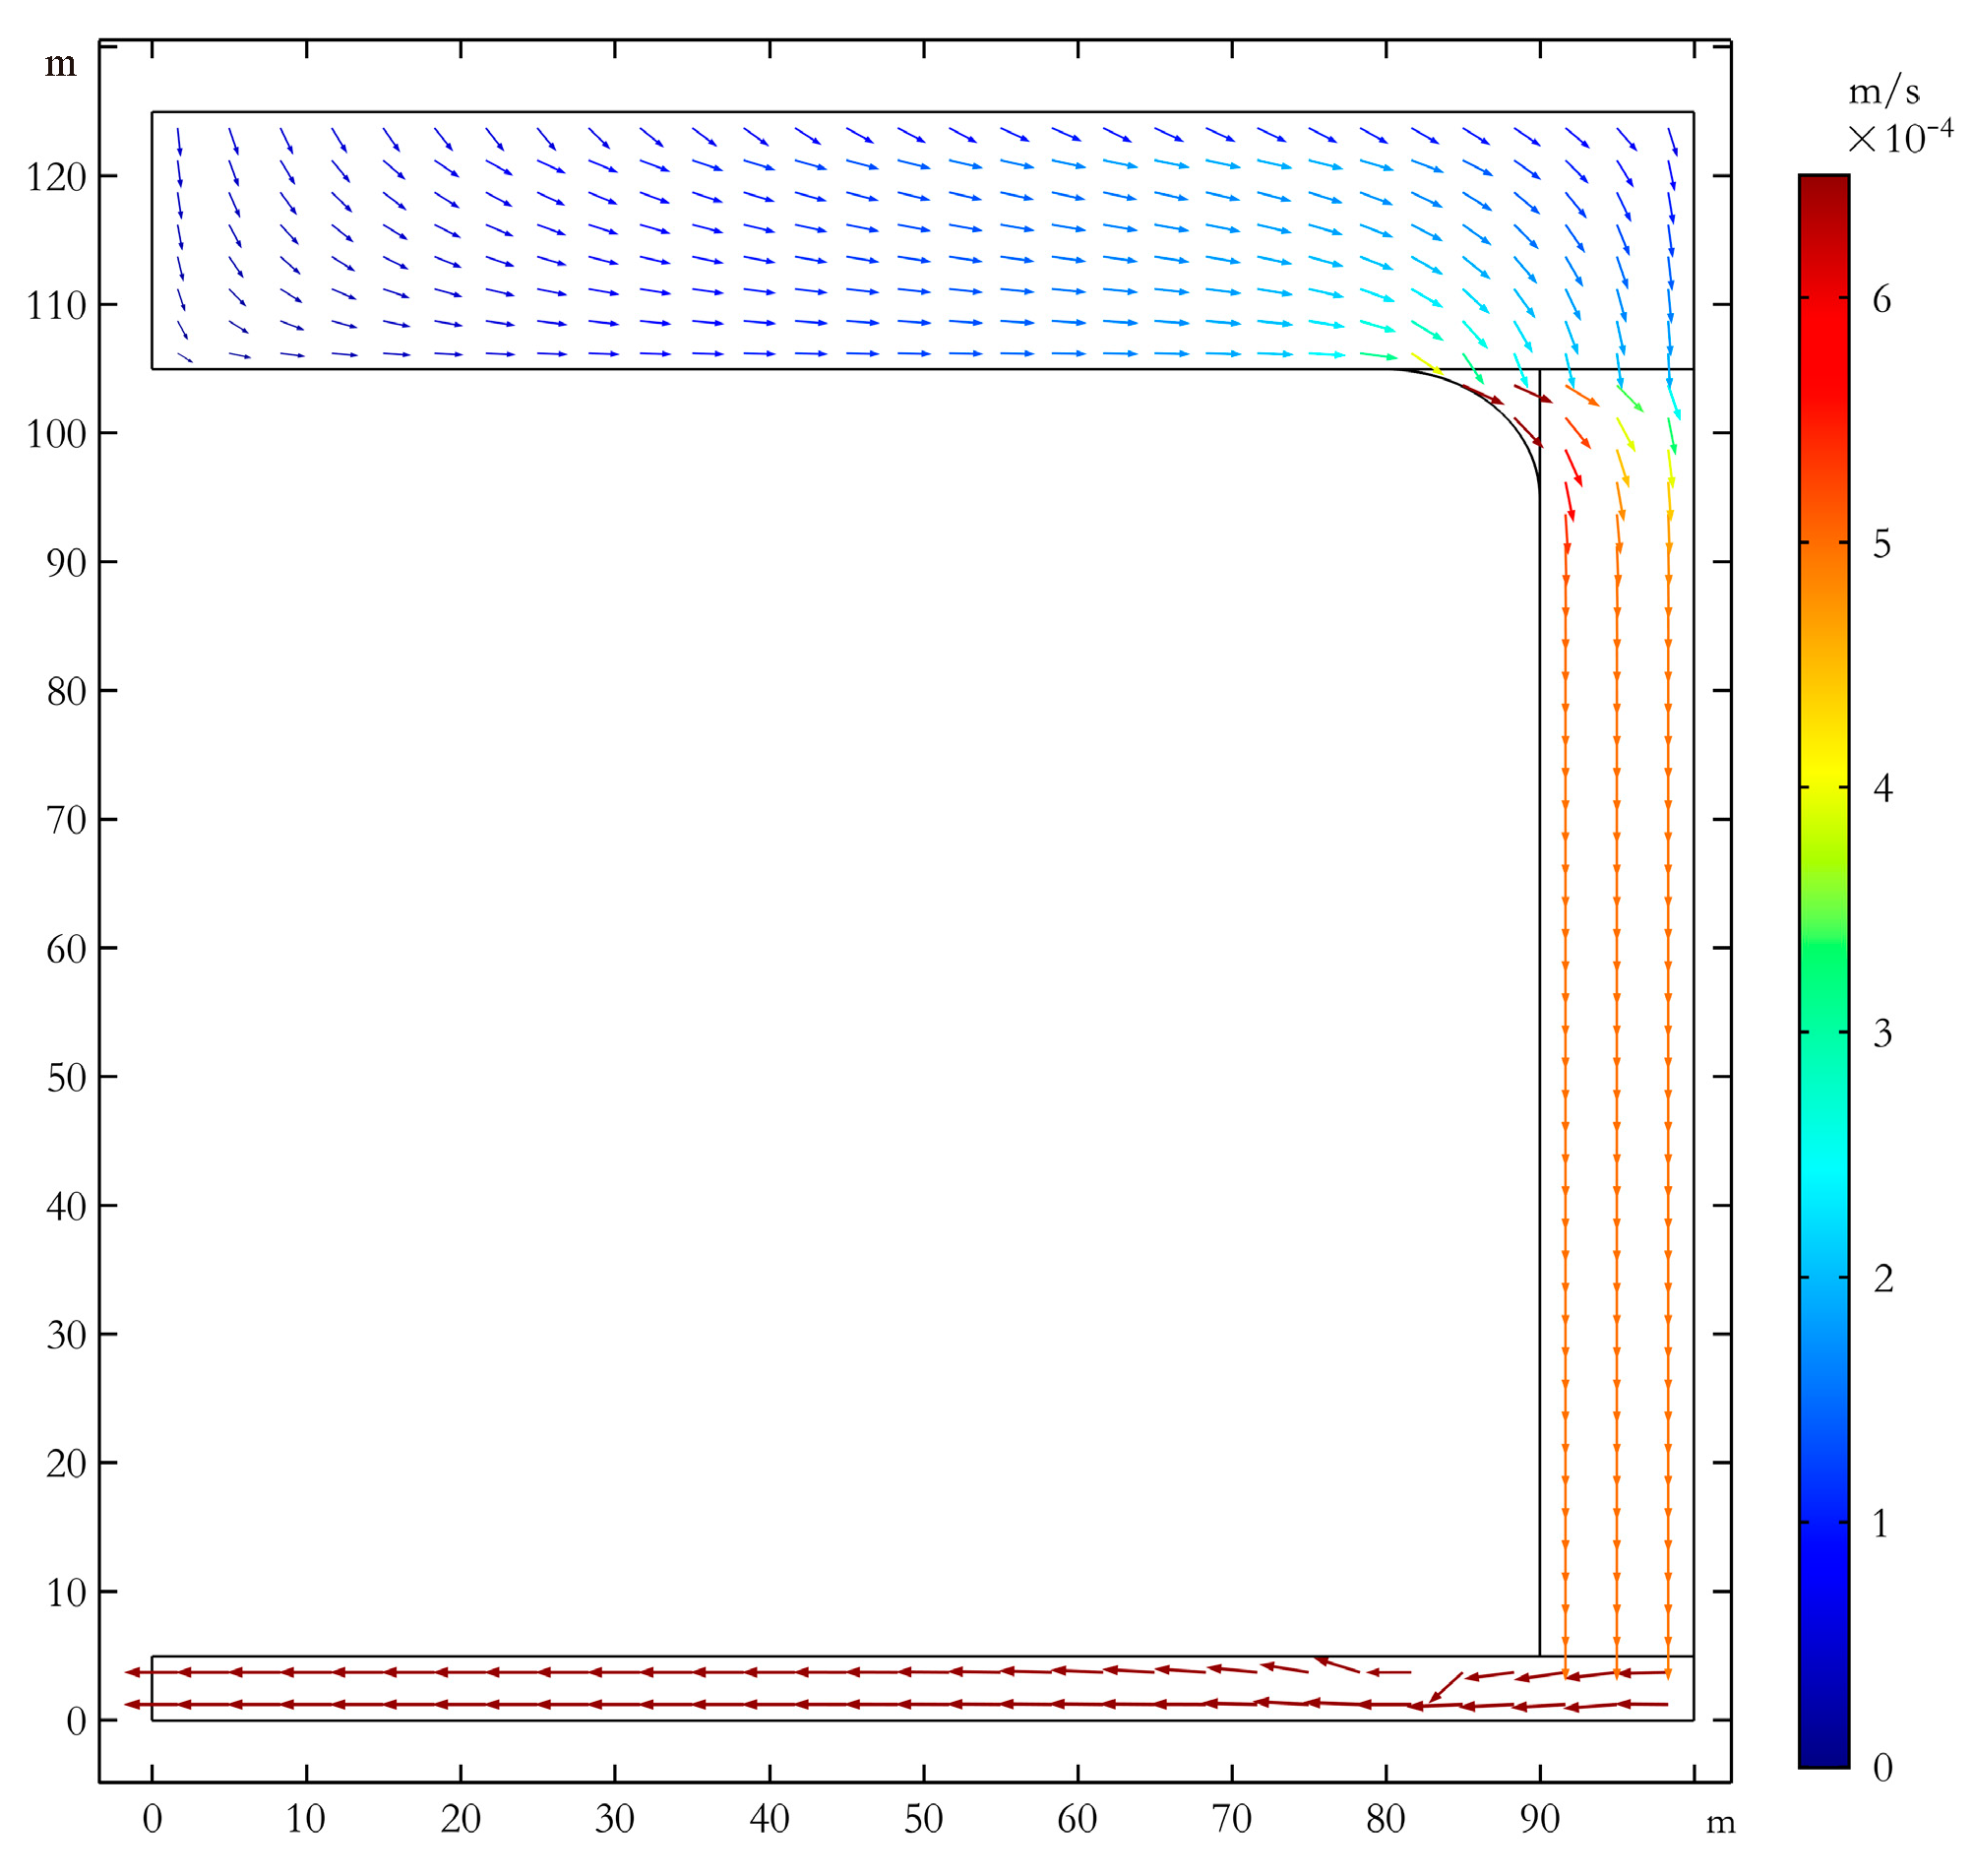
4.3. 2D Modeling Results
4.4. Discussion
5. Conclusions
Author Contributions
Funding
Conflicts of Interest
References
- Zhang, J.; Shen, B. Coal mining under aquifers in China: A case study. Int. J. Rock Mech. Min. Sci. 2004, 41, 629–639. [Google Scholar] [CrossRef]
- Liu, T. Coal Mine Ground Movement and Strata Failure, 1st ed.; China Coal Industry Publishing House: Beijing, China, 1981; pp. 165–214. [Google Scholar]
- Miao, X.; Cui, X.; Wang, J.; Xu, J. The height of fractured water-conducting zone in undermined rock strata. Eng. Geol. 2011, 120, 32–39. [Google Scholar] [CrossRef]
- Gao, B.; Liu, Y.; Pan, J.; Yuan, T. Detection and analysis of height of water flowing fractured zone in underwater mining. Chin. J. Rock Mech. Eng. 2014, 33, 3384–3390. [Google Scholar] [CrossRef]
- Yao, B.; Bai, H.; Zhang, B. Numerical simulation on the risk of roof water inrush in Wuyang Coal Mine. Int. J. Min. Sci. Technol. 2012, 22, 273–277. [Google Scholar] [CrossRef]
- Zhu, H.; Yi, C.; Jiang, Y.; Xie, H.; Yang, M. Effect of fractures cross connection on fluid flow characteristics of mining-induced rock. J. China Univ. Min. Technol. 2015, 44, 24–28. [Google Scholar] [CrossRef]
- Yu, B.; Chen, Z.; Yu, L. Water-resisting ability of cemented broken rocks. Int. J. Min. Sci. Technol. 2016, 26, 449–454. [Google Scholar] [CrossRef]
- Li, J.; Xu, Y. Mechanical model of the collapse column water inrush prevention considering the confined water seepage and its application. J. China Univ. Min. Technol. 2016, 45, 217–224. [Google Scholar] [CrossRef]
- Wang, B.; Liu, S.; Yang, Z.; Wang, Z.; Huang, L. Fine analysis on advanced detection of transient electromagnetic method. Int. J. Min. Sci. Technol. 2012, 22, 669–673. [Google Scholar] [CrossRef]
- Xue, G.Q.; Cheng, J.L.; Zhou, N.N.; Chen, W.Y.; Li, H. Detection and monitoring of water-filled voids using transient electromagnetic method: A case study in Shanxi, China. Environ. Earth. Sci. 2013, 70, 2263–2270. [Google Scholar] [CrossRef]
- Bauer-Gottwein, P.; Gondwe, B.N.; Christiansen, L.; Herckenrath, D.; Kgotlhang, L.; Zimmermann, S. Hydrogeophysical exploration of three-dimensional salinity anomalies with the time-domain electromagnetic method (TDEM). J. Hydrol. 2010, 380, 318–329. [Google Scholar] [CrossRef]
- Trabelsi, F.; Ben Mammou, A.; Tarhouni, J.; Piga, C.; Ranieri, G. Delineation of saltwater intrusion zones using the time domain electromagnetic method: The Nabeul-Hammamet coastal aquifer case study (NE Tunisia). Hydrol. Process. 2013, 27, 2004–2020. [Google Scholar] [CrossRef]
- Yu, C.T.; Liu, X.Y.; Liu, J.S.; Li, E.G.; Yue, P.; Yan, S.B. Application of Transient Electromagnetic Method for Investigating the Water-Enriched Mined-Out Area. Appl. Sci. 2018, 8, 1800. [Google Scholar] [CrossRef]
- Danielsen, J.E.; Auken, E.; Jorgensen, F.; Sondergaard, V.; Sorensen, K.I. The application of the transient electromagnetic method in hydrogeophysical surveys. J. Appl. Geophys. 2003, 53, 181–198. [Google Scholar] [CrossRef]
- Sharma, S.P.; Baranwal, V.C. Delineation of groundwater-bearing fracture zones in a hard rock area integrating very low frequency electromagnetic and resistivity data. J. Appl. Geophys. 2005, 57, 155–166. [Google Scholar] [CrossRef]
- Simard, P.T.; Chesnaux, R.; Rouleau, A. Imaging Quaternary glacial deposits and basement topography using the transient electromagnetic method for modelling aquifer environments. J. Appl. Geophys. 2015, 119, 36–50. [Google Scholar] [CrossRef]
- Rödder, A.; Tezkan, B. A 3D resistivity model derived from the transient electromagnetic data observed on the Araba fault, Jordan. J. Appl. Geophys. 2013, 88, 42–51. [Google Scholar] [CrossRef]
- Peng, S.S.; Chiang, H.S. Longwall Mining; Wiley: New York, NY, USA, 1984; pp. 576–642. ISBN 978–0471868811. [Google Scholar]
- Feng, X.W.; Zhang, N.; Chen, X.T.; Gong, L.Y.; Lv, C.X.; Guo, Y. Exploitation Contradictions Concerning Multi-Energy Resources among Coal, Gas, Oil, and Uranium: A Case Study in the Ordos Basin (Western North China Craton and Southern Side of Yinshan Mountains). Energies 2016, 9, 119. [Google Scholar] [CrossRef]
- Palchik, V. Formation of fractured zones in overburden due to longwall mining. Environ. Geol. 2003, 44, 28–38. [Google Scholar] [CrossRef]
- Qian, M.G.; Shi, P.W.; Xu, J.L. Mining Pressure and Strata Control; China University of Mining & Technology: Xuzhou, China, 2010; pp. 176–196. ISBN 9787564607968. [Google Scholar]
- State Bureau of Coal Industry. Regulations of Buildings, Water, Rail Way and Main Well Lane Leaving Coal Pillar and Press Coal Mining; China Coal Industry Publishing House: Beijing, China, 2000; pp. 225–233. ISBN 9787502016623. [Google Scholar]
- Zhang, D.; Zhang, W.; Ma, L.; Wang, X.; Fan, G. Developments and prospects of detecting mining-induced fractures in overlying strata by radon. J. China Univ. Min. Technol. 2016, 45, 1082–1097. [Google Scholar] [CrossRef]
- Liu, C.; Xue, J.; Yu, G.; Cheng, X. Fractal characterization for the mining crack evolution process of overlying strata based on microseismic monitoring technology. Int. J. Min. Sci. Technol. 2016, 26, 295–299. [Google Scholar] [CrossRef]
- Wei, J.; Wu, F.; Yin, H. Formation and height of the interconnected fractures zone after extraction of thick coal seams with weak overburden in western China. Mine Water Environ. 2017, 36, 59–66. [Google Scholar] [CrossRef]
- Yang, H.Y.; Deng, J.Z.; Zhang, H.; Yue, J.H. Research on full-space apparent resistivity interpretation technique in mine transient electromagnetic method. Chin. J. Geophys. 2010, 53, 651–656. [Google Scholar] [CrossRef]
- Spies, B.R. Depth of investigation in electromagnetic sounding methods. Geophysics 1989, 54, 872–888. [Google Scholar] [CrossRef]
- Kong, X.Y. Advanced Mechanics of Fluids in Porous Media, 2nd ed.; University of Science and Technology of China: Hefei, China, 2010; pp. 41–52. ISBN 9787312021404. [Google Scholar]
- Yang, T.; Chen, S.; Zhu, W.; Meng, Z.; Gao, Y. Water inrush mechanism in mines and nonlinear flow model for fractured rocks. Chin. J. Rock Mech. Eng. 2008, 27, 1411–1416. [Google Scholar] [CrossRef]
- Shi, W.; Yang, T.; Yu, Q. A study of water-inrush mechanisms based on geo-mechanical analysis and an in-situ groundwater investigation in the Zhongguan Iron Mine, China. Mine Water Environ. 2017, 36, 409–417. [Google Scholar] [CrossRef]
- Shi, B.Q.; Hou, Z.J. Mechanical analysis of fault activation water inrush in over burden rock and its application. Rock Soil Mech. 2011, 32, 3053–3057. [Google Scholar] [CrossRef]
- Wang, G.; Wu, M.M.; Wang, R.; Xu, H.; Song, X. Height of the mining-induced fractured zone above a coal face. Eng. Geol. 2017, 216, 140–152. [Google Scholar] [CrossRef]
- Kuroda, K.; Hayashi, T.; Do, A.T.; Canh, V.D.; Nga, T.T.V.; Funabiki, A.; Takizawa, S. Groundwater recharge in suburban areas of Hanoi, Vietnam: Effect of decreasing surface-water bodies and land-use change. Hydrogeol. J. 2017, 25, 727–742. [Google Scholar] [CrossRef]
- Urrutia, J.; Jodar, J.; Medina, A.; Herrera, C.; Chong, G.; Urqueta, H.; Luque, J.A. Hydrogeology and sustainable future groundwater abstraction from the Agua Verde aquifer in the Atacama Desert, northern Chile. Hydrogeol. J. 2018, 26, 1989–2007. [Google Scholar] [CrossRef]
- Yuan, R.Q.; Wang, S.Q.; Yang, L.H.; Liu, J.R.; Wang, P.; Song, X.F. Hydrologic processes of groundwater in a small monsoon-influenced mountainous watershed. Hydrol. Res. 2018, 49, 2016–2029. [Google Scholar] [CrossRef]


| Parameter | Value | Parameter | Value |
|---|---|---|---|
| Fluid density ρ (kg/m3) | 1000 | Non-Darcy factor β | 2.5 × 10⁻⁸ |
| Dynamic viscosity η (Pa·S) | 1.01 × 10⁻³ | Acceleration coefficient ca | 1.0 |
| Permeability of the aquifer (m2) | 5.3 × 10⁻¹¹ | Initial porosity φ0 | 0.25 |
| Permeability of the WFFZ (m2) | 5.3 × 10⁻¹⁰ | Pore compressibility cφ | 1.45 × 10⁻¹⁰ |
| No. | Weighting Distance | Scope | Fracture | Notes | |
|---|---|---|---|---|---|
| Width | Depth | ||||
| 1 | 40.5 m | −44.8 m +29.3 m | 50–60 cm | 7–8 m | First Weighting |
| 1 | 17.3 m | +11.9 m | 30 cm | 2.5 m | Periodic Weighting The average distance of the advanced influence: 14.1 m The average width of the fractures: 17.5 cm |
| 2 | 15.7 m | +14.0 m | 18 cm | 1.7 m | |
| 3 | 16.8 m | +12.0 m | 20 cm | 2.0 m | |
| 4 | 17.7 m | +14.1 m | 15 cm | 1.8 m | |
| 5 | 14.7 m | +16.1 m | 10 cm | 1.0 m | |
| 6 | 15.1 m | +14.3 m | 12 cm | 1.0 m | |
| 7 | 15.4 m | +15.8 m | 16 cm | 1.3 m | |
| 8 | 15.3 m | +14.6 m | 19 cm | 1.8 m | |
| Day | Date | Position (m) |
|---|---|---|
| 1 | Jan. 28th | 1251.5 |
| 2 | Jan. 29th | 1265.5 |
| 3 | Jan. 30th | 1275.7 |
| 4 | Jan. 31st | 1283.3 |
| 5 | Feb. 1st | 1294.4 |
| 6 | Feb. 2nd | 1302.0 |
| 7 | Feb. 3rd | 1313.1 |
| 8 | Feb. 4th | 1319.0 |
| 9 | Feb. 5th | 1326.7 |
| 10 | Feb. 6th | 1336.9 |
| 11 | Feb. 7th | 1345.4 |
| 12 | Feb. 8th | 1350.5 |
| 13 | Feb. 9th | 1355.8 |
© 2018 by the authors. Licensee MDPI, Basel, Switzerland. This article is an open access article distributed under the terms and conditions of the Creative Commons Attribution (CC BY) license (http://creativecommons.org/licenses/by/4.0/).
Share and Cite
Chang, S.; Yang, Z.; Guo, C.; Ma, Z.; Wu, X. Dynamic Monitoring of the Water Flowing Fractured Zone during the Mining Process under a River. Appl. Sci. 2019, 9, 43. https://doi.org/10.3390/app9010043
Chang S, Yang Z, Guo C, Ma Z, Wu X. Dynamic Monitoring of the Water Flowing Fractured Zone during the Mining Process under a River. Applied Sciences. 2019; 9(1):43. https://doi.org/10.3390/app9010043
Chicago/Turabian StyleChang, Shuai, Zhen Yang, Changfang Guo, Zhanyuan Ma, and Xiang Wu. 2019. "Dynamic Monitoring of the Water Flowing Fractured Zone during the Mining Process under a River" Applied Sciences 9, no. 1: 43. https://doi.org/10.3390/app9010043
APA StyleChang, S., Yang, Z., Guo, C., Ma, Z., & Wu, X. (2019). Dynamic Monitoring of the Water Flowing Fractured Zone during the Mining Process under a River. Applied Sciences, 9(1), 43. https://doi.org/10.3390/app9010043