Article

Using the Guided Fireworks Algorithm for Local Backlight Dimming

School of Electrical and Information Engineering, Tianjin University, Tianjin 300072, China
*
Author to whom correspondence should be addressed.
Appl. Sci. 2019, 9(1), 129; https://doi.org/10.3390/app9010129
Submission received: 24 November 2018 / Revised: 18 December 2018 / Accepted: 25 December 2018 / Published: 1 January 2019
(This article belongs to the Special Issue Advanced Intelligent Imaging Technology)

Abstract

:
Local backlight dimming is a promising display technology, with good performance in improving the visual quality and reducing the power consumption of device displays. To set optimal backlight luminance, it is important to design high performance local dimming algorithms. In this paper, we focused on improving the quality of the displayed image, and take local backlight dimming as an optimization problem. In order to better evaluate the image quality, we used the structural similarity (SSIM) index as the image quality evaluation method, and built the model for the local dimming problem. To solve this optimization problem, we designed the local dimming algorithm based on the Fireworks Algorithm (FWA), which is a new evolutionary computation (EC) algorithm. To further improve the solution quality, we introduced a guiding strategy into the FWA and proposed an improved algorithm named the Guided Fireworks Algorithm (GFWA). Experimental results showed that the GFWA had a higher performance in local backlight dimming compared with the Look-Up Table (LUT) algorithm, the Improved Shuffled Frog Leaping Algorithm (ISFLA), and the FWA.

1. Introduction

With the development of display technologies, liquid crystal displays (LCDs) have been successfully applied as display devices in many areas. To obtain good visual performance, it is important to set appropriate screen luminance and luminance contrast [1,2,3]. By increasing the luminance contrast, the visual quality can be significantly improved [4]. In a traditional LCD system, the backlight is set to a certain luminance level, and then the liquid crystal (LC) transmittance is controlled to display the image [5]. This backlight mode is simple, but because the backlight luminance is the same behind different regions of an image, the image contrast ratio may be low, which will reduce the visual quality. For example, when the backlight luminance behind an image is high, the dark regions in the image may appear greyish rather than true black, because the backlight with high luminance will leak through the dark pixels (backlight leakage) [6]. On the other hand, power consumption is another factor of concern in a display system. Since the backlight of traditional LCD systems is usually set to a high luminance level, the power consumption of these traditional display systems is large.
Recently, a new display technology called local backlight dimming has emerged. A local dimming system consists of an LC panel and a light emitting diode (LED) backlight module. It is different from traditional LCDs in that the backlight module of the local dimming system is composed of LED blocks; each block illuminates a small region of LC panel, and its luminance can be controlled independently. A diagram of a local dimming system is shown in Figure 1.
According to the local dimming model, the backlight blocks behind different regions can be set to different luminance levels. Therefore, the image contrast ratio can be improved and a higher visual quality can be obtained. For example, the dark regions of the image can be set to a low backlight luminance level, which will reduce backlight leakage and increase the image contrast. Setting some backlight blocks to a low luminance level also effectively reduces the power consumption.
In a local dimming system, the displayed image quality and the power consumption are the two elements of greatest concern. To achieve higher image quality or lower power consumption, it is necessary to design suitable local dimming algorithms which can effectively set the backlight luminance. In recent years, some local dimming algorithms [7,8,9,10,11] have been proposed. Most of these algorithms calculate backlight luminance based on the pixel values of the image (algorithms based on image pixel values are called parameter-based algorithms in this paper). For example, the maximum algorithm and the average algorithm [7] take the maximum pixel value and the average pixel value in the image region illuminated by a backlight block, respectively, as the backlight block’s luminance level. The Look-Up Table (LUT) algorithm [8] uses a look-up table to correct the difference between the maximum algorithm and the average algorithm. Based on the look-up table, the luminance level of each block is obtained. Hong et al. [9] proposed a novel backlight dimming algorithm to reduce clipping artifacts by minimizing the increment of backlight luminance. Mantel et al. [10] presented two models for computing backlight luminance at a given power consumption. The first model could achieve acceptable quality at a low complexity, while the other model could achieve the best possible power–quality at a higher complexity.
In our previous work [12], local dimming was taken as an optimization problem. We focused on reducing the image distortion without increasing the power consumption. Therefore, we used peak signal-to-noise ratio (PSNR) to evaluate the displayed image quality, and took maximizing PSNR as the optimization objective. The local dimming algorithm in our work [12] was designed based on evolutionary computation (EC). As an important branch of computational intelligence (CI), the EC algorithm has a strong global search ability and good performance in solving complex optimization problems [13]. EC algorithms such as Genetic Algorithm (GA) [14], Artificial Bee Colony (ABC) [15], Particle Swarm Optimization (PSO) [16], and Ant Colony Optimization (ACO) [17] have been successfully applied to different optimization areas. The EC algorithm applied in our work [12] is Shuffled Frog Leaping Algorithm (SFLA) [18]. Based on the original SFLA, we proposed the improved algorithm named Improved Shuffled Frog Leaping Algorithm (ISFLA). It was proven that our method could achieve a higher image quality with the same or lower power consumption, compared with traditional parameter-based local dimming methods.
On the basis of our previous work [12], this paper continues to take local dimming as an optimization problem, and focuses on improving the displayed image quality. There are two important elements needed to achieve higher image quality: the evaluation of the image quality, and the search ability of the algorithm. On the one hand, when searching using EC algorithms, the solutions are selected based on the image quality evaluation results. Therefore, with an accurate evaluation method, the solutions that have high performance can be selected accurately. On the other hand, the solutions obtained by EC algorithms are usually near-optimal solutions, which means that the solutions’ quality can be further improved by improving the search ability of the algorithms. Therefore, this paper uses a structural similarity (SSIM) index [19] instead of PSNR to better evaluate image quality, and proposes a new local dimming algorithm. Our proposed algorithm is based on the Fireworks Algorithm (FWA) [20], which is an EC algorithm proposed in recent years. To improve the search ability of FWA, we introduced a guiding strategy into the original FWA to give an improved algorithm: the Guided FWA (GFWA). Compared with the ISFLA, the search ability of the GFWA is further improved.
The rest of this paper is organized as follows: Section 2 introduces our new model of the local backlight dimming problem; Section 3 analyses the FWA and proposes the improved algorithm, the GFWA; Section 4 shows the experimental results; and in Section 5, we conclude our work.

2. Optimization Model of the Local Dimming Problem

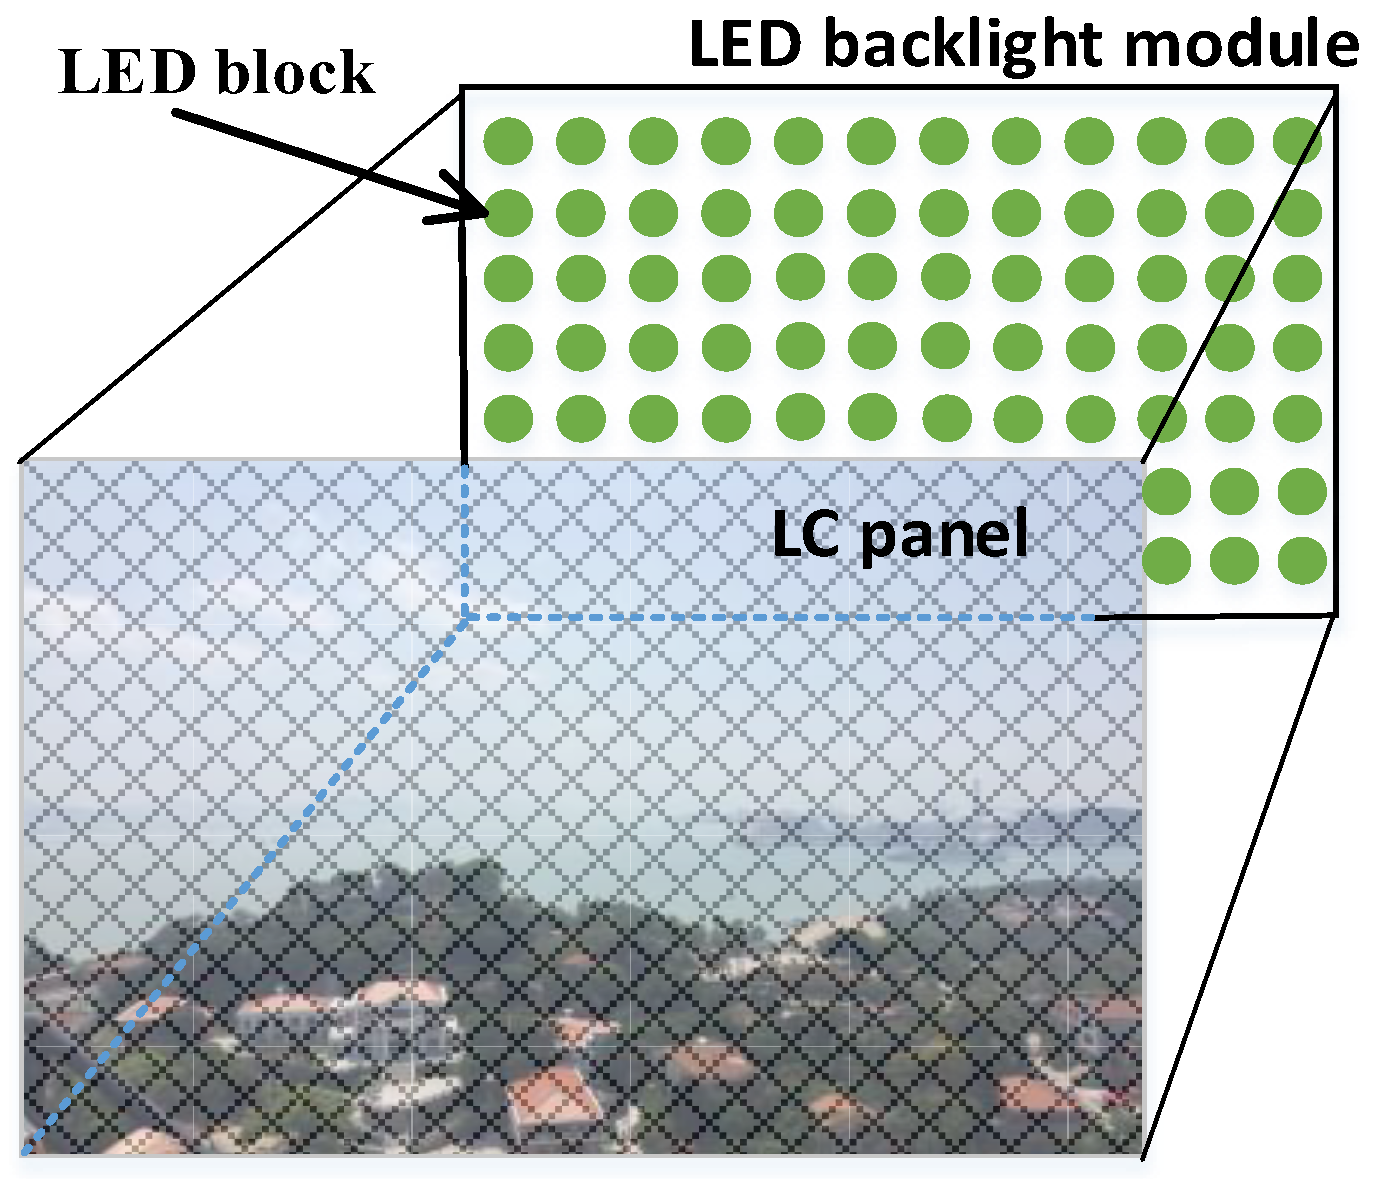
2.1. The Previous Model of the Local Dimming Problem

Image quality evaluation is an important step in the local dimming process. To evaluate the displayed image quality, the first step is to use a simulation method to calculate the gray levels of the displayed image. The gray level y ^ i at pixel i of the displayed image can be calculated by [8,21]:
y ^ i = t i × l i
where l i is the backlight luminance level behind pixel i, and t i is the transmittance of the LC panel at pixel i. The backlight luminance level l i at the i th pixel is determined by the backlight blocks behind and around pixel i. It can be calculated by [11,22]:
l i = j = 1 K h i , j × r j
where K is the number of backlight blocks, h i , j is the attenuation coefficient of the luminance from the j th backlight block to pixel i, and r j is the luminance level of the j th backlight block.
In our previous work [12], the objective was to improve the image quality, with the constraint of maintaining the power consumption below a certain value. We used PSNR to evaluate the image quality; the higher the PSNR, the better the image quality. Therefore, the local dimming problem model proposed in [12] is:
{ max : PSNR s . t . P C < P C l i m i t
where PC indicates the power consumption, and P C l i m i t is the constraint value of PC. PC can be calculated by [23]:
P C = 1 K i = 1 K r i r f u l l × 100 %
where K is the number of backlight blocks and r i is the luminance level of the ith backlight block. r f u l l is the maximum luminance level that the block can maintain, usually r f u l l = 255.

2.2. The New Model of the Local Dimming Problem

PSNR is a classical image quality evaluation method; it evaluates image quality mainly based on the errors between pixels of the evaluated image and the reference image. This evaluation method, however, doesn’t consider the characteristics of the human visual system. After the PSNR method, another image quality evaluation method, the SSIM index, was proposed. Under the assumption that human visual perception is highly adapted for extracting structural information from a scene, the SSIM index uses an alternative complementary framework for quality assessment, based on the degradation of structural information [19]. According to the experimental results shown in [19], the SSIM index usually has a better performance than PSNR in terms of image quality evaluation. The SSIM index between two image signals x and y can be calculated by:
SSIM ( x , y ) = ( 2 μ x μ y + C 1 ) ( 2 σ x y + C 2 ) ( μ x 2 + μ y 2 + C 1 ) ( σ x 2 + σ y 2 + C 2 )
where μ x and μ y are the mean intensities of x and y respectively, σ x is the variance of x, σ y is the variance of y, σ x y is the variance of x and y, and C 1 and C 2 are two constants to stabilize the division with weak denominator. In [19], the mean SSIM (MSSIM) index was used to evaluate overall image quality:
MSSIM ( X , Y ) = 1 M j = 1 M SSIM ( x j , y j )
where X is the reference image and Y is the evaluated image, x j and y j are the image contents at the jth local window respectively, and M is the number of local windows of the image.
On the basis of our previous work [12], this paper continues to focus on improving image quality. The MSSIM index was taken as the indicator of the displayed image quality. We used f ( R ) = 1 MSSIM ( X , Y ( R ) ) as the objective function, where R is the solution of the problem which represents a group of backlight block luminance. R = [ r 1 , r 2 , r i , r K ] , where K is the number of backlight blocks, r i is an integer between 0 and 255 representing the luminance level of the ith block, and Y ( R ) represents the displayed image processed by solution R. The model of the local dimming problem is:
{ min :   f ( R ) = 1 MSSIM ( X , Y ( R ) ) s . t .     1 K i = 1 K r i r f u l l P C l i m i t

3. Local Dimming Based on the Guided Fireworks Algorithm

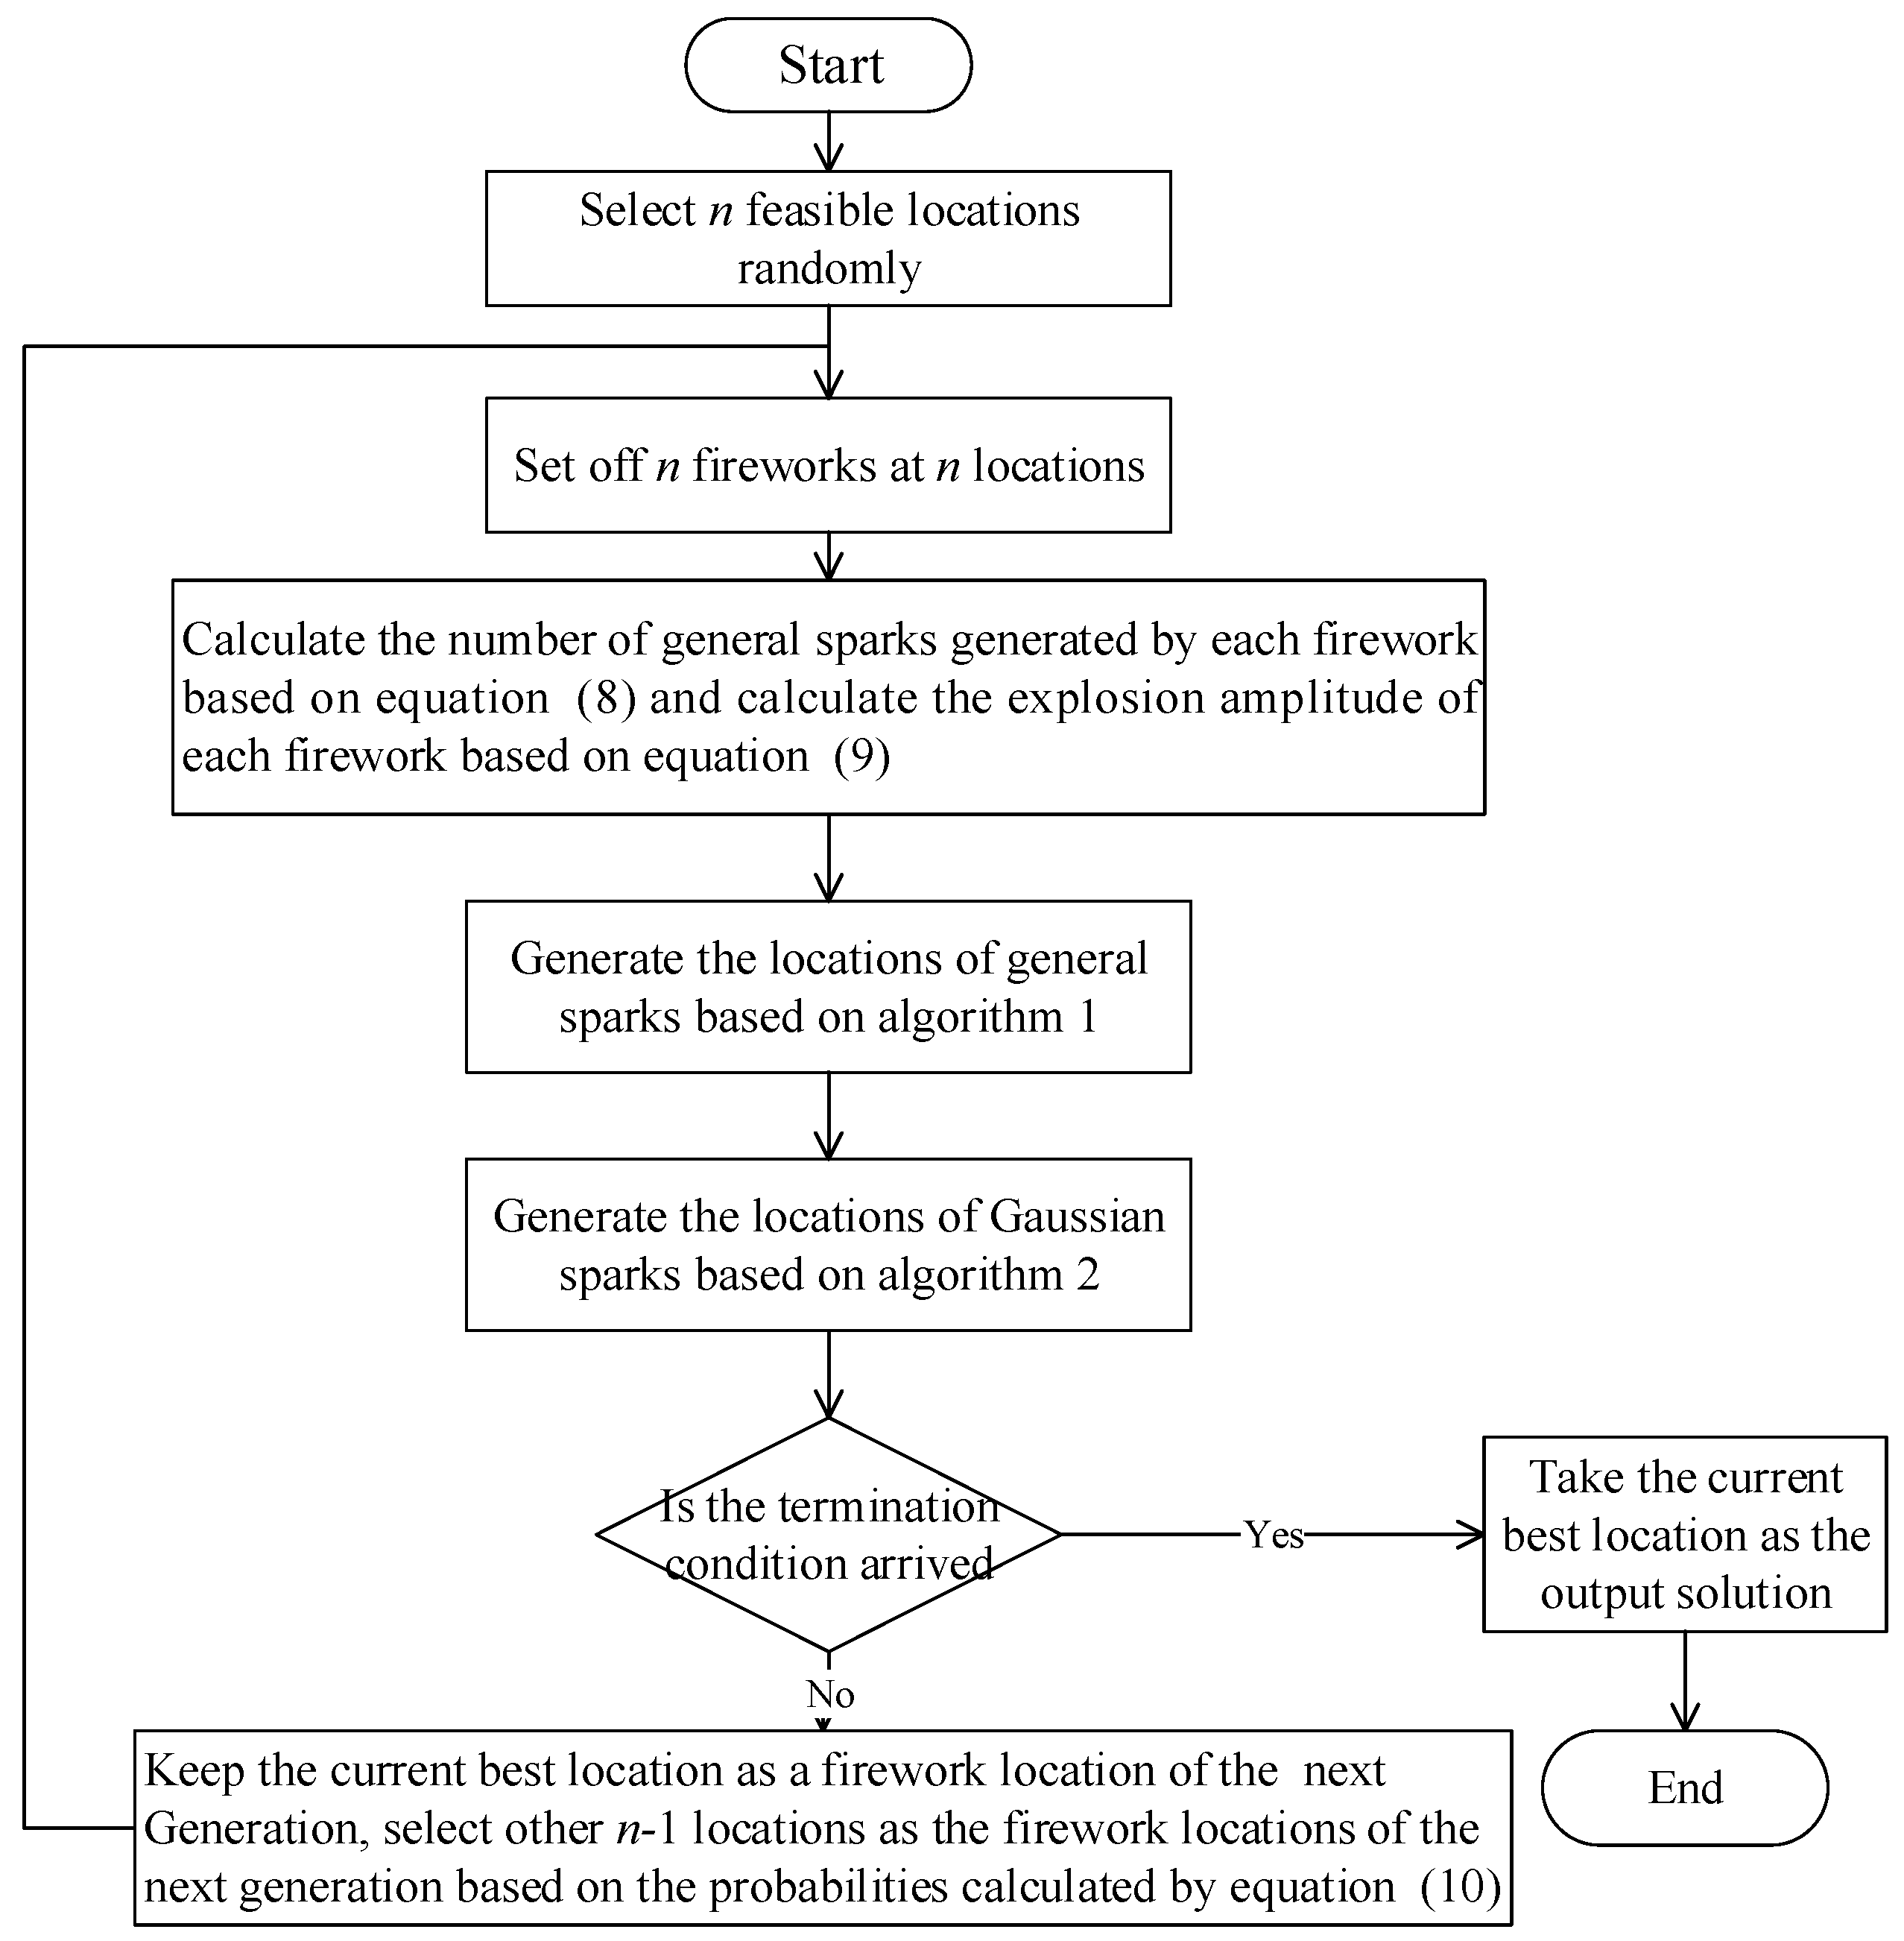
3.1. Fireworks Algorithm

FWA is an EC algorithm which was developed by simulating the explosion process of fireworks. In the FWA, two search strategies are employed, and mechanisms for maintaining diversity of the population are also well designed [20]. When the FWA is used to solve optimization problems, the firework and spark locations correspond to the solutions of the problem. In this section, R ¯ i is used to present the location of firework i, R ˜ i is used to present the general spark location i, and R ^ i is used to present the Gaussian spark location i. For each location, its objective function is calculated based on Equation (7). Take R ¯ i as an example: the objective function of R ¯ i is f ( R ¯ i ) = 1 MSSIM ( X , Y ( R ¯ i ) ) , where X is the reference image and Y ( R ¯ i ) is the displayed image processed by the solution R ¯ i . During the searching process of the algorithm, the objective function is used to evaluate the quality of the solution. The smaller the value of f ( R ¯ i ) , the better the quality of R ¯ i . The flow chart of the FWA is shown in Figure 2. The equations mentioned in the flow chart are included here as (8)–(10). The pseudo codes of Algorithms A1 and A2, mentioned in the flow chart, are shown in Appendix A.
{ s i = Q × f ( R ¯ ) max f ( R ¯ i ) + ξ j = 1 n ( f ( R ¯ ) max f ( R ¯ j ) ) + ξ s ^ i = { r o u n d ( a × Q )    if   s i > a × Q r o u n d ( b × Q )     if   s i < b × Q r o u n d ( s i )
where s i is the number of sparks generated by the firework R ¯ i , Q is a parameter used to control the total number of general sparks generated by the fireworks, f ( R ¯ i ) is the objective function, n is the number of fireworks, f ( R ¯ ) max = max ( f ( R ¯ j ) ) ( j = 1 , 2 , , n ) , ξ is a very small constant to avoid zero-division-error, and a and b are two constants.
A i = A ^ × f ( R ¯ i ) f ( R ¯ ) min + ξ j = 1 n ( f ( R ¯ j ) f ( R ¯ ) min ) + ξ
where A i is the explosion amplitude of firework R ¯ i , and A ^ is the maximum explosion amplitude, f ( R ¯ ) min = min ( f ( R ¯ j ) ) ( j = 1 , 2 , , n ) .
{ d ( R i ) = j G | | R i R j | | P ( R i ) = d ( R i ) j G d ( R j )
where G is a mixed set including all firework locations and spark locations, and R i represents the location i in set G, P ( R i ) is the probability that location R i is selected.
In the search process of the FWA, new spark locations are generated by random searching around the locations of fireworks. For different firework locations, the search step size and the number of generated spark locations are different. If a firework location has better quality, there will be more spark locations generated around it, and its search step size will be smaller. Because high quality spark locations appear more easily near high quality firework locations, this search strategy is conducive to improving the search ability of the algorithm. After the general spark locations have been generated, the Gaussian spark locations are generated. This is beneficial for ensuring population diversity. In addition, the probability that a location is selected as the firework location of the next generation is based on the distances between the location and other locations; when the sum of the distances is large, the location has a higher probability of being selected. This selection strategy also effectively ensures population diversity.

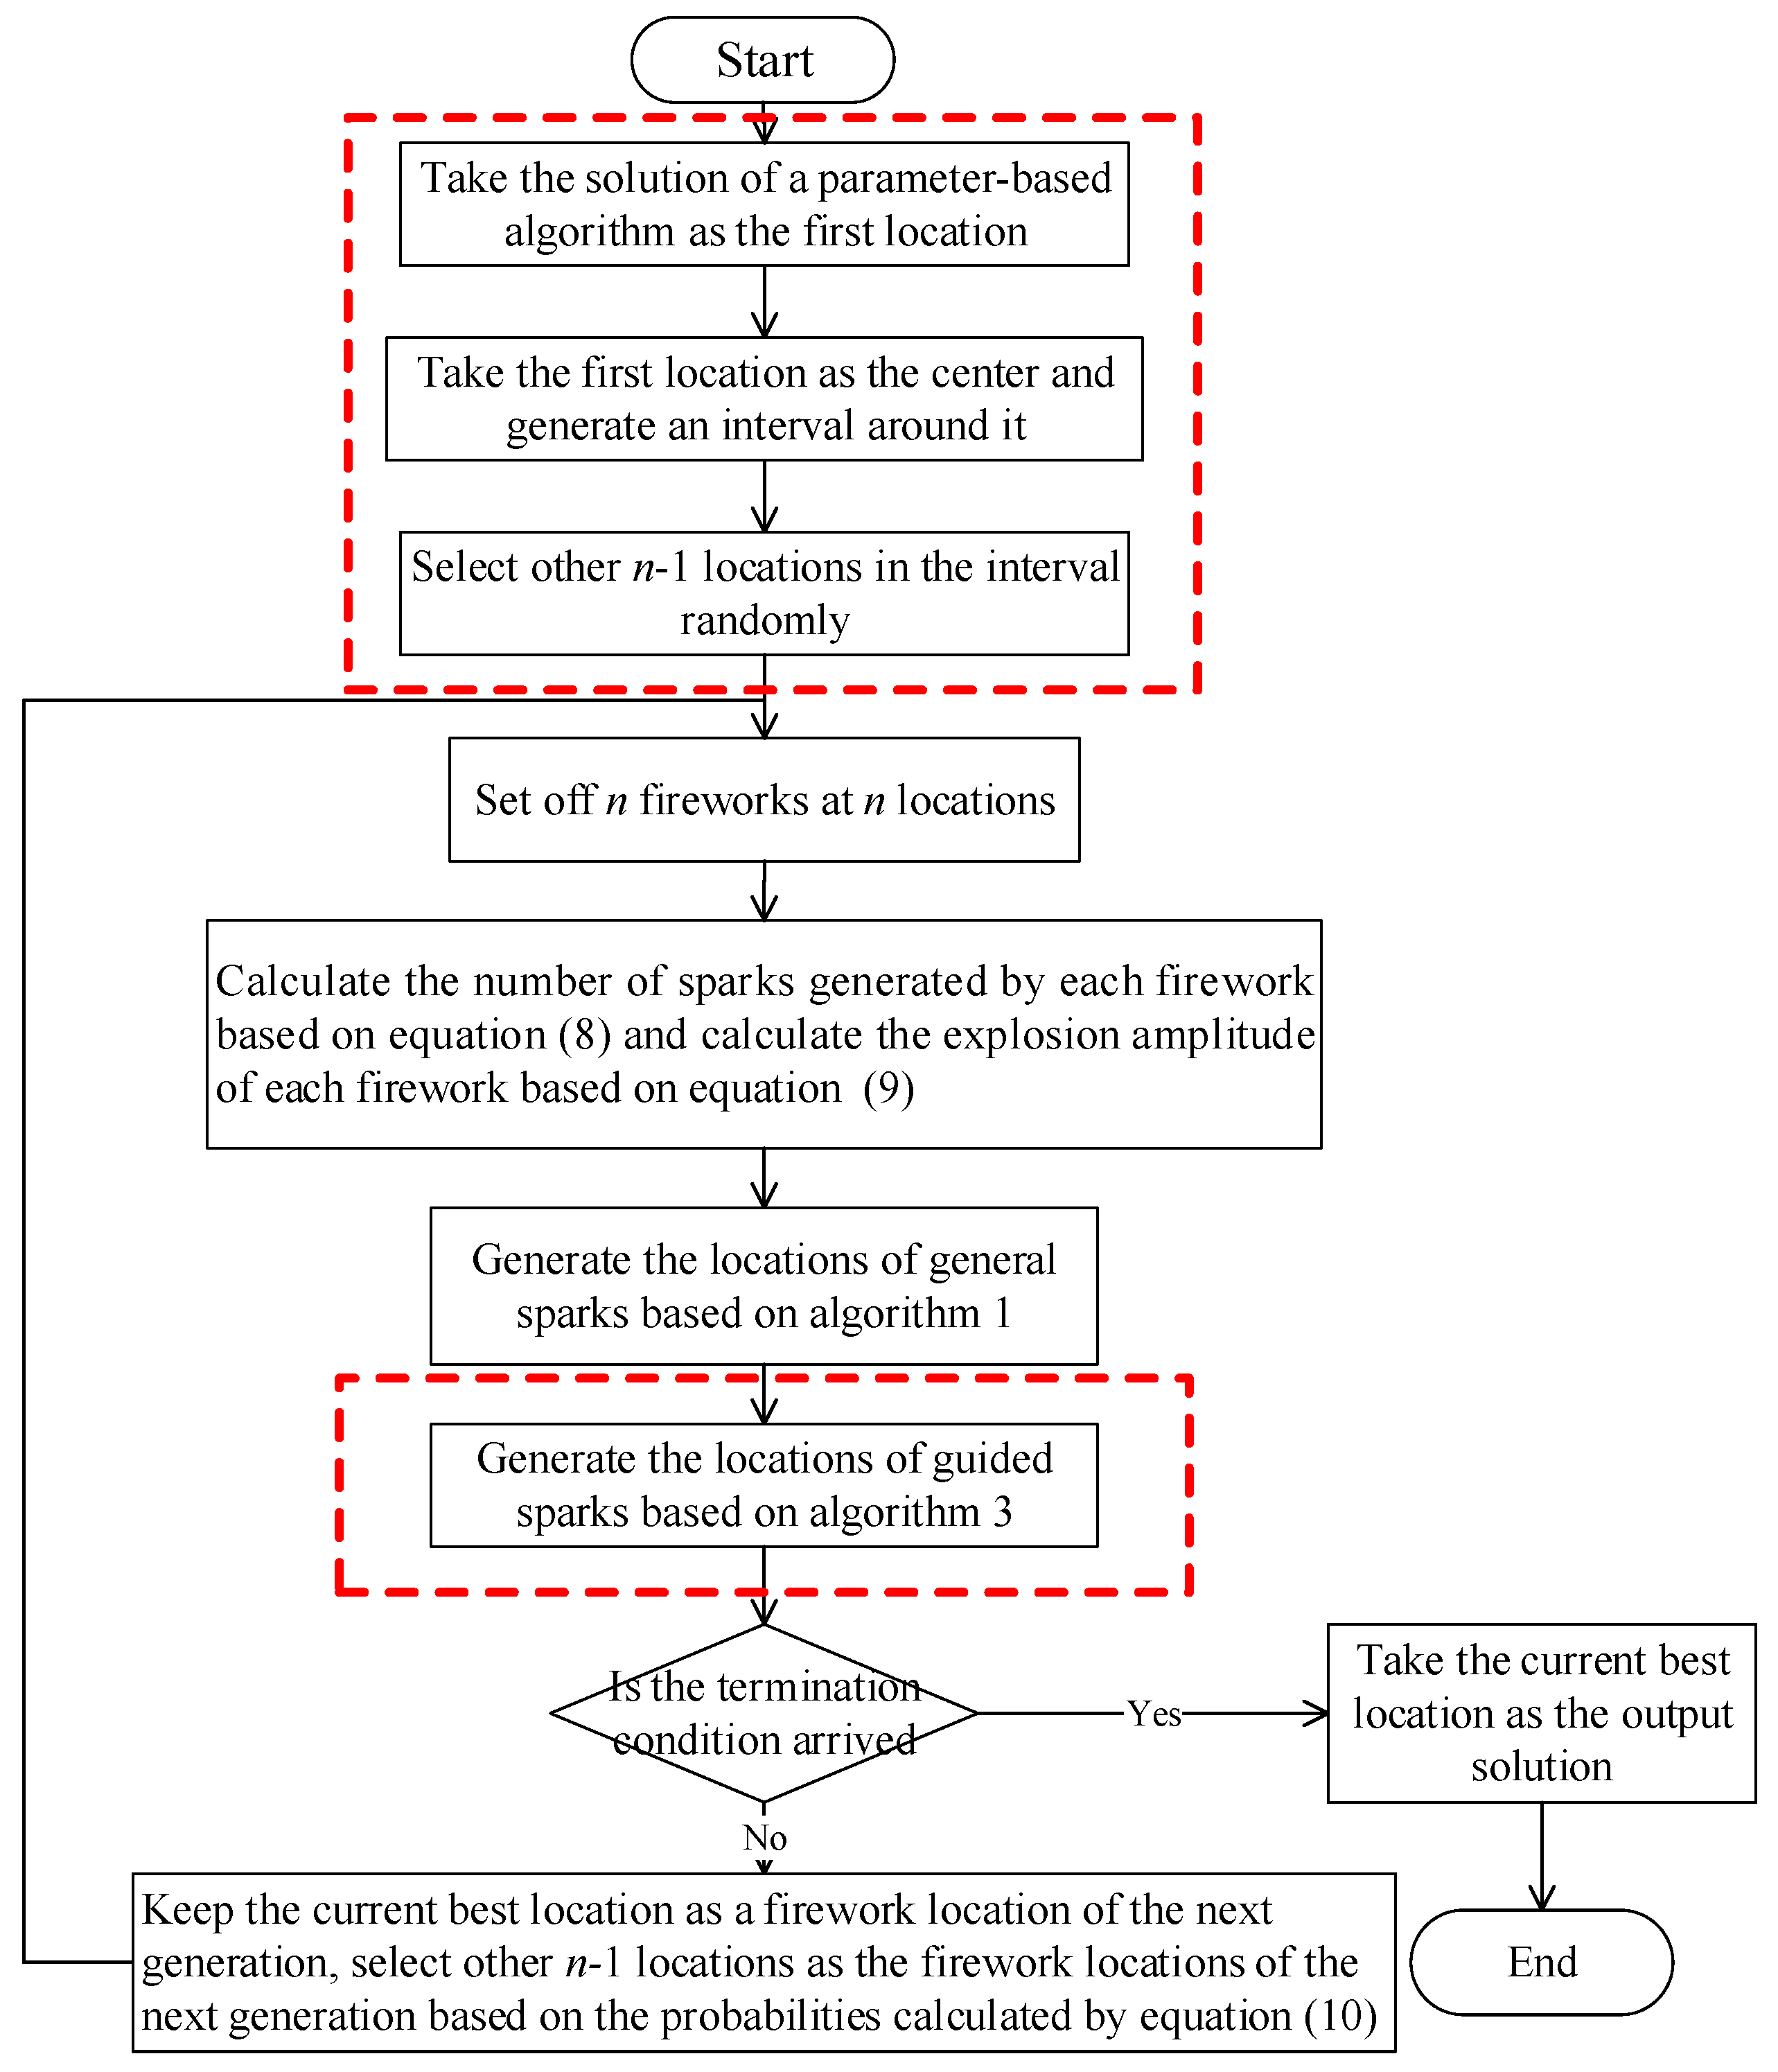
3.2. Guided Fireworks Algorithm

In a local backlight system, the optimal backlight luminance is related to the image content. For example, a backlight block behind an image region with high overall pixel values is suitable for high luminance levels. Therefore, some parameter-based algorithms which calculate the backlight luminance based on the image pixel values are proposed. Compared with solutions generated randomly, the solutions generated by the parameter-based algorithms usually achieve higher quality. In ISFLA, as proposed in [12], an initial solution is generated based on the parameter-based algorithm, and the search interval is centered on this initial solution. These strategies are conducive to maintaining the correlation between the image content and the backlight luminance. According to the search strategy of the FWA, a lot of random searches will be done around firework locations with good quality. Therefore, if the solution generated by the parameter-based algorithm is taken as a firework location, many new solutions will be generated around this firework location; the search strategies of the FWA can therefore satisfy the correlation between the backlight luminance and the image content well.
In the FWA, general spark locations are generated randomly around firework locations, and then the Gaussian spark locations are generated by randomly selected firework locations. These strategies maintain population diversity well, but the random generation method may give some spark locations with poor quality, thereby leading to worse quality in the current population. On the other hand, the firework locations of the next generation are selected from all the locations in the current generation, and the selection is mainly based on the distances between these locations. This selection strategy is beneficial for maintaining population diversity, but it also means that any location in the population is likely to be selected. Therefore, when the quality of the current population is bad, the quality of the firework locations of the next generation is likely to also be bad, thereby resulting in poor searching performance.
In order to improve the performance of the FWA, this paper introduces the guiding strategy, and proposes the improved algorithm, the GFWA. The flow chart of the GFWA is shown in Figure 3. The pseudo code of Algorithm A3 is shown in Appendix A.
It can be seen from the flow chart and Algorithm A3, there are three improvements in the GFWA:
  • In the GFWA, the solution of the parameter-based algorithm is taken as the first firework location, and other firework locations are generated within an interval which is centered on the first location. To ensure the diversity of the population, the radius of the interval is set to a relatively large value. In this paper, the luminance level of a block is from 0 to 255, and the radius value is set to 50. For example, if the luminance level of a block calculated by the parameter-based algorithm is 100, the search interval at this block is (50,150). The solutions obtained by parameter-based algorithms are related to the image content, and they usually have higher quality compared with the solutions generated randomly. Therefore, this strategy mainly avoids generating initial solutions which are obviously unrelated to the image content. It is also beneficial for improving the quality of the initial solutions and improving the quality of the output solution.
  • In the search process of the GFWA, the strategy of generating guided sparks is applied. After the general spark locations are generated, the firework locations and the general spark locations are mixed together. Then, in the mixed set, the bad locations will search for guided spark locations to replace themselves, based on the guidance of the best location. With the guidance of the location which has the highest quality in the population, the newly generated guided spark locations have much higher quality than the bad locations in the population. For a bad location, if the quality of its corresponding guided spark location is better, it will be replaced by the guided spark location. Because some bad locations in the population are replaced by better locations, the quality of the whole population is improved. As shown in Algorithm A3, the firework locations and the general spark locations are first mixed into set G. The locations in G are then sorted from good to bad, and G(i) is used to represent the ith solution in the sorted set. Therefore, G(1) is the best location in set G, while G(v) (v is the number of locations in set G) is the worst location in set G. If there are Q ˜ bad locations to be updated, the locations from G(v Q ˜ + 1) to G(v) are selected. Supposing R b a d is one of the Q ˜ bad locations to be updated, the corresponding guided spark location R g u i d is generated by the guidance of the best location R b e s t :
    [ r t 1 r t 2 r t k ] = [ r b 1 r b 2 r b k ] + [ r a n d ( 0 , 1 ) r a n d ( 0 , 1 ) r a n d ( 0 , 1 ) ] × ( [ r s 1 r s 2 r s k ] [ r b 1 r b 2 r b k ] ) ( R g u i d )       ( R b e s t )                                        ( R b e s t )       ( R b a d )
    If R g u i d is better than R b a d , R b a d is replaced by R g u i d .
  • By the guidance of R b e s t , if a bad location can’t find a better guided spark location to replace itself, it will be updated by the following strategy. In this strategy, a good location in the population is first selected to generate a new guided spark location, based on the Gaussian function. The bad location is then replaced by the new guided spark location. As shown in Algorithm A3, if R g u i d generated by the guidance of R b e s t is not better than R b a d , a new R g u i d is generated based on R g o o d and the Gaussian function, where R g o o d represents the good locations in set G, if R b a d = G(v + 1 − j), R g o o d = G(j). R b a d is then replaced by the new generated guided solution. This strategy is improved from Algorithm A2, the FWA. Compared with Algorithm A2 which may add spark locations with bad quality, the strategy of Algorithm A3, which uses new guided spark locations to replace the bad ones, can better ensure population quality under the condition of keeping the population diversity. In addition, because the new locations are generated based on good locations in the population, they can easily achieve high quality.

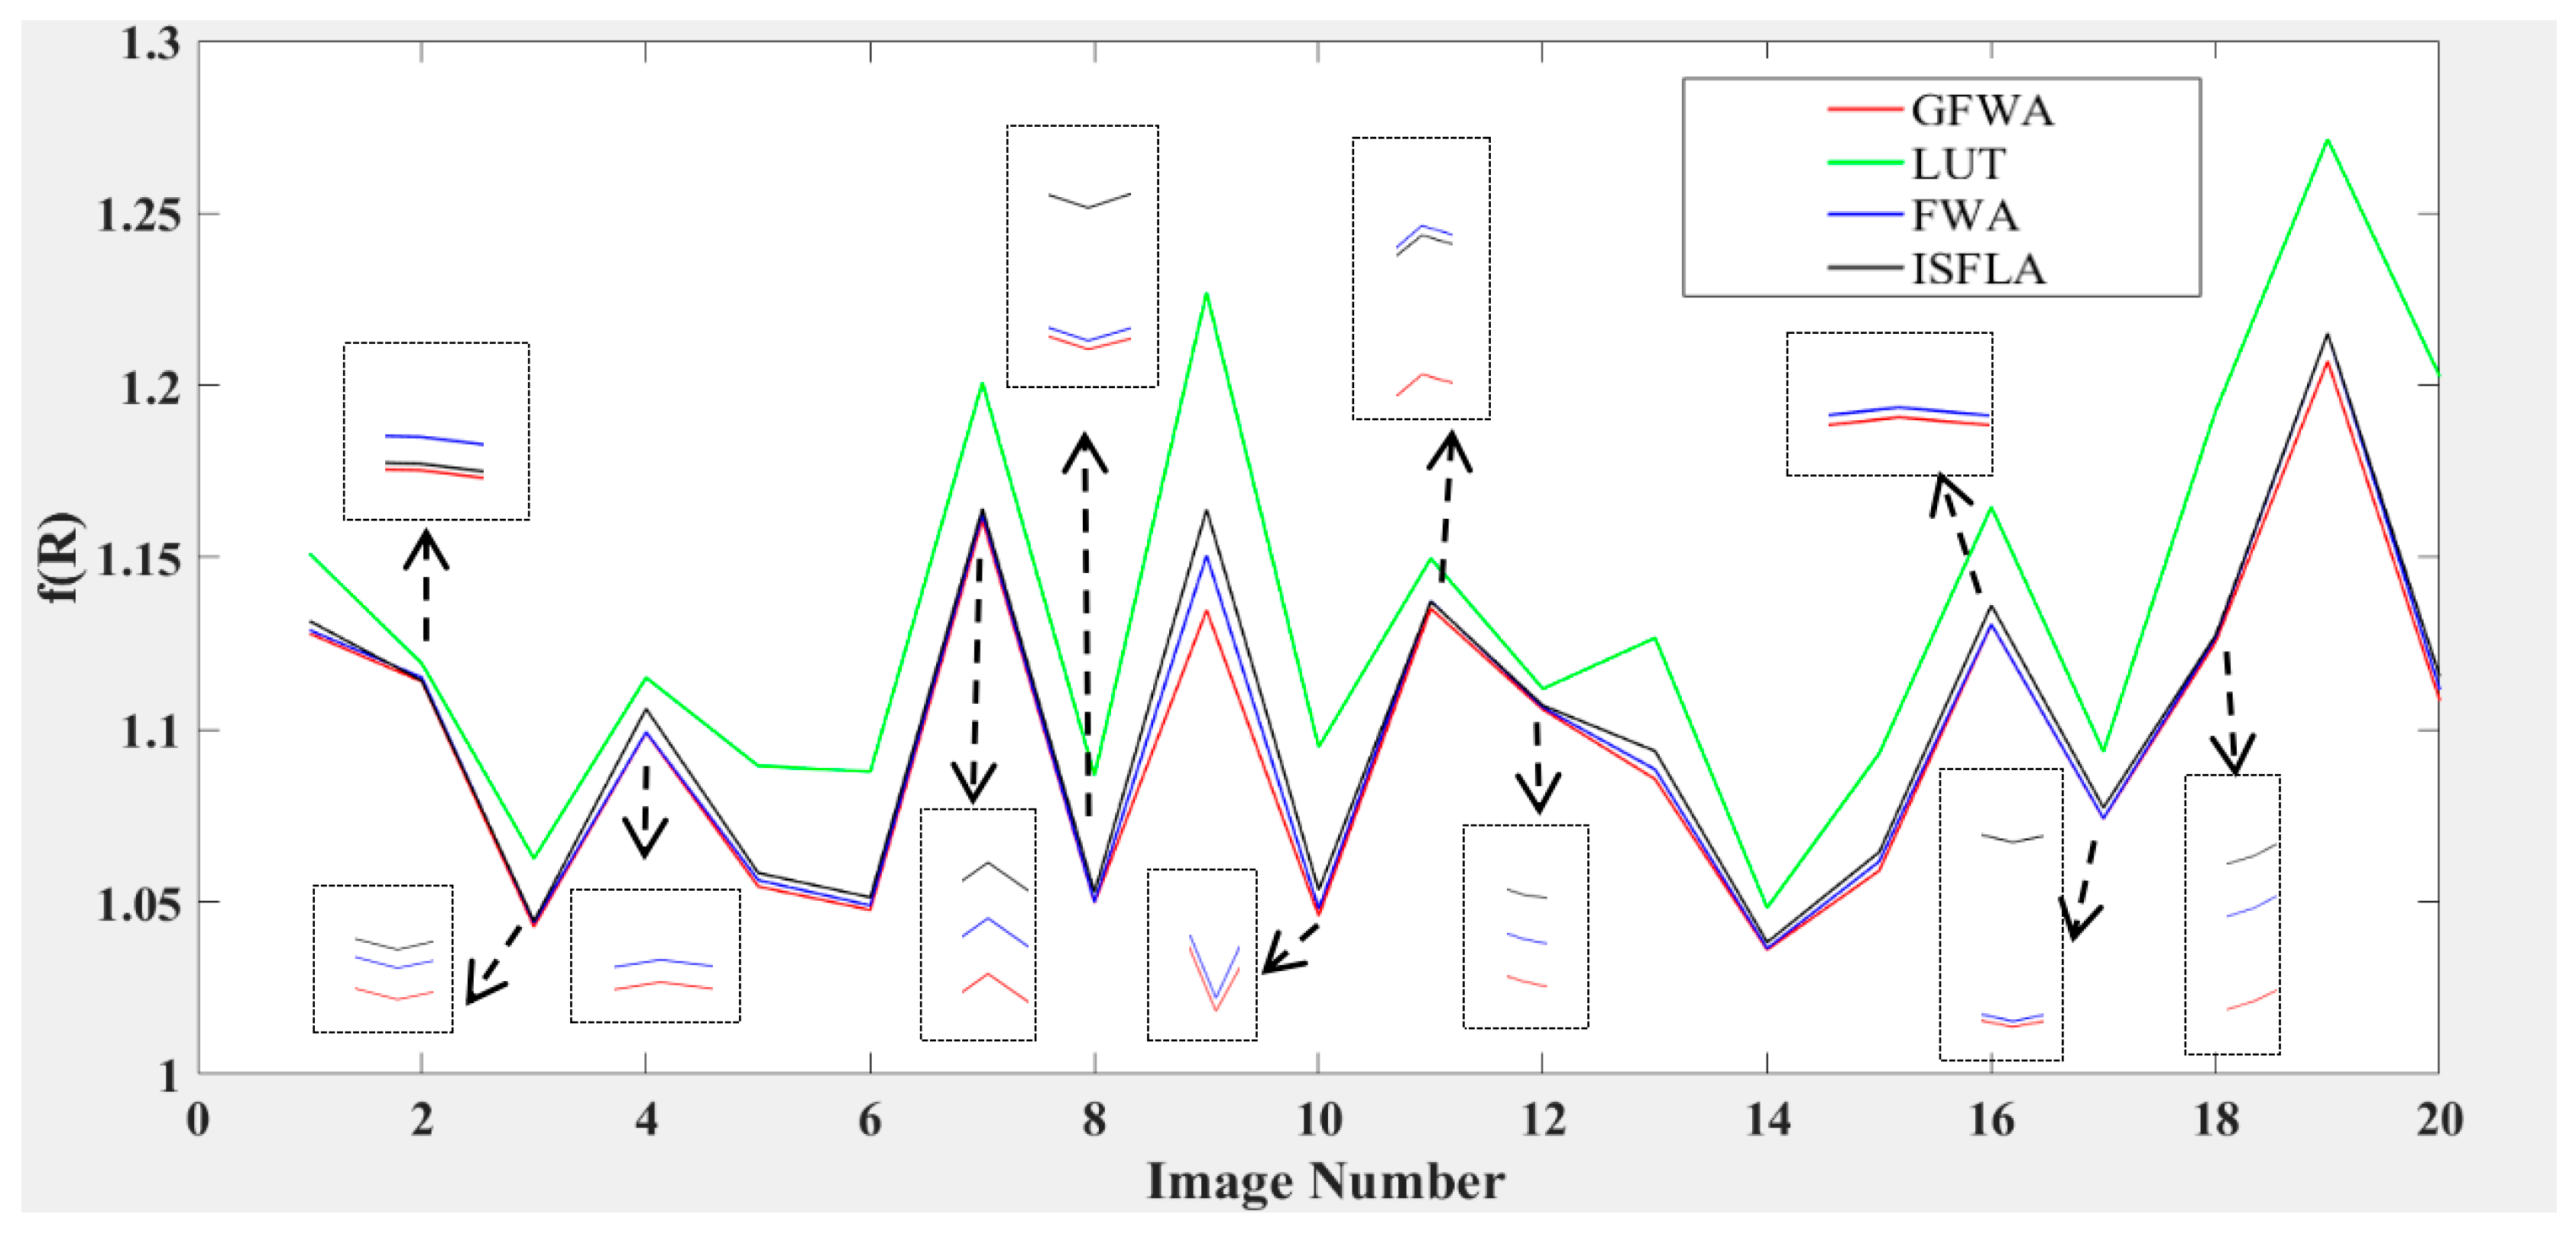
4. Simulation Results and Discussions

To test the performance of our proposed method, we selected 20 different images as test samples. The resolution of the test images was 1920 x 1080. All test images were divided into 7 x 5 blocks for local dimming control. The simulation experiments were conducted with MATLAB R2016a. For each test image, the local dimming algorithm was run to calculate its corresponding backlight luminance. The displayed image when the backlight luminance is applied to the test image was then simulated, based on the simulation method mentioned in Section 2. Finally, the original test image was taken as the reference image and the MSSIM index (as shown in Equations (5) and (6)) was calculated to evaluate the quality of the displayed image. The higher the MSSIM index, the better the image quality.
In this paper, the GFWA was compared with the LUT algorithm, which is a traditional parameter-based algorithm; the ISFLA, proposed in [12]; and the original FWA. To analyse the search ability of the four algorithms, they were used separately to process the 20 test images. The same constraint value of P C l i m i t was set for each of the four algorithms. Because the GFWA, ISFLA, and FWA are EC algorithms, they require termination conditions. In our experiments, each EC algorithm was terminated after 20,000 evaluations. The quality of the output solutions was evaluated by the objective function f ( R ) , which is shown in Equation (7). The smaller the value of f ( R ) , the better the quality of the output solution. We calculated the f ( R ) values that the four algorithms obtained when they were applied to process the 20 test images. The line charts drawn based on the f ( R ) values are shown in Figure 4, and, to better show the f ( R ) values of the four algorithms, some details of the line charts are enlarged in Figure 4.
It can be seen from Figure 4 that for all 20 images, the f(R) values of the GFWA were the smallest among the four algorithms, which means that the solutions obtained by the GFWA were of higher quality than the other three algorithms. The f(R) values of the LUT algorithm were obviously larger than the other three algorithms, which proves that, compared with the parameter-based algorithm, the optimization methods effectively improved the solution quality. In most cases, the f(R) values of the FWA were smaller than those of the ISFLA, which proves that the FWA had better performance in solving local dimming problem. We also calculated the MSSIM index values achieved by the four algorithms when they were applied to process the 20 test images. For the GFWA, the average MSSIM index value of the 20 test images was 0.9129, which is 0.0292 higher than the average MSSIM index value (0.8837) of the LUT algorithm, 0.0019 higher than the average MSSIM index value (0.9110) of the FWA, and 0.0044 higher than the average MSSIM index value (0.9085) of the ISFLA. All these results prove that the GFWA had the highest search ability.
To further analyse the visual quality of the images processed by the four algorithms, we selected four images from the 20 test images. Among them, images 1 and 2 were low contrast ratio images, and images 3 and 4 were high contrast ratio images. The four selected test images are shown in Figure 5. They were also used as the reference images to evaluate the quality of the displayed images.
The simulated displayed images of the four algorithms are shown in Figure 6, Figure 7, Figure 8 and Figure 9. In order to better compare the visual differences of the four algorithms, the regions in the red circles of the displayed images are enlarged and shown next to the same regions in the reference images. In addition, the values of the MSSIM index and PC of the four algorithms are given in Table 1.
As shown in Figure 6, Figure 7, Figure 8 and Figure 9, the visual image quality of the LUT algorithm was the worst. Compared with the LUT algorithm, the images processed by the three EC algorithms achieved significantly higher visual quality, proving that treating local dimming as an optimization problem is an effective way to improve visual quality. When comparing the three EC algorithms, the visual quality of the GFWA was found to be the highest. The images processed by the GFWA had clearer details, such as the regions in the red circles in Figure 6 and Figure 7. In Figure 8 and Figure 9, the simulation results of the high contrast ratio images are shown, and some bright regions of the images are marked by the red circles. It can be seen from these bright regions that the GFWA preserved the contrast ratio of the images well, improving the visual quality.
It can be seen from Table 1, the MSSIM index of the LUT algorithm was the smallest, much lower than the three EC algorithms. Combining this result with the image visual quality shown in Figure 6, Figure 7, Figure 8 and Figure 9, we can conclude that the SSIM index is an effective image quality evaluation method. In local dimming systems, higher image quality usually corresponds to higher power consumption. However, as shown in Table 1, when image 4 was processed by the four algorithms, the smallest MSSIM index corresponded to the highest PC, showing that it is possible to achieve higher image quality with lower power consumption using a local dimming system.

5. Conclusions

In this paper, we have focused on improving displayed image quality without increasing the power consumption of the local dimming system. On the basis of our previous work [12], we used the SSIM index to replace the PSNR as our image quality evaluation method. Then, we designed and improved the GFWA local dimming algorithm, based on the FWA. In the GFWA, initial firework location is generated using the parameter-based algorithm, the guiding strategy is used to update bad locations in the population, and the step of generating Gaussian firework locations is also improved. Finally, we compared the GFWA with the LUT algorithm, the ISFLA and the original FWA. The experimental results show that the GFWA was able to produce higher quality images.
There are two future research suggestions: (1) Both the PSNR and the SSIM index are full-reference image quality evaluation methods; when these methods are used, the reference images are required. Therefore, it would be meaningful if no-reference methods could be applied to local dimming. (2) As an EC algorithm, a certain number of iterations are required by the GFWA, but in practical applications, local dimming usually needs to be finished in a short time. The algorithm efficiency of the GFWA should therefore be further improved.

Author Contributions

Conceptualization, T.Z. and X.Z.; methodology, T.Z. and X.Z.; software, Y.W. and Q.Z.; validation, T.Z. and X.Z.; formal analysis, X.Z.; investigation, Y.W. and Q.Z.; resources, T.Z.; data curation, Y.W.; writing—original draft preparation, T.Z. and X.Z.; writing—review and editing, Y.W. and Q.Z.; visualization, X.Z.; supervision, T.Z.; project administration, T.Z.; funding acquisition, T.Z.

Funding

This work was supported by the Research on HDR Backlight Liquid Crystal Processing Technology Based on Depth Neural Network under Contract HO2018085418.

Conflicts of Interest

The authors declare no conflict of interest.

Appendix A

Algorithm A1 Generate the locations of general sparks
Fori = 1 to n
For j = 1 to s ^ i
R ˜ j = R ¯ i ; /* Initialize spark R ˜ j by the firework R ¯ i , R ¯ j = [ r ¯ 1 , r ¯ 2 , r ¯ i , r ¯ K ] , R ˜ j = [ r ˜ 1 , r ˜ 2 , r ˜ i , r ˜ K ] */
z = r o u n d ( K × r a n d ( 0 , 1 ) ) ; /*Calculate the number of the affected dimensions randomly*/
g = Select_Dimensions ( R ˜ j , z); /*Randomly select z dimensions from R ˜ j */
While (1)
  For k = 1 to K
   If r ˜ k g then
    h = A i × r a n d ( 1 , 1 ) ;/* Calculate the displacement*/
    r ˜ k = r ¯ k + h ;
    If r ˜ k > r max || r ˜ k < r min then
     r ˜ k = r min + | r ˜ k | % ( r max r min ) ;/*Map r ˜ k to the potential space*/
    End if
   End if
  End for
  If Is_feasible ( R ˜ j ) then
   Break; /* Ensure the generated spark location satisfies the constraint condition */
  End if
End while
End for
End for
Algorithm A2 Generate the locations of Gaussian sparks
Forj = 1 to Q ^ /* Q ^ is the number of Gaussian sparks*/
R ¯ r a n d = R a n d _ s e l e c t ( R ¯ ) ; /*Randomly select a firework R ¯ r a n d , R ¯ r a n d = [ r ¯ 1 , r ¯ 2 , r ¯ i , r ¯ K ] */
R ^ j = R ¯ r a n d ; /*Initialize spark R ^ j by R ¯ r a n d , R ^ j = [ r ^ 1 , r ^ 2 , r ^ i , r ^ K ] */
z = r o u n d ( K × r a n d ( 0 , 1 ) ) ; /*Calculate the number of the affected dimensions randomly */
g = Select_Dimensions ( R ^ j , z); /*Randomly select z dimensions from R ^ j */
While (1)
  For k = 1 to K
   If r ^ k g then
     h = G a u s s i a n ( 1 , 1 ) ;/* G a u s s i a n ( 1 , 1 ) is a Gaussian distribution with mean 1 and standard deviation 1 */
     r ^ k = r ¯ k × h ;
    If r ^ k > r max || r ^ k < r min then
     r ^ k = r min + | r ^ k | % ( r max r min ) ;/* Map r ^ k to the potential space */
    End if
   End if
  End for
  If Is_feasible ( R ^ j ) then
   Break; /* Ensure the generated spark location satisfies the constraint condition */
  End if
End while
End for
Algorithm A3 Generate the locations of guided sparks
G = Mix ( R ¯ ,   R ^ ) ; /*Mix all the firework locations and general spark locations into set G, use G ( i ) to present the ith locations in G*/
v = S i z e ( G ) ; /* Get the number of locations in G */
G = S o r t ( G ) ; /*Sort the locations in G according to their quality (from high to low)*/
For j = 1 to Q ˜ /* Q ˜ is the number of the bad locations to be updated */
   R b a d = G ( v + 1 j ) ;/* Select a bad location R b a d , R b a d = [ r b 1 , r b 2 , r b i , r b K ] */
   R g o o d = G ( j ) ;/* Select a good location R g o o d , R g o o d = [ r g 1 , r g 2 , r g i , r g K ] */
   R b e s t = G ( 1 ) ; /* Select the best location R b e s t , R b e s t = [ r s 1 , r s 2 , r s i , r s K ] */
   While (1)
    For k = 1 to K
     r t k = r b k + r a n d ( 0 , 1 ) × ( r s k r b k ) ; /* Generate the guided location R g u i d by the guidance of
             R b e s t , R g u i d = [ r t 1 , r t 2 , r t i , r t K ] */
      If r t k > r max || r t k < r min then
       r t k = r min + | r t k | % ( r max r min ) ; /*Map r t k to the potential space*/
      End if
    End for
    If Is_feasible ( R g u i d )
      Break;
    End if
  End While
  If f( R g u i d ) < f( R b a d )
   G ( v + 1 i ) = R g u i d ;/* Replace the bad location in set G with R g u i d */
  Else
   R g u i d = R g o o d ;
   z = r o u n d ( K × r a n d ( 0 , 1 ) ) ;
   g = Select_Dimensions ( R g u i d , z);
   While (1)
    For k = 1 to K
     If r k g then
      h = G a u s s i a n ( 1 , 1 ) ;
      r t k = r g k × h ; /*Generate new R g u i d based on the Gaussian function*/
      If r t k > r max || r t k < r min then
       r t k = r min + | r t k | % ( r max r min ) ;
     End if
     If Is_feasible ( R g u i d ) then
      Break;
     End if
    End if
   End for
  End While
   G ( v + 1 i ) = R g u i d ;
End if
End for

References

  1. Leccese, F.; Salvadori, G.; Rocca, M. Visual ergonomics of video-display-terminal workstations: Field measurements of luminance for various display settings. Displays 2016, 42, 9–18. [Google Scholar] [CrossRef]
  2. Tsang, S.N.H.; Chan, A.H.S.; Yu, R.F. Effect of display polarity and luminance contrast on visual lobe shape characteristics. Ergonomics 2012, 55, 1028–1042. [Google Scholar] [CrossRef] [PubMed]
  3. Axel, B.; Susanne, M.; Martin, B. The advantage of positive text-background polarity is due to high display luminance. Ergonomics 2009, 52, 882–886. [Google Scholar] [CrossRef]
  4. Wang, A.H.H.; Chen, M.T. Effects of polarity and luminance contrast on visual performance and VDT display quality. Int. J. Ind. Ergon. 2000, 25, 415–421. [Google Scholar] [CrossRef]
  5. Cho, H.; Kwon, O.K. A backlight dimming algorithm for low power and high image quality LCD applications. IEEE Trans. Consum. Electron. 2009, 55, 839–844. [Google Scholar] [CrossRef]
  6. Raman, N.; Hekstra, G.J. Content Based Contrast Enhancement for Liquid Crystal Displays with Backlight Modulation. IEEE Trans. Consum. Electron. 2005, 51, 18–21. [Google Scholar] [CrossRef]
  7. Funamoto, T.; Kobayashi, T.; Murao, T. High-Picture-Quality technique for LCD televisions: LCD-AI. In Proceedings of the International Display Workshop, Kobe, Japan, 29 December 2000; pp. 1157–1158. [Google Scholar]
  8. Hsia, S.C.; Sheu, M.H.; Chien, J.R.C.; Wang, S.K. High-Performance local dimming algorithm and its hardware implementation for LCD backlight. IEEE/OSA J. Display Technol. 2013, 9, 527–535. [Google Scholar] [CrossRef]
  9. Hong, J.J.; Kim, S.E.; Song, W.J. A Clipping Reduction Algorithm Using Backlight Luminance Compensation for Local Dimming Liquid Crystal Displays. IEEE Trans. Consum. Electron. 2010, 56, 240–246. [Google Scholar] [CrossRef]
  10. Mantel, C.; Burini, N.; Nadernejad, E.; Korhonen, J.; Forchhammer, S.; Pedersen, J.M. Controlling Power Consumption for Displays with Backlight Dimming. J. Display Technol. 2013, 9, 933–941. [Google Scholar] [CrossRef]
  11. Lin, F.C.; Huang, Y.P.; Liao, L.Y.; Liao, C.Y.; Shieh, H.P.D.; Wang, T.M.; Yeh, S.C. Dynamic backlight gamma on high dynamic range LCD TVs. J. Display Technol. 2008, 4, 139–146. [Google Scholar] [CrossRef]
  12. Zhang, T.; Zhao, X.; Pan, X.H.; Li, X.; Lei, Z.C. Optimal Local Dimming Based on an Improved Shuffled Frog Leaping Algorithm. IEEE Access 2018, 99. [Google Scholar] [CrossRef]
  13. Zhang, T.; Zhao, X.; An, X.Q.; Quan, H.J.; Lei, Z.C. Using Blind Optimization Algorithm for Hardware/Software Partitioning. IEEE Access 2017, 5, 1353–1362. [Google Scholar] [CrossRef]
  14. Ombuki, B.; Ross, B.J.; Hanshar, F. Multi-Objective Genetic Algorithms for Vehicle Routing Problem with Time Windows. Appl. Intell. 2006, 24, 17–30. [Google Scholar] [CrossRef] [Green Version]
  15. Dervis, K.; Celal, O. A novel clustering approach: Artificial Bee Colony (ABC) algorithm. Appl. Soft Comput. 2011, 11, 652–657. [Google Scholar] [CrossRef]
  16. Wang, K. A new particle swarm optimization algorithm for fuzzy optimization of armored vehicle scheme design. Appl. Intell. 2012, 37, 520–526. [Google Scholar] [CrossRef]
  17. Pedemonte, M.; Nesmachnow, S.; Cancela, H. A survey on parallel ant colony optimization. Appl. Soft Comput. 2011, 11, 5181–5197. [Google Scholar] [CrossRef]
  18. Eusuff, M.; Lansey, K.; Pasha, F. Shuffled frog-leaping algorithm: A memetic meta-heuristic for discrete optimization. Eng. Optim. 2006, 38, 129–154. [Google Scholar] [CrossRef]
  19. Wang, Z.; Bovik, A.C.; Sheikh, H.R. Image quality assessment: From error visibility to structural similarity. IEEE Trans. Image Process. 2004, 13, 600–612. [Google Scholar] [CrossRef]
  20. Tan, Y.; Zhu, Y. Fireworks Algorithm for Optimization. Int. Conf. Adv. Swarm Intell. 2010, 355–364. [Google Scholar] [CrossRef]
  21. Shu, X.; Wu, X.; Forchhammer, S. Optimal local dimming for LC image formation with controllable backlighting. IEEE Trans. Image Process. A Publ. IEEE Signal Process. Soc. 2013, 22, 166–173. [Google Scholar] [CrossRef]
  22. Liao, L.Y.; Huang, Y.P. Blur-Mask approach for real-time calculation of light spreading function (LSF) on spatial modulated high dynamic range LCDs. J. Display Technol. 2010, 6, 121–127. [Google Scholar] [CrossRef]
  23. Mantel, C.; Bech, S.; Korhonen, J. Modeling the subjective quality of highly contrasted videos displayed on LCD with local backlight. IEEE Trans. Image Process. 2015, 24, 573–582. [Google Scholar] [CrossRef] [PubMed]
Figure 1. A local dimming system. LED: light emitting diode; LC: liquid crystal.
Applsci 09 00129 g001
Figure 2. The flow chart of the Fireworks Algorithm (FWA).
Applsci 09 00129 g002
Figure 3. The flow chart of the Guided Fireworks Algorithm (GFWA).
Applsci 09 00129 g003
Figure 4. Comparison of the f(R) values of the four algorithms. LUT: Look-Up Table; ISFLA: Improved Shuffled Frog Leaping Algorithm.
Applsci 09 00129 g004
Figure 5. Test images 1, 2, 3, and 4. Images 1 and 2 are two low contrast ratio images, and Images 3 and 4 are two high contrast ratio images. (a) Image 1, (b) Image 2, (c) Image 3, (d) Image 4.
Applsci 09 00129 g005
Figure 6. The simulation results of image 1. (ad) are the simulated displayed images processed by the four algorithms, the regions in the red circles in (ad) are enlarged and shown in (fi), (e) is the same region of the reference image. (a) GFWA, (b) LUT, (c) FWA, (d) ISFLA, (e) Reference resources, (f) GFWA, (g) LUT, (h) FWA, (i) ISFLA.
Applsci 09 00129 g006aApplsci 09 00129 g006b
Figure 7. The simulation results of image 2. (ad) are the simulated displayed images processed by the four algorithms, the regions in the red circles in (ad) are enlarged and shown in (fi), (e) is the same region of the reference image. (a) GFWA, (b) LUT, (c) FWA, (d) ISFLA, (e) Reference resources, (f) GFWA, (g) LUT, (h) FWA, (i) ISFLA.
Applsci 09 00129 g007aApplsci 09 00129 g007b
Figure 8. The simulation results of image 3. (ad) are the simulated displayed images processed by the four algorithms, the regions in the red circles in (ad) are enlarged and shown in (fi), (e) is the same region of the reference image. (a) GFWA, (b) LUT, (c) FWA, (d) ISFLA, (e) Reference resources, (f) GFWA, (g) LUT, (h) FWA, (i) ISFLA.
Applsci 09 00129 g008aApplsci 09 00129 g008b
Figure 9. The simulation results of image 4. (ad) are the simulated displayed images processed by the four algorithms, the regions in the red circles in (ad) are enlarged and shown in (fi), (e) is the same region of the reference image. (a) GFWA, (b) LUT, (c) FWA, (d) ISFLA, (e) Reference resources, (f) GFWA, (g) LUT, (h) FWA, (i) ISFLA.
Applsci 09 00129 g009aApplsci 09 00129 g009b
Table 1. The MSSIM index and PC values of the four algorithms. GFWA: Guided Fireworks Algorithm; LUT: Look-Up Table; FWA: Fireworks Algorithm; ISFLA: Improved Shuffled Frog Leaping Algorithm.
ImageIndictorGFWAFWAFWAISFLA
1 P C ( % ) 73.3273.3373.3173.33
MSSIM0.88130.81510.86910.8592
2 P C ( % ) 66.2262.2262.2262.22
MSSIM0.94420.91480.94180.9394
3 P C ( % ) 53.4153.4253.4153.42
MSSIM0.82840.78650.82390.8230
4 P C ( % ) 35.2038.1135.0735.05
MSSIM0.90210.83150.89950.8965

