Article

Quantification of Unknown Nanoscale Biomolecules Using the Average-Weight-Difference Method

1
School of Integrative Engineering, Chung-Ang University, Seoul 06974, Korea
2
Division of Bioengineering, Incheon National University, Incheon 22012, Korea
3
Department of Chemical and Biomolecular Engineering, Seoul National University of Science and Technology, Seoul 01811, Korea
*
Author to whom correspondence should be addressed.
Appl. Sci. 2019, 9(1), 130; https://doi.org/10.3390/app9010130
Submission received: 23 October 2018 / Revised: 12 November 2018 / Accepted: 26 November 2018 / Published: 2 January 2019
(This article belongs to the Section Chemical and Molecular Sciences)

Abstract

:
In order to quantify the amount of drug molecules in drug delivery systems, analytical techniques such as high-performance liquid chromatography are used due to their accuracy and reliability. However, the instruments required for such techniques are expensive and not available in all laboratories. Therefore, in this study, we introduce a method that can be a relatively inexpensive and easy to perform drug analysis in almost any laboratory set-up. We have devised the “average-weight-difference method” within the limits of existing spectral analyses. By employing this method, we quantitatively analyzed the amount of isoniazid or doxorubicin molecules loaded onto β-glucan nanoparticles. This proved to be a relatively simple and reliable method and can be used to estimate the amount of nanoscale biomolecules before their analysis through expensive equipment in an environment where the instruments are not readily available.

1. Introduction

To date, extensive studies on drug delivery systems using polymers with excellent biocompatibility and decomposition in vivo have been conducted [1,2,3]. However, quantitative analysis, which measures the content of the drug that is loaded inside the drug delivery carrier, is as important as the successful loading of the drug and delivery to the target. To analyze the drug load, conventional analytical techniques, such as high-performance liquid chromatography (HPLC), liquid chromatography–mass spectrometry (LC/MS), and gas chromatography–mass spectrometry (GC/MS), can be used [4]. These analytical techniques have excellent accuracy, precision, and detection limits, but they have a drawback in that their preprocessing takes a long time and the costs for analysis, constructing the equipment, and maintenance are very high. On the other hand, quantitative analysis methods for measuring the content of drugs loaded in nanoparticles relatively easily include instrumental analysis using an ultraviolet–visible (UV/Vis) spectrophotometer [5,6] and a fluorescence spectrophotometer [7,8]. The linearity of the calibration curve for the standard substance is evaluated and defined as the concentration of the analyte in terms of the absorbance and fluorescence intensity along the y-axis and the x-axis as the concentration. This sets the measurable range. The correlation coefficient (R2) is used to express the linearity, and it is said that it has linearity when the correlation coefficient value is usually 0.995 or more [9]. Based on this, the concentration relative to the measured value of the unknown drug that is loaded in the drug delivery carrier can be calculated. However, in the case of UV/Vis absorption spectroscopy, the absorption band overlaps or interferes with the mixture depending on the material, and simultaneous quantification is often difficult in this case. Thus, it is necessary to separate and purify only the target component, and it is easy to cause loss and error of the sample in this process [10,11,12]. Furthermore, if the analyte is not fluorescent, it cannot be analyzed with a fluorescence spectrophotometer. On the other hand, prior to the development of these analytical methods, researchers have attempted quantification by weight analysis because it is faster and less labor-intensive. Gravimetric analysis can be used to determine the amount of material to be analyzed by sedimenting, drying, and weighing the target analyte [13].
In this study, drug delivery nanoparticles (GluNP) were prepared from β-glucan polysaccharides reported to have immunostimulatory activity. It was confirmed through SEM and FT-IR analysis that it succeeded in loading non-fluorescent isoniazid (INH), a therapeutic agent for pulmonary tuberculosis. However, as described above, since the absorption bands of UV/Vis absorption spectra between synthesized GluNP/INH β-glucan and isoniazid overlap, quantitative analysis through basic instrumental analysis has been limited.
As a method for solving these problems, in this study, the degree of drug loading was calculated by averaging the weight difference between the drug-loaded test group and the untreated control group under the same conditions. We have devised the “average-weight-difference method”, which allows a simple and quick quantitative analysis at a relatively low cost. The target drug was replaced with doxorubicin (DOX), a fluorescent anticancer drug, and the result of the measurement with the average-weight-difference method was compared with that of UV/Vis spectrophotometry and fluorescence spectrophotometry. In the case of DOX, the UV/Vis absorption peak of DOX alone was observed at 481 nm, and compared to isoniazid, it was easier to quantitate DOX by assigning its UV/Vis absorption peak after loading DOX on the β-glucan nanoparticle. This approach may be useful for pre-screening quantitative assays before using expensive equipment for the exact quantification of nanoscale biomolecules in drug delivery applications.

2. Materials and Methods

2.1. Materials

Zymosan A (β-glucan, Glu) from Saccharomyces cerevisiae (Z4250), isoniazid (INH), doxorubicin hydrochloride (DOX) dimethyl sulfoxide (DMSO), and all other chemicals were purchased from Sigma-Aldrich (St. Louis, MO, USA) unless indicated otherwise. A CE dialysis device (SPEG 235029) was purchased from Lab-Supply.

2.2. Synthesis of GluNP/Drug (INH and DOX)

GluNP was prepared according to the previously reported method with a minor modification [14,15]. In brief, glucan powder (Glu, 5 mg) was first dissolved in 1 mL of DMSO at 60 °C for 5 h with stirring to change the triple strands of Glu into random single strands. Then, the targeted drug (5 mg of INH, 1 mg/mL of DOX solution) was added and the mixture was stirred for 2 h at room temperature. After that, it was placed in an ultrasound bath for 1 h to make the nanoparticles. Dialysis was performed against deionized (DI) water at 4 °C for 3 days to remove free drugs (molecular weight cut-off: 1.4 kDa). After dialysis, all samples were harvested from a dialysis tube and transferred to 1.5-mL microtubes.
We then tried to centrifuge the mixture at 10,000× g for 30 min. Finally, the mixture was freeze-dried and stored at 4 °C until further use.

2.3. Characterization of GluNP/INH

GluNP and GluNP/INH were characterized by SEM analysis. GluNP and GluNP/INH were placed on a silicon wafer followed by air drying. SEM images were taken by field-emission scanning electron microscopes (FE-SEM) from Carl Zeiss with Pt coating. Surface functional groups of the samples were analyzed by FT-IR spectroscopy.

2.4. Quantification Analysis

2.4.1. Average Weight Difference

Sartorius Quintix125D-1SKR (Göttingen, Germany) was used for the average-weight-difference method. To minimize the error in the weight measurement between the drug-loaded test group and the untreated test group, the tube weight of the test group before the experiment was first measured. Before the synthesis, the weight of the tube for the drug delivery carrier to which the drug was added as a target substance and the tube for the drug delivery carrier without the drug was respectively measured. After that, all the experimental synthesis reactions proceeded in the previously measured tubes, and all of the experimental groups with and without the drug were subjected to the same conditions except for the addition of the drug. After completion of the dialysis, the test group was transferred to the previously measured tube, freeze-dried for two days, and completely dried. The weight of the test group with the tube was measured, and only the test group was weighed by subtracting the weight of the previously measured tube. The drug-loaded experimental group and the untreated experimental group were each made under the same conditions, and the weight of the drug alone was obtained by subtracting them from each other. The drug amount was quantified by calculating the average of these.

2.4.2. UV/Vis Spectroscopy

The total volume of each experimental group was 1 mL. A standard calibration curve with a correlation coefficient of 0.99 or more was obtained for the reference material (INH, DOX) to be quantified. The drug amount in the carrier was quantified by analyzing the absorbance of the carrier containing the drug and assigning it to the standard calibration curve. The UV/Vis spectrometer used was a BioMate™ 3S Spectrophotometer from Thermo Fisher Scientific (Seoul, Korea).

2.4.3. Fluorescence Spectroscopy

The total volume of the experimental group to be used was 100 μL. Fluorescence analysis was performed at an excitation wavelength of 490 nm and an emission wavelength of 590 nm [16]. In the case of DOX, it was difficult to obtain a linear standard calibration curve at a concentration of 100 μg/mL or more due to the self-quenching phenomenon. A standard calibration curve of 0.99 or more was obtained at 0.8 to 12.5 μg/mL (1/2 serial dilution). Fluorescence analysis was performed by taking 100 μL of the same concentration of the remaining sample after the UV/Vis absorbance analysis and diluting it to half, falling into the range of the standard calibration curve. The fluorescence analyzer used was a Synergy H1 hybrid reader from BioTek (Winooski, VT, USA).

3. Results and Discussion

In a normal condition, the β-glucan polysaccharide, which has a triple-stranded structure, can be dissolved in DMSO, and its structure changes to a single-stranded form as the hydrophobic and hydrogen bonds are broken. When it is returned to pH 7, it has the characteristic of returning to its original triple-stranded structure (this process is called the renaturation process) [17]. In this renaturation process, ultrasound treatment can be used to produce β-glucan self-assembled nanoparticles of 800 to 900 nm (Figure 1) [18]. To load the drug into these nanoparticles, drugs such as INH and DOX are added to the process of β-glucan returning from the single-stranded to the triple-stranded structure. During the renaturation process, the drug can aggregate with β-glucan and be loaded into nanoparticles (Figure 1). To confirm the loading of the drug in the β-glucan particle, surface characterization was carried out by FTIR analysis. The INH amide bond, which was not found in a neat GluNP at 1625 cm−1, was found in GluNP/INH, indicating that the drug was successfully loaded in GluNP.
A standard curve of absorbance and a simple linear relationship between the various concentrations were established based on the range of wavelengths with the maximum absorbance or fluorescence intensity for the sample to be identified. It can be relatively easily quantified by inversely calculating the concentration versus absorbance or fluorescence intensity for an unknown sample. In this study, the UV/Vis absorbance of INH at different concentrations was also confirmed to use this method. In the case of INH, when the concentration was higher than the specific concentration, broadening of the absorbance peak appeared and measurement was impossible. Therefore, it is difficult to select a suitable absorption band for separating one component (e.g., INH) from the mixture (Glu/INH). The highest absorbance peak was observed at 264 nm for the lowest concentration of Glu/INH (Figure 2A) [19]. On the other hand, GluNP had a broad absorption band of 260 to 300 nm, which was superimposed on the absorption band of INH, and there was a limit to the quantitative analysis of individual components (Figure 2B).
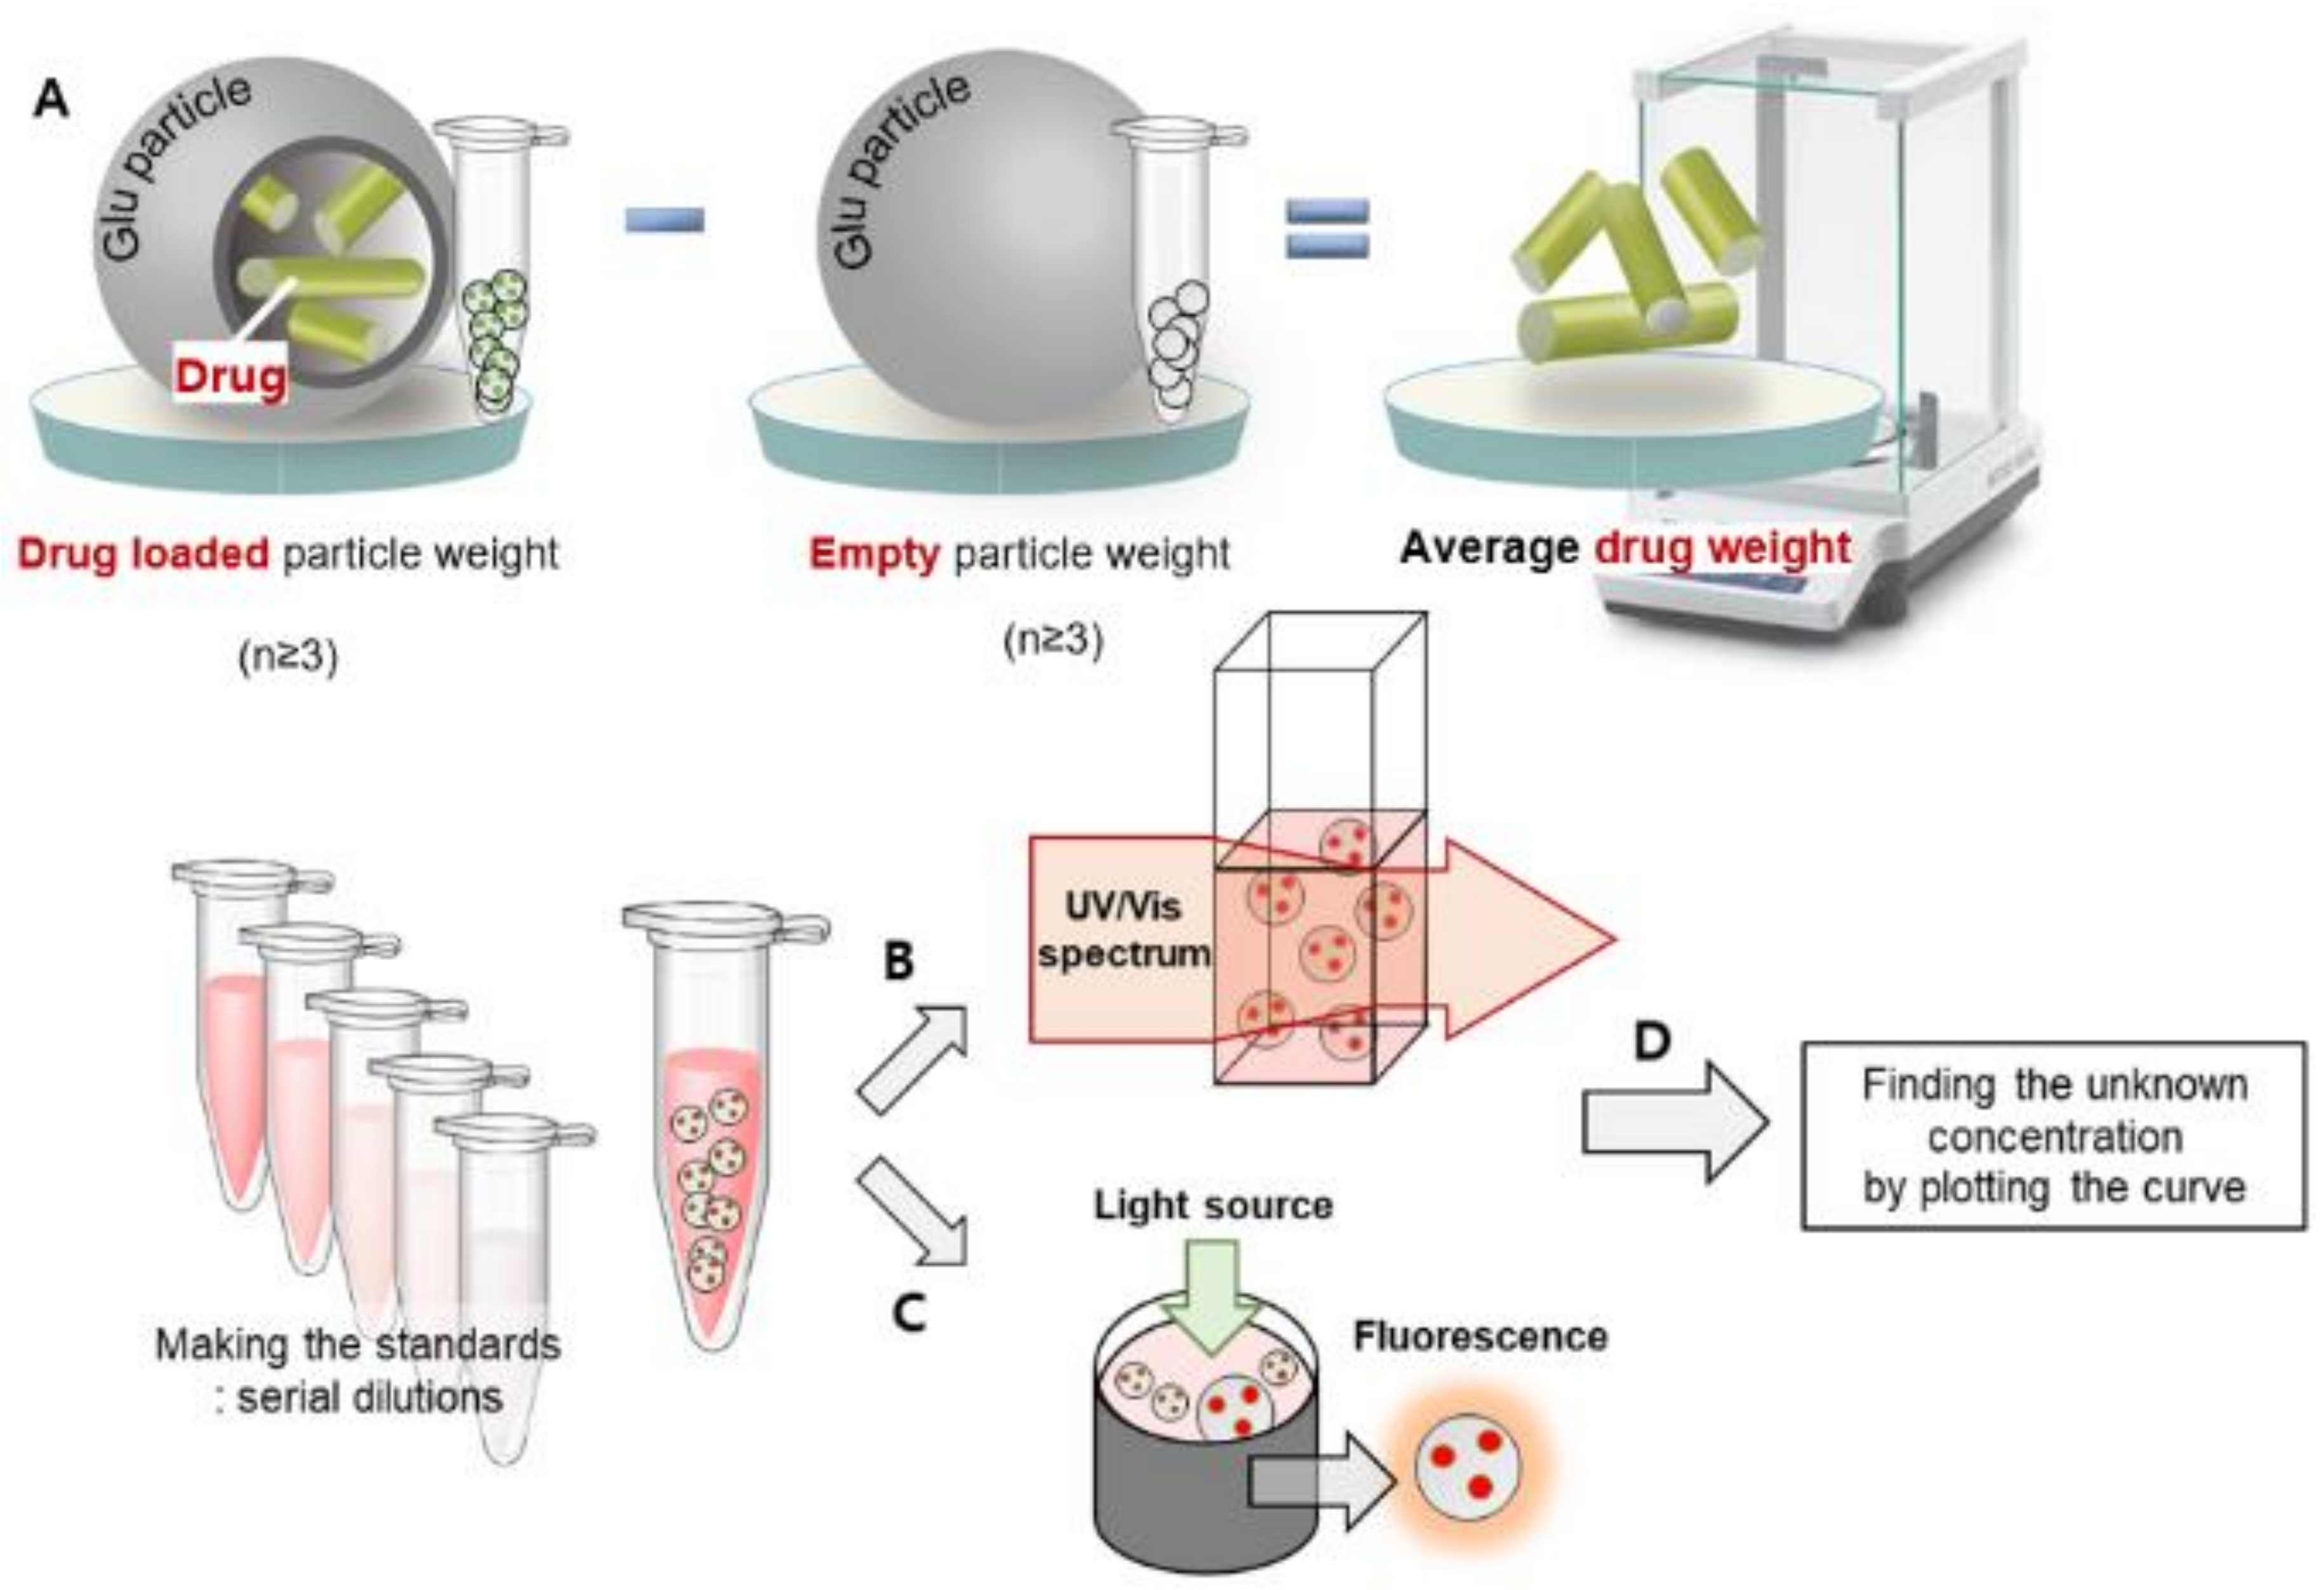
In this study, the quantitative determination of unknown samples using absorbance or fluorescence analysis could not be employed. It is difficult to quantify the INH by absorbance measurement due to the overlap of their peaks with those of Glu, which is a drug carrier of this study. Also, since INH has no fluorescence peaks, it is not possible to quantify them through fluorescence measurements. Therefore, the quantitative analysis of unknown samples was attempted by applying the weight analysis method. As shown in Figure 3, drug-loaded and empty particles were synthesized under the same conditions. After final centrifugation, the target components were precipitated and lyophilized to weigh the two experimental groups precisely. The average-weight-difference method was developed to calculate the average difference between the two, through sufficient experimental repetition to determine the amount of the drug that is loaded in the carrier nanoparticles.
To quantify the amount of INH successfully loaded in GluNP in this study, the average-weight-difference method was used, as shown in Figure 4. In the experiment, we first weighed a 1.5-mL microtube, and after the synthesis was completed for two experimental groups of drug-free test material (GluNP, Figure 4B) and drug-loaded test material (GluNP/INH, Figure 4A), they were completely dried through lyophilization. For each experiment, GluNP/INH and GluNP samples were synthesized three times. After the weight of the samples was precisely measured, the weight of the compound in the tube (GluNP/INH or GluNP) was determined by subtracting the weight of the tube from the experimental group. The content of unknown drug in the drug delivery carrier was calculated by the following equations (Equations (1)–(3)). The weighing process was repeated to reduce measurement error and ensure reliability (Figure 4).
Glu/INH total content, Ai (mg) = (Initial test tube weight before reaction + Glu/INH sample weight after freeze drying) − Initial test tube weight before reaction
Glu total content, Bi (mg) = (Initial test tube weight before reaction + Glu sample weight after freeze drying) − Initial test tube weight before reaction
INH average content   ( mg ) = [ i = 1 n ( A i B i ) ] / n   ( n = 3 )
Six repeated experiments were carried out to confirm the experimental results. The amount of INH in the Glu drug delivery system was 0.1731 mg with a deviation of 6.7%. The environmental factors such as humidity, temperature, or static electricity during the weight measurement may lead to the loss of sample, which may lead to errors in calculating the average weight difference between the sample loaded with the drug and the original sample. Therefore, this average weight difference method can be used to estimate the loaded amount of the drug relatively easily at a low cost, but it is also necessary to consider measures to minimize the preceding environmental factors.
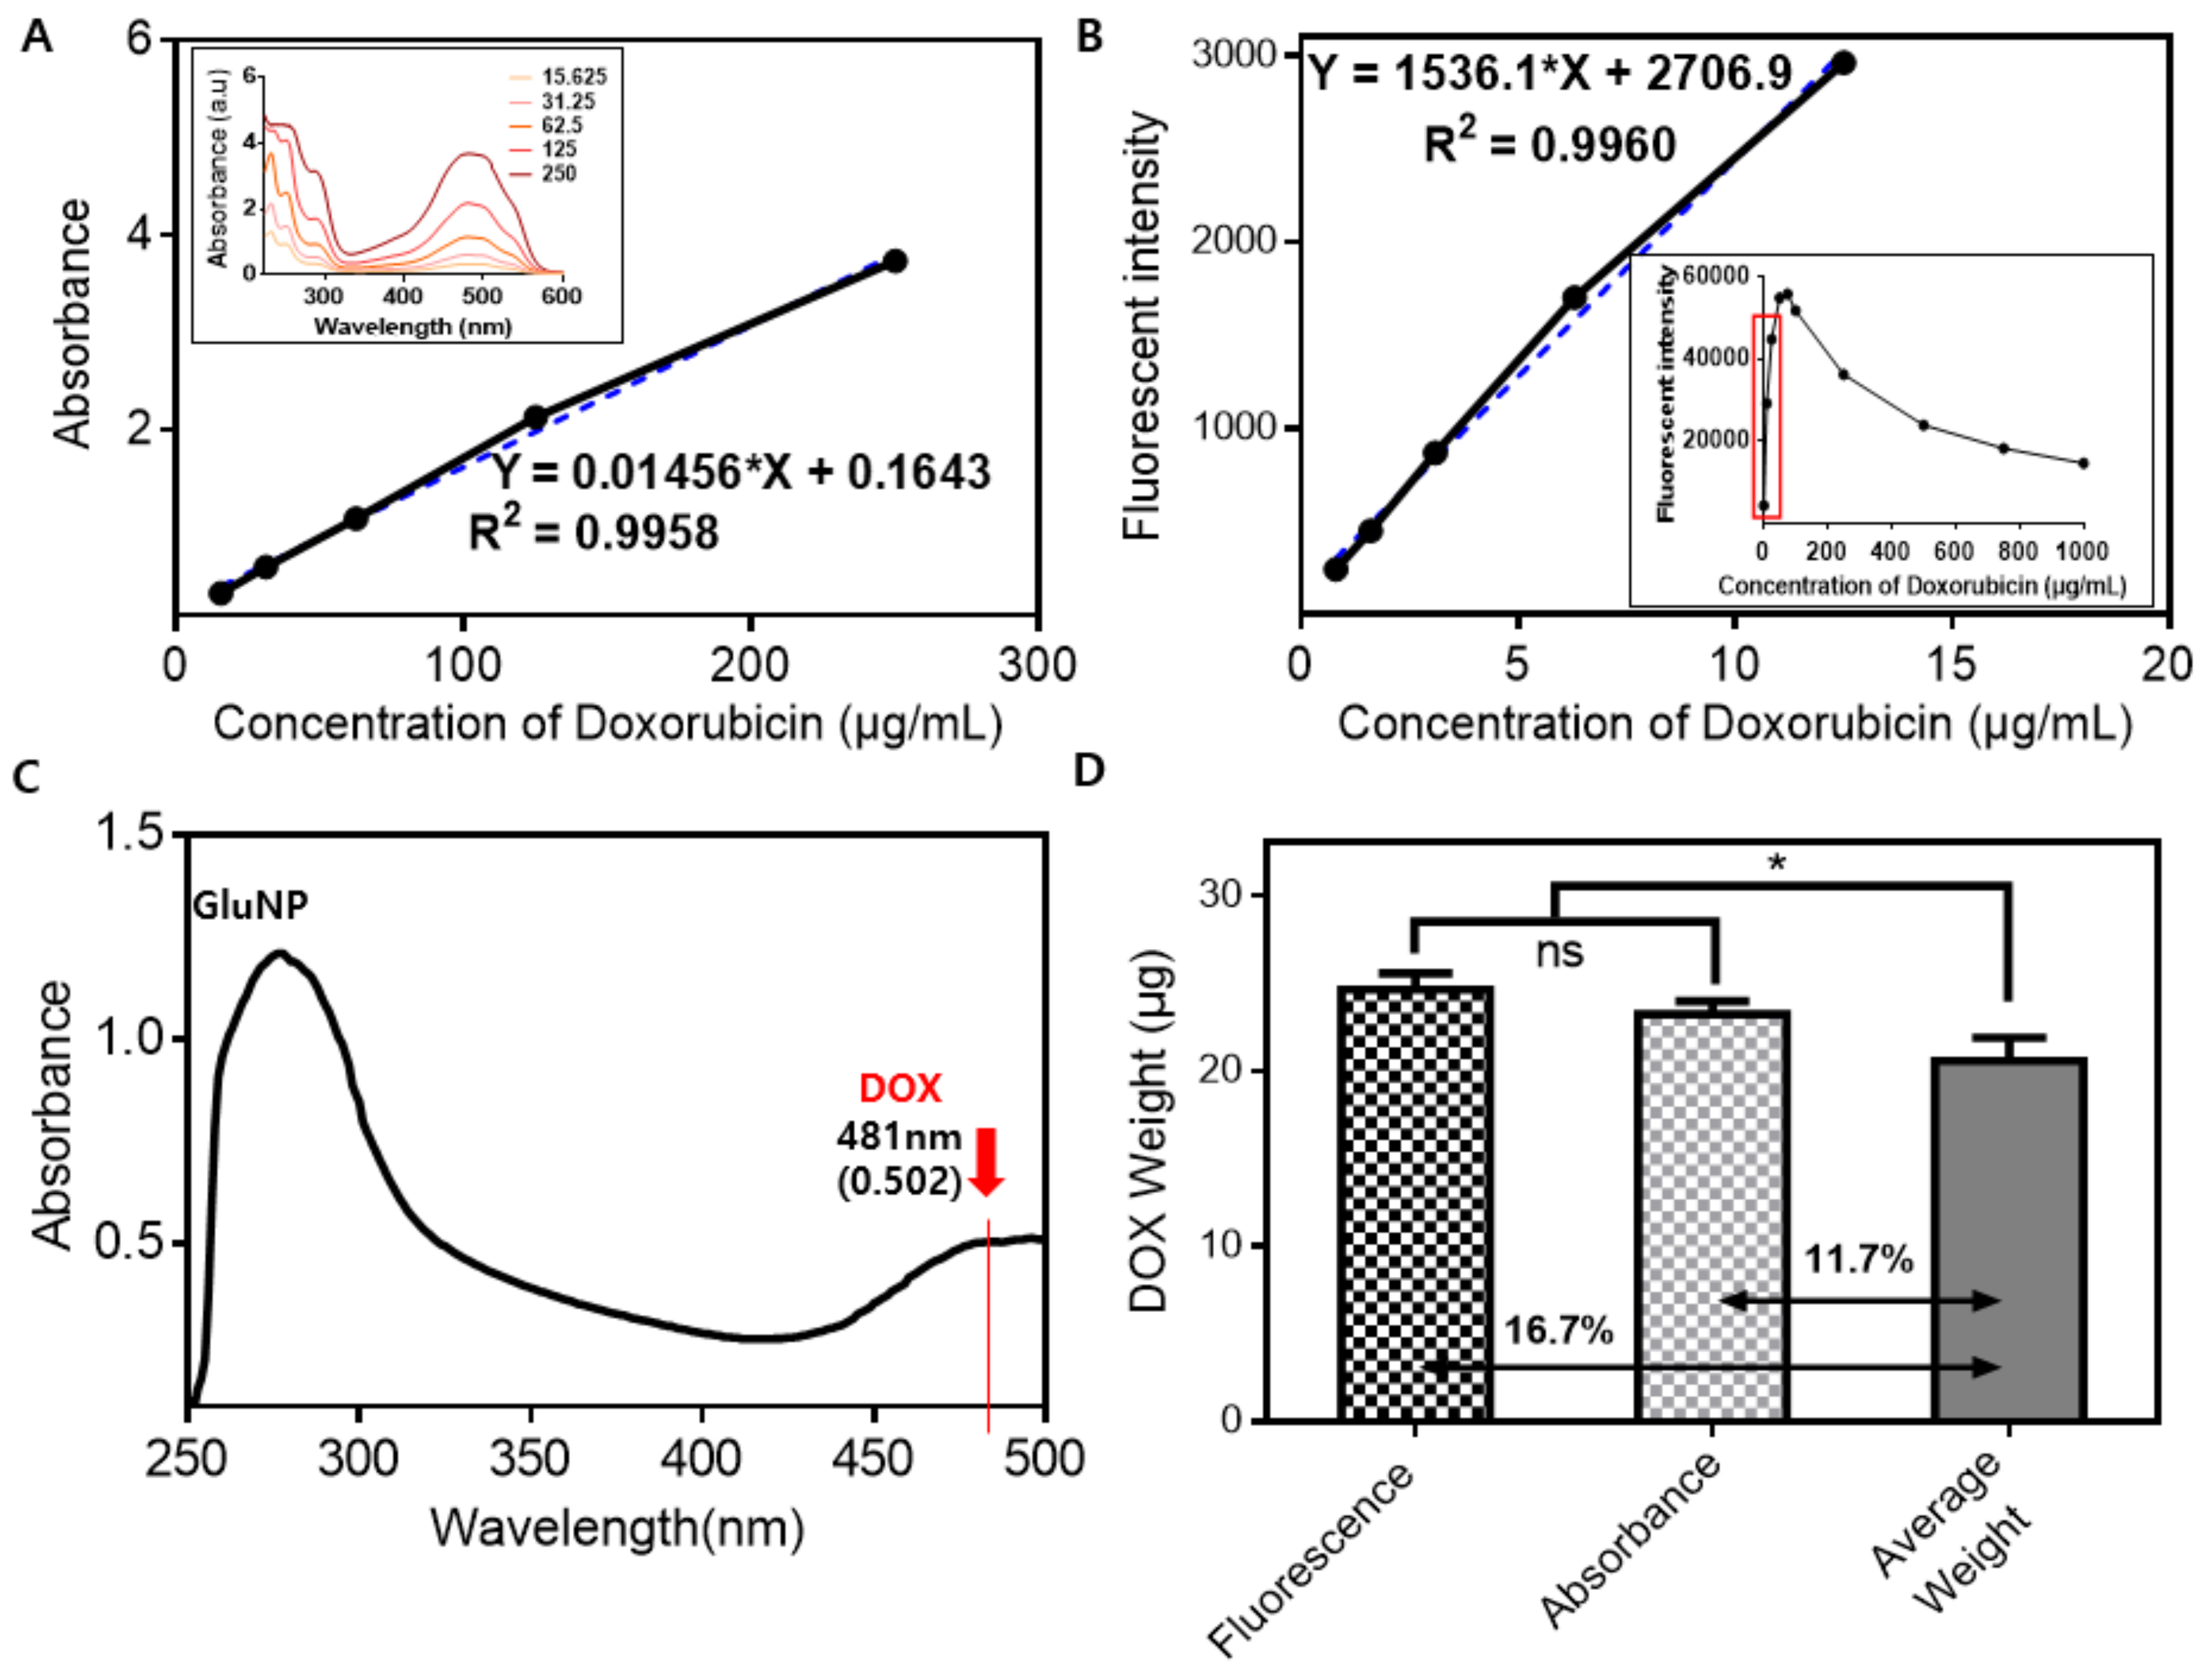
We sought to confirm the reliability of the quantitative analysis of the average-weight-difference method to overcome the difficulty of measuring the amount of INH loaded in the GluNP. DOX has relatively high absorbance and fluorescence peaks, so weight determination based on this is relatively easy. Therefore, we compared the difference between the weight obtained from the absorbance or fluorescence measurement and the result obtained by the average-weight-difference method after loading DOX into GluNP. When the DOX that was loaded into GluNP was diluted to a concentration of 250, 125, 62.5, 31.25, or 15.62 μg/mL and its UV/Vis absorption was measured, peaks were observed in the wavelengths ranging from 231 to 235 nm, 250 to 254 nm, and at approximately 481 nm. To avoid an overlapping absorption band with GluNP, a maximum absorbance value at 481 nm was selected and a standard calibration curve with a correlation coefficient (R2) of 0.99 or more was obtained (Figure 5A). DOX is commonly excited at 475 nm and emits at 590 nm [20]. When the fluorescence intensity was measured at the concentrations of 1000, 750, 500, 250, and 100 μg/mL of DOX, the fluorescence intensity was lowered. It is due to the self-quenching of DOX fluorescence as the concentration of DOX increased, resulting in the non-linear relationship between the concentration and fluorescence intensity [21]. Therefore, fluorescence intensities were measured again at concentrations of 12.5, 6.3, 3.1, 1.6, and 0.8 μg/mL of DOX, and a standard calibration curve with a correlation coefficient (R2) of 0.99 or more was obtained (Figure 5B). When GluNP/DOX was dispersed in DI water and analyzed according to UV/Vis absorbance and fluorescence spectrophotometry, the results were as shown in Figure 5A,B. It had a maximum absorbance value of 0.502 on average at 481 nm (Figure 5C), which could be distinguished from the absorbance of GluNP. The sample was excited at 475 nm and had an average fluorescence intensity of 21,612 when measured at a 590-nm wavelength (Table 1). The concentration of DOX was compared with that of the average weight determination method using the standard calibration curves of each method. The DOX amount was first quantified by GluNP/DOX samples using the average-weight-difference method. The sample was then immediately dissolved in DI water, and the DOX amount was measured by instrumental analysis. Table 1 and Figure 5D show that the DOX amount obtained by the average-weight-difference method for each sample (GluNP/DOX and GluNP, n = 3) was 20.55 μg. The fluorescence analysis showed a 16.7% difference (24.615 μg) and the UV/Vis spectrophotometric method showed an 11.7% (23.211 μg) difference compared with the result from the average-weight-difference method. There was no significant error between the quantitative analyses of the UV/Vis and fluorescence spectrophotometry methods. However, the quantitative analysis of the average-weight-difference method was significantly different from the instrumental analyses. The reason for this difference is that nanoparticle samples were often lost in the course of the experiment and weighing processes, as mentioned above [22,23].

4. Summary

In this study, we devised an average-weight-difference method to estimate the number of nanoscale samples in an environment where the universal quantitative analysis method could not be applied. As an example, the case of a drug molecule, INH, which does not have a distinctive characteristic of absorbance or fluorescence spectrum, was tested. We compared the results of quantitative analysis according to UV/Vis absorbance and fluorescence with those of the average-weight-difference method with DOX and confirmed the reliability of the proposed method. As a result, there was no significant error in the quantification results of the target drugs between the instrumental analysis methods, but the instrumental analysis results and the average-weight-difference method results were found to be significantly different. However, the errors that occurred in the average-weight-difference method have had many external factors leading to the loss of the number of samples during the experiment. In addition, the current method should be carefully considered for small sized (e.g., below 200 nm in diameter) or for low concentrated samples (e.g., below 1 mg/mL) since the measurement errors might be increased. If the protocol can be standardized to solve this problem, this average-weight-difference method can be used as a draft-estimating tool to measure the drug amount loaded in the drug delivery system. Therefore, the future aim of the study is to find a way to improve the practicality of the average-weight-difference method.

Author Contributions

K.L., K.K., H.K. and J.C. designed the experiments. K.L. and Y.C. performed the experiments. K.L., K.K., H.K. and J.C. analyzed the data. K.L. and J.C. wrote the manuscript.

Funding

This study was supported by a grant from the Research Program funded by the National Research Foundation (NRF) funded by the Ministry of Science and ICT (No. 2017M3A7B8061942). This work was also supported by the Research Program funded by the Basic Science Research Program through the NRF (No. 2016R1A1A1A05005262).

Conflicts of Interest

The authors declare no conflicts of interest.

References

  1. Pan, Y.; Li, X.; Kang, T.; Meng, H.; Chen, Z.; Yang, L.; Wu, Y.; Wei, Y.; Gou, M. Efficient delivery of antigen to DCs using yeast-derived microparticles. Sci. Rep. 2015, 5, 10687. [Google Scholar] [CrossRef] [PubMed] [Green Version]
  2. Verma, M.S.; Gu, F.X. 1,3-Beta-Glucans: Drug Delivery and Pharmacology. In The Complex World of Polysaccharides; InTech: Rijeka, Croatia, 2012; Volume 12, pp. 555–572. [Google Scholar]
  3. Soto, E.R.; Caras, A.C.; Kut, L.C.; Castle, M.K.; Ostroff, G.R. Glucan particles for macrophage targeted delivery of nanoparticles. J. Drug Deliv. 2012, 2012, 143524. [Google Scholar] [CrossRef] [PubMed]
  4. Shah, V.P.; Midha, K.K.; Findlay, J.W.; Hill, H.M.; Hulse, J.D.; McGilveray, I.J.; McKay, G.; Miller, K.J.; Patnaik, R.N.; Powell, M.L.; et al. Bioanalytical method validation—A revisit with a decade of progress. Pharm. Res. 2000, 17, 1551–1557. [Google Scholar] [CrossRef] [PubMed]
  5. Belay, A.; Ture, K.; Redi, M.; Asfaw, A. Measurement of caffeine in coffee beans with UV/vis spectrometer. Food Chem. 2008, 108, 310–315. [Google Scholar] [CrossRef]
  6. Hwang, J.; Lee, E.; Kim, J.; Seo, Y.; Lee, K.H.; Hong, J.W.; Gilad, A.A.; Park, H.; Choi, J. Effective delivery of immunosuppressive drug molecules by silica coated iron oxide nanoparticles. Colloids Surf. B Biointerfaces 2016, 142, 290–296. [Google Scholar] [CrossRef] [PubMed]
  7. Dai, X.; Yue, Z.; Eccleston, M.E.; Swartling, J.; Slater, N.K.; Kaminski, C.F. Fluorescence intensity and lifetime imaging of free and micellar-encapsulated doxorubicin in living cells. Nanomedicine 2008, 4, 49–56. [Google Scholar] [CrossRef] [PubMed] [Green Version]
  8. Subedi, R.K.; Kang, K.W.; Choi, H.-K. Preparation and characterization of solid lipid nanoparticles loaded with doxorubicin. Eur. J. Pharm. Sci. 2009, 37, 508–513. [Google Scholar] [CrossRef] [PubMed]
  9. Van Loco, J.; Elskens, M.; Croux, C.; Beernaert, H. Linearity of calibration curves: Use and misuse of the correlation coefficient. Accreditat. Qual. Assur. 2002, 7, 281–285. [Google Scholar] [CrossRef]
  10. Such, V.; Traveset, J.; Gonzalo, R.; Gelpi, E. Stability assays of aged pharmaceutical formulas for thiamine and pyridoxine by high performance thin-layer chromatography and derivative ultraviolet spectrometry. Anal. Chem. 1980, 52, 412–419. [Google Scholar] [CrossRef]
  11. Kitamura, K.; Majima, R. Determination of salicylic acid in aspirin powder by second derivative ultraviolet spectrometry. Anal. Chem. 1983, 55, 54–56. [Google Scholar] [CrossRef]
  12. Choi, J.; Lee, E.K.; Choo, J.; Yuh, J.; Hong, J.W. Micro 3D cell culture systems for cellular behavior studies: Culture matrices, devices, substrates, and in-situ sensing methods. Biotechnol. J. 2015, 10, 1682–1688. [Google Scholar] [CrossRef] [PubMed]
  13. Black, L.; Hamerstrand, G.; Nakayama, F.; Rasnik, B. Gravimetric analysis for determining the resin and rubber content of guayule. Rubber Chem. Technol. 1983, 56, 367–371. [Google Scholar] [CrossRef]
  14. Hwang, J.; Son, J.; Seo, Y.; Jo, Y.; Lee, K.; Lee, D.; Khan, M.S.; Chavan, S.; Park, C.; Sharma, A. Functional silica nanoparticles conjugated with beta-glucan to deliver anti-tuberculosis drug molecules. J. Ind. Eng. Chem. 2018, 58, 376–385. [Google Scholar] [CrossRef]
  15. Goyal, G.; Hwang, J.; Aviral, J.; Seo, Y.; Jo, Y.; Son, J.; Choi, J. Green synthesis of silver nanoparticles using β-glucan, and their incorporation into doxorubicin-loaded water-in-oil nanoemulsions for antitumor and antibacterial applications. J. Ind. Eng. Chem. 2017, 47, 179–186. [Google Scholar] [CrossRef]
  16. Choi, D.; Heo, J.; Park, J.H.; Jo, Y.; Jeong, H.; Chang, M.; Choi, J.; Hong, J. Nano-film coatings onto collagen hydrogels with desired drug release. J. Ind. Eng. Chem. 2016, 36, 326–333. [Google Scholar] [CrossRef]
  17. Sletmoen, M.; Stokke, B.T. Higher order structure of (1, 3)-β-d-glucans and its influence on their biological activities and complexation abilities. Biopolymers 2008, 89, 310–321. [Google Scholar] [CrossRef] [PubMed]
  18. Hwang, J.; Lee, K.; Gilad, A.A.; Choi, J. Synthesis of Beta-glucan Nanoparticles for the Delivery of Single Strand DNA. Biotechnol. Bioprocess Eng. 2018, 23, 144–149. [Google Scholar] [CrossRef]
  19. Markarian, S.; Evangelopoulos, D.; Harutyunyan, L.; Pepoyan, E.; Guzman, J.; McHugh, T.; Bhakta, S. The properties of solutions of isoniazid in water and dimethylsulfoxide. J. Solut. Chem. 2012, 41, 1462–1476. [Google Scholar] [CrossRef]
  20. Bogorad, M.I.; Searson, P.C. Real-time imaging and quantitative analysis of doxorubicin transport in a perfusable microvessel platform. Integr. Biol. 2016, 8, 976–984. [Google Scholar] [CrossRef] [Green Version]
  21. Mohan, P.; Rapoport, N. Doxorubicin as a molecular nanotheranostic agent: Effect of doxorubicin encapsulation in micelles or nanoemulsions on the ultrasound-mediated intracellular delivery and nuclear trafficking. Mol. Pharm. 2010, 7, 1959–1973. [Google Scholar] [CrossRef]
  22. Choi, J.; Tung, S.-H.; Wang, N.S.; Reipa, V. Small-angle neutron scattering measurement of silicon nanoparticle size. Nanotechnology 2008, 19, 085715. [Google Scholar] [CrossRef] [PubMed]
  23. Gajendiran, M.; Choi, J.; Kim, S.J.; Kim, K.; Shin, H.; Koo, H.J.; Kim, K. Conductive biomaterials for tissue engineering applications. J. Ind. Eng. Chem. 2017, 51, 12–26. [Google Scholar] [CrossRef]
Figure 1. Characterization of β-glucan nanoparticles (GluNP). (AC) Scanning electron microscopy (SEM) images of GluNP and drug-loaded GluNP: (A) Control; Scale bar = 2 μm, (B) isoniazid-loaded β-glucan nanoparticles (GluNP/INH); Scale bar = 10 μm, (C) GluNP/doxorubicin (DOX); Scale bar = 3 μm, (D) Fourier transform infrared spectroscopy (FTIR) analysis of synthesized GluNP/INH, (E) lyophilized GluNP samples (left; control-GluNP, middle; GluNP/INH, right; GluNP/DOX).
Applsci 09 00130 g001
Figure 2. UV/Vis absorbance of β-glucan nanoparticles (GluNP), isoniazid (INH) and isoniazid-loaded β-glucan nanoparticles (GluNP/INH) dissolved in deionized water. (A) Aspects of INH absorbance at different concentrations. For higher concentrations above 0.10 mg/mL, it forms a broad band gradually and has a maximum absorbance of INH at 0.10 mg/mL to 264 nm. (B) Comparison of absorbance of GluNP and GluNP/INH. It is difficult to quantify INH since the spectra of GluNP and INH overlap.
Applsci 09 00130 g002
Figure 3. Spectrophotometric method for quantitative analysis of microscopic samples. (A) Schematic description of employing the average-weight-difference method for the analyses of drug molecules loaded onto Glu particles. (B) Schematic introduction of UV/Vis absorption spectrometry analysis for unknown samples. (C) Schematic introduction of fluorescence spectrometry analysis for unknown samples. (D) Quantitative analysis of unknown samples according to each method and comparison with average-weight method.
Applsci 09 00130 g003
Figure 4. Determination of INH amount loaded onto β-glucan nanoparticles by average-weight-difference method. (A) Multiple weighing results of Glu/INH. (B) Multiple weighing results of empty nanocarriers, β-glucan nanoparticles. (C) Confirmation of the average weight values of INH through 6 repeated experiments. (D) The mean value of each experimental group (Number of repeated experiments = 6).
Applsci 09 00130 g004
Figure 5. Comparison of the results of the average-weight-difference method and the spectral method for the quantitative analysis of DOX loaded in Glu. (A) Standard calibration curve of DOX (peak at 481 nm) obtained from UV/Vis absorbance spectra. (B) Standard calibration curve of DOX obtained from fluorescence spectra (Ex. 490 nm, Em. 590 nm). (C) UV/Vis absorbance spectra for GluNP/DOX. ((D), Table 1) Comparison of the results of the average-weight-difference method with the results of absorbance or fluorescence analysis (n = 3).
Applsci 09 00130 g005
Table 1. Assessment of the doxorubicin amounts by three methods in GluNP/DOX.
nAverage WeightFluorescence
(ex 490, em 590)
Absorbance
(481 nm)
GluNP/DOX Weight
(g, ①)
GluNP Weight
(g, ②)
Average Weight Difference
(μg, ①-②)
IntensityAmount of DOX
(μg)
AbsorptionAmount of DOX
(μg)
10.78870.7669521.7521145.324.0070.493522.610
20.79480.7756719.1322458.725.7170.514724.066
30.80870.7879220.7821232.224.1200.499022.988
Average0.79740.77684720.5521612.124.6150.502423.221