Article

Acoustic Target Strength Measurements for Biomass Estimation of Aquaculture Fish, Redlip Mullet (Chelon haematocheilus)

1
Maritime Security and Safety Research Center, Korea Institute of Ocean Science & Technology (KIOST), Busan 49111, Korea
2
Department of Ocean System Engineering, Jeju National University, Jeju 63243, Korea
3
MT-IT Collaborations Center, Gwangju Institute of Science & Technology (GIST), Gwangju 61005, Korea
*
Author to whom correspondence should be addressed.
Appl. Sci. 2018, 8(9), 1536; https://doi.org/10.3390/app8091536
Submission received: 28 July 2018 / Revised: 30 August 2018 / Accepted: 31 August 2018 / Published: 2 September 2018
(This article belongs to the Special Issue Fishery Acoustics, Applied Sciences and Practical Applications)

Abstract

:
Redlip mullet (Chelon haematocheilus) is distributed in coastal waters of the North-Western Pacific Ocean and is a cultured fish in Korea. A hydroacoustic technique constitutes a useful method to assess the biomass and spatial distribution of mullet in sea cages or in coastal waters, and acoustic target strength (TS) information of the target fish is an essential parameter in using this method. In this study, ex situ TS measurements of 16 live mullets were made in an aquaculture sea cage in Korea. The split-beam scientific echo-sounder used for measurements was comprised of 38, 120, 200, and 420 kHz frequencies. An underwater video camera was simultaneously used to observe the mullets’ behavior during the TS measurements. The mullet TS data was analyzed from a wide range of total fish length (FL: 14.3–40.3 cm). As results for all frequencies, the frequency dependence of the mean TS values were relatively low, and the difference in mean TS was within 2.5 dB. When the slope of the least-squares regression line was forced to 20 into the TS equation, the resulting value for the constant term (b20) at each frequency was −67.0 dB, −68.3 dB, −66.3 dB, and −68.5 dB, respectively. The data tended to be frequency dependent. Additionally, the maximum TS appeared between tilt angles of 0° and 10°. These results indicate that TS measurements can be applied to estimate the biomass of the mullet in sea cages or in coastal waters.

1. Introduction

Redlip mullet (Chelon haematocheilus) is a euryhaline species that inhabits both marine coastal water and freshwater environments [1,2]. The species is a commercial aquaculture fish in Korea and has an ecological niche in the marine ecosystem [2,3]. It is widely distributed around the coastal waters of Korea, Japan, Taiwan, and China in the North-Western Pacific Ocean [4]. The young mullet feeds on phytoplankton or small organic sediments in coastal waters and the adult mullet becomes omnivorous [5].
The traditional netting method has been used to measure the abundance of mullet in coastal waters [6]. In addition, the biomass of mullet in aquaculture nets has been estimated by the total wet weight (W) using a scale. As these methods are labor intensive and costly, it is necessary to consider more efficient methods. Since 2000, a hydroacoustic method using the acoustic equipment of fisheries has been implemented to estimate the distribution and abundance of fish in marine and freshwater environments [7]. Hydroacoustic methods are considered to be an efficient way to overcome the limitations of traditional methods [8,9].
The acoustic target strength (TS) of individual fish and volume-backscattering strength (Sv) from fish schools must be obtained using well-calibrated acoustic equipment to determine an accurate biomass of a target fish. The TS information is required in order to convert Sv to absolute fish biomass. The accuracy of the TS information is a key parameter that determines the accuracy of the biomass estimate. Previous studies have reported that the TS information can cause up to 40% of the error in the biomass calculation [7,10].
TS is generally measured directly in in situ or ex situ experiments and indirectly use an acoustic scattering model [11]. The in situ method has the advantage of obtaining TS data in the natural state for the target fish, but it is difficult to distinguish the TS data due to other fish or unwanted fish [12]. The ex situ method uses tethered or caged live fish and has some advantages, such as species identification, tilt angle, and fish information (length and weight), but there is a possibility for error in the TS measurements due to unnatural movements from the artificial control [13]. The acoustic scattering model, based on physical morphology, estimates TS information at various frequencies and fish lengths, but it depends heavily on internal physical characteristic data (body or swim bladder shape, density gradient, and sound speed gradient) of the target fish [14]. There has been a tendency to use all three of these methods together to obtain more accurate TS data.
Considering labor and costs, acoustic methods that use high frequencies are a very efficient methods for obtaining rapid biomass estimates of cultured Redlip mullet (Chelon haematocheilus). Unfortunately, there is very little information about TS measurements and related information on this mullet species.
The purpose of this study was to measure the TS of cultured Redlip mullet, which is the key parameter for estimating biomass using the acoustic technique. As a result of this study, we derived the relationship between the TS function and the total fish length (FL, cm) or wet weight (W, g) at frequencies of 38, 120, 200, and 420 kHz. Furthermore, we tried to understand TS characteristics based on the swimming angle.

2. Materials and Methods

2.1. Fish Species and Experimental Apparatus

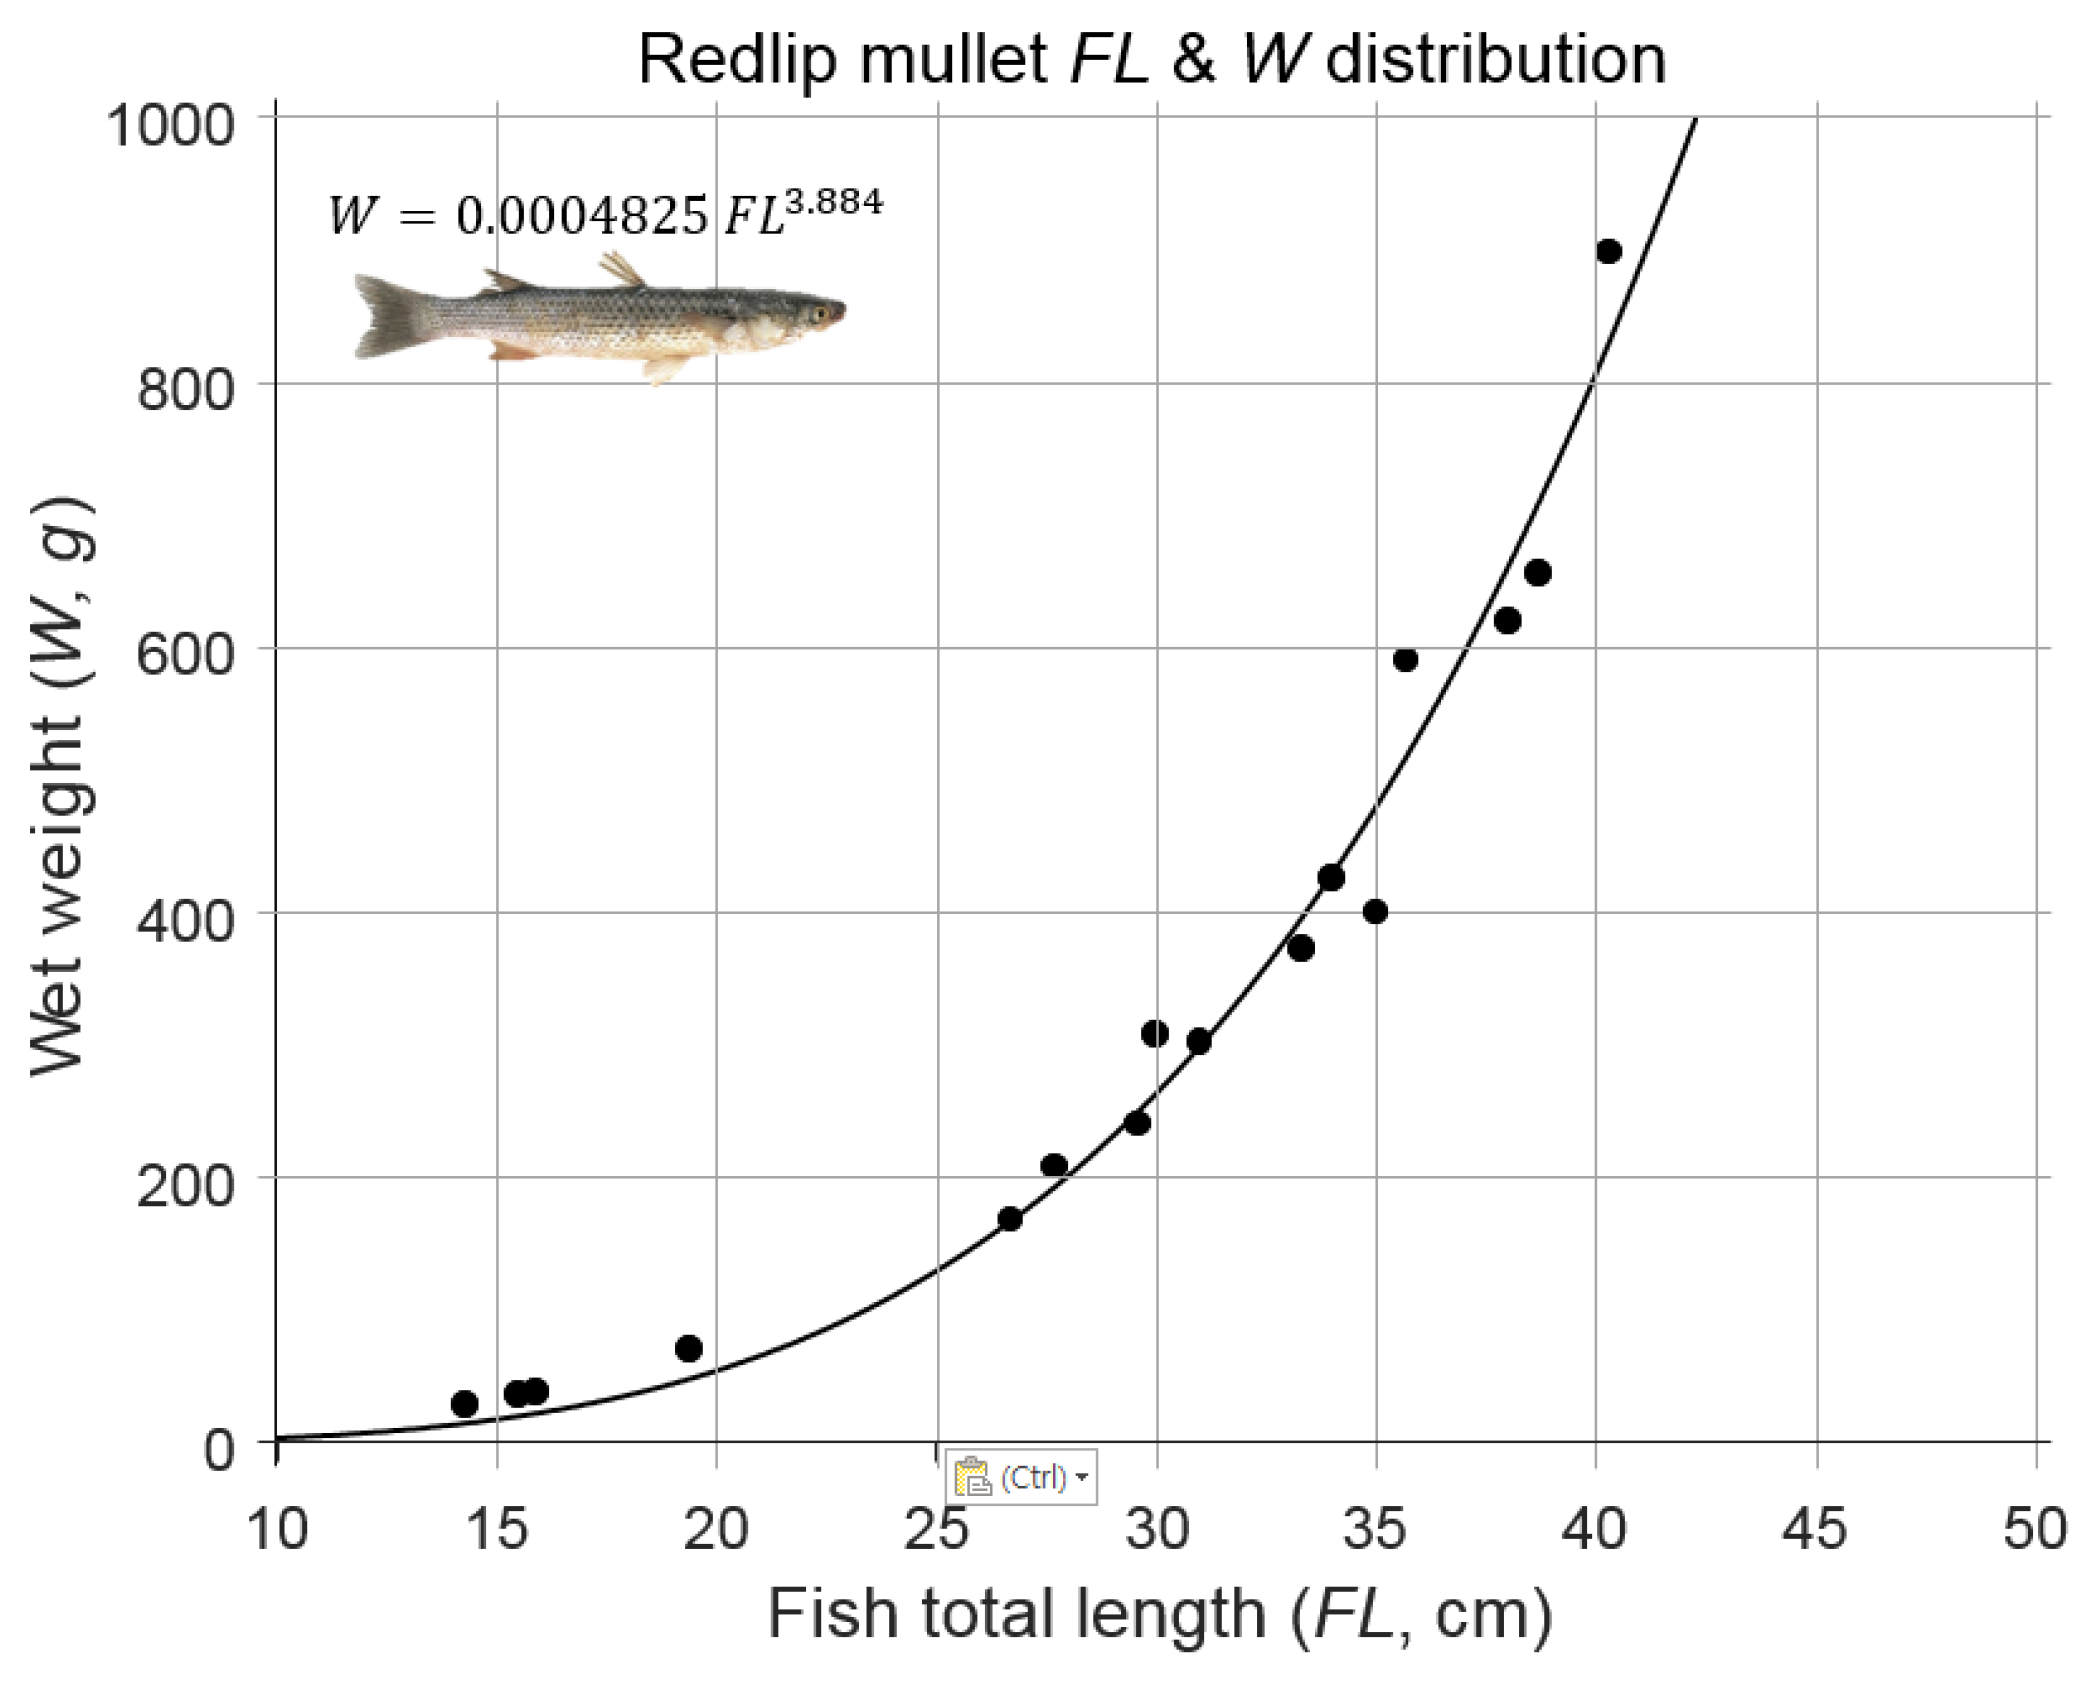
Redlip mullets were sampled on the commercial aquaculture farm around the coastal waters in the South Sea of Korea. The mullets were held in sea cages for 2 weeks during adaptation at the Marine Research Center, Korea Institute of Ocean Science & Technology (KIOST). TS was measured on a large floating fish farm (6 m width × 12 m length) platform. Total depth of the fish farm was about 14.0 m. To conduct TS measurements on fish of various lengths, we collected data from 16 fish among well-adapted fish in seawater. The maximum FL and W of the collected fish were about 40 cm and about 900 g (Figure 1).
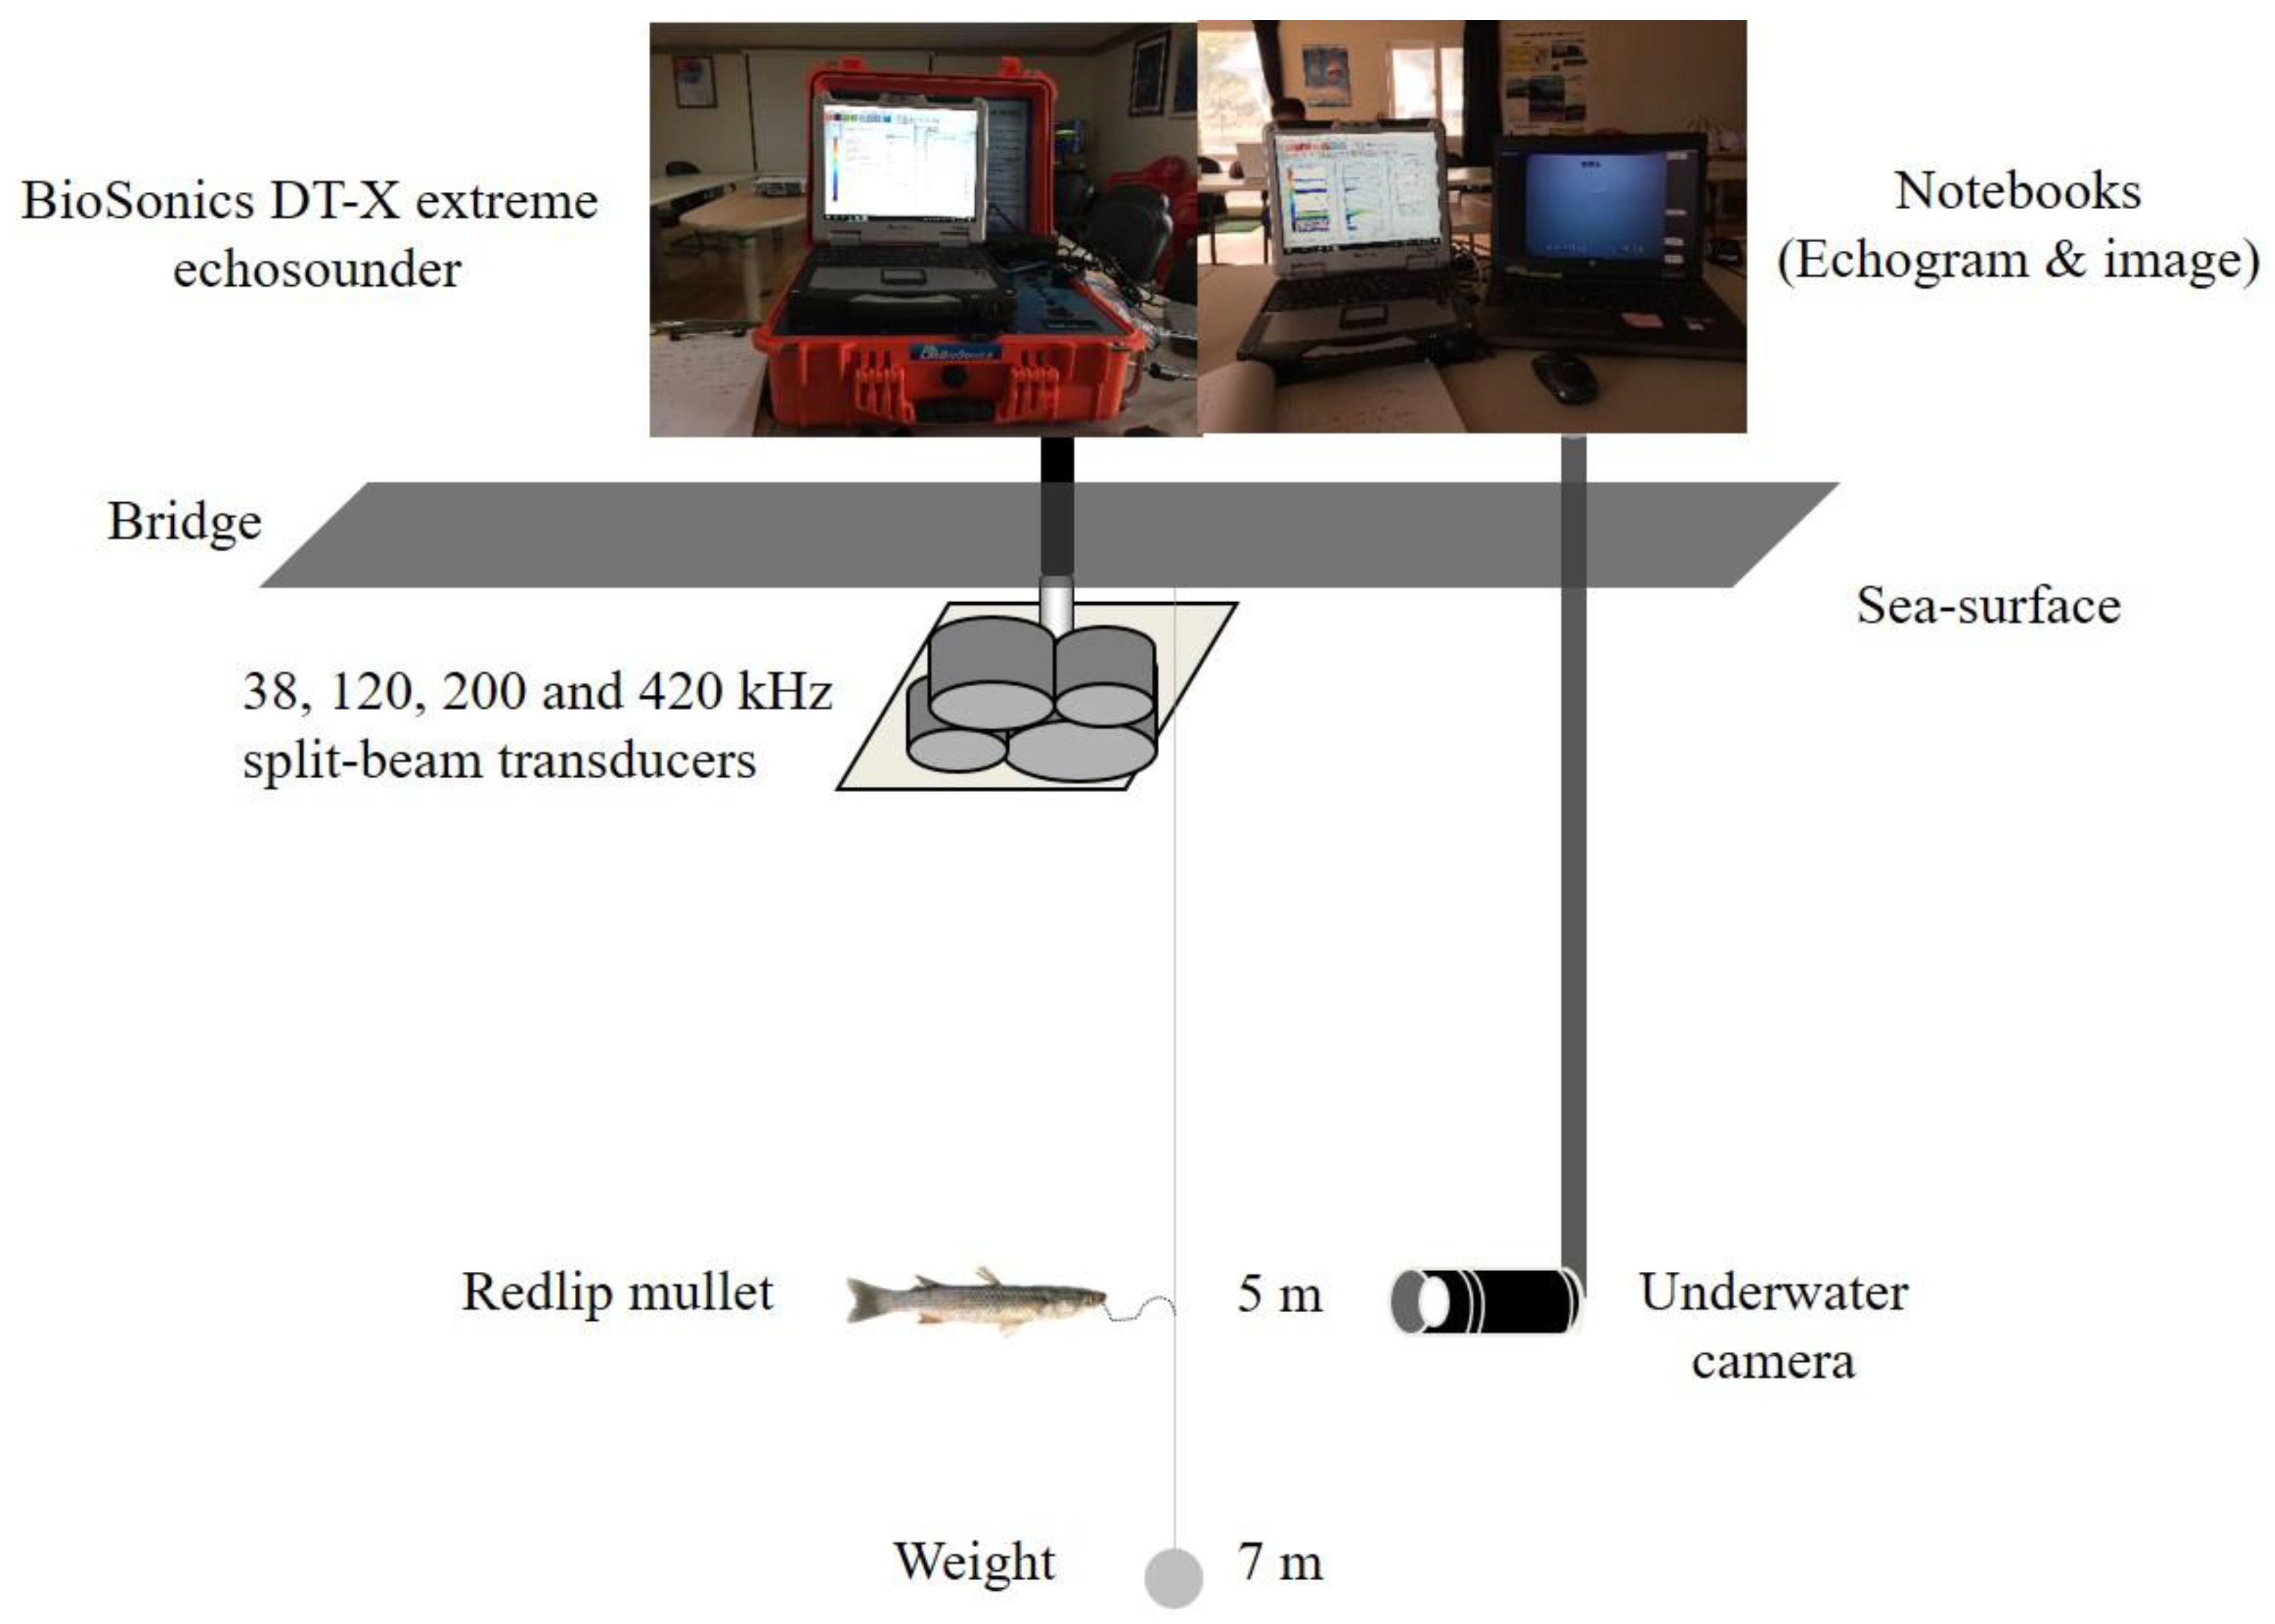
Each live mullet was tethered with a very small monofilament line attached to its mouth after anesthetizing the fish (FA100, 4-allyl-2-methoxyphenol). When the mullet awoke from the anesthesia in the water, the line was tied to a vertical line that slowly descended to a depth of 4.5–5.5 m. The end of the vertical line was tied to a 2.0 kg weight. The distance between the tethered mullet and its weight was about 2.0 m, which was sufficient to separate the signal of the weight and the TS signal of the fish from all TS signals (Figure 2). The tethered mullet remained in a good condition throughout the experiment. After the ex situ TS measurements, the FL and W of individual mullets were measured with a scale and balance, and the fish were shock frozen immediately.

2.2. TS Measurement

Ex situ TS measurements were collected from 16 live mullets at frequencies of 38, 120, 200, and 420 kHz with a split-beam transducer type echo-sounder (DT-X extreme; BioSonics, Inc., Seattle, WA, USA). The transducers were mounted about 0.5 m below the sea surface, facing in a downward vertical direction (Figure 2). Before the TS measurements, each transducer was calibrated using a tungsten-carbide calibration sphere. To reduce TS measurements from unwanted small fish, the minimum threshold level of the TS value was set to −60 dB for each frequency. When the fish was out of the acoustic-axis for an extended period, TS was measured by rotating the transducer body so that the fish was positioned near the acoustic axis.
The pulse duration and ping rate for all frequencies was set to 0.2 ms and 2 pings/s, respectively, considering the distance from the transducer’s face to the fish. The detailed echo-sounder settings are listed in Table 1.
An underwater video camera (Water-7000DX; Tsukamoto Co. LTD., Suzuka, Japan) was installed at a depth of about 5.0 m in the horizontal direction to observe the behavior and tilt angle of the mullet during the TS measurements. The depth corresponded to the depth of the experimental fish used to measure TS. Both the transmitting time of the transducer and the recording time of the underwater video were synchronized before the TS measurements. The data from the underwater camera were used to analyze the influence of the swimming angle on the TS data. The measuring times of the TS data and the underwater video data were approximately 20–40 min, considering the number of TS data and the behavior of the fish.

2.3. Data Analysis

The TS data was analyzed from the 16 live mullets. The measured TS data from the mullet among the total TS data within the water column were extracted using the specific Target collection and TS distribution module in Visual Analyzer software (Ver. 4.3) provided by the equipment manufacturer [15].
To remove unwanted TS data and to obtain the valid data, we used criteria that satisfied both conditions simultaneously; target depth and off-axis position. Considering that the depth of activity of the tethered mullet was 4.5–5.5 m, only the TS data that satisfied the depth range among all TS data was extracted. The half beam widths of the transducers used in the TS experiments were ±4.6° at 38 kHz, ±3.9° at 120 kHz, ±3.45° at 200 kHz, and ±3.5° at 420 kHz. Considering the compensated TS value with beam width, only the TS data to be positioned within the half beam-width angle at each frequency were extracted. We calculated the mean TS value using only the TS data that satisfied both of the above conditions simultaneously.
All selected TS data was converted to the backscattering cross-section ( σ b s = 10 T S / 10 ) for the linear value, which was used to calculate the mean TS values [16]. The mean TS was defined by
mean TS = 10 log10σbs/ni)
The analysis was performed using three linear fitting models (Equations (2)–(4)) [17]. The TS functions were fitted to the mean TS data using the least-squares regression with FL and W:
TS = m log10(FL, cm) + b
TS = 20 log10(FL, cm) + b20
TS = m log10(W, g) + b
where m is the slope (20 is the standard slope) and b and b 20 are the intercepts, respectively [17].
The TS value is strongly affected by the tilt angle of the fish. In order to select the TS data that can judge the tilt angle, only the underwater images that can visually measure the angle were extracted. From the captured underwater image data, the tilt angle was estimated from the gradient of a straight line connecting the head to the tail. The tilt angle between the incident wave and the fish was defined as a positive angle (+) when the head was upward and a negative angle (−) when the head was downward.

3. Results

In this experiment, the seawater temperature was 13 °C, and salinity was 32 psu, so the speed of sound was 1496.7 m/s [7]. The 16 live mullets were judged to be in good condition during the experiments. Their total fish length (FL, cm) ranged from 14.3 cm to 40.3 cm (mean FL = 29.07 cm) and their wet weight (W) ranged from 28 g to 898 g (mean W = 335 g). The relationship between the FL and W is: W = 0.0004825, FL3.884 (r2 = 0.97).
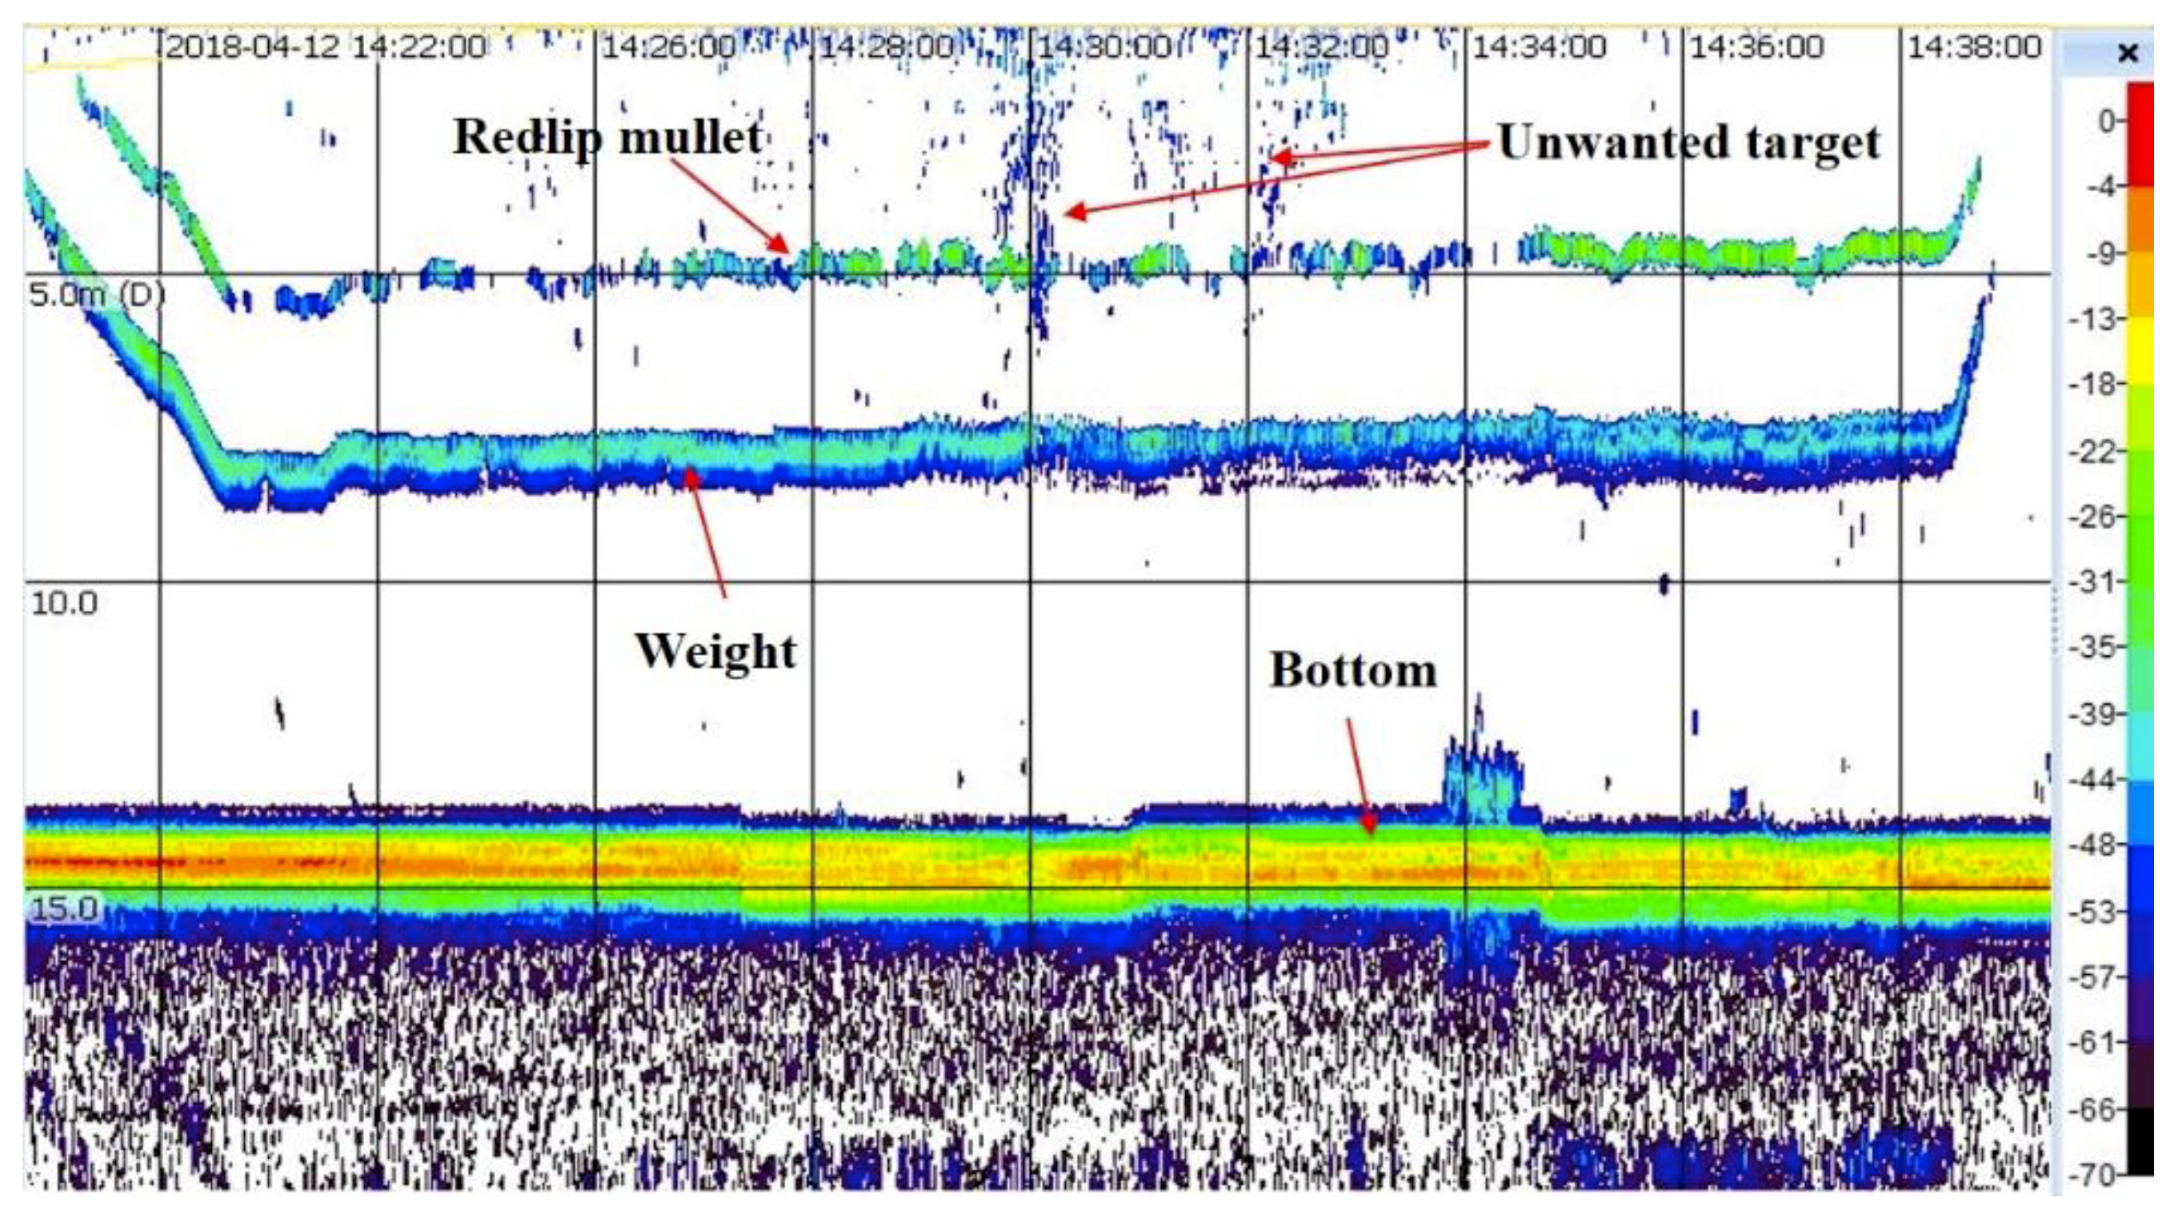
Figure 3 shows a sample echogram of a mullets TS measurement (FL: 35.0 cm, 200 kHz). In the echogram, the TS data from the mullets were fully separated from unwanted surface targets, weight, and the bottom. The relatively low TS value (about −50 dB) at the beginning of the measurement was likely to be due to the unstable condition of the mullet at the tethered depth. The higher TS values (about −33 dB) show that the mullet was stable with an approximate ±5° tilt angle. The mean TS for mullet was calculated from the TS data obtained between 14:26 and 14:38.
Representative samples of the TS distributions at 38, 120, 200, and 420 kHz are shown in Figure 4. Generally, the TS of a fish with a large motion during TS measurements have a typical Rayleigh distribution, and thus the deviation of the mean TS tends to be large. However, the TS data measured in this study show similarity with the Gaussian distribution, and thus show relatively stable mean TS values. The numbers of valid TS data (745 at 38 kHz, 656 at 120 kHz, 454 at 200 kHz, and 460 at 420 kHz) were considered to be sufficient to calculate a mean TS value for mullet. The TS values for mullet, ranged from −52.4 dB to −30.6 dB at 38 kHz, −58.4 dB to −28.6 dB at 120 kHz, −57.0 dB to −26.4 dB at 200 kHz, and −59.2 dB to −27.0 dB at 420 kHz. The mean TS values from the data were −37.4 dB at 38 kHz, −37.4 dB at 120 kHz, −34.6 dB at 200 kHz, and −36.6 dB at 420 kHz.
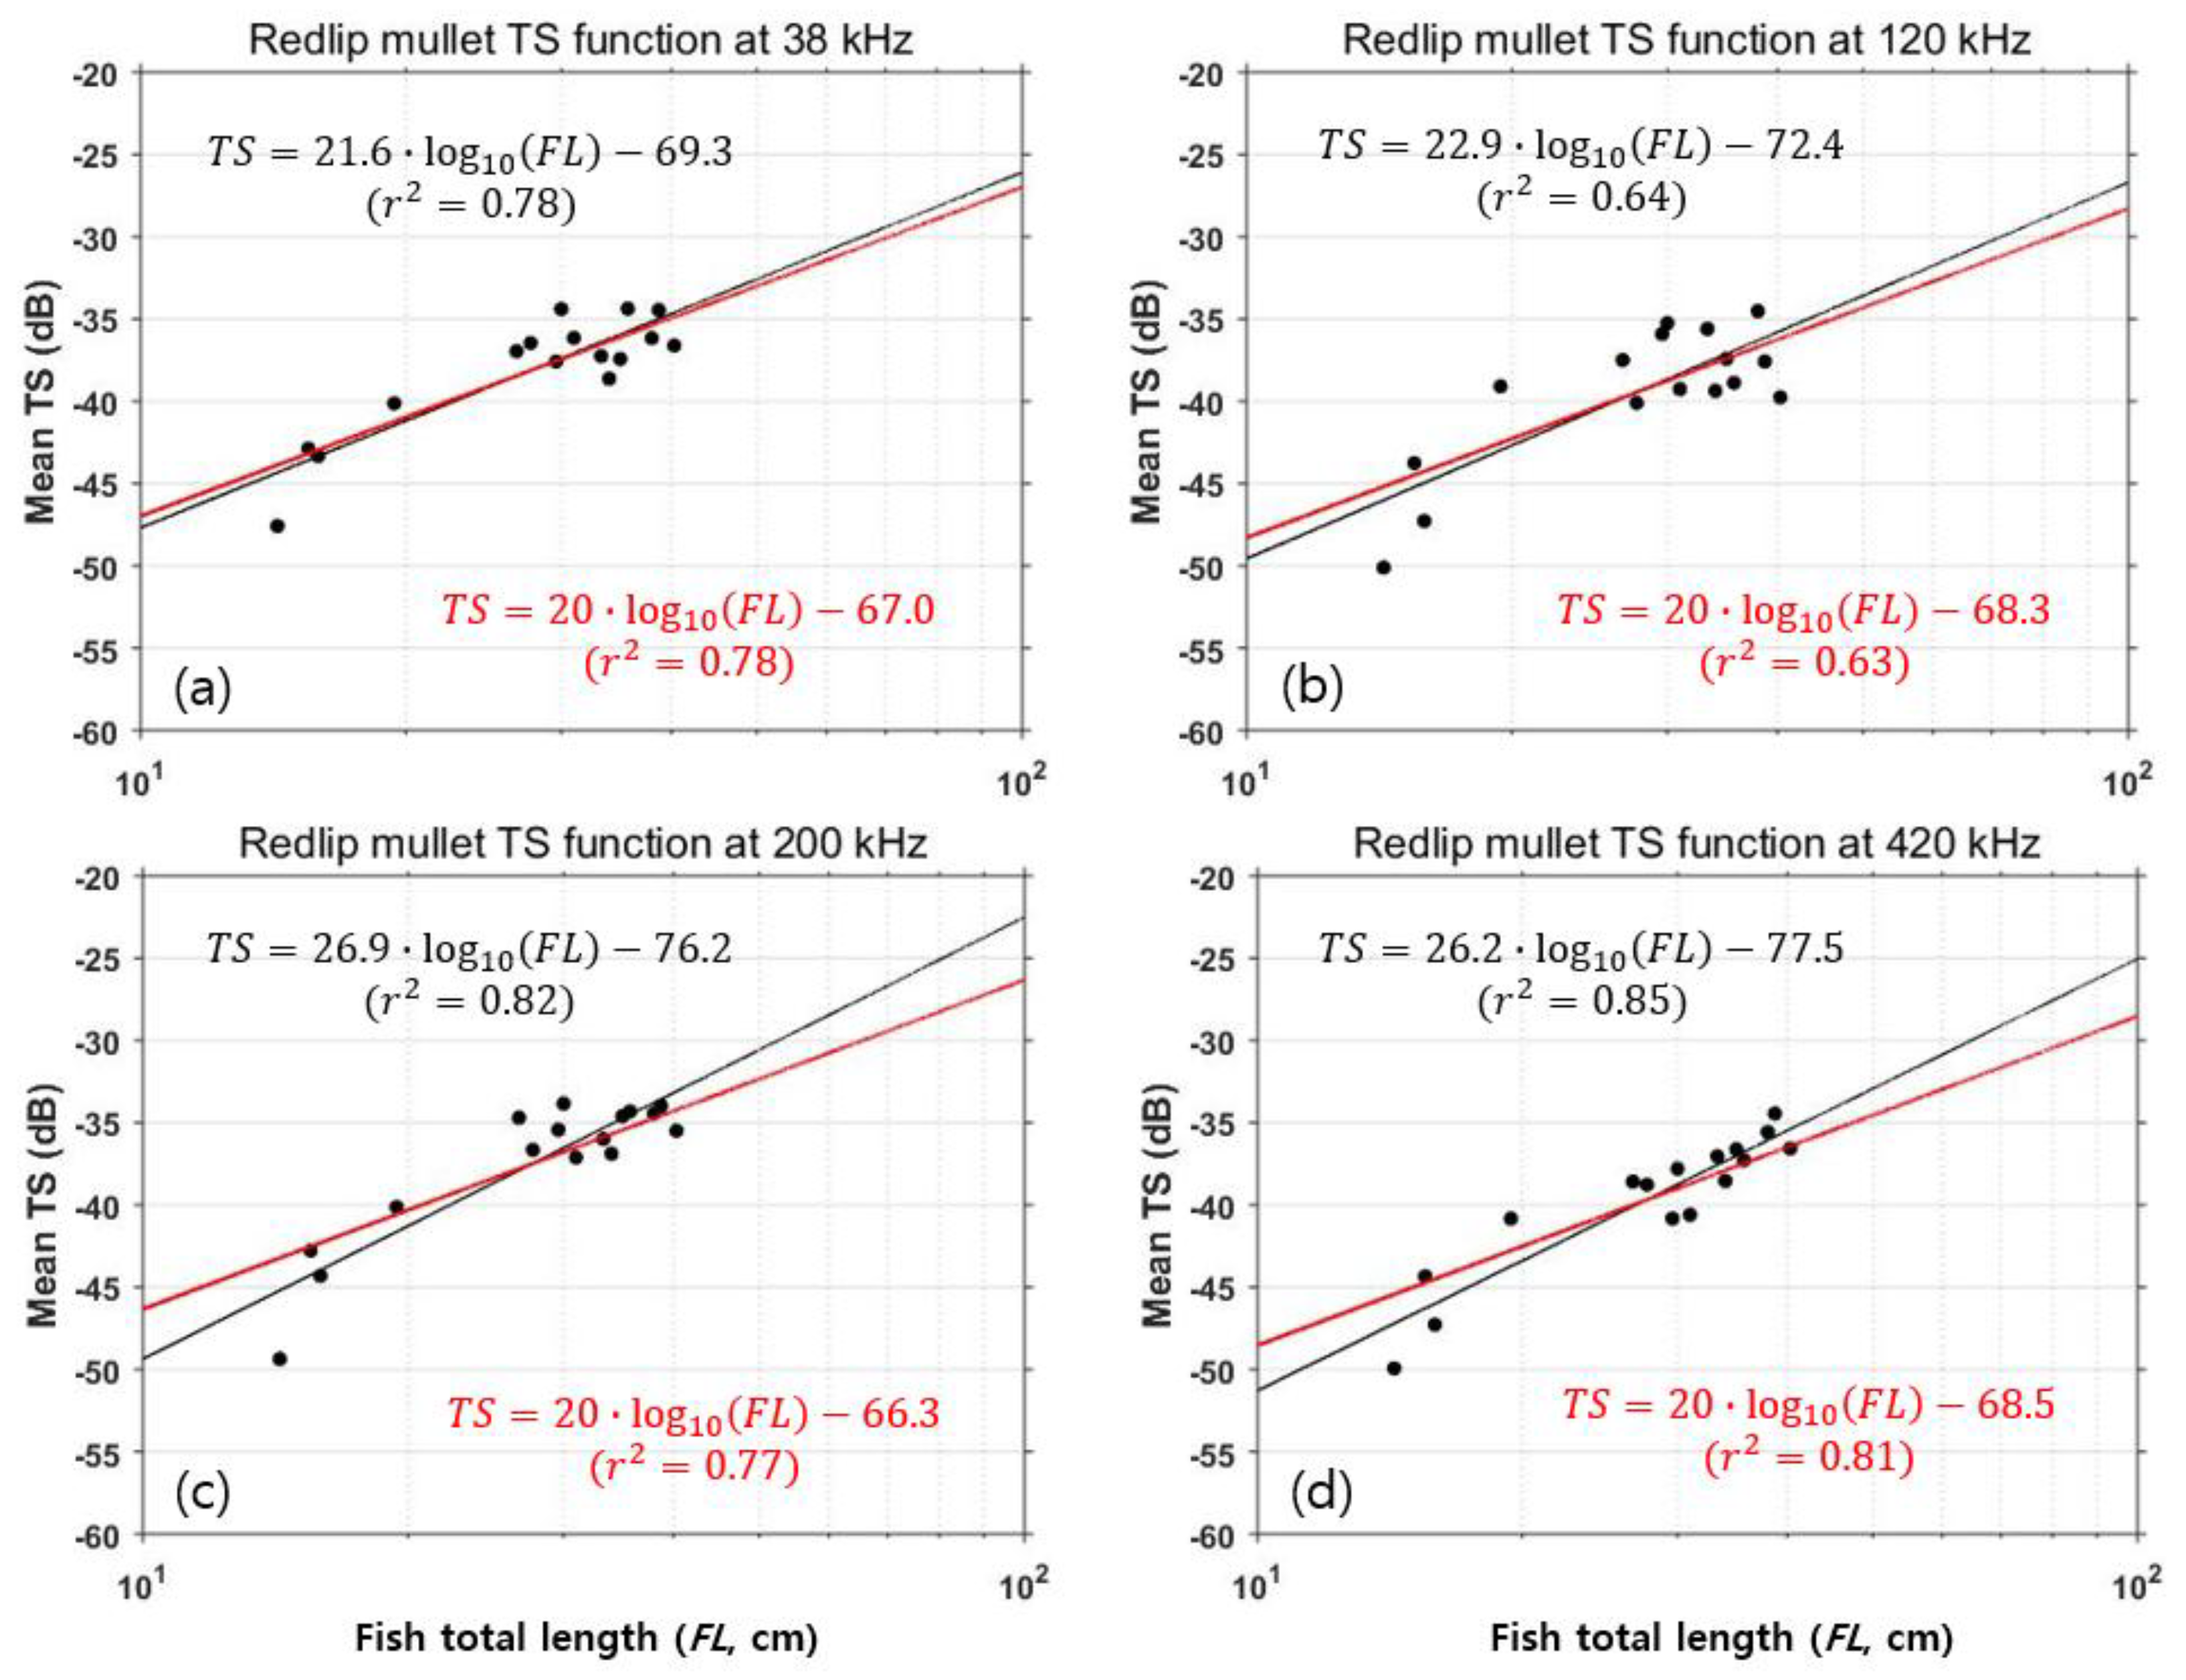
Figure 5 shows the relationships between the mean TS and the FL at each frequency. The black points are the mean TS values from the 16 mullet, which ranged from −47.6 dB to −34.4 dB at 38 kHz, −50.1 dB to −34.5 dB at 120 kHz, −49.4 dB to −33.8 dB at 200 kHz, and −49.9 dB to −34.4 dB at 420 kHz. Considering the mean TS values for all frequencies, the difference in the maximum mean TS was within 1 dB and the difference in minimum mean TS was 2.5 dB. These results indicate that the frequency dependence of the mean TS value was relatively low.
From Equation (2) using the mean TS data, it is determined by the least-squares regressions of mean TS with FL. The TS functions at all frequencies were fitted for Redlip mullet (Figure 5),
T S 38   kHz = 21.6 · log 10 ( F L ) 69.3 ( 95 %   CI : 15.1   to   28.1   and 78.8   to 59.8 ;   r 2 = 0.78 ) ,
  T S 120   kHz = 22.9 · log 10 ( F L ) 72.4   ( 95 %   CI : 13.0   to   32.7   and 86.7   to 58.1 ;   r 2 = 0.64 ) ,
  T S 200   kHz = 26.9 · log 10 ( F L ) 76.2   ( 95 %   CI : 19.7   to   34.0   and 86.6   to 65.8 ;   r 2 = 0.82 ) ,
  T S 420   kHz = 26.2 · log 10 ( F L ) 77.5   ( 95 %   CI : 20.0   to   32.5   and 86.5   to 68.5 ;   r 2 = 0.85 ) ,
where r 2 is the coefficient of determination, and CI is the confidence interval for m and n. The mean TS values for each frequency were calculated from the standard fits of the TS function (see Equation (3)). The relationships between mean TS and FL were derived with the following equations (Figure 5):
  T S 38   kHz = 20 · log 10 ( F L ) 67.0     ( 95 %   CI :   67.9   to 66.1 ;   r 2 = 0.78 )
  T S 120   kHz = 20 · log 10 ( F L ) 68.3   ( 95 %   CI :   69.7   to 66.9 ;   r 2 = 0.63 )
  T S 200   kHz = 20 · log 10 ( F L ) 66.3   ( 95 %   CI :   67.5   to 65.2 ;   r 2 = 0.77 )
  T S 420   kHz = 20 · log 10 ( F L ) 68.5   ( 95 %   CI :   69.5   to 67.5 ;   r 2 = 0.81 )
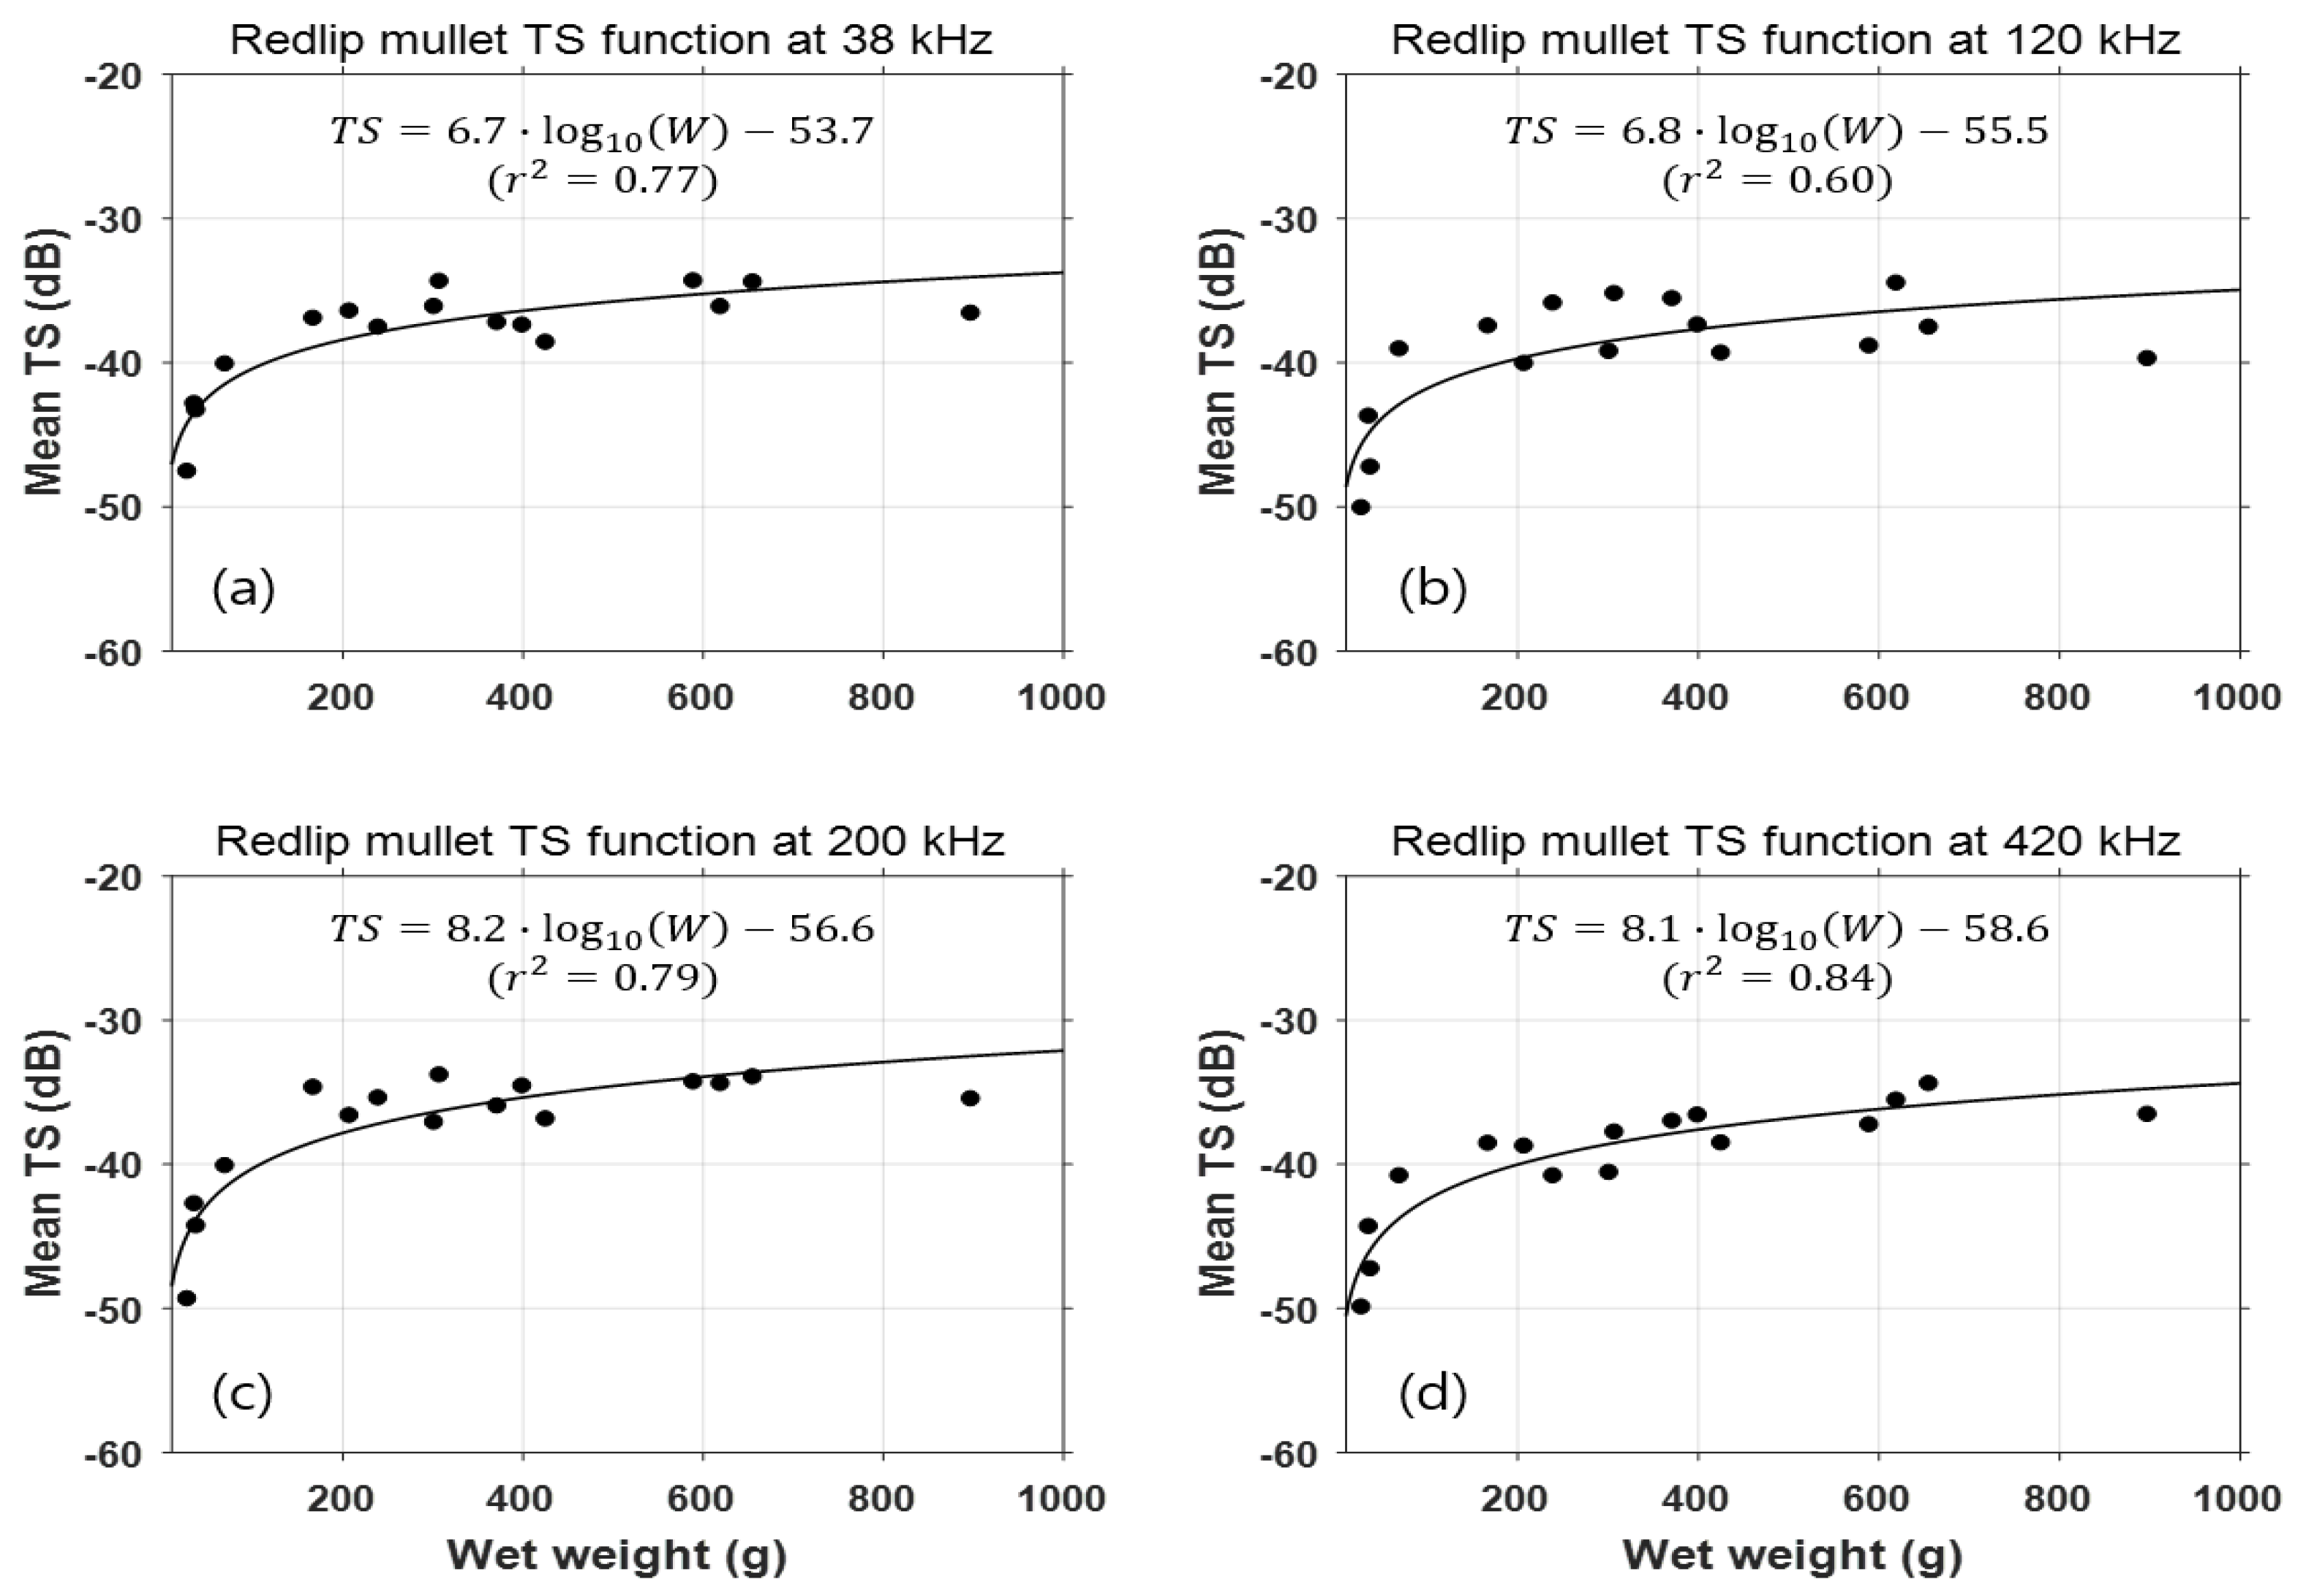
The relationships between mean TS and W at each frequency were derived using Equation (4). The relationships between the mean TS and W were derived with the following equations (Figure 6):
  T S 38   kHz = 6.7 · log 10 ( W ) 53.7   ( 95 %   CI : 4.6   to   8.7   and 58.7   to 48.8 ;   r 2 = 0.77 ) ,
  T S 120   kHz = 6.8 · log 10 ( W ) 55.5   ( 95 %   CI : 3.6   to   10.1   and 63.2   to 47.7 ;   r 2 = 0.60 ) ,
  T S 200   kHz = 8.2 · log 10 ( W ) 56.6     ( 95 %   CI : 5.7   to   10.6   and 62.4   to 50.8 ;   r 2 = 0.79 ) ,
  T S 420   kHz = 8.1 · log 10 ( W ) 58.6   ( 95 %   CI   : 6.0   to   10.1   and 63.4   to 53.7 ;   r 2 = 0.84 ) ,

4. Discussion

According to fisheries statistical data, about 5839 tons of mullet were cultured in 2012, which was 7.7% of the total amount of fish cultured in Korea [18]. Redlip mullet is a valuable aquaculture species in the northwest Pacific Ocean that is mainly cultured along the coast of the Yellow Sea and the South Sea of Korea [3,4,19]. Until now, the traditional method of weighing was used to calculate the biomass of mullet on a fish farm [6]. This method requires a high cost, time, and human labor to estimate biomass. Using a hydro-acoustic method is an alternative way to overcome these limitations [7].
Research and development of an automatic fish-counter system, based on the hydroacoustic technique, are underway in Korea. One of the most important parameters for applying this system to a fish farm is to understand the acoustic TS characteristics of the target fish. The TS information of Redlip mullet was unknown before this study.
In fisheries acoustics, the target strength (TS) functions are essentially required to convert volume backscattering strength (Sv) to absolute fish biomass. The accuracy of the TS information is a key parameter that determines the accuracy of the biomass estimate. In more detail, the Sv value within depth intervals can be changed to volume-backscattering area (SA) for every one nautical mile of survey transect. By assuming that measurements of Sv represent the linear sum of echoes from individual fish within the sample volume, the numerical density of fish (number per unit area of sea surface) can be estimated by dividing SA by the backscattering cross-section ( σ b s , m2) of a single fish. Biomass density of fish (ρ, g m−2) can be estimated by multiplying the numerical density by the weight of a single fish [20].
The TS of individual fish is influenced by the tilt angle and the volume of the swim bladder. As the volume of the swim bladder in the body is difficult to calculate directly, the mean TS is expressed as a function of fish length or weight. Generally, the larger the fish length, the greater the swim bladder volume, and hence the larger the TS. The swim bladder is the most important factor affecting the TS of fish. In particular, it is known that more than 90% of the TS value is related to the size of the swim bladder [7]. Generally, a higher TS value is obtained when the tilt angle between the incident wave and the swim bladder area is perpendicular.
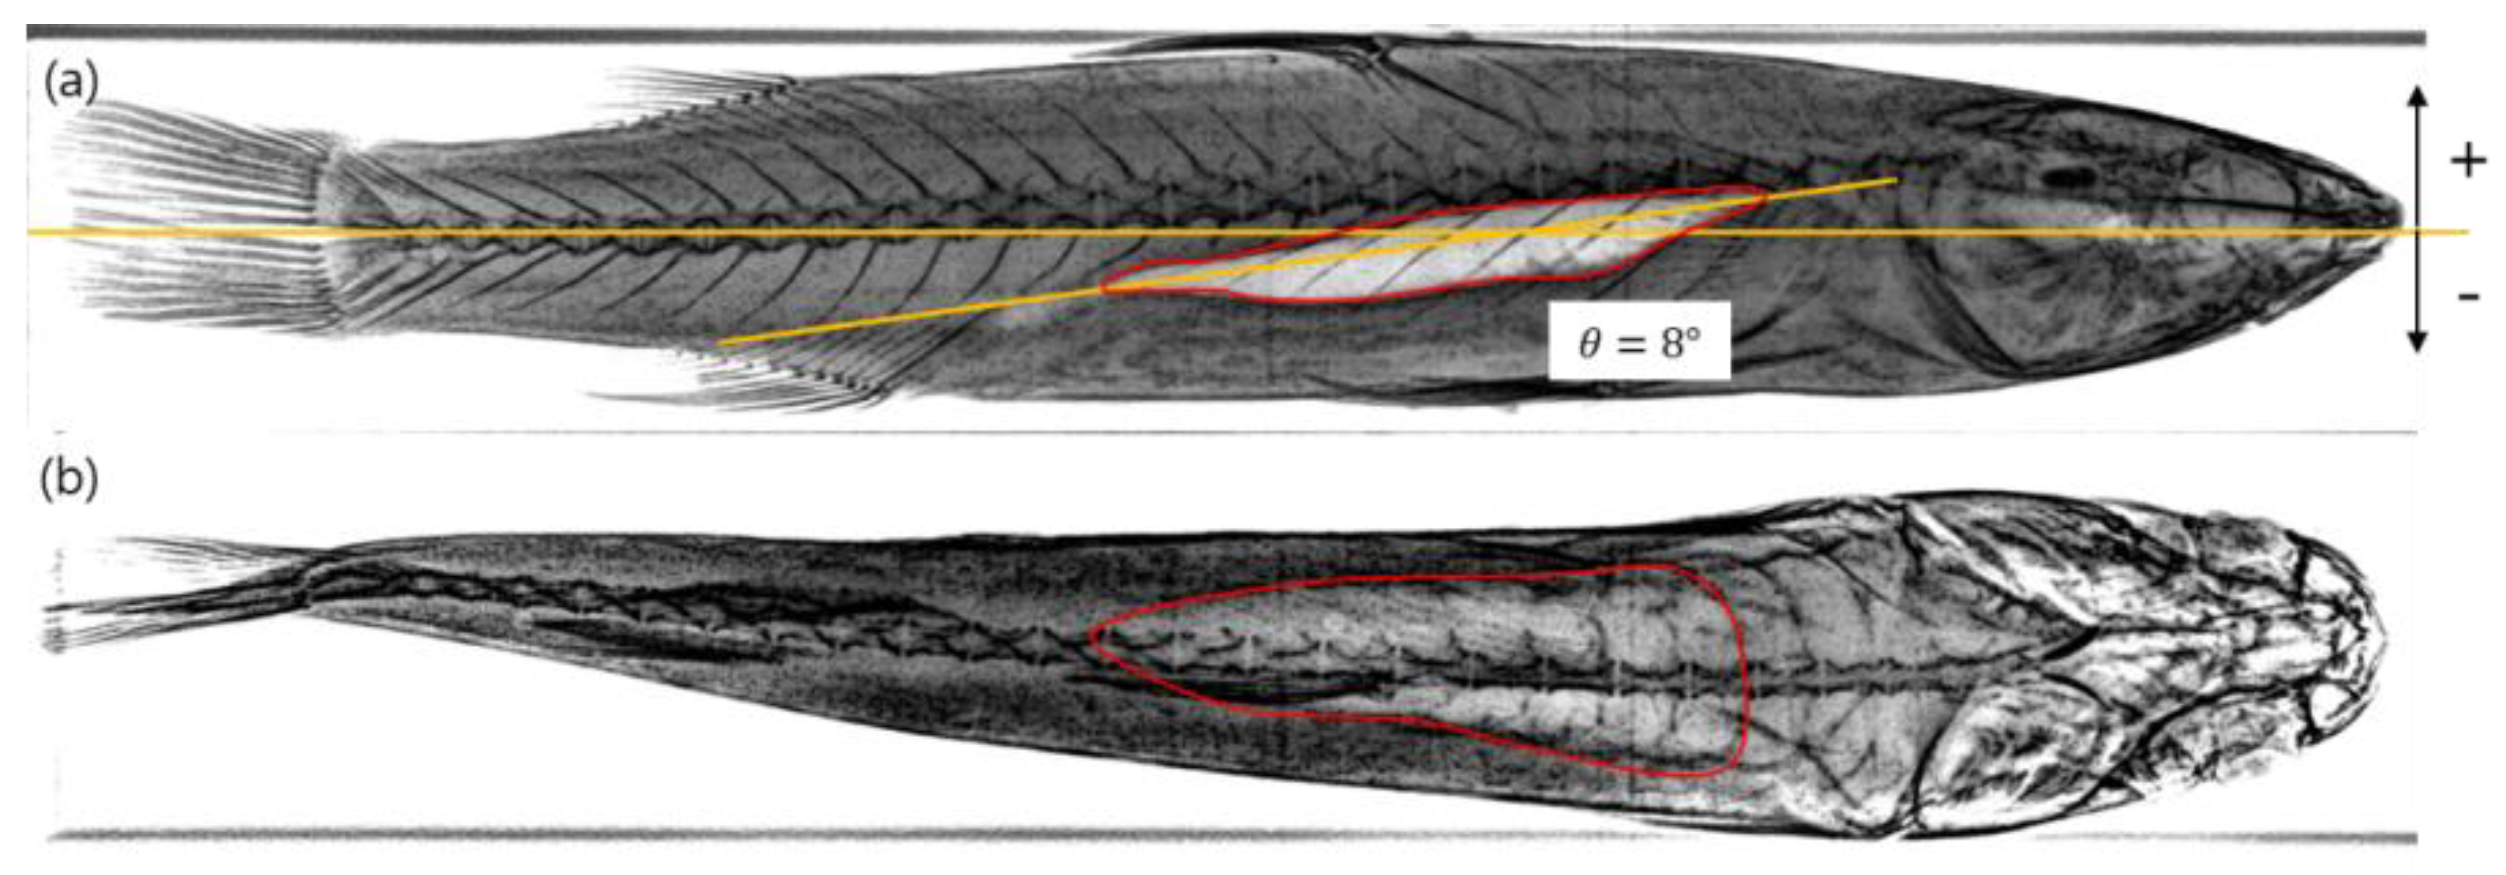
After the TS experiments, the swim bladder shapes were obtained using radiography (M-1005; Softex, Mumbai, India). The lateral and dorsal views were acquired from X-ray images of frozen mullet (Figure 7). The mullet’s head and back are flat-shaped and the body is wide, unlike other fish in the dorsal direction. In the case of Redlip mullet, the swim bladder has a positive inclination relative to the body axis and the tilt angle of the swim bladder was about 8° from horizontal.
Figure 8 shows the relationships between mean TS and the tilt angle at 200 kHz for 19.4 cm and 35.0 cm FL values. The tilt angle was calculated by extracting the time-synchronized capture images from an underwater camera. At that time, the TS values could not be obtained at all angles. As a result of the relationship between the tilt angle and mean TS, the TS values were about −35 dB and −32 dB for tilt angles of −10° to 0°, respectively. The closer the tilt angle of the swim bladder is to horizontal, the higher the TS value. The TS value tended to decrease for tilt angles less than −10° or more than 10°. The mean TS values were −41.4 dB and −38.0 dB when considering a tilt angle of ±20°, which is normal for fish swimming in a sea cage.
The swim bladder is generally inclined +15°–30° in the positive direction from the horizontal compared to other fish [21]. Therefore, the highest TS value occurred when the tilt angle of the fish body was between −30° and −15°. Considering the characteristics of the acoustic signals transmitted in the vertical direction when the inclination angle of the swim bladder is high, the TS value of the fish also varied widely due to transmission and reflection fluctuations depending on the tilt angle at high frequency. In this study, the difference in the b 20 value in the standard TS function at each frequency was within about 2 dB (Equations (9)–(12)). Generally, fish with large swim bladder angles in TS measurements have relatively high TS values at low frequencies. In the case of the mullet with small swim bladder angles, the difference of mean TS, with frequency, was relatively small because the slope of the swim bladder is almost parallel with a horizontal line. These results show that the TS functions are consistent at all frequencies (Figure 5 and Figure 6). However, the reason why the result at 120 kHz is lower than that of the other frequencies is that the coefficient of determination for the accurate beam axis was relatively low at the time of the TS experiment.
Most fish in a sea-farm cage move predictably without sudden movement. The difference in the TS values between tilt angles of +20° and -20° was about 10 dB. Considering the relatively small fluctuation in the TS values at all frequencies in this study, the high frequency is valid to use when estimating fish biomass within a confined net at a fish farm.
The results of this study will provide TS information for Redlip mullet and can be applied to estimate biomass. In future studies, we will attempt to calculate the theoretical TS using morphological parameters, such as the three-dimensional swim bladder and the body shapes and the physical properties of Redlip mullet for a numerical simulation with a scattering model. In addition, we will compare and analyze the measured TS data with theoretical TS data to improve the accuracy of the TS information.
Author Contributions

H.K., S.C., M.K. and J.P. performed the acoustic target strength (TS) experiments and analyzed the data; K.K. and D.K. discussed the TS measurement results. H.K. and D.K. wrote the manuscript and offered useful suggestions.

Funding

This research was a part of the project titled “Development of an automated fish-counter system and measurement of underwater farming-fish”, funded by the Ministry of Oceans and Fisheries, Korea (PM60560).

Acknowledgments

We thank Youngwook Lee at KIOST MRC for his help with the TS experiments.

Conflicts of Interest

The authors declare no conflict of interest.

References

  1. Nelson, J.S. Fishes of the World, 4th ed.; J. Wiley: Edmonton, AL, Canada, 2006; pp. 252–255. ISBN 9780471250319. [Google Scholar]
  2. Minos, B.G.; Kokokiris, L.; Economidis, P.S. Sexual maturity of the alien redlip mullet, Liza haematocheilus (Temminck & Schlegel, 1845) in north Aegean Sea (Greece). J. Appl. Ichthyol. 2010, 26, 96–101. [Google Scholar] [CrossRef]
  3. Chang, C.W.; Huang, C.S.; Tzeng, W.N. Redescription of Redlip Mullet Chelon haematocheilus (Pisces: Mugilidae) with a Key to Mugilid Fishes in Taiwan. Acta Zool. Taiwanica 1999, 10, 35–40. [Google Scholar] [CrossRef]
  4. Thomson, J.M. The Mugilidae of the world. Mem. Queensl. Mus. 1997, 41, 457–562. [Google Scholar]
  5. Eschmeyer, W.N.; Herald, E.S.; Hammann, H. A Field Guide to Pacific Coast Fishes of North America; Houghton Mifflin Company: Boston, MA, USA, 1999; pp. 1–336. ISBN 9780618002122. [Google Scholar]
  6. Hampton, I. Acoustic and egg-production estimates of South African anchovy biomass over a decade: Comparisons, accuracy, and utility. ICES J. Mar. Sci. 1996, 53, 493–500. [Google Scholar] [CrossRef]
  7. Simmonds, E.J.; MacLennan, D.N. Fisheries Acoustics: Theory and Practice, 2nd ed.; Blackwell Science: Oxford, UK, 2005; pp. 1–437. ISBN 9780632059942. [Google Scholar]
  8. Hewitt, R.P.; Watkins, J.L.; Naganobu, M.; Tshernyshkov, P.; Brierley, A.S.; Demer, D.A.; Kasatkina, S.; Takao, Y.; Goss, C.; Malyshko, A.; et al. Setting a precautionary catch limit for Antarctic krill. Oceanography 2002, 15, 26–33. [Google Scholar] [CrossRef] [Green Version]
  9. La, H.S.; Lee, H.B.; Kang, D.; Lee, S.; Shin, H.C. Ex situ echo sounder target strengths of ice krill Euphausia crystallorophias. J. Oceanol. Limnol. 2015, 33, 802–808. [Google Scholar] [CrossRef]
  10. Foote, K.G. Fish target strengths for use in echo integrator surveys. J. Acoust. Soc. Am. 1987, 82, 981–987. [Google Scholar] [CrossRef] [Green Version]
  11. Kang, D.; Cho, S.; Lee, C.; Myoung, J.G.; Na, J. Ex situ target-strength measurements of Japanese anchovy (Engraulis japonicus) in the coastal Northwest Pacific. ICES J. Mar. Sci. 2009, 66, 1219–1224. [Google Scholar] [CrossRef]
  12. Mukai, T.; Iida, K. Depth dependence of target strength of live kokanee salmon in accordance with Boyle’s law. ICES J. Mar. Sci. 1996, 53, 245–248. [Google Scholar] [CrossRef]
  13. Nielsen, J.R.; Lundgren, B. Hydroacoustic ex situ target strength measurements on juvenile cod (Gadus morhua L.). ICES J. Mar. Sci. 1999, 56, 627–639. [Google Scholar] [CrossRef]
  14. Clay, C.S.; Horne, J.H. Acoustic models of fish: Atlantic cod (Gadus morhua). J. Acoust. Soc. Am. 1994, 96, 1661–1668. [Google Scholar] [CrossRef]
  15. BioSonics. User Guide: Visual Acquisition DT-X, Version 6.3; BioSonics Inc.: Seattle, WA, USA, 2018; pp. 1–139. [Google Scholar]
  16. MacLennan, D.N.; Fernandes, P.G.; Dalen, J.A. consistent approach to definitions and symbols in fisheries acoustics. ICES J. Mar. Sci. 2002, 59, 365–369. [Google Scholar] [CrossRef]
  17. Boswell, K.M.; Wilson, C.A. Side-aspect target strength measurements of bay anchovy (Anchoa mitchilli) and Gulf menhaden (Brevoortia patronus) derived from ex situ experiments. ICES J. Mar. Sci. 2008, 65, 1012–1020. [Google Scholar] [CrossRef]
  18. Jang, K.N. Fishing Culture; Sam-Kwang Publisher: Seoul, Korea, 2002; pp. 318–378. ISBN 9788982530944. (In Korea) [Google Scholar]
  19. Han, H.J.; Lee, N.S.; Kim, M.S.; Jung, S.H. An outbreak of Lactococcus garvieae infection in cage-cultured Red lip mullet Chelon haematocheilus with Green liver syndrome. Fish. Aquat. Sci. 2015, 18, 333–339. [Google Scholar] [CrossRef]
  20. Hewitt, R.P.; Demer, D.A. Dispersion and abundance of Antarctic krill in the vicinity of Elephant Island in the 1992 austral summer. Mar. Ecol. Prog. Ser. 1993, 99, 29–39. [Google Scholar] [CrossRef]
  21. Cho, S. Side-Aspect Target Strength of Black Sea Bream (Acanthopagrus schlegeli) Using Multi-Frequency System. Master’s Thesis, Hanyang University, Ansan, Korea, 2007. [Google Scholar]
Figure 1. The relationship between total fish length (FL, cm) and wet weight (W, g) of 16 live Redlip mullets (Chelon haematocheilus).
Applsci 08 01536 g001
Figure 2. Experimental setup for the target strength (TS) measurements of Redlip mullet (Chelon haematocheilus) using a scientific echo-sounder (38, 120, 200, and 420 kHz).
Applsci 08 01536 g002
Figure 3. A sample echogram of the Redlip mullet (FL: 35.0 cm) from the ex situ target strength measurements.
Applsci 08 01536 g003
Figure 4. Representative target strength (TS) histograms of mullet (FL: 35.0 cm) at (a) 38, (b) 120, (c) 200, and (d) 420 kHz. Index, n is the sample size.
Applsci 08 01536 g004
Figure 5. Relationships between target strength (TS) and total fish length (FL) at (a) 38, (b) 120, (c) 200, and (d) 420 kHz. Black points represent the mean TS values with FL. Black solid lines represent the least-squares regressions of mean TS, and the red solid line represents the standard fits of the TS functions.
Applsci 08 01536 g005
Figure 6. Relationship between the target strength (TS) and wet weight (W) at (a) 38, (b) 120, (c) 200, and (d) 420 kHz. Points represent the mean TS values, and solid lines represent least-squares regressions of mean TS.
Applsci 08 01536 g006
Figure 7. X-ray images of the mullet’s swim bladder; (a) lateral aspect, and (b) dorsal aspect). The red lines is the boundary of the swim bladder.
Applsci 08 01536 g007
Figure 8. Variation between the tilt angle and mean target strength (TS; dB) of mullet at 200 kHz [(a) 19.4 cm fish total fish length (FL), and (b) 35.0 cm in FL].
Applsci 08 01536 g008
Table 1. Several scientific echo-sounder parameters used for the target strength (TS) measurements of Redlip mullet (Chelon haematocheilus).
Parameters38 kHz120 kHz200 kHz420 kHz
Beam typeSplit-beam
Source level (dB)212.6219.6220.5219.0
−3 dB Beam width (o)9.27.86.97.0
Absorption coefficient (dB/m)0.008760.039160.056660.10118
Pulse duration (ms)0.2
Ping rate (pps)2
Temperature (°C)13
Salinity (psu)32