Article

Compressive Strength Characteristics of Cemented Tailings Backfill with Alkali-Activated Slag

1
School of Civil and Resources Engineering, University of Science and Technology Beijing, Beijing 100083, China
2
State Key Laboratory of High-Efficient Mining and Safety of Metal Mines of Ministry of Education, University of Science and Technology Beijing, Beijing 100083, China
3
First Quantum Minerals Ltd., Cayeli Bakir Isletmeleri A.S., PO Box 42, Madenli, Cayeli, Rize TR53200, Turkey
*
Authors to whom correspondence should be addressed.
Appl. Sci. 2018, 8(9), 1537; https://doi.org/10.3390/app8091537
Submission received: 30 July 2018 / Revised: 20 August 2018 / Accepted: 27 August 2018 / Published: 3 September 2018

Abstract

:
With the use of glauberite mineral (GM) and sodium hydroxide (SH) alkaline catalysts to stimulate slag powder’s internal cementation activity and incorporate the two fine-grained solid wastes, such as quicklime (Q) and desulfurized ash (DA), a new cementitious material suitable for mine tailings was developed to replace traditional ordinary Portland cement (OPC) for reducing cement-related costs. A series of uniaxial compressive strength (UCS) tests were carried out on cemented tailings backfill (CTB) samples containing different activators. The results showed that (1) the highest UCS values of 14-day and 28-day cured CTB samples were 1.259 MPa and 2.429 MPa, respectively, and the effect of different activator types was in the order of SH > GM > DA > Q and SH > GM > Q > DA; (2) the relationship between UCS and activator dosages followed the function y = ax3bx2 + cxd. Compared with the OPC 32.5 R cemented samples, the minimum strength growth factor was 1.45, and the maximum reached 2.03; (3) the optimal proportion of DA slag formula was 4.5% or 5.0% Q, 19% DA, 2.5% GM, and 0.7% SH. The aforesaid new cementitious materials met the mine’s UCS requirements with a relatively low cost (17.04–17.20 €/ton) and solved the stacking problem of solid wastes on the surface well. Ultimately, this study provides a useful reference for the development of mineral binders.

1. Introduction

The underground mining methods with cemented backfill have key advantages in controlling ground pressure, realizing the absence of waste mining, and the efficient utilization of mineral resources [1,2]. However, the high cost of cementitious materials used in the mine backfill operations has exerted tremendous economic pressure on the mining industry [3]. Indeed, cemented tailings backfill (CTB) or cemented paste backfill (CPB) represents nearly 50–85% of the total operating costs when considered for a cement content of 3.5–9% used in the backfill mix. CTB allows mining companies to extract more ore in a secure manner, while simultaneously improving working and environmental conditions [4,5]. As a result, the use of solid wastes is an effective approach to reduce mining costs, improve operational safety, and develop a new type of cementitious material with a relatively low cost and high mechanical strength.
CTB is a composite matrix of the total filtrated processing tailings (containing 70–85 wt% solid content), hydraulic binder, and mixing water. The physicochemical and mineralogical properties of these ingredients (tailings, binder, and water) have a key influence on strength, stability, transport, curing, and placement performance of CTB materials [6,7,8,9,10,11,12,13,14,15]. Binders are used to ensure the strength and durability of CTB mass. The most commonly used binder type in the mine sites is ordinary Portland cement (OPC), which is costly and prone to acid and/or sulfate attacks when sulfide-rich processing tailings are used for the manufacture of CTB mass [16]. For that reason, utilization of efficient cost control and highly durable alternative cement types is required for the CTB mixes containing such tailings [17]. Ercikdi et al. [18] demonstrated that the use of pozzolanic mineral and chemical additives as an alternative binder in CPB drastically prevented the mechanical strength losses, even at lower cement contents. It is well known in the concrete industry that alkali-activated slag cement provides a high mechanical strength and stability under aggressive conditions [19]. Some researchers also reported that the cost of alkali-activated slag cement could be as little as a half of that of OPC, ensuring its potential as an alternative binder to be used within CTB or CPB samples containing sulfidic mine tailings [20,21].
Numerous researchers have conducted extensive research on the activation of slag powder and new filling materials. Cihangir et al. [22] reported that the cement-related costs were significantly reduced (35%) to achieve an equal strength of 1 MPa for 28-day cured CPB samples, increasing the corresponding mechanical strength gain. Kermani et al. [23,24] also reported that the addition of a proper amount of an alkali activator such as sodium silicate could improve the backfill’s strength, drainage, and microstructural properties. Addition of sodium silicate to the CTB mix can reduce the total porosity and the required setting time of the backfill, contributing to an increase in the backfill strength and ore production. In addition, Manjunath et al. [25] developed concrete mixtures with granulated blast furnace slag as an aggregate, and their results demonstrate that alkaline solution can activate slag effectively. Gebregziabiher et al. [26] believed that the hydration process and mechanical properties of slag cement are highly dependent on type and dosage of alkaline catalysts. Sodium hydroxide (SH) and sodium silicate are the most commonly used activators. Sodium silicate is indeed a viscous material that is usually used to activate pozzolanic materials such as slag and fly ash. The chemical compound has many applications, namely, in waste treatment [27], mine tailings [28,29,30,31], sand fill [32], and other construction materials [33,34,35].
Moreover, Thomas et al. [36] analyzed the micromechanical properties of slag binder and found that the strength of sodium hydroxide-active slag cement is higher than that of the surrounding non-reacted slag cement. SEM microscopic morphology and energy spectrum analyses revealed that the slag particles hydrated under an alkali-excited environment are relatively enough [37]. Li et al. [38] studied the hydration mechanism of composite cementitious materials containing pulverized fly ash as a substitute for cement and slag powder. Ren et al. [39] discussed the influence of pulverized coal ash on the comprehensive performance of filling paste. Yao et al. [40] effectively developed slag aluminum-based gel-forming material with mine-graded tailings and whole tailings as aggregates, and they achieved the expected technical and economic indexes of fillings. Wang et al. [41] proposed a joint cementation and filling program for mine gravel and phosphogypsum as filling aggregates, and they found that the addition of phosphogypsum effectively improves the fluidity of the slurry mix. Guo et al. [42] replaced OPC cement with slag powder or desulfurization gypsum to some extent. As a result, the dense microstructure formed was found to increase the compressive strength gain and reduce the drying shrinkage of cement mortar and concrete.
Given that desulfurization products and components such as fly ash are unstable in the nature, most of the desulfurized ash (DA) slag is stored and discarded, which can give rise to environmental pollution and limit the desulfurization process and large-scale industrial use [43,44]. Wang et al. [45] replaced fine aggregates with desulphurization slag. The mechanical strength acquisition of mortar samples decreases when increasing the replacement rate of desulfurized ash. Li et al. [46] used solid wastes such as quicklime and desulfurized slag to stimulate the rod milling sand for Jinchuan Mine, and the authors obtained a new type of cemented backfilling material. Wang et al [47] activated the cementing properties of DA with the active agent, active mineral admixture, and temperature, and analyzed the early hydration process and its products. Using a variety of experiments such as dynamic creep, three-point bending, retained Martens’ stability, and the tensile strength ratio, Chen et al. [48] found that the desulfurization residue can partially improve the moisture resistance and crack resistance of the asphalt mixtures.
According to the experimental study of the pre-mine tailings powder excitation formula, a new type of cementitious material composed of quicklime (Q), desulfurized ash (DA), glauberite mineral (GM), and sodium hydroxide (SH) was developed by using GM and SH to stimulate the intrinsic activity of slag powder. The originality of this paper consists of the evaluation of the effects of four different activators (Q, DA, GM, and SH) on the uniaxial compressive strength of cemented tailings backfill. To better determine the optimal proportion of activator dosages, some regression equations were established. The Matlab software was also used to predict the mechanical strength gain of CTB samples. Combined with the results of the quadratic polynomial regression and the improved neural network prediction, the optimal ratio of DA formula was finally determined.

2. Materials and Methods

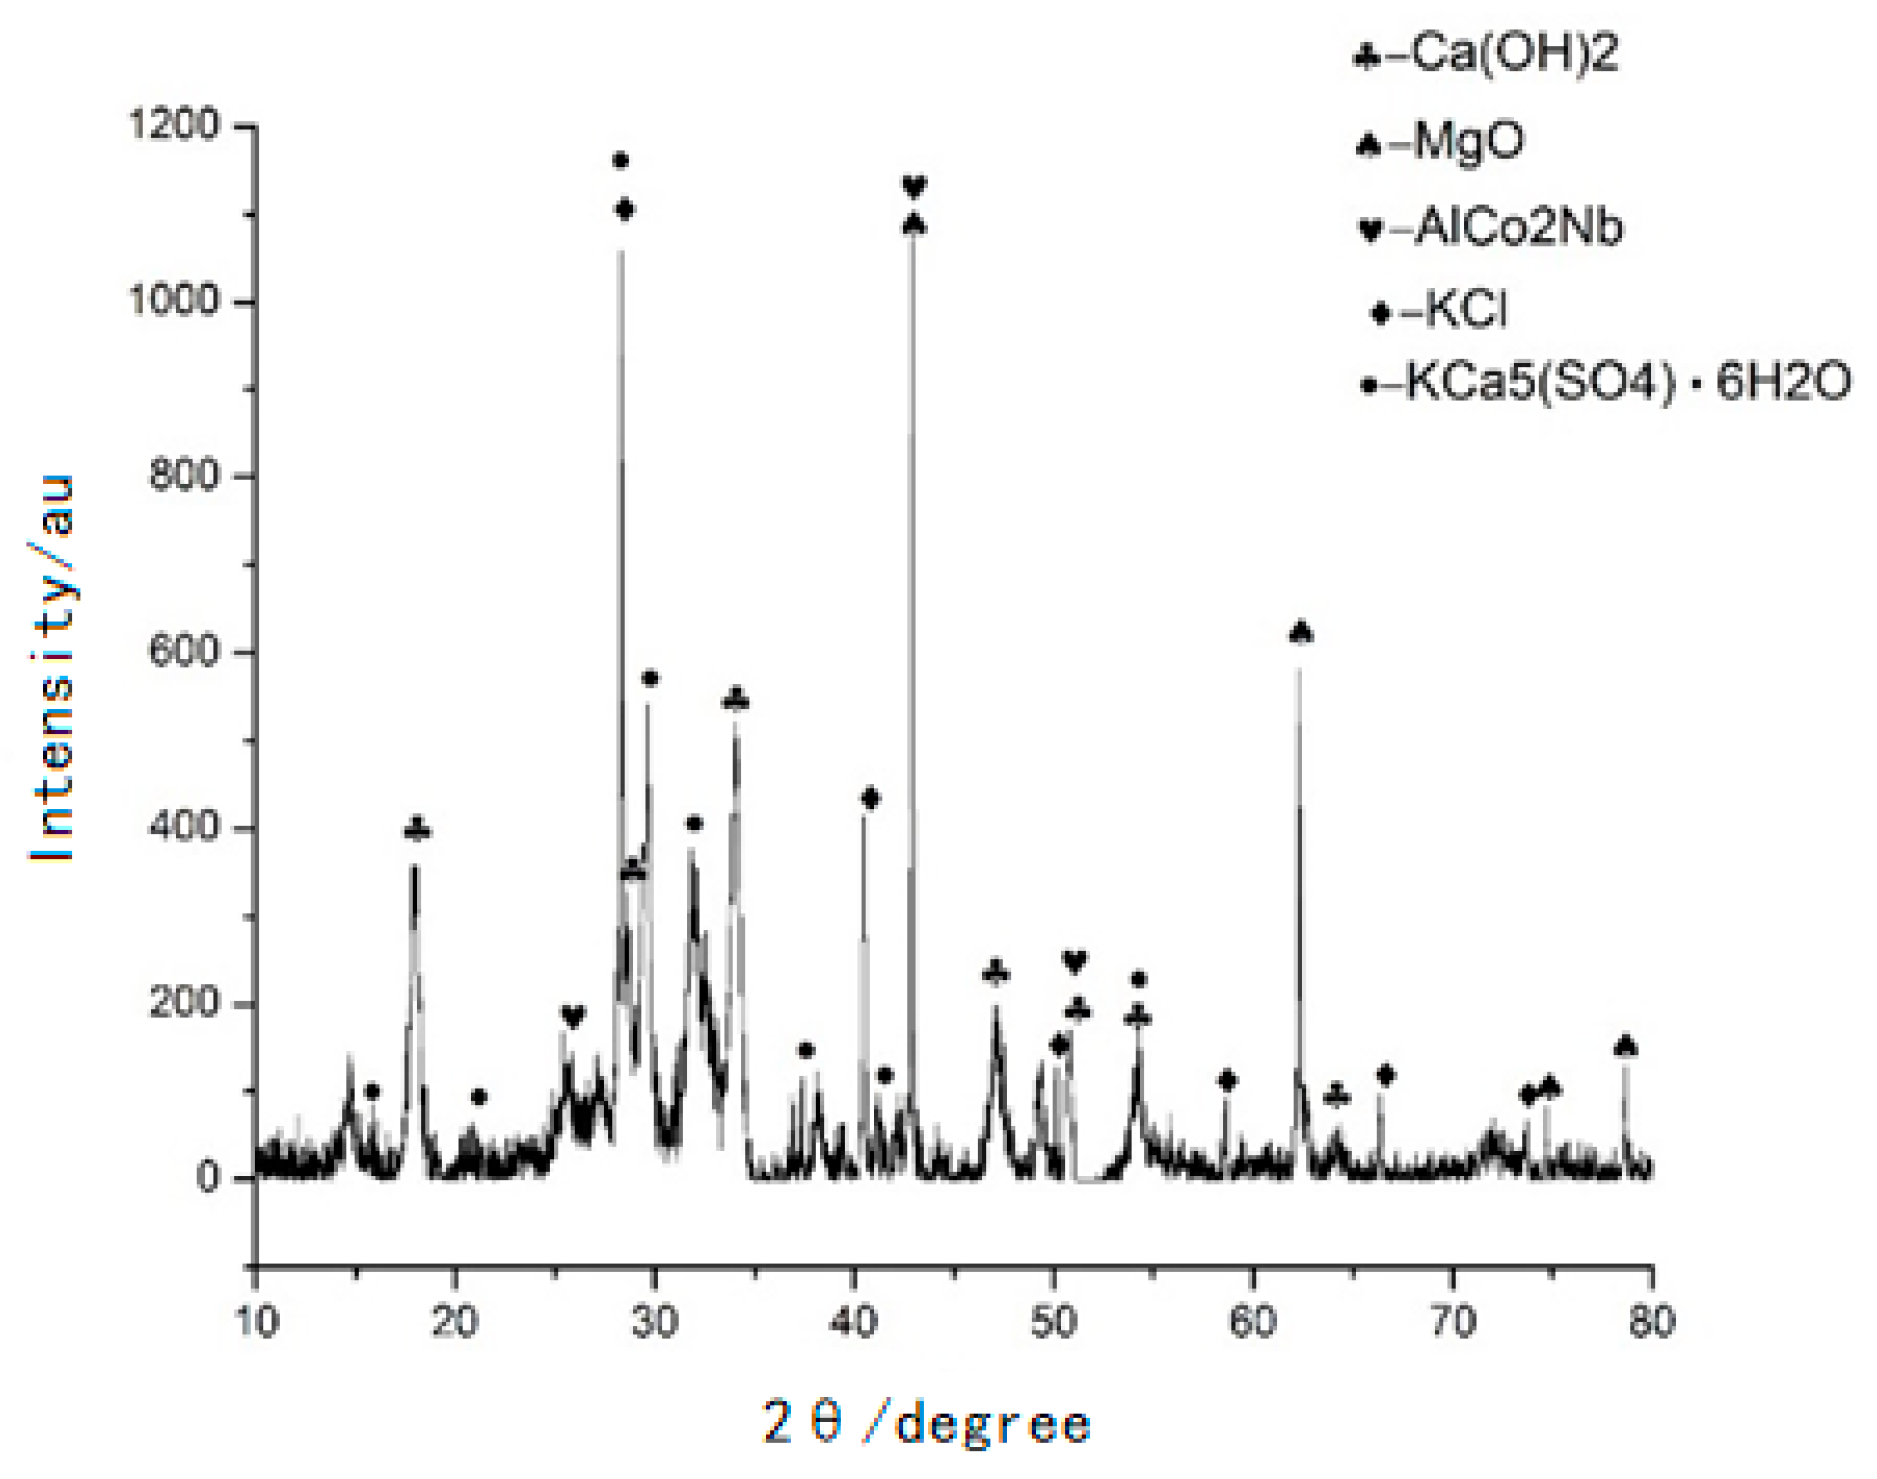
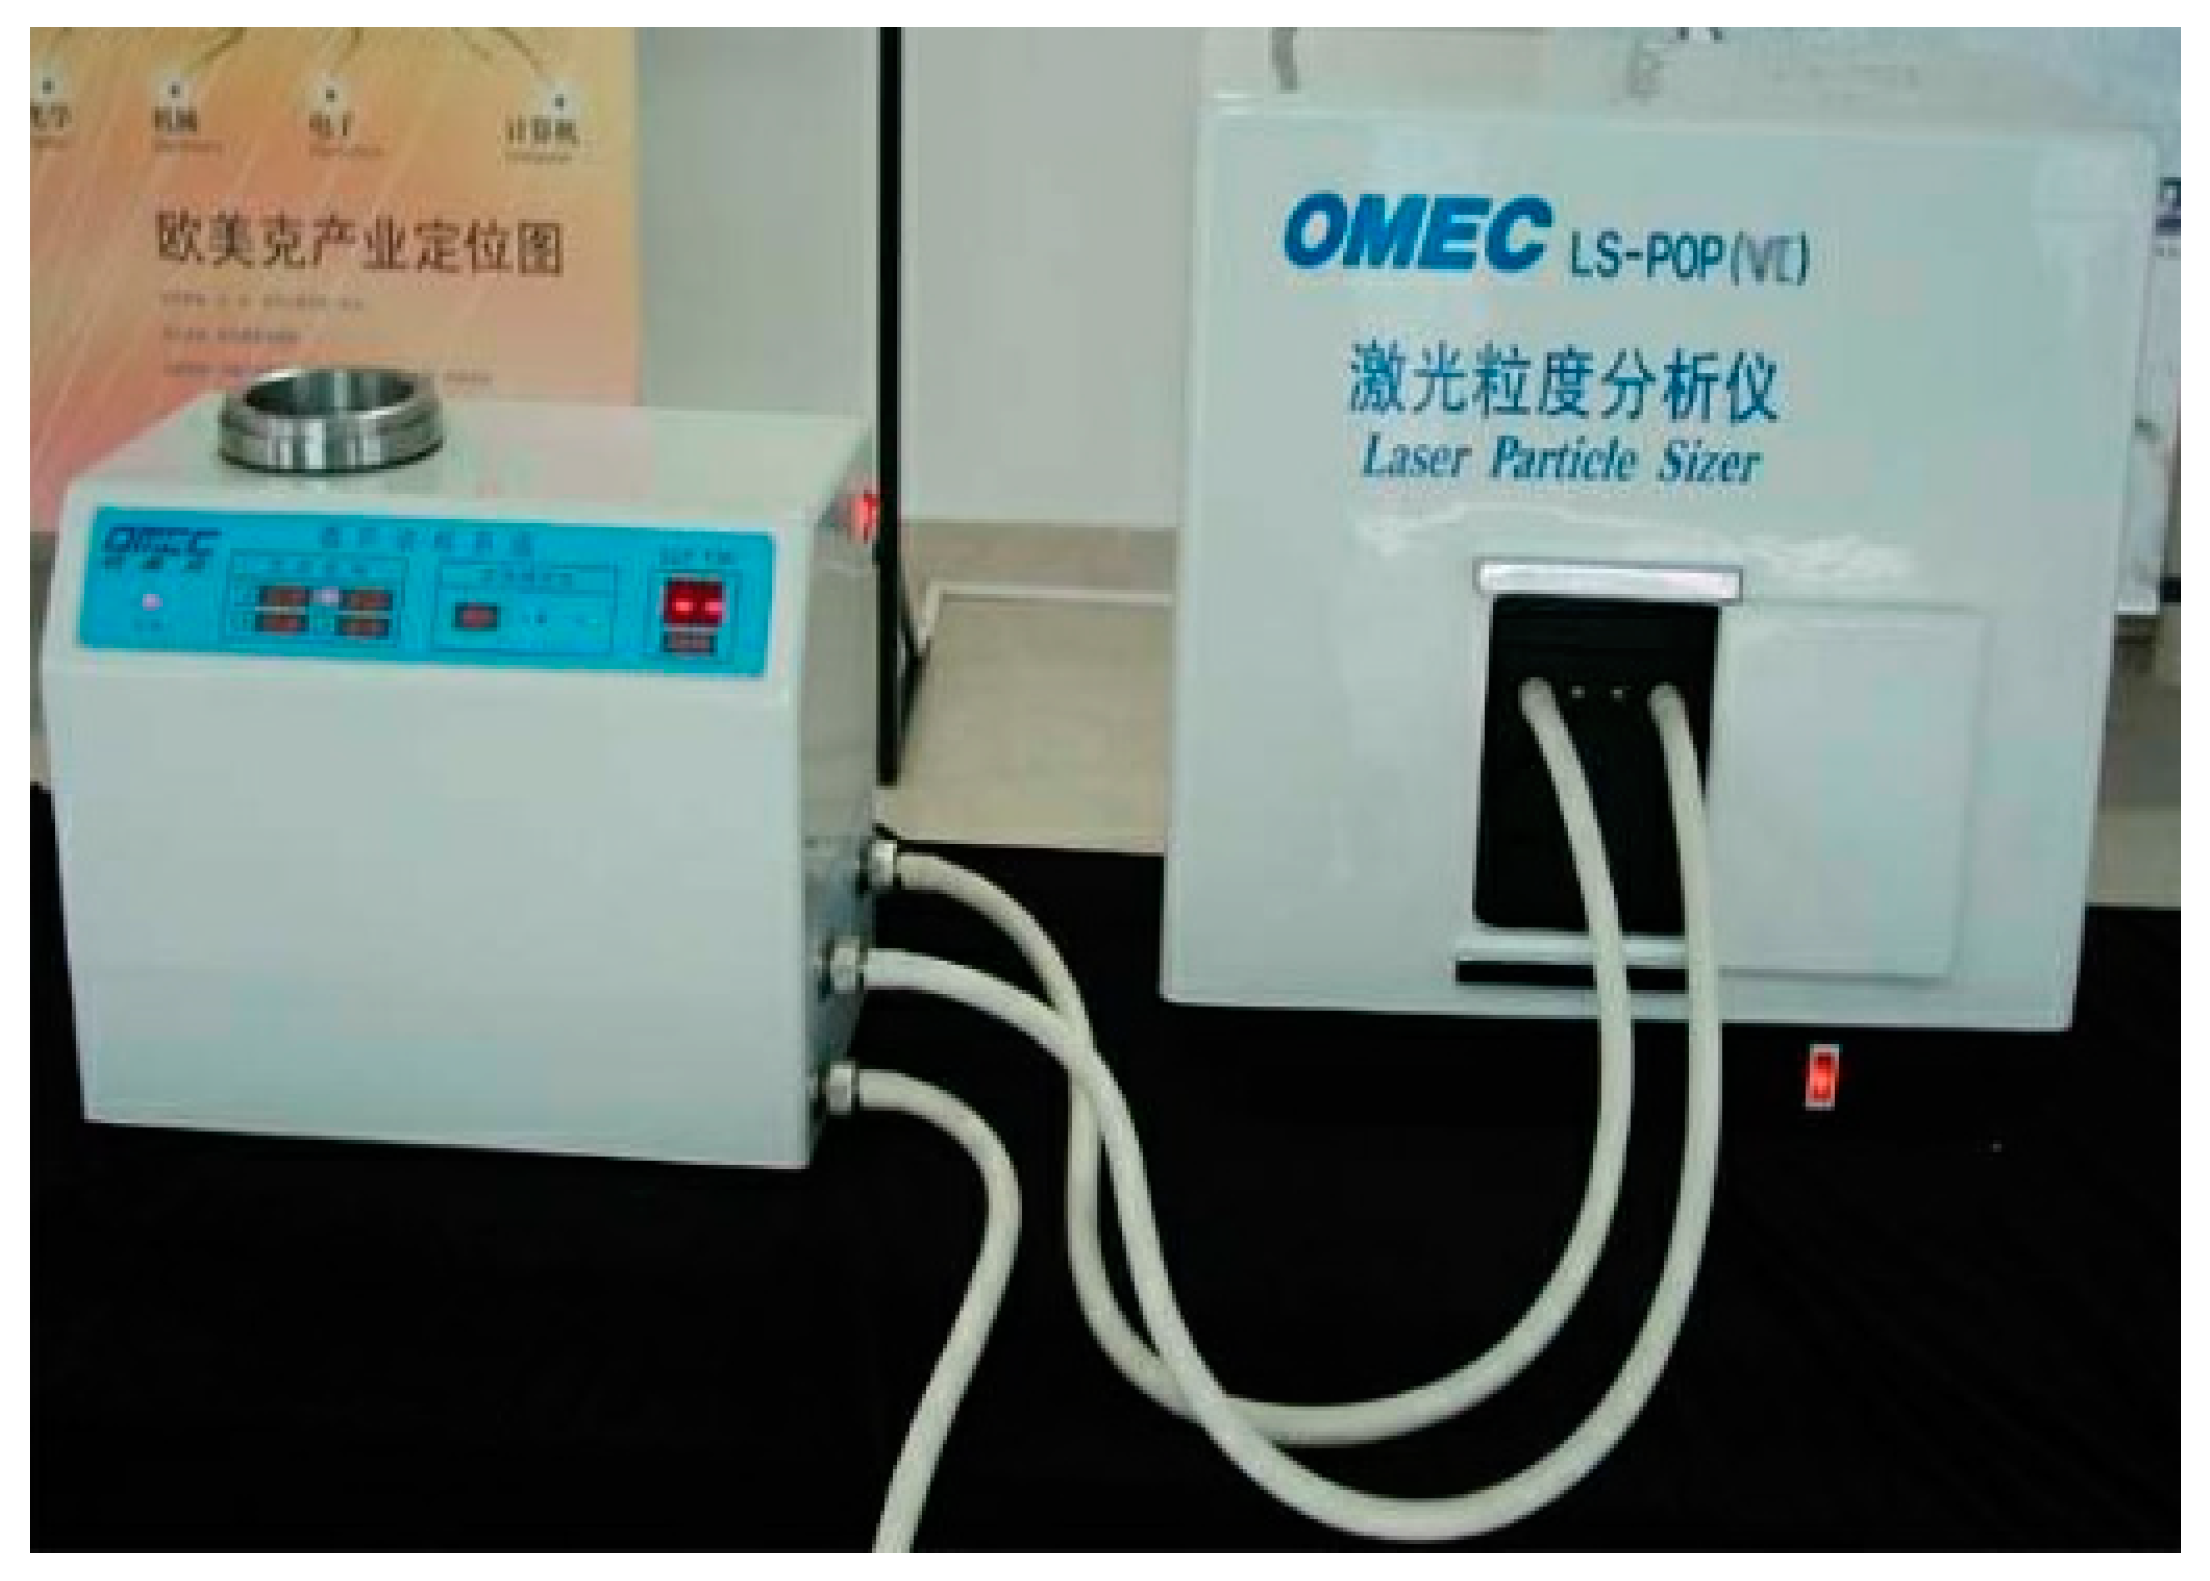
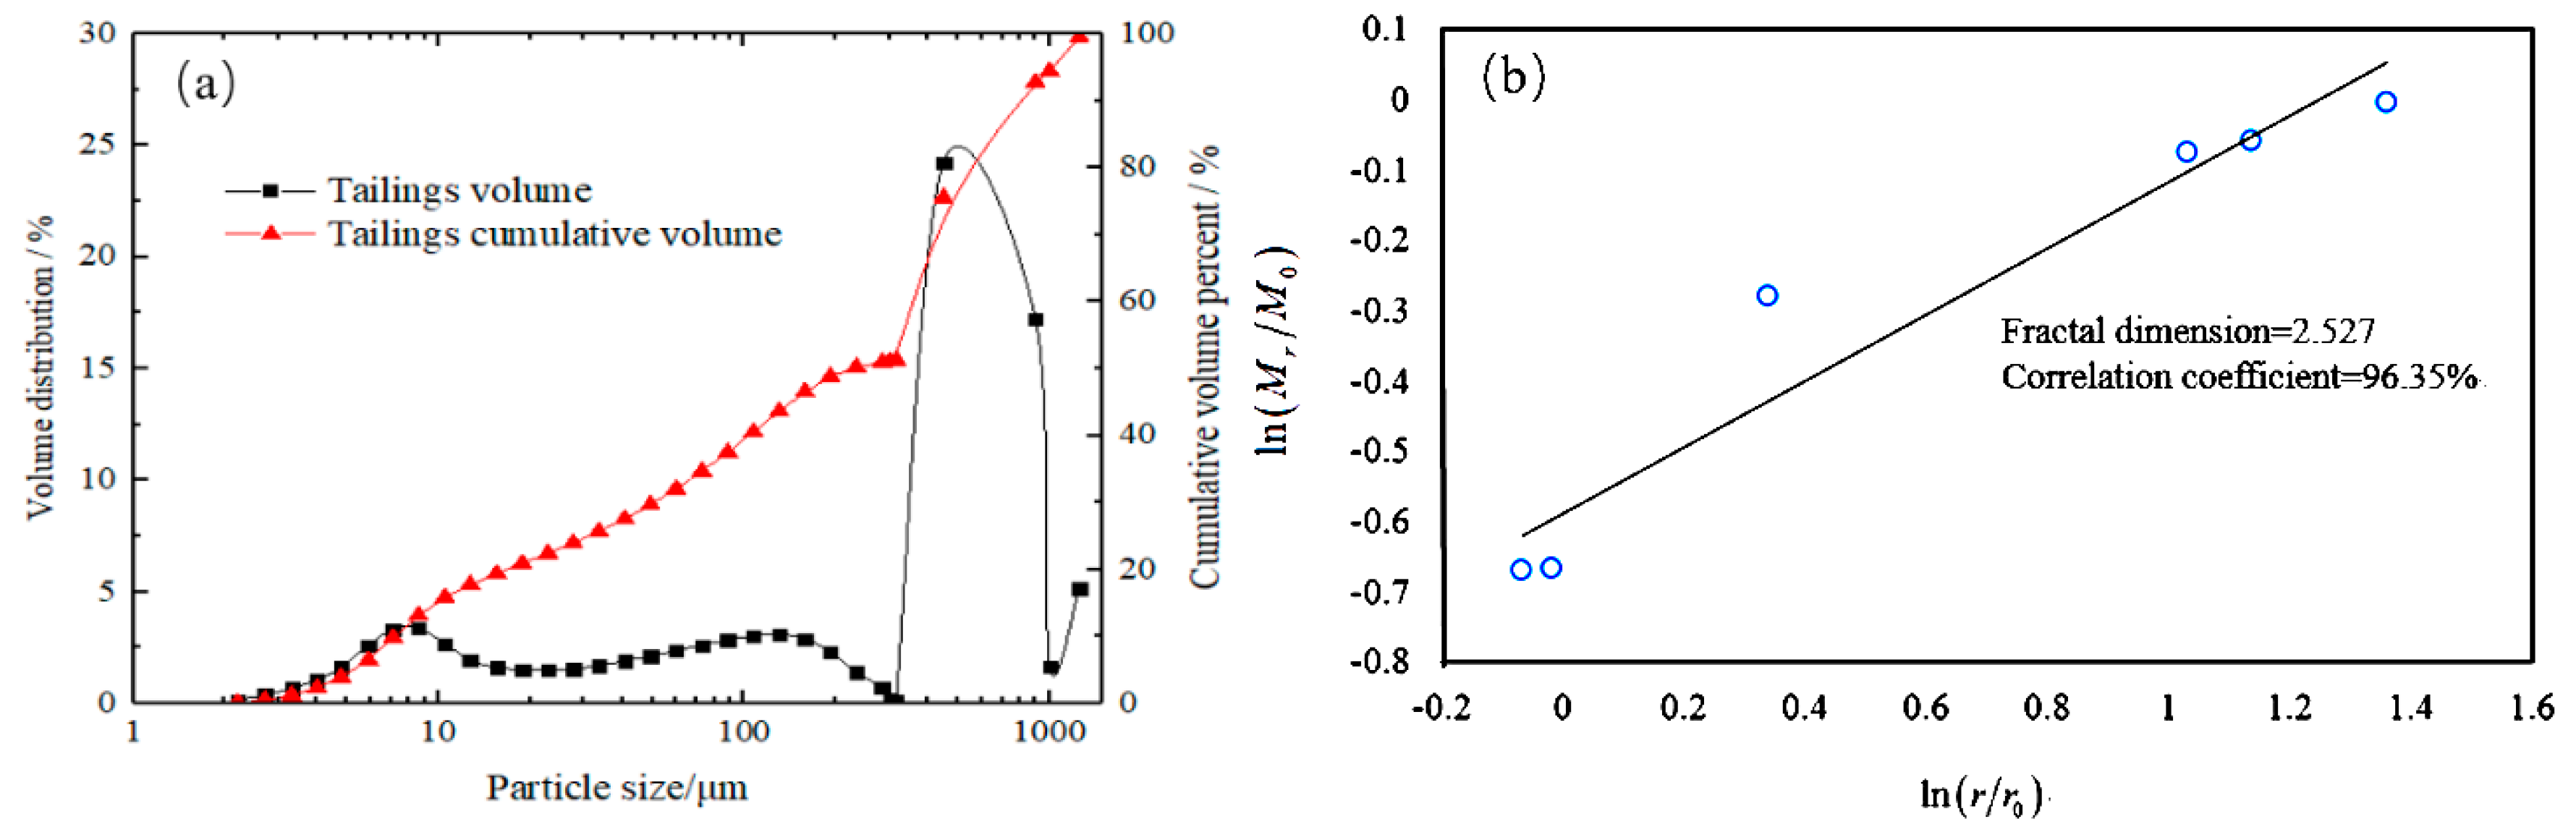
2.1. Material Characterization

The raw materials used in this study were total tailings, and the moisture content was less than 10% through drying in the open air and a drying oven. Particle size distribution (PSD) of the tailings sample was analyzed using a LS-POP (VI) powerful laser diffraction particle sizer (Figure 1) under dry conditions appropriate for the ASTM D421 standard procedure [49]. The LS-POP (VI) (OMEC, Zhuhai, China) is a centrifugal particle size analyzer which combines particle sedimentation with photometric detection. Particle sizes can be measured over a very wide range from 2 nm to 500 µm, depending on the particle density, dispersant density, and viscosity. By using a single light source (power 2 mW) and eliminating the requisite for laser switching, one-second measuring intervals can be achieved, allowing for real-time monitoring of the particle size. Sample concentration in the dispersant is lower than 0.01 wt% (differs with sample). Sample particles are settled in any of four modes: The gravimetric sedimentation mode, the centrifugal sedimentation mode, the multi mode (combining gravitational sedimentation and centrifugal sedimentation), and the centrifugal lift mode. The main reasons behind why the centrifugal sedimentation mode is used for PSD analyses are that: (i) it increases the sedimentation speed of fine particles by several orders of magnitude, and (ii) it greatly moderates the effect of Brownian motion.
Moreover, the particle size distribution and fractal fitting curves of the studied tailings sample are shown in Figure 2. Combined with Figure 2a and the interpolation calculation of the grading curve, the amount of fine mud less than 0.1 mm reached 21%, the weighted average particle size was 0.361 mm, and the unevenness coefficient was 53.4, which far exceeded the optimum grading range of 4 to 5 in the Thabo equation. As shown in Figure 2b, the fractal dimension of the studied tailings sample was 2.527, and the fitting correlation coefficient reached 96.35%, which could replicate the real PSD of the whole tailings. In general, a greater fractal dimension led to the fine tailings particles used in experiments. In conclusion, the particle size distribution of the whole tailings sample was not uniform, the content of fine mud was high, and the filling material of the tailings demonstrated seriously poor grading.
Desulfurized ash (DA) is grayish with a fine grain size, and the average particle size is 17.5 μm. Desulfurization through a gas-solid reaction at a certain temperature has been proven advisable as it yields effective results and oaths that the ash content does not increase. The most direct and effective means of desulfurization is calcination at a temperature between 850 °C and 900 °C, which proposes a good desulfurization rate and a relatively low cost [50]. Note that a high temperature leads to a high desulfurization rate. However, the relatively high-temperature calcination results in a low yield and diseconomy.
After the calcination process, the mineral components were effectively improved, while the hydration process was facilitated. X-ray diffraction (XRD) of the powder samples was evaluated using a MXP21VAHF diffractometer (MAC Science, Tokyo, Japan) over the range of 10–80 degrees 2θ at a scanning speed of 0.5 deg/min. The tube anode was copper, and the Kα radiation (0.15 nm) was monochromatized with a graphite crystal. The pattern was collected using a tube voltage of 21 kV and a 500 mA tube current. The pattern was scanned by using a step scan mode (step size 0.02 degree, counting time 1 s per step). XRD is a rapid analytical system principally used for the phase identification of a crystalline material. Both XRD and semi-quantitative analyses showed that the sulfur-containing phase in DA was dominated by CaSO3, and its mass fraction reached 10–50%. By contrast, the calcium sulfate content was relatively very small. The result of X-ray diffraction for the tested tailings sample is shown in Figure 3.
Quicklime (Q) is produced by Tangshan Yongshun Lime Plant, and its chemical composition is also measured using a MXP21VAHF diffractometer in accordance with the GB/T 176-1996 Chinese standard procedure, as shown in Table 1. The quantitative analysis of the sample should usually be about 45 microns. It can be seen from Table 1 that the CaO content of Yongshun lime is only 39.02% and the MgO content is 8.52%, but the content of Ca(OH)2 is as high as 35.54%. Compared with the chemical composition of the Tangshan Yinshui high calcium lime, the Q used in the experiments is ordinary lime, which is not in the category of high calcium ash. Please also note that GM and SH are all purchased industrial production additives.
The slag powder was S95 blast furnace slag (water-quenched slag) produced by Tangshan Iron and Steel Plant (China), and its active component CaO + Al2O3 + MgO = 38.16% + 16.23% + 10.10% = 64.49%. The mass coefficient was 1.91, and the weighted average particle size was 18.13 μm. Several works [51,52,53,54] have shown that particles of slag powder with a diameter of less than 30 μm play a beneficial role in filling strength. Therefore, the slag powder belonged to the category of high-quality slag and could be easily activated to prepare cementitious materials.

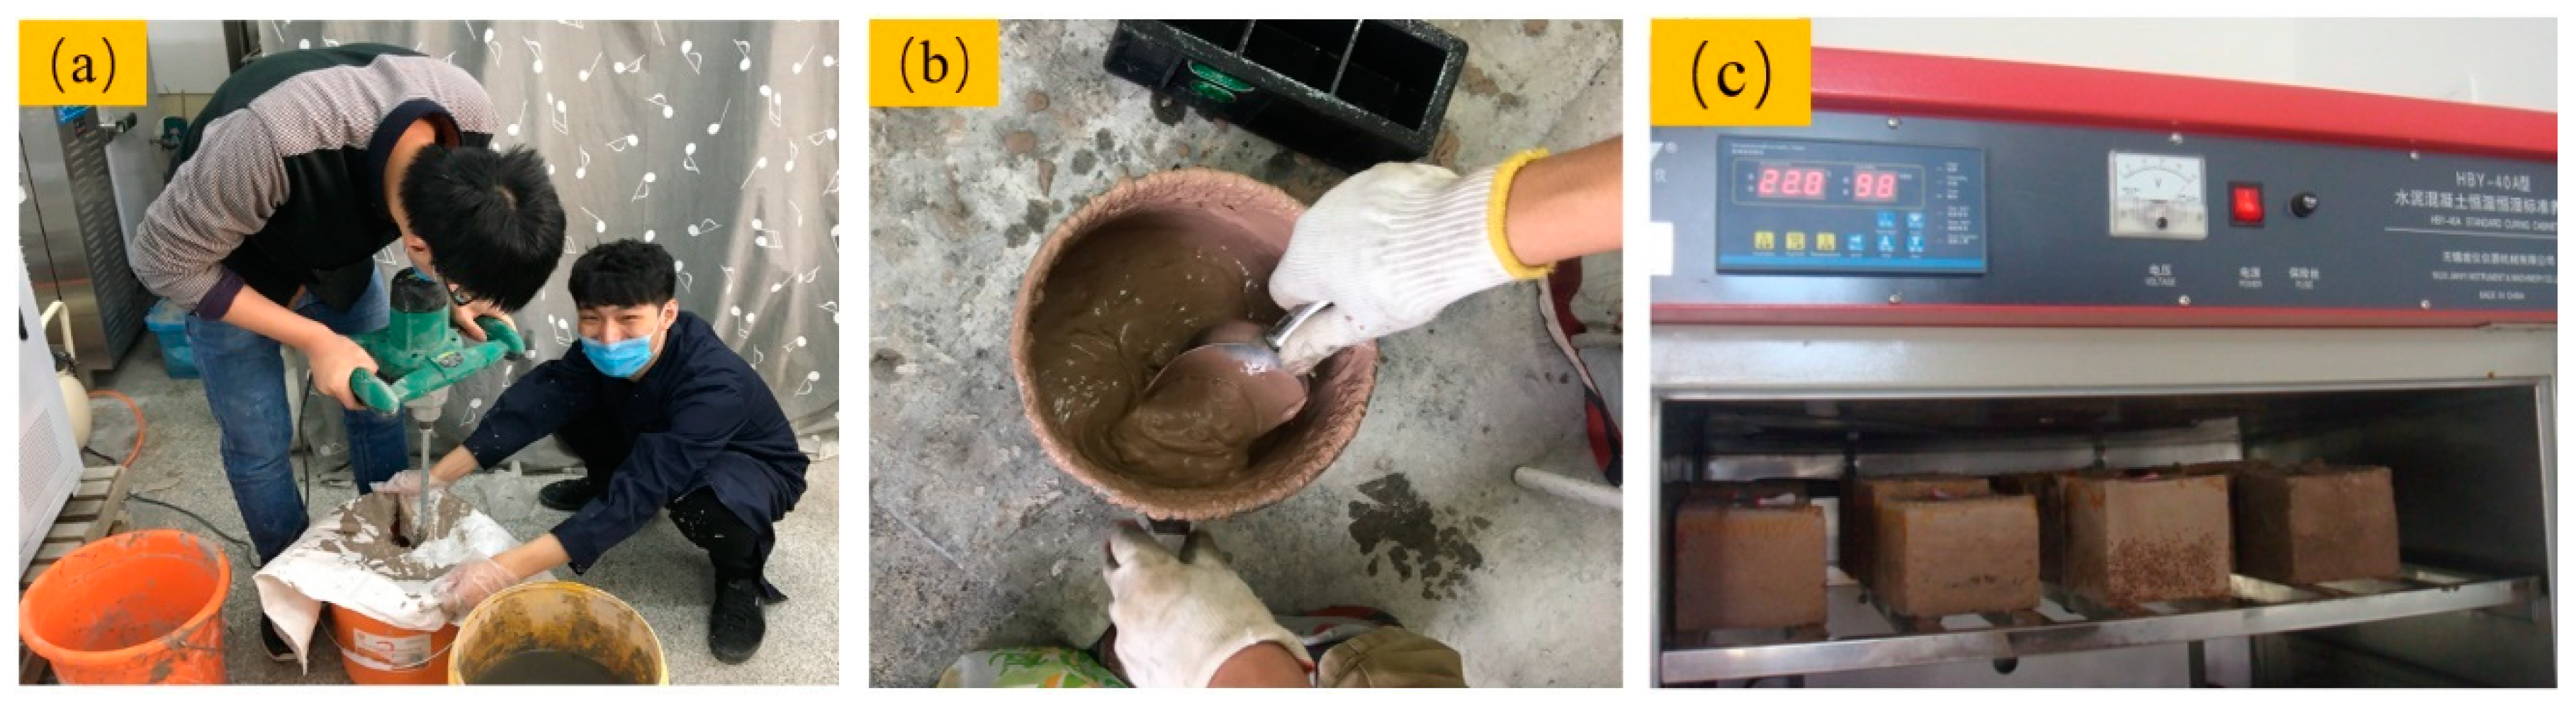
2.2. Sample Preparation and Curing Process

The new cementitious material was composed of slag powder, Q, DA, GM, and SH. First, the above-mentioned raw materials were respectively ball-milled to a certain degree of fineness. After evenly stirring, they were poured into 7.07 cm × 7.07 cm × 7.07 cm standard cube molds, shaken, and placed under a temperature of 20 ± 1 °C and a relative humidity of no less than 95% of the YH-40B standard curing box. During demolding, the upper and lower surfaces of the hardened CTB samples were polished in order to meet the flatness requirements, to eliminate the effect of end effects during the compression test. The sample preparation and curing conditions of the tested CTB mixtures are shown in Figure 4.

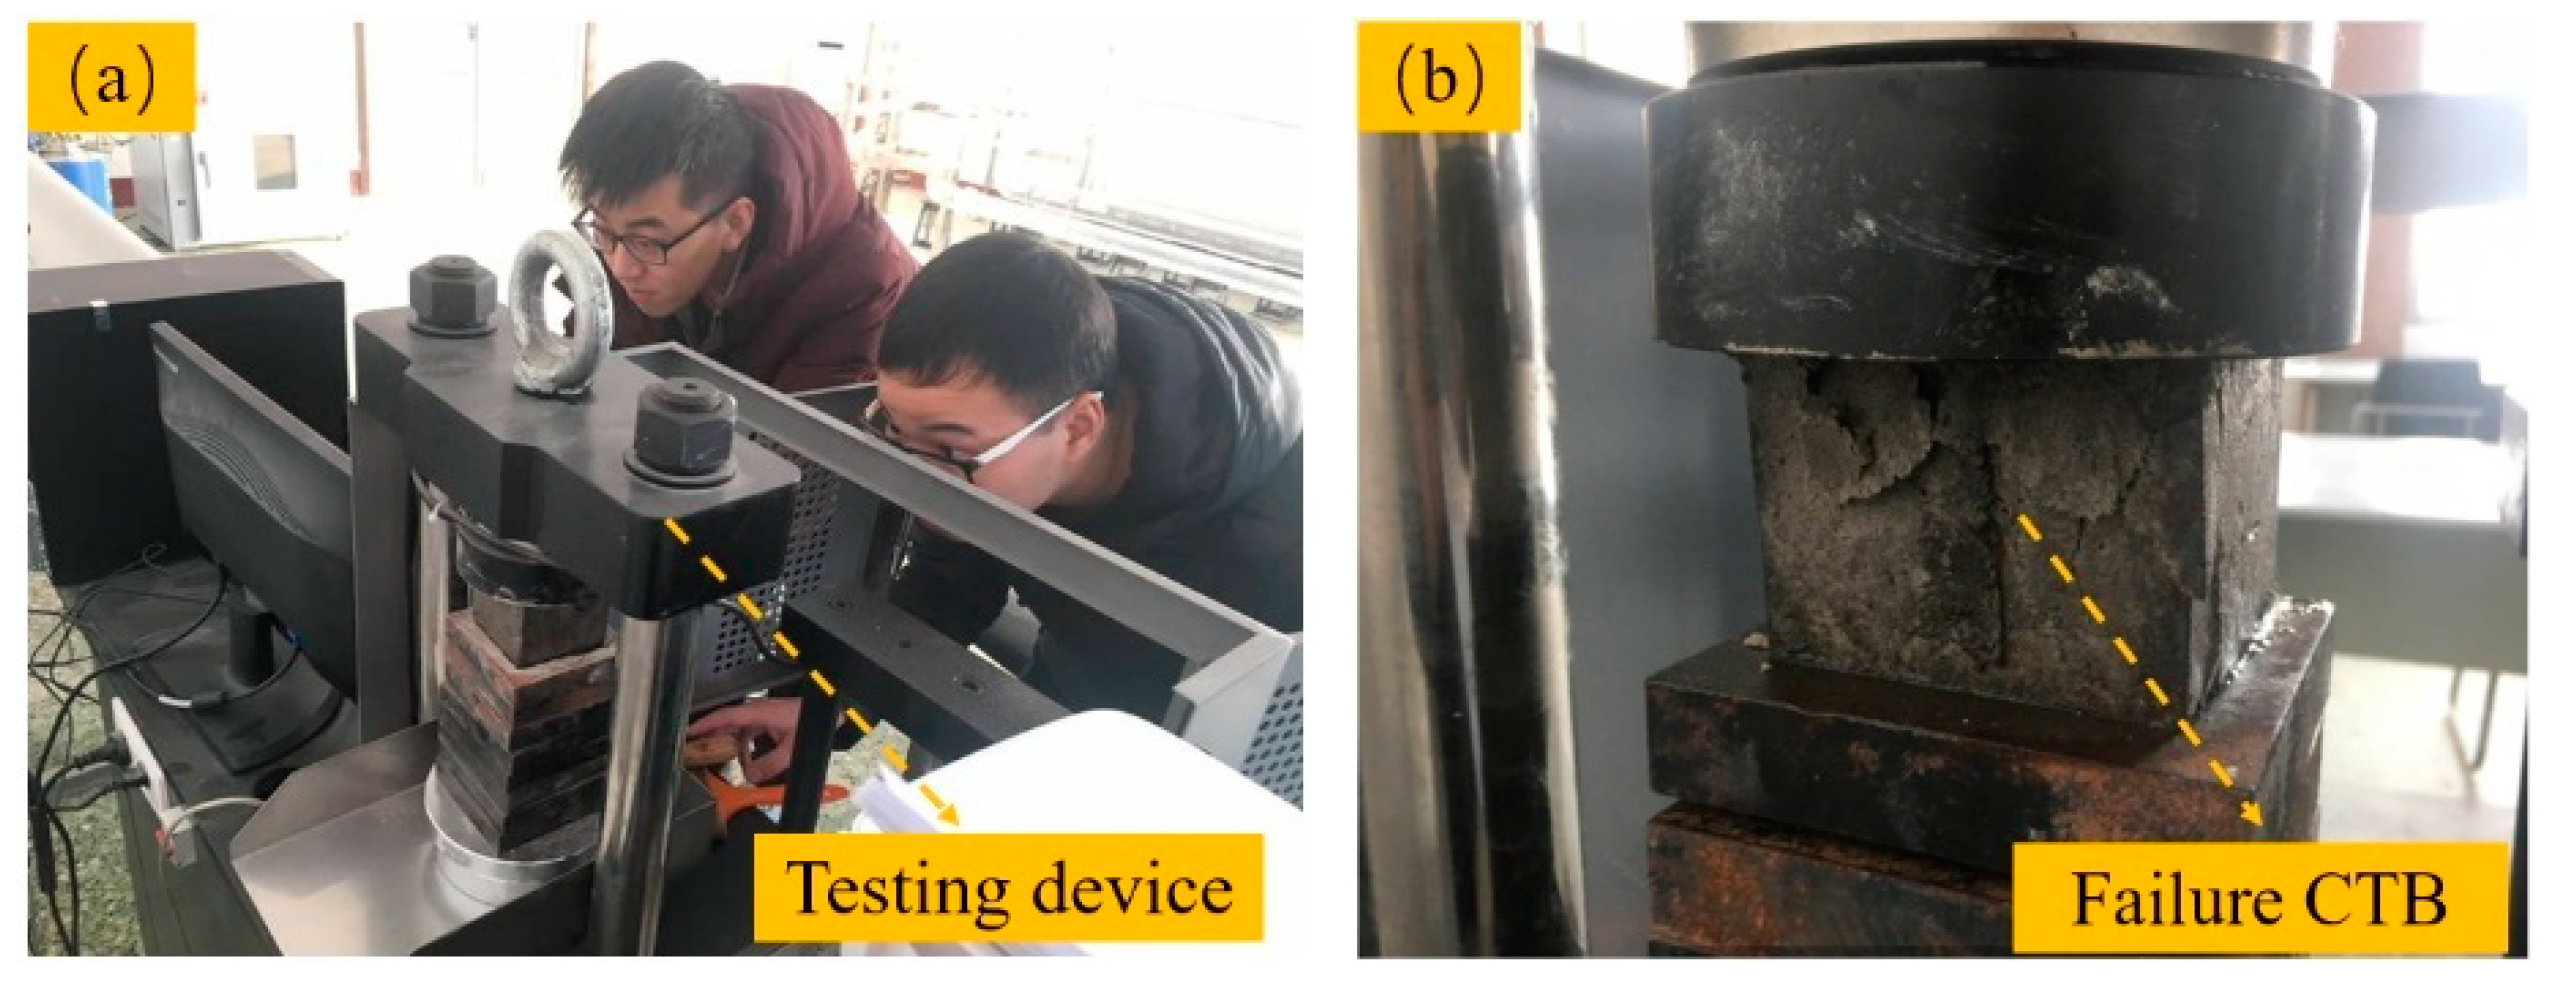
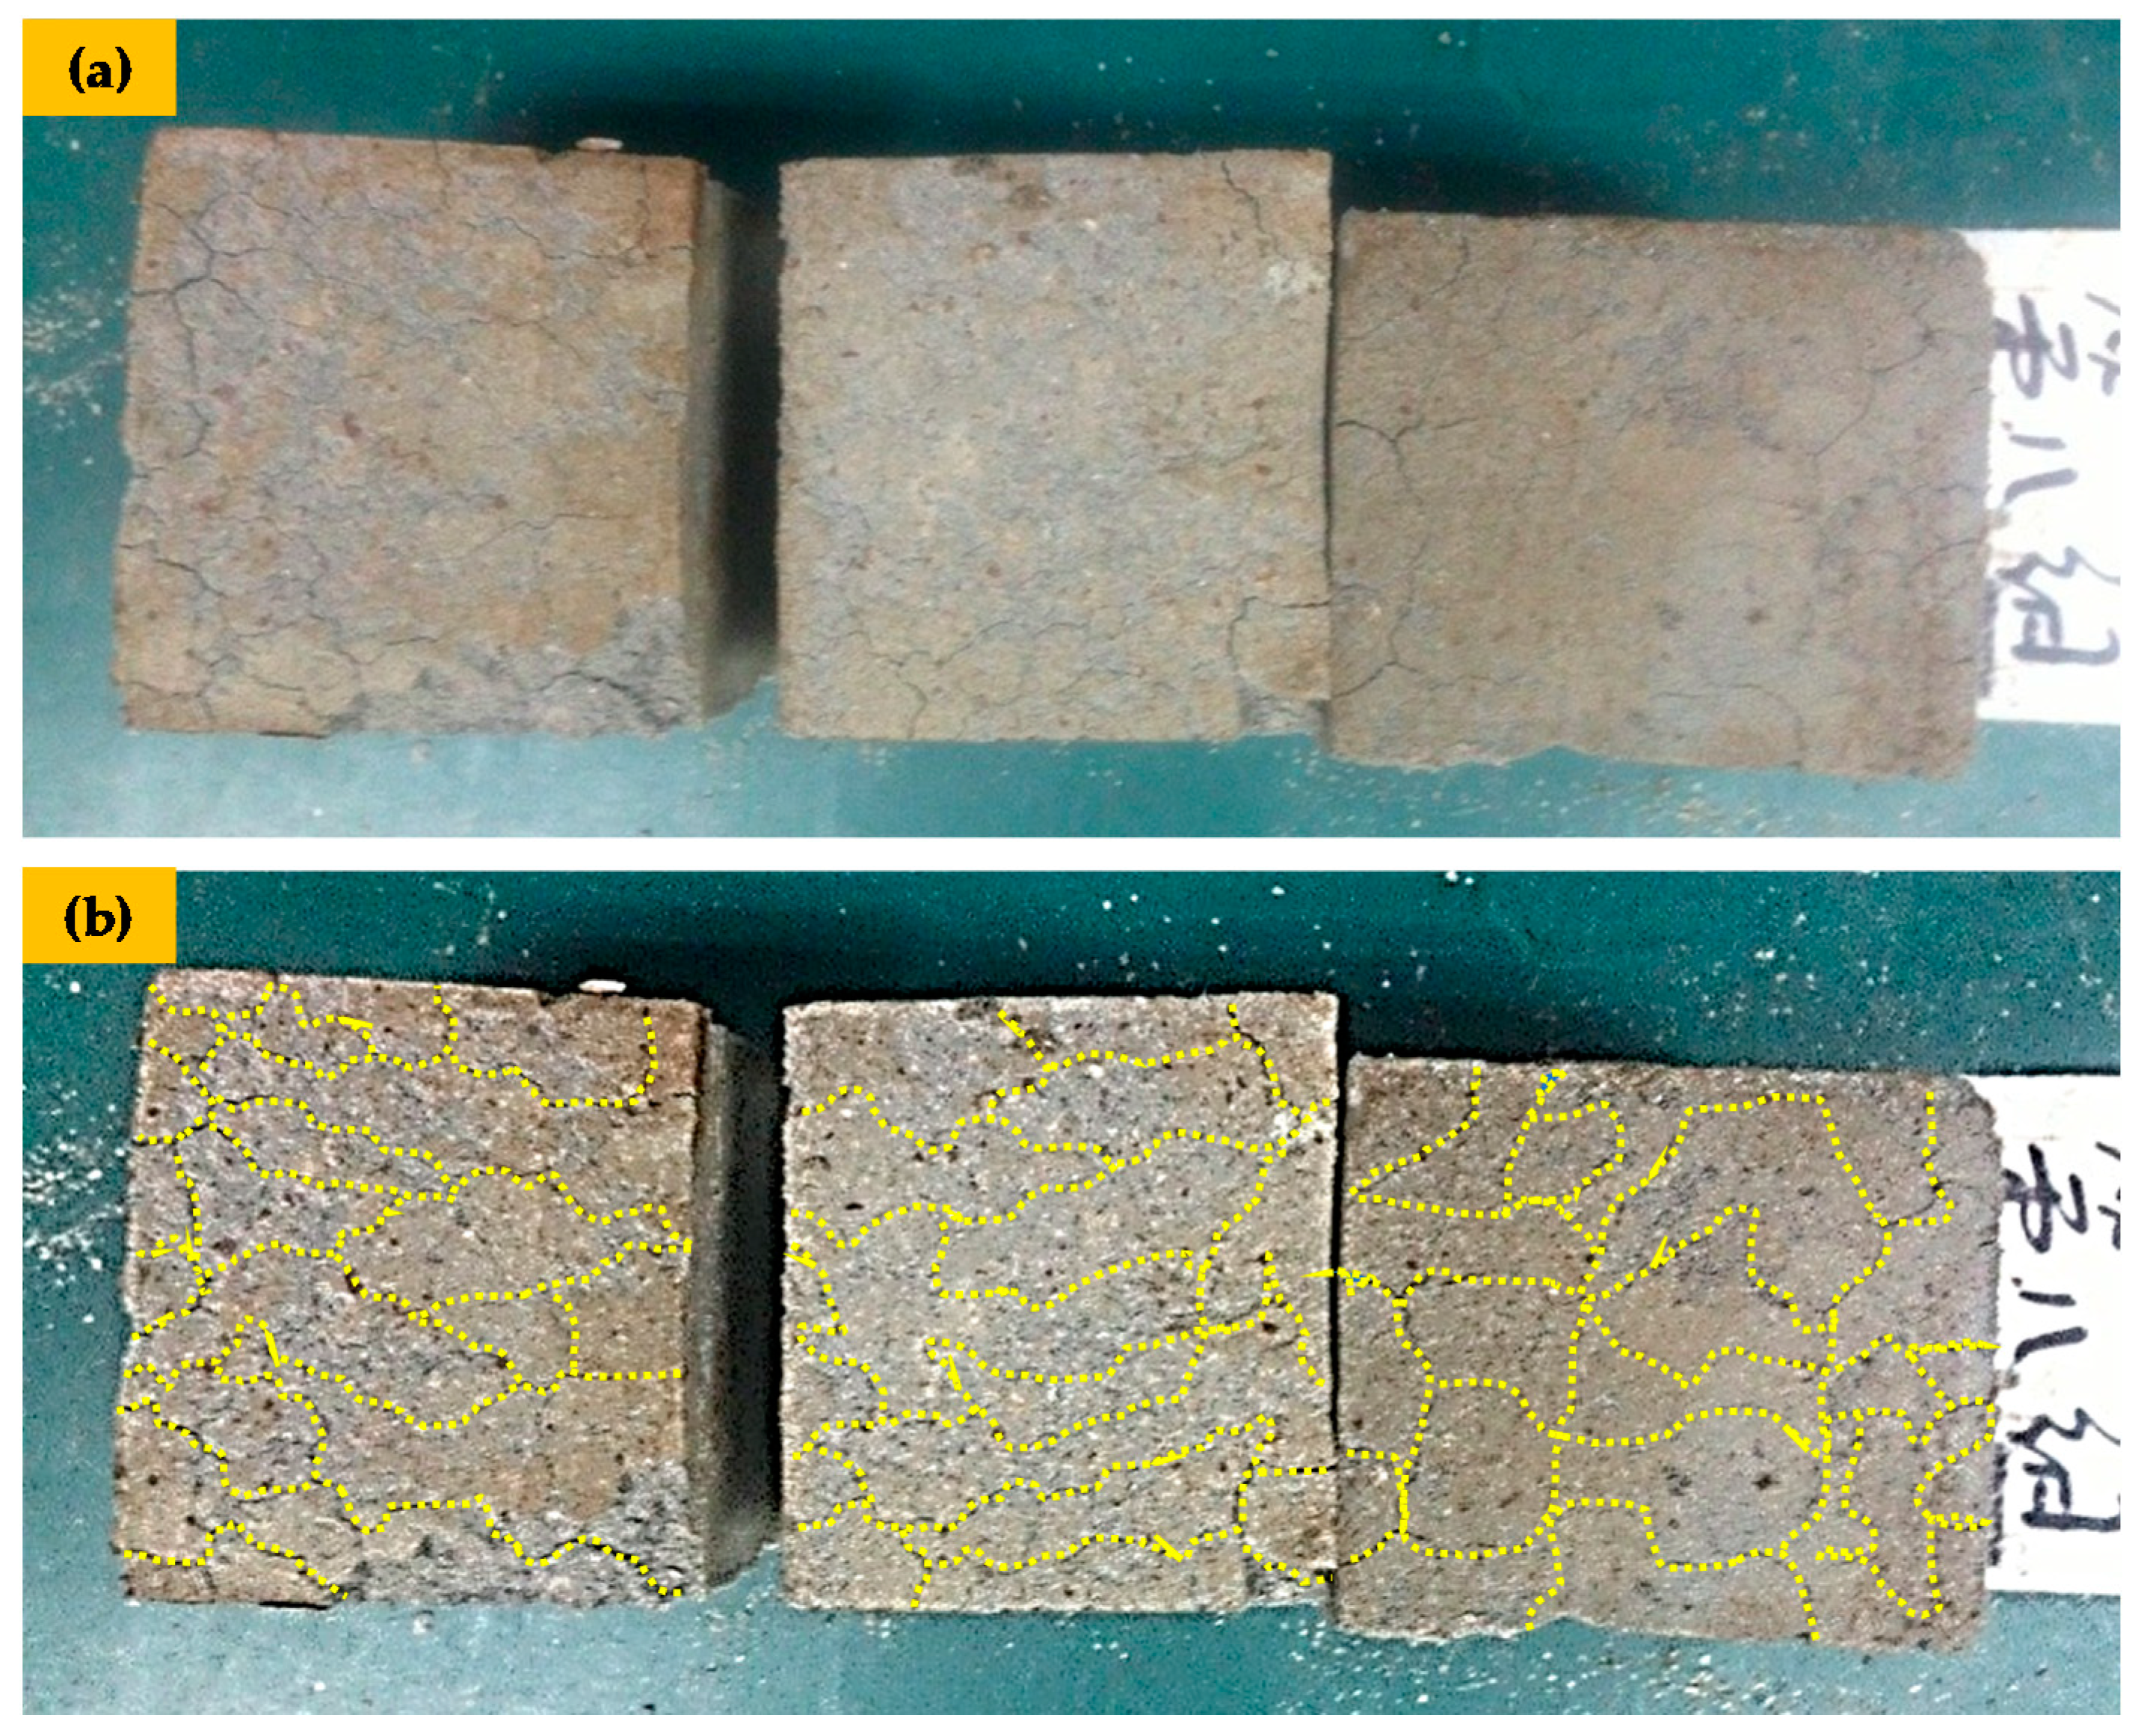
2.3. Uniaxial Compressive Strength Testing

Uniaxial compressive strength (UCS) can directly reflect the cementation performance of the new cementitious materials under different test parameters or combinations. The CTB sample used for UCS testing is a cube with a side length of 7.07 cm appropriate to the ASTM C109/C109M-16a standard procedure [55]. To determine the CTB’s strength gain based on the GB/T1767-1999 Chinese standard procedure, the WDW-100 electronic universal testing equipment (having a maximum pressure of 100 kN) was used at a loading rate of 0.5 mm/min. To reduce the experimental errors, at least three measurements were conducted to determine an average UCS value of CTB samples, and only the average values were considered. Figure 5 shows the used UCS test device and broken CTB sample after UCS testing.

3. Result and Analysis

3.1. Experimental Scheme and Results

Given the low content of CaO in DA, it was mostly packed with dense sulfate material. The total hydration time was prolonged, and only the weak base environment was generated. The micro power from the Tangshan Iron and Steel Company showed weak acidity. When the slag powder has potential self-activity, it can more easily stimulate hydraulic activity in an alkaline environment than in acidic conditions. Consequently, a typical alkaline activator SH was added to the experiment in order to adjust the acid and alkaline range of the hydration environment which obtains the best excitation effect during the experiments.
The tests used an orthogonal test design of four factors (Q, DA, GM, and SH) and three levels, with a cement-to-sand ratio of 1:8 and a slurry density of 73%. The dosage of GM and SH activators is determined based on the research and development results. At present, we have related patents for the preparation of gelling materials for desulfurization ash to replace gypsum. Due to the use of whole tailings and Q, the amount of individual activator is solemnly adjusted. To compare this with the new type of cementitious material, samples with the same glue-sand ratio and the slurry density were prepared by OPC 32.5R early strength cement. The test samples of DA residue formula were labeled as DA-1, DA-2, DA-3, and so on. Table 2 shows a summary of the experimental scheme and strength results.
The mechanical strength gains of 14-day and 28-day cured DA samples were better than those of the OPC 32.5R cement reference group under the same conditions (Table 2). The UCS values of CTB samples at 14 and 28 days were 1.259 and 2.429 MPa, which were 2.03 and 2.23 times of CTB samples, respectively.
The stope parameters of a single mine house during actual production were as follows: 40 m, length; 12 m, width; 50 m, extreme height; and 12.6 m, average mining thickness. Referring to the backfill strength design of the underground mines around the world, the 28-day strength acquisition of CTB samples must reach 2–2.5 MPa to meet the requirements of mine safety mining. Based on the relationship between the self-stabilization and height of CTB samples, and the relationship between the backfill body strength and maximum plastic zone width, the design strength of the 28-day cured CTB exceeded 2 MPa [56,57,58]. Therefore, when the mining thickness was less than or equal to the average thickness of 12.6 m, it could meet the safe and efficient mining requirements. By measuring the volume of the test blocks before and after de-molding, it was found that the 28-day shrinkage rate was mostly 5%, which was conducive to the realization of the roof grafting problem and the overall stability of the filling stope.
The strength gain of DA samples significantly increased since OH ions can promote the bond breaking reaction of the silicon-oxygen polymerization chain and provide channels for the other materials from the surface into the inside of the glass body [59,60,61]. These channels can accelerate the hydration reaction of the slag powder. Additionally, the proportion of sulfate minerals within the desulfurized ash was relatively high and the alkalinity of the activator decreased. The expansion phenomenon caused by free calcium sulfite and fly ash negatively affected the mechanical strength gain of cemented tailings backfill samples (Figure 6).

3.2. Influence of Weight of Each Activator

The DA formulation belonged to the category of new cementitious materials for the mines, in which slag powder was the main body of cementitious material. Q, DA, GM, and SH were used as activators. Considering the complex nonlinear relationship between the activator ratio and backfill strength, we should use the range and variance theory to analyze the weight of each activator on the mechanical properties of the backfill material. The statistical results of range and variance analyses are shown in Table 3.
The results of range and variance analyses in Table 3 reveal explicitly that each activator had a consistent weight effect on the mechanical strength gain of CTB samples, and SH was an important factor influencing the mechanical strength acquisition of CTB samples. The orders of the influence of the compressive strength of activators for 14-day and 28-day cured CTB samples were as follows: SH > GM > DA > Q and SH > GM > Q > DA, respectively. The importance of an alkaline environment in promoting the hydration process of alkaline-activated slag cement was well verified, thus the SH content requires further study.

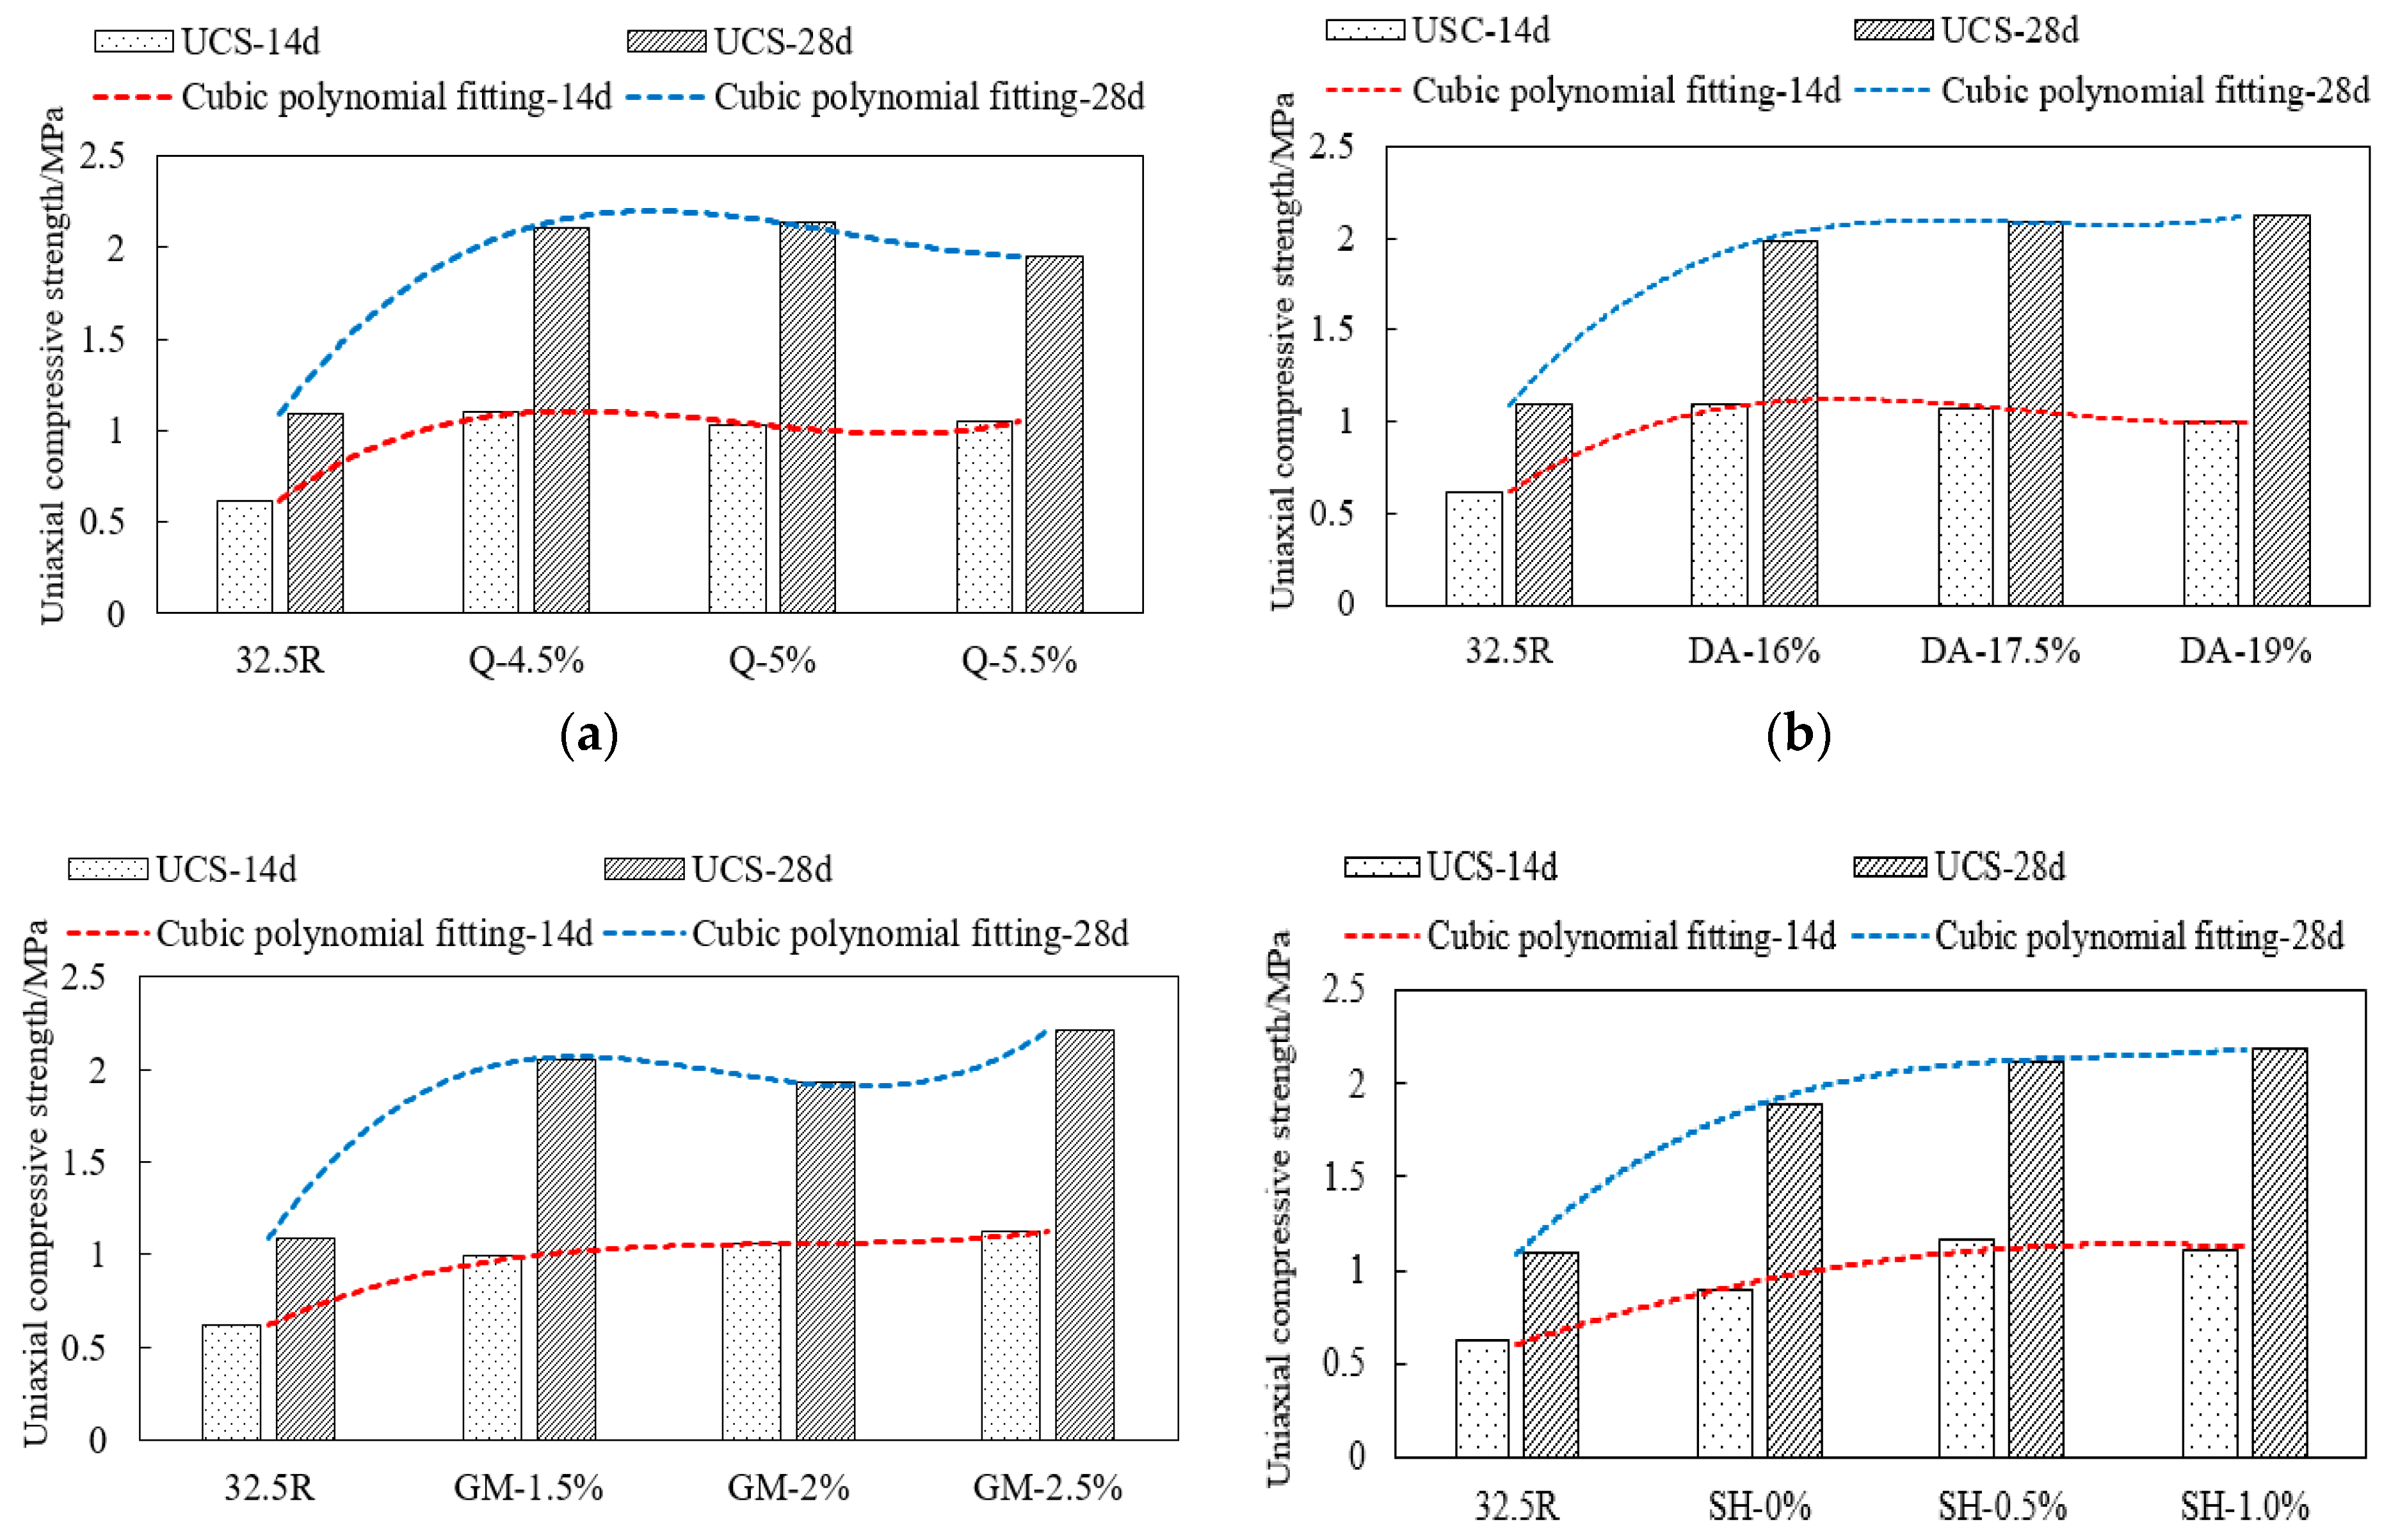
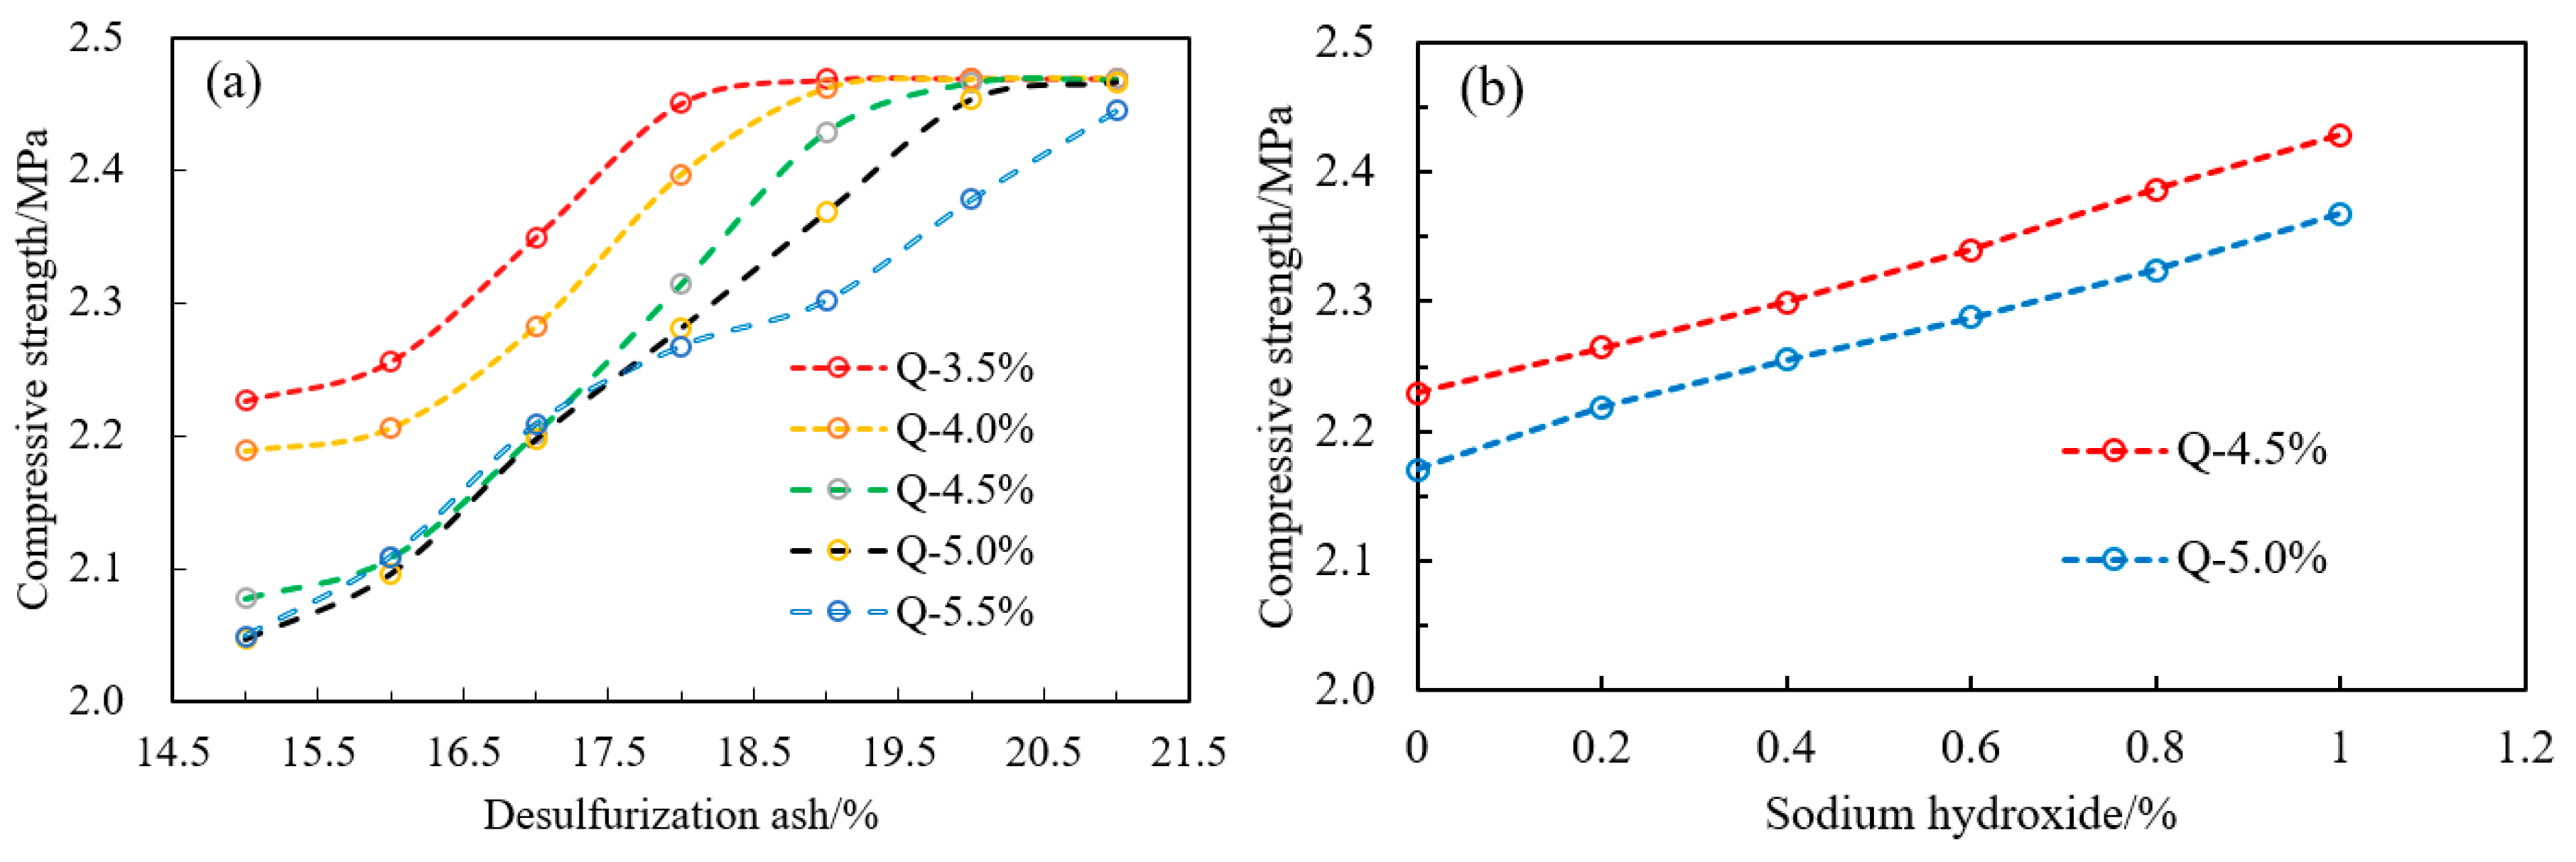
3.3. Influence of Each Activator on Compressive Strength of Testing Piece

To obtain the overall trend of changes in the mechanical strength acquisition of cemented tailings backfill samples under different activator dosages, the average strength values at each level of four activators were calculated, and the polynomial function was fitted. Table 4 shows the strength acquisition of cemented tailings backfill samples under different activator dosages, whereas Figure 7 shows the trend line of the mechanical strength gain of CTB samples containing different excitation agents, such as quicklime, desulfurized ash, glauberite mineral and sodium hydroxide. In this paper, the strength growth factor of the tested backfill samples was defined as follows:
K = ε i ε 0
where K is the strength growth factor of the tested backfill sample; εi is the uniaxial compressive strength acquisition of cemented tailings backfill samples with different activator dosages, MPa; and ε0 is the uniaxial compressive strength acquisition of cemented tailings backfill samples when OPC 32.5 R cement is used as the main activator, MPa.
As shown in Figure 7, the mechanical strength changes of cemented tailings backfill samples under different activator dosages basically followed the function y = ax3bx2 + cxd. The multiple correlation coefficients of the fitting results exceeded 97%, which indicated that the regression effect for the tested cemented tailings backfill samples was significant and demonstrated a high accuracy. Table 4 and Figure 7 showed clearly that the minimum strength growth factor of the DA formulation samples was 1.45 and the highest was 2.03. Therefore, the formula of DA was better than that of the cement activator.
As Figure 7a shows, when the Q content increased from 4.5 to 5.5%, the strength acquisition of 14-day cured CTB sample was influenced by the hydration reaction sequence of the cementitious material used, showing an initial decrease and subsequent increase. Besides, the strength acquisition of 28-day cured CTB slightly increased and then decreased. As shown in Figure 7b, when the DA content increased from 16 to 19%, the strength acquisition of 14-day cured CTB sample gradually decreased and the strength acquisition of 28-day cured CTB sample gradually increased. Given that DA has retardation characteristics, the initial condensation reaction of the whole tailings slurry slowed down, and the early strength acquisition of CTB samples was seriously affected. However, the long-term strength effect was not evident.
GM is a typical early strength agent that can effectively improve the early strength acquisition of CTB samples. When the GM dosage increased from 1.5 to 2.5%, the strength acquisition of 14-day cured CTB gradually decreased, and the strength acquisition of 28-day cured CTB decreased first and then increased thereafter, which is shown in Figure 7c. As illustrated in Figure 7d, when the dosage range was 0–1%, the strength acquisition of 14-day and 28-day cured CTB samples showed a gradually increasing trend with a rising SH content.

3.4. Initial Determination of Activator Dosage

The stepwise regression analysis of the quadratic polynomials refers to a method combining regression analysis and derives the mathematical relationship model between multiple independent and dependent variables [62]. For the DA formula experiment, the amounts of Q, DA, GM, and SH were used as independent variables, which were represented by X1, X2, X3, and X4, respectively. The compressive strength of CTB samples with different curing ages was used as the dependent variable. A quadratic polynomial stepwise regression equation was also established to initially determine the optimal proportion of the activator dosage.
(1)
Results of regression analysis of 14-day cured CTB strength
Y 14 d = 15.13 + 0.039 X 1 + 1.86 X 2 0.054 X 2 X 2 0.014 X 3 X 3 0.64 X 4 X 4 + 0.016 X 1 X 4 + 0.38 X 3 X 4
The optimum ratio was Q 5.5%, DA 17%, GM 2.5%, SH 1.0%; Y14d is 1.404 MPa.
(2)
Results of regression analysis of 28-day CTB strength
Y 28 d = 38.27 + 10.37 X 1 + 1.68 X 2 0.45 X 1 X 1 0.0027 X 2 X 2 + 0.32 X 3 X 3 0.31 X 1 X 2 0.27 X 1 X 3
The optimum ratio was: Q 4.5%, DA 19%, GM 2.5%, SH 1.0%; Y28d is 2.43 MPa.
According to the results of the influence of each activator on the compressive strength, as well as the stepwise regression analysis of the quadratic polynomials, the dosages of activator were determined to be 2.5% GM and 1% SH.

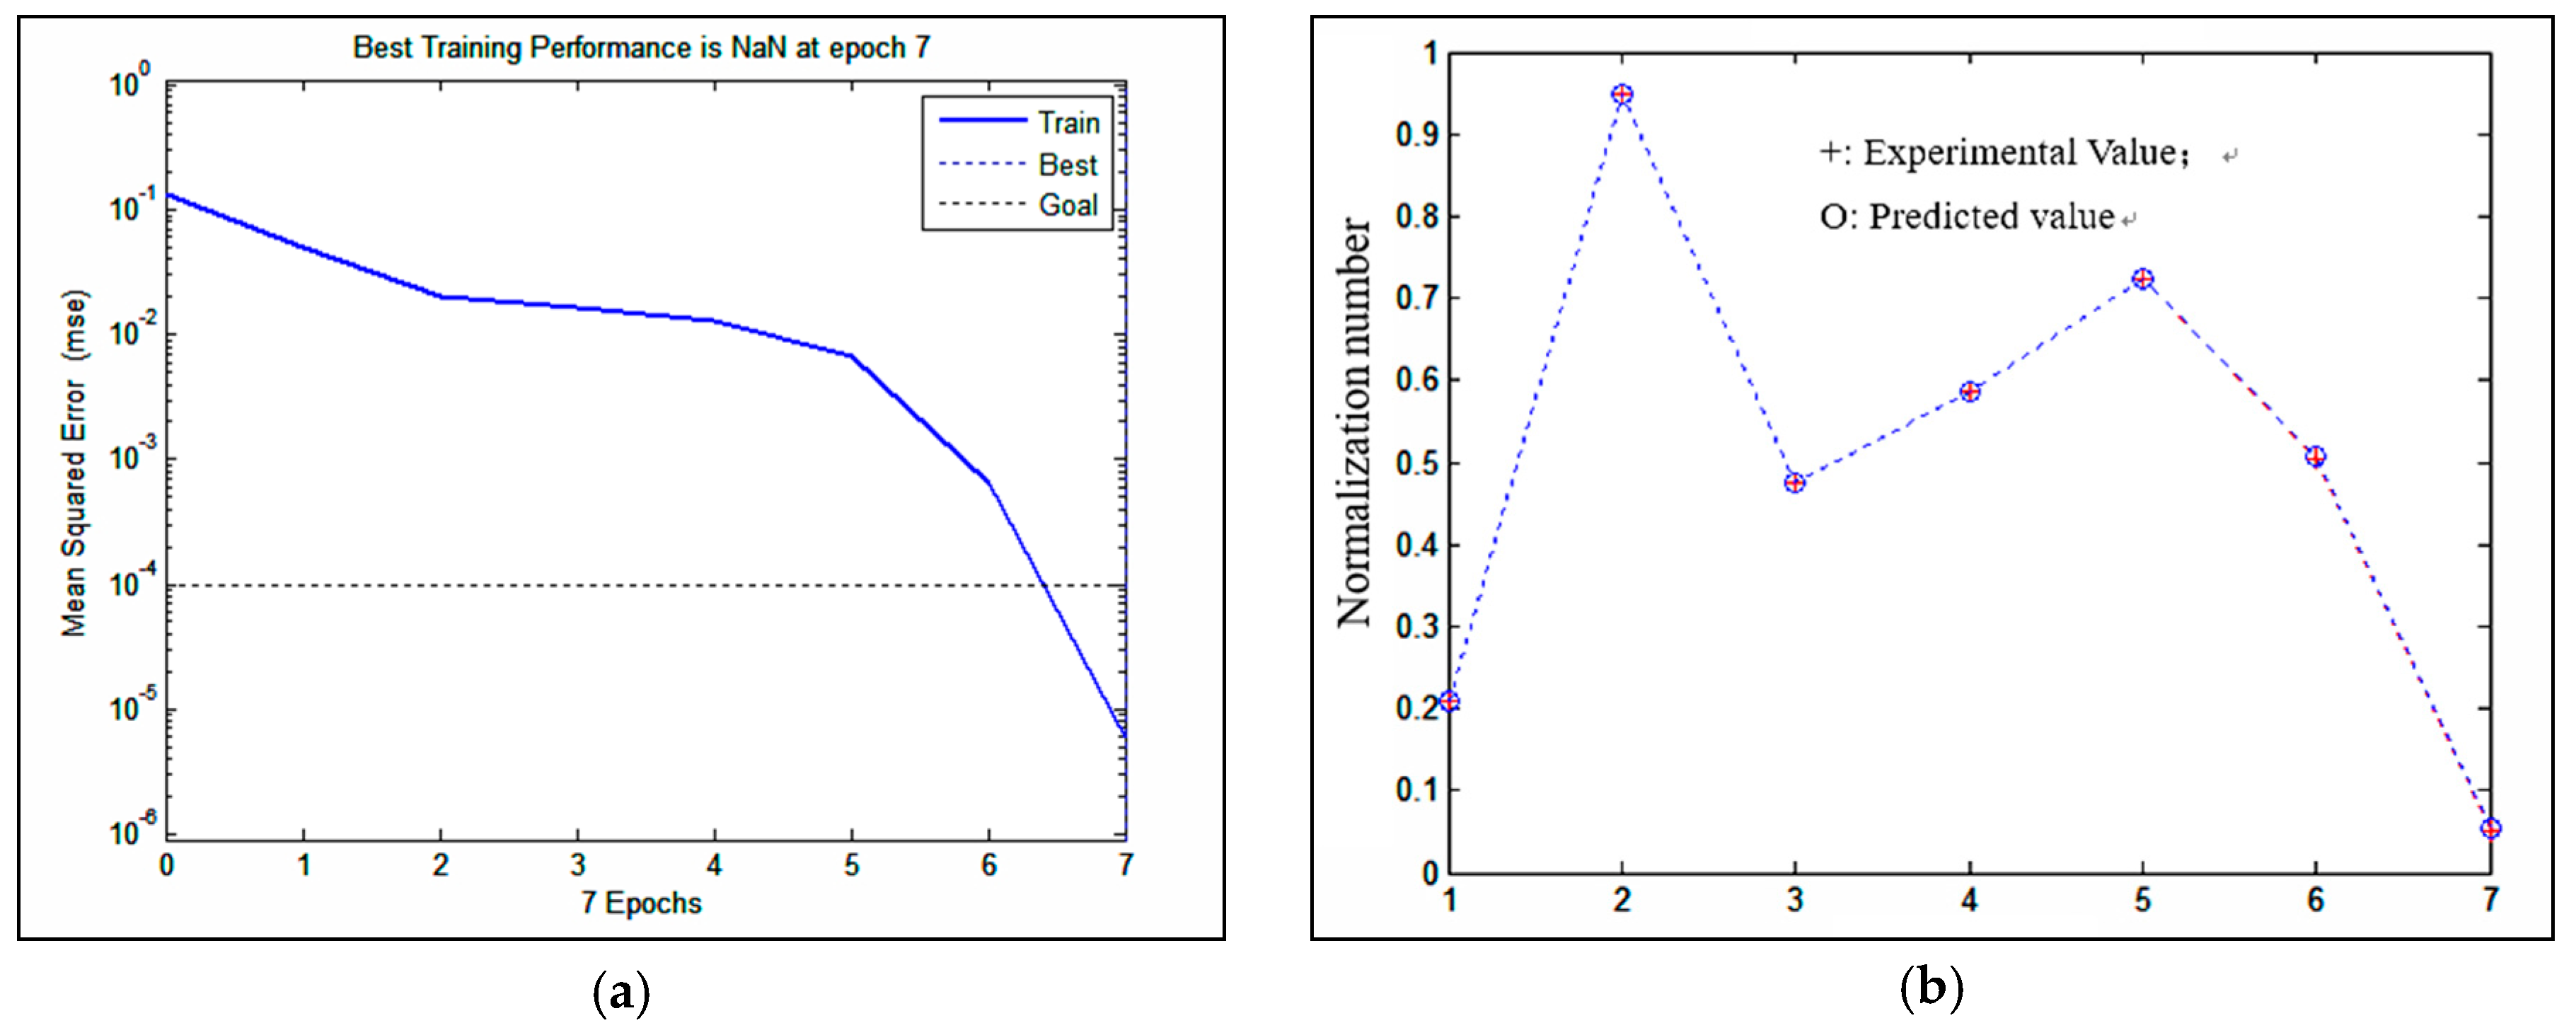
4. Improved Neural Network Prediction

4.1. Model Selection

The back propagation (BP) neural network is frequently composed of an input layer, a hidden layer, and an output layer. In this paper, the input layer was the dosage of Q, DA, GM, and SH, and the output layer was the 28-day backfill strength. In addition, the standard BP learning algorithm was improved by introducing additional impulse terms and adaptive learning rates [63,64].
The experimental data of the DA formulation (as shown in Table 2) and normalization theory demonstrated that the input layer data were first normalized to the interval [0, 1], and the output layer data were normalized to the interval [0.05, 0.95]. These values created a certain growth space for the predicted results. Two groups of DA-8 and DA-9 were used as test samples, and the other seven groups were used as training samples. The hidden layer’s neural transfer function was the non-linear Tansig function, and the output layer’s neuron transfer function was the Logsig function. The learning efficiency was 0.05, the maximum number of training was equal to 1000, and the minimum mean square error was 10−8. The number of hidden layer nodes in this model was (3–9) based on the implicit layer and node number theory. The neural network model after training and learning by the Matlab software was used to predict the untrained test samples. The predicted value was compared with the experimental value. When the error value was less than 5%, the established neural network model was considered to meet the requirements; otherwise, the training of the learning sample was continued. Finally, the model with the fastest error convergence curve and smallest prediction error was selected. Figure 8 shows the convergence curve of the neural network training error and the sample function fitting curve. Table 5 shows a summary of the experimental values and predicted values.
Table 5 shows that the test samples errors (DA-8 and DA-9) were 1.64% and 0.89%, respectively. The training sample errors all met the target error requirements; the maximum value was 0.19%, whereas the minimum error value was 0. Therefore, the constructed network model showed a good reliability and could be used to predict the strength of CTB samples and determine the relationship between different cementitious material ratios and the CTB’s compressive strength.

4.2. Optimization Prediction of Cementing Material Ratio

Figure 9a shows the predicted strength results of CTB samples with different DA contents. The GM content was 2.5% and the SH content was 1%. The following conclusions could be drawn from Figure 9a: (i) when the Q dosage was 3.5–5.5%, and the DA content was 15–21%, the mechanical strength of CTB samples exceeded 2 MPa; (ii) with the increase of the DA content, the backfill strength gradually increased. When the DA and Q contents were 21% and 3.5%, respectively, the maximum strength value reached 2.4691 MPa. When the DA and Q contents were 15% and 5.0%, respectively, the minimum strength of the backfill was 2.0468 MPa; (iii) the compressive strength of the backfill showed a decreasing trend with the increase of the Q content.
Given that our sample size was small, our study had some limitations in predicting data results. The quicklime content of 4.5–5.5% basically conformed to the experimental regularity. However, when the Q content was less than 4.5%, further confirmatory experimental studies were needed. Considering that DA has no cost as a solid waste, increasing the dosage could greatly reduce the cost of cementitious materials without affecting the comprehensive performance of CTB samples. Given that the low activity of the DA required excitation under good conditions, the quantity of the DA content was 19% and the Q content was 4.5% or 5.0%.
Figure 9b shows the predicted results of SH dosage, with 4.5% or 5.0% Q, 19% DA, and 2.5% GM. When the Q content was 4.5% and 5.0%, the compressive strength of the CTB samples increased with the increase of the SH content. In addition, when the SH content was greater than 0.7%, the CTB’s strength acquisition exceeded 2.3 MPa.
Considering the existence of certain safety and wealth coefficients, the strength of CTB samples was greater than 2.3 MPa to meet the requirements of mine safety production. When the Q contents were 4.5% and 5.0%, the DA dosage was 19% and the SH amount was greater than 0.7%. The costs of cementitious material were calculated as follows:
350 × (4.5~5.0) + 900 × 2.5% + 2100 × 0.7% + 110 × (72.8~73.3) = (133.58~134.78) ¥/ton.
In summary, the developed DA excitation formula not only satisfies the actual mining intensity requirements, making full use of DA; but also reduces the cost of backfill and mining, and improves the economic benefits of mining. The developed formula also responded to the country’s mining policy of green mining.

5. Conclusions

In this study, the effects of four different activator types (namely Q, DA, GM, and SH) on the compressive strength behavior were analyzed emphatically. Various UCS tests were carried out on laboratory-prepared CTB samples containing different activators. A quadratic polynomial stepwise regression equation was established to determine the optimal proportion of the activator dosage. Then, the Matlab software was used to predict the UCS value using a combination of range analysis and polynomial stepwise regression. The following conclusions can be drawn:
(1)
The compressive strength of 14-day and 28-day cured CTB samples stimulated by DA reached 1.259 and 2.429 MPa, which were 2.03 and 2.23 times that of the OPC 32.5 R cement sample, respectively. Thus, the samples met the requirements for safe and high-efficiency mining.
(2)
SH is the most significant activator that affects the strength gain of CTB samples. The order of the influence of different activator types for both 14-day and 28-day CTB samples was as follows: SH > GM > DA > Q and SH > GM > Q > DA, respectively. When the SH content gradually increased to 1%, the strength gain of 14-day and 28-day cured CTB samples showed a gradually increasing trend. DA affected the early strength of CTB samples, but it had no obvious effect on long-term strength gains.
(3)
The growth law of CTB’s strength gain at different activator dosages followed the function y = ax3bx2 + cxd. The minimum strength growth factor was 1.45, and the maximum reached 2.03. Thus, the DA formula was significantly better than the cement activator.
(4)
The constructed neural network model can grasp the nonlinear mapping relationship between CTB strength and different activator dosages, and it clearly demonstrated a certain reliability. The optimal decision-making results for the DA formula were as follows: the number of the hidden layer nodes of 5, Q 4.5% or 5%, DA 19%, GM 2.5%, and SH 0.7%.
The DA formula via the orthogonal design experimental scheme could meet the requirements for the 28-day cured CTB strength, hence protecting the surface morphology, solving the technical problems of riverbed and aquifer mining, and improving the mining recovery rate. However, the following deficiencies were also noted. The whole tailings containing a high fine content and poor size distribution led to difficulties in the experimental study. Consequently, this paper was limited to the backfill strength with a cement-to-sand ratio of 1:8 and a slurry density of 73%. Meanwhile, further analyses of other activator materials available are necessary to maximize the use of solid wastes and adhere to solid waste recycling and green mining roads.

Author Contributions

G.X. and W.S. analyzed the experimental data and initiated the writing of the paper; E.Y. and S.C. modified the manuscript and corrected the English writing.

Funding

This research was generously funded by China Postdoctoral Science Foundation (grant number: 2018M631341), the Open fund of the Key Laboratory of Ministry of Education for Efficient Mining and Safety of Metal Mines (grant number: USTBMSLAB201804) and the Fundamental Research Funds for the Central Universities (grant number: FRF-TP-17-075A1).

Acknowledgments

The authors would like to sincerely appreciate the detailed and constructive reviews and suggestions from two anonymous reviewers, which greatly improved this paper.

Conflicts of Interest

The authors declare no conflict of interest.

References

  1. Cao, S.; Song, W.D.; Xue, G.L.; Ma, R.W.; Zhu, P.R. Mechanical characteristics variation of stratified cemented tailing backfilling and its failure modes. J. Chin. Univ. Min. Technol. 2016, 45, 717–722. [Google Scholar]
  2. Sun, W.; Wang, H.J.; Hou, K.P. Control of waste rock-tailings paste backfill for active mining subsidence areas. J. Clean Prod. 2018, 171, 567–579. [Google Scholar] [CrossRef]
  3. Fall, M.; Benzaazoua, M.; Saa, E.G. Mix proportioning of underground cemented tailings backfill. Tunn. Undergr. Space Technol. 2008, 23, 80–90. [Google Scholar] [CrossRef]
  4. Yilmaz, E.; Benzazoua, M.; Busiere, B.; Pouliot, S. Influence of disposal configurations on hydrogeological behaviour of surface paste disposal: A field experimental study. Int. J. Miner. Process. 2014, 131, 12–25. [Google Scholar] [CrossRef]
  5. Yilmaz, E.; Fall, M. Paste Tailings Management, 1st ed.; Springer International Publishing: Cham, Switzerland, 2017; pp. 1–303. ISBN 978-3-319-39680-4. [Google Scholar]
  6. Cao, S.; Song, W.D.; Yilmaz, E. Influence of structural factors on uniaxial compressive strength of cemented tailings backfill. Constr. Build. Mater. 2018, 174, 190–201. [Google Scholar] [CrossRef]
  7. Cao, S.; Song, W.D. Effect of filling interval time on the mechanical strength and ultrasonic properties of cemented coarse tailing backfill. Int. J. Miner. Process. 2017, 166, 62–68. [Google Scholar] [CrossRef]
  8. Aldhafeeri, Z.; Fall, M. Sulphate induced changes in the reactivity of cemented tailings backfill. Int. J. Miner. Process. 2017, 16, 13–23. [Google Scholar] [CrossRef]
  9. Yilmaz, E. Stope depth effect on field behaviour and performance of cemented paste backfills. Int. J. Min. Reclam. Environ. 2018, 32, 273–296. [Google Scholar] [CrossRef]
  10. Cao, S.; Yilmaz, E.; Song, W.D. Dynamic response of cement-tailings matrix composites under SHPB compression load. Constr. Build. Mater. 2018, 186, 892–903. [Google Scholar]
  11. Yilmaz, E. One-dimensional consolidation parameters of cemented paste backfills. Miner. Resour. Manag. 2012, 28, 29–45. [Google Scholar]
  12. Yilmaz, E.; Belem, T.; Benzaazoua, M.; Kesimal, A.; Ercikdi, B. Evaluation of the strength properties of deslimed tailings paste backfill. Miner. Resour. Eng. 2007, 12, 129–144. [Google Scholar]
  13. Yilmaz, E.; Kesimal, A.; Ercikdi, B. The factors affecting the strength and stability of paste backfill. Yerbilimleri Bull. Earth Sci. 2003, 28, 155–169. [Google Scholar]
  14. Belem, T.; Benzaazoua, M. Design and application of underground mine paste backfill technology. Geotech. Geol. Eng. 2008, 26, 147–174. [Google Scholar] [CrossRef]
  15. Kesimal, A.; Yilmaz, E.; Ercikdi, B.; Alp, I.; Yumlu, M.; Ozdemir, B. Paste backfill technology in underground mining: A case study. Turk. J. Earth Sci. Rev. 2003, 16, 45–53. [Google Scholar]
  16. Koohestani, B.; Darban, A.K.; Darezerehki, E.; Mokhtari, P.; Yilmaz, E.; Yilmaz, E. The influence of sodium and sulfate ions on total solidification and encapsulation potential of iron-rich acid mine drainage in silica gel. J. Environ. Chem. Eng. 2018, 6, 3520–3527. [Google Scholar] [CrossRef]
  17. Yang, L.; Yilmaz, E.; Li, J.W.; Liu, H.; Jiang, H.Q. Effect of superplasticizer type and dosage on fluidity and strength behavior of cemented tailings backfill with different solid contents. Constr. Build. Mater. 2018, 187, 290–298. [Google Scholar] [CrossRef]
  18. Ercikdi, B. Effect of Pozzolanic Mineral and Chemical Admixtures on Paste Backfill Performance. Ph.D. Thesis, Karadeniz Technical University, Trabzon, Turkey, 2009; pp. 1–142. [Google Scholar]
  19. Hewlett, P. Lea’s Chemistry of Cement and Concrete, 5th ed.; Butterworth-Heinemann: Saint Louis, MO, USA, 2018; pp. 1–1092. ISBN 978-0-081-00773-0. [Google Scholar]
  20. Cincotto, M.A.; Melo, A.A.; Repette, L. Effect of different activators type and dosages and relation to autogenous shrinkage of activated blast furnace slag cement. In Proceedings of the 11th International Congress on the Chemistry of Cement, Durban, South Africa, 11–16 May 2003; pp. 1878–1888. [Google Scholar]
  21. Cihangir, F. Investigation of Utilisation of Alkali Activated Blast Furnace Slag as Binder in Paste Backfill. Ph.D. Thesis, Karadeniz Technical University, Trabzon, Turkey, 2011; pp. 1–207. [Google Scholar]
  22. Cihangir, F.; Ercikdi, B.; Kesimal, A.; Ocak, S.; Akyol, Y. Effect of sodium-silicate activated slag at different silicate modulus on the strength and microstructural properties of full and coarse sulphidic tailings paste backfill. Constr. Build. Mater. 2018, 185, 555–566. [Google Scholar] [CrossRef]
  23. Kermani, M.; Hassani, F.P.; Aflaki, E.; Benzaazoua, M.; Nokken, M. Evaluation of the effect of sodium silicate addition to mine backfill, Gelfill: Part 1. J. Rock Mech. Geotech. Eng. 2015, 7, 266–272. [Google Scholar] [CrossRef]
  24. Kermani, M.; Hassani, F.P.; Aflaki, E.; Benzaazoua, M.; Nokken, M. Evaluation of the effect of sodium silicate addition to mine backfill, Gelfill: Part 2: Effects of mixing time and curing temeprature. J. Rock Mech. Geotech. Eng. 2015, 7, 668–673. [Google Scholar] [CrossRef]
  25. Manjunath, R.; Narasimhan, M.C. An experimental investigation on self-compacting alkali activated slag concrete mixes. J. Build. Eng. 2018, 17, 1–12. [Google Scholar] [CrossRef]
  26. Gebregziabiher, B.S.; Thomas, R.; Peethamparan, S. Very early-age reaction kinetics and microstructural development in alkali-activated slag. Cem. Concr. Compos. 2015, 55, 91–102. [Google Scholar] [CrossRef]
  27. Islam, S.; Hague, A.; Bui, H.H. 1-D compression behaviour of acid sulphate soils treated with alkali-activated slag. Materials 2016, 9, 289. [Google Scholar] [CrossRef] [PubMed]
  28. Ahmari, S.; Parameswaran, K.; Zhang, L. Alkali activation of copper mine tailings and low-calcium flash-furnace copper smelter slag. J. Mater. Civ. Eng. 2015, 27, 1–15. [Google Scholar] [CrossRef]
  29. Kiventerä, J.; Golek, L.; Yliniemi, J.; Ferreira, V.; Deja, J.; Illikainen, M. Utilization of sulphidic tailings from gold mine as a raw material in geopolymerization. Int. J. Miner. Process. 2016, 149, 104–110. [Google Scholar] [CrossRef]
  30. Pan, Z.H.; Zhang, J.; Liu, W.Q. Solidification/stabilization of zinc-lead tailings by alkali activated slag cement. J. Wuhan Univ. Technol. Mater. Sci. Ed. 2015, 30, 105–108. [Google Scholar] [CrossRef]
  31. Zhou, Y.L.; Deng, H.W.; Liu, J.X. Rational utilization of fine unclassified tailings and activated blast furnace slag with high calcium. Minerals 2017, 7, 48. [Google Scholar] [CrossRef]
  32. Razavi, M.; Hassani, F.P. Strength development and characteristics of sodium silicate-fortified sand pastefill/The effect of binder content-sodium silicate concentration, and pulp density. In Proceedings of the 9th International Symposium on Mining with Backfill, Montreal, QC, Canada, 2007; pp. 1–12. [Google Scholar]
  33. Barnett, S.J.; Soutsos, M.N.; Millard, S.G.; Bungey, J.H. Strength development of mortars containing ground granulated blast-furnace slag: Effect of curing temperature and determination of apparent activation energies. Cem. Concr. Res. 2006, 36, 434–440. [Google Scholar] [CrossRef]
  34. Zhao, F.Q.; Ni, W.; Wang, H.J.; Liu, H.J. Activated fly ash/slag blended cement. Resour. Conserv. Recycl. 2007, 52, 303–313. [Google Scholar] [CrossRef]
  35. Chi, M.; Huang, R. Binding mechanism and properties of alkali-activated fly ash/slag mortars. Constr. Build. Mater. 2013, 40, 291–298. [Google Scholar] [CrossRef]
  36. Thomas, R.J.; Gebregziabiher, B.S.; Giffin, A.; Peethamparan, S. Micromechanical properties of alkali-activated slag cement binders. Cem. Concr. Compos. 2018, 90, 241–256. [Google Scholar] [CrossRef]
  37. Liu, R.G.; Ding, S.D.; Yan, P.Y. Influence of hydration environment on the characteristics of ground granulated blast furnace slag hydration products. Bull. Chin. Ceram. Soc. 2015, 34, 1594–1599. [Google Scholar]
  38. Li, M.H.; Yang, Z.Q.; Wang, Y.T.; Gao, Q. Experiment study of compressive strength and mechanical property of filling body for fly ash composite cementitious materials. J. China Univ. Min. Technol. 2015, 44, 650–655, 695. [Google Scholar]
  39. Ren, A.; Feng, G.R.; Guo, Y.X.; Qi, T.Y.; Guo, J.; Zhang, M.; Kang, L.X.; Han, Y.L.; Zhang, P.L. Influence on performance of coal mine filling paste with fly ash. J. Chin. Coal Soc. 2014, 39, 2374–2380. [Google Scholar]
  40. Yao, Z.G. Investigation on the Interaction Mechanism of Backfill and Aluminum Matrix Composites Cogulation Material for Filling Mines. Ph.D. Thesis, Central South University, Hunan, China, 2010; pp. 1–304. [Google Scholar]
  41. Wang, X.M.; Xue, X.L.; Zhang, Q.L.; Hu, Y.; Yang, L. Optimum ratio and application of joint cemented backfill with crushed rock and phosphogypsum. J. Cent. South Univ. 2015, 46, 3767–3773. [Google Scholar]
  42. Guo, X.L.; Shi, H.S. Influence of thermally treated flue gas desulfurization (FGD) gypsum on performance of the slag powder concrete. J. Wuhan Univ. Technol. (Mater. Sci. Ed.) 2013, 28, 1122–1127. [Google Scholar] [CrossRef]
  43. Wang, C.Q.; Tan, K.F.; Dai, C.B.; Wang, P.X. Research status on the comprehensive utilization of Desulphurized ash in China. Fly Ash Compre. Utilization 2014, 2, 51–56. [Google Scholar]
  44. Yang, Z.Q.; Xiong, L.F.; Fang, L.; Gao, Q.; Tian, L.P. Preparation of new filling cementing materials with sintering desulphurized ash. Nonferrous Met. Sci. Eng. 2015, 6, 8–12. [Google Scholar]
  45. Wang, C.C. Modelling of the compressive strength development of cement mortar with furnace slag and desulfurization slag from the early strength. Constr. Build. Mater. 2016, 128, 108–117. [Google Scholar] [CrossRef]
  46. Li, M.H.; Yang, Z.Q.; Gao, Q.; Wang, Y.T. The orthogonal test and optimal decision for the development of new backfill cementing materials based on the rod milling sand. Adv. Mater. Res. 2014, 962–965, 1100–1105. [Google Scholar] [CrossRef]
  47. Wang, C.Q.; Tan, K.F.; Xu, X.X.; Wang, P.X. Effect of activators, admixtures and temperature on the early hydration performance of desulphurized ash. Constr. Build. Mater. 2014, 70, 322–331. [Google Scholar] [CrossRef]
  48. Chen, Z.W.; Wu, S.P.; Li, F.Z.; Chen, J.Y.; Qin, Z.H.; Pang, L. Recycling of flue gas desulfurization residues in gneiss based hot mix asphalt: materials characterization and performances evaluation. Constr. Build. Mater. 2014, 73, 137–144. [Google Scholar] [CrossRef]
  49. ASTM Standard D421-85. Standard Practice for Dry Preparation of Soil Samples for Particle Size Analysis and Determination of Soil Constants; Annual Book of ASTM Standards, 04.08; American Society of Testing Material International: West Conshohocken, PA, USA, 2007; pp. 8–9. Available online: www.astm.org (accessed on 15 August 2018). [CrossRef]
  50. Shi, W.X.; Lin, C.; Chen, W.; Hong, J.L.; Chang, J.C.; Dong, Y.; Zhang, Y.L. Environmental effect of current desulfurization technology on fly ash dust emission in China. Renew. Sustain. Energy Rev. 2017, 72, 1–9. [Google Scholar] [CrossRef]
  51. Babu, K.G.; Kumar, V.S.R. Efficiency of GGBS in concrete. Cem. Concr. Res. 2000, 30, 1031–1036. [Google Scholar] [CrossRef]
  52. Zhu, X.L.; Zhou, M.R. Water quenching blast furnace slag comprehensive utilization route. Chin. Resour. Compr. Utilization 2005, 7, 8–10. [Google Scholar]
  53. Li, C. Research on the Glass Phase of Slag, High Calcium Fly Ash and Low Calcium Fly Ash and Their Hydration Mechanism. Ph.D. Thesis, Tsinghua University, Beijing, China, 2011; pp. 1–21. [Google Scholar]
  54. Dong, L.; Gao, Q.; Nan, S.Q.; Du, J.Q. Performance and hydration mechanism of new super fine cemented whole-tailings backfilling materials. J. Cent. South Univ. 2013, 44, 1571–1577. [Google Scholar]
  55. ASTM Standard C109/C109M-16a. Standard Test Method for Compressive Strength of Hydralic Cement Mortars (using 2-in. or (50-mm) Cube Specimens; Annual Book of ASTM Standards, 04.08; American Society of Testing Material International: West Conshohocken, PA, USA, 2016; pp. 1–9. Available online: www.astm.org (accessed on 15 August 2018). [CrossRef]
  56. Yilmaz, E.; Belem, T.; Benzaazoua, M. Specimen size effect on strength behavior of cemented paste backfills subjected to different placement conditions. Eng. Geol. 2014, 185, 52–62. [Google Scholar] [CrossRef]
  57. Kesimal, A.; Yilmaz, E.; Ercikdi, B. Evaluation of paste backfill test results obtained from different size slumps with varying cement contents for sulphur-rich mill tailings. Cem. Concr. Res. 2004, 34, 1817–1822. [Google Scholar] [CrossRef]
  58. Yilmaz, E.; Belem, T.; Benzaazoua, M.; Bussière, B. Assessment of the modified CUAPS apparatus to estimate in situ properties of cemented paste backfill. Geotech. Test. J. 2010, 33, 351–362. [Google Scholar]
  59. Yilmaz, E.; Benzaazoua, M.; Belem, T.; Bussière, B. Effect of curing under pressure on compressive strength development of cemented paste backfill. Miner. Eng. 2009, 22, 772–785. [Google Scholar] [CrossRef]
  60. Yilmaz, E.; Belem, T.; Bussière, B.; Benzaazoua, M. Relationships between microstructural properties and compressive strength of consolidated and unconsolidated cemented paste backfills. Cem. Concr. Compos. 2011, 33, 702–715. [Google Scholar] [CrossRef]
  61. Cao, S.; Yilmaz, E.; Song, W.D. Evaluation of viscosity, strength and microstructural properties of cemented tailings backfill. Minerals 2018, 8, 352. [Google Scholar] [CrossRef]
  62. Ji, Y.P. The method of rock mass in-situ stress inversion based on stepwise multiple regression. J. Lanzhou Jiaotong Technol. 2016, 35, 52–57. [Google Scholar]
  63. Sahoo, B.K.; De, S.; Meikap, B.C. Artifical neural network approach for rheological characteristics of coal-water slurry using microwave pre-treatment. Int. J. Min. Sci. Technol. 2017, 27, 379–386. [Google Scholar] [CrossRef]
  64. Zhou, Y.; Meng, Q.; Lin, B.Q.; Qin, J.L.; Zhou, G.P. A simple method for solving unidirectional methane gas flow in coal seam based on similarity solution. Int. J. Min. Sci. Technol. 2018, 28, 331–334. [Google Scholar] [CrossRef]
Figure 1. Photo of the LS-POP (VI) laser particle sizer.
Applsci 08 01537 g001
Figure 2. Particle size distribution curve (a) and fractal fitting curve (b) of the tested tailings sample.
Applsci 08 01537 g002
Figure 3. Result of X-ray diffraction of the tested tailings sample.
Applsci 08 01537 g003
Figure 4. The CTB sample preparation steps: (a) mixing; (b) pouring; and (c) curing.
Applsci 08 01537 g004
Figure 5. Photos of UCS test device (a) and broken CTB sample after UCS testing (b).
Applsci 08 01537 g005
Figure 6. Expansion cracks of DA slag backfill blocks: (a) raw and (b) processed photos.
Applsci 08 01537 g006
Figure 7. Trend line of the mechanical strength acquisition of CTB samples with different excitation agents: (a) quicklime (Q); (b) desulfurized ash (DA); (c) glauberite mineral (GM); and (d) sodium hydroxide (SH).
Applsci 08 01537 g007
Figure 8. Illustration of the training error convergence curve (a) and sample function fitting curve (b) of the tested CTB samples.
Applsci 08 01537 g008
Figure 9. Predicted strength curves of CTB samples: (a) desulfurization ash and (b) sodium hydroxide.
Applsci 08 01537 g009
Table 1. Chemical composition of the tested quicklime sample.
ManufacturerCaO (%)MgO (%)CaCO3 (%)Ca(OH)2 (%)Others (%)
Yongshun39.028.5215.8435.541.08
Yinshui73.059.888.278.790.01
Table 2. A summary of the experimental scheme and UCS test results.
Test No.Q/%DA/%GM/%SH/%Slag Powder/%Stress/MPa28-d Sinking Rate/%
14-d28-d
DA-14.5161.50780.9121.8305.20
DA-24.517.52.00.575.51.2222.0565.12
DA-34.5192.51.0731.1562.4294.85
DA-45.0162.01.0761.1192.0454.36
DA-55.017.52.50750.9482.1356.07
DA-65.0191.50.5741.0052.2454.21
DA-75.5162.50.575.51.2592.0684.88
DA-85.517.51.51.074.51.0532.0876.17
DA-95.5192.0073.50.8301.7013.16
OPC 32.5R cement type0.6191.0913.56
Table 3. Statistical results of the range and variance analyses.
Curing PeriodActivatorRange Analysis WeightsVariance Analysis
Sum of SquaresDegree of FreedomMean Square ErrorSignificance
14dQ10.008320.0041SH > GM > DA > Q
DA1.370.016420.0082
GM1.790.025720.0129
SH3.630.118420.0592
28dQ1.320.060720.0304SH > GM > Q > DA
DA10.034320.0171
GM1.920.115520.0577
SH2.070.148020.0740
Table 4. The strength gain of CTB samples under different activator dosages.
Activator14-d Stress/MPaK *28-d Stress/MPa K *Activator/%14-d Stress/MPaK *28-d Stress/MPaK *
32.5R0.619-1.091-
Q-4.5%1.0971.772.1051.93DA-16.0%1.0971.771.9811.82
Q-5.0%1.0241.652.1421.96DA-17.5%1.0741.742.0931.92
Q-5.5%1.0471.691.9521.79DA-19.0%0.9971.612.1251.95
GM-1.5%0.991.602.0541.88SH-0.0%0.8971.451.8891.73
GM-2.0%1.0571.711.9341.77SH-0.5%1.1621.882.1231.95
GM-2.5%1.1211.812.2112.03SH-1.0%1.1091.792.1872.00
* K stands for the strength growth factor.
Table 5. A summary of experimental values and predicted results.
Test No.Experimental Value/MPaPredicted Value/MPaRelative Error/%
DA-11.831.8297−0.02
DA-22.4292.4288−0.01
DA-32.0452.04570.04
DA-42.1352.1346−0.02
DA-52.2452.24500.00
DA-62.0682.07160.18
DA-71.7011.70430.19
DA-82.0562.08981.64
DA-92.0872.10550.89

