Fatigue Behavior of Prestressed Concrete Beam for Straddle-Type Monorail Tracks


Abstract
1. Introduction
2. Experimental Program
2.1. Materials
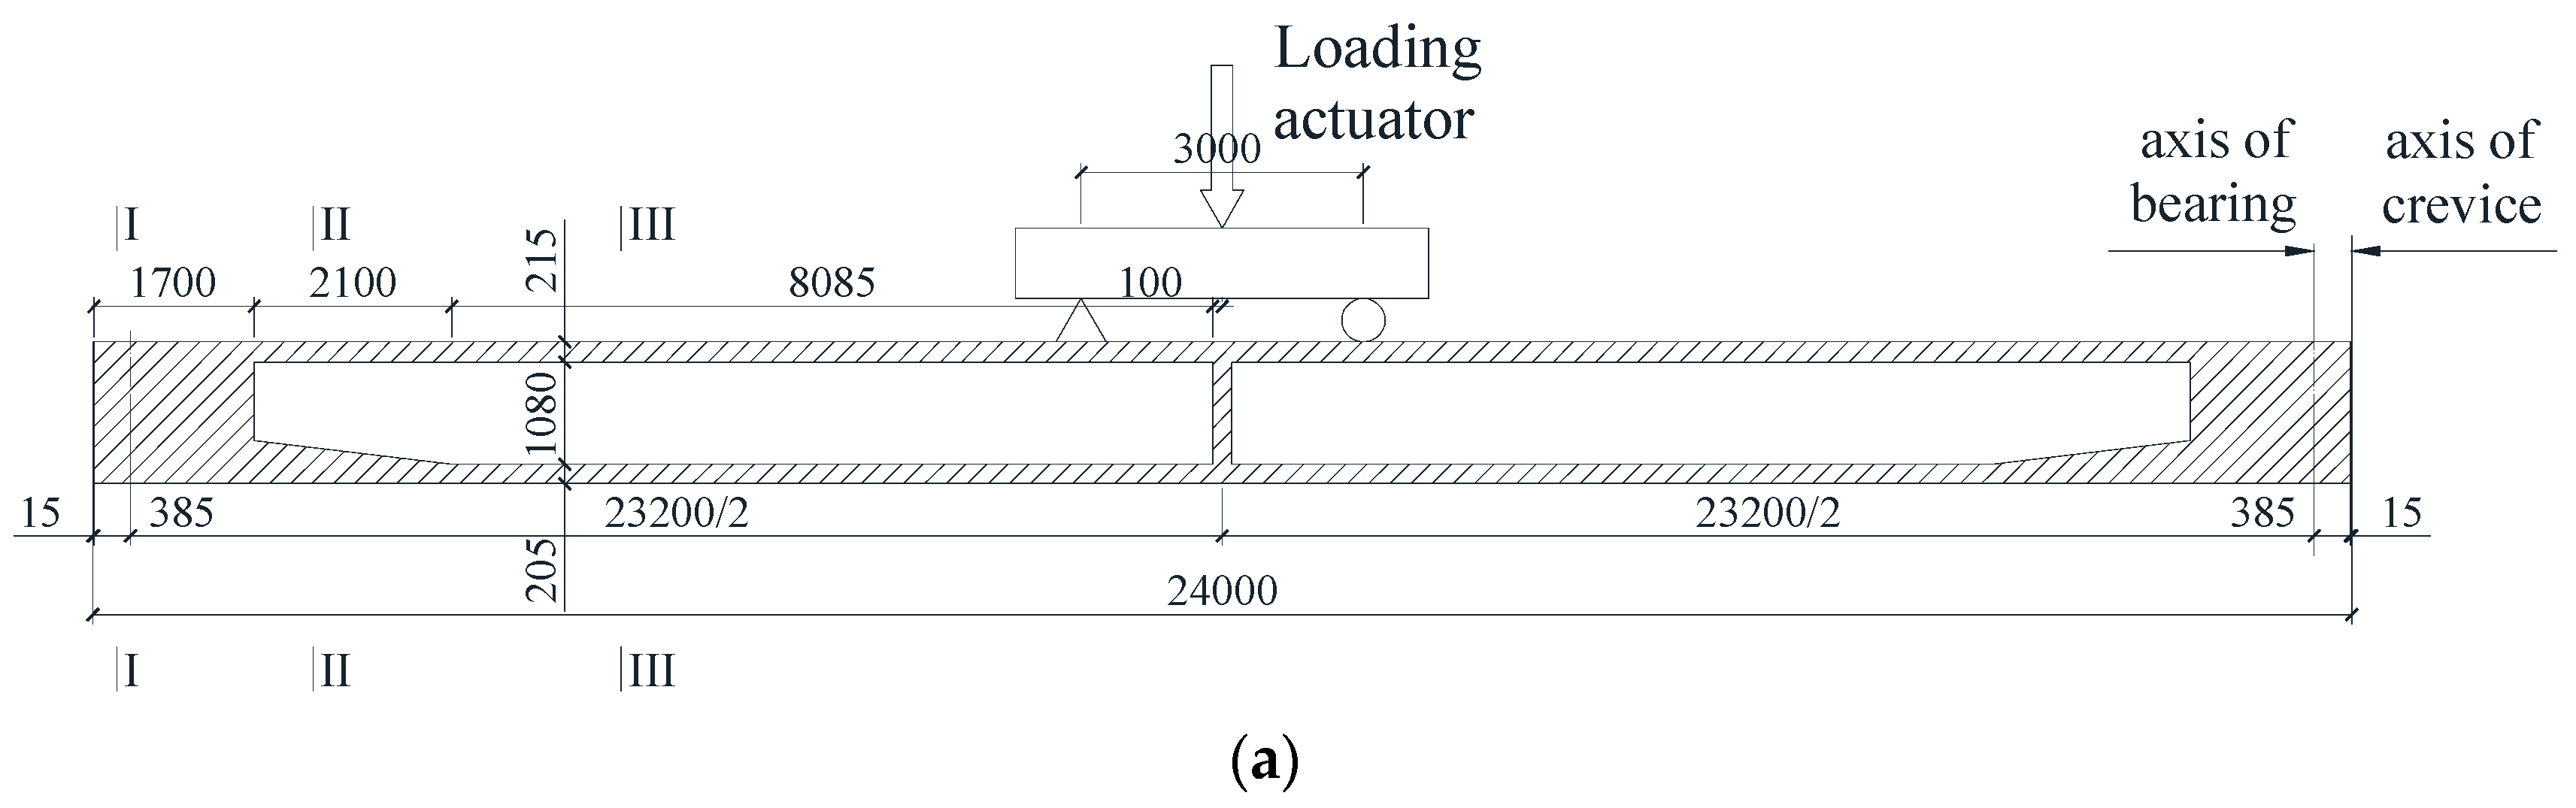
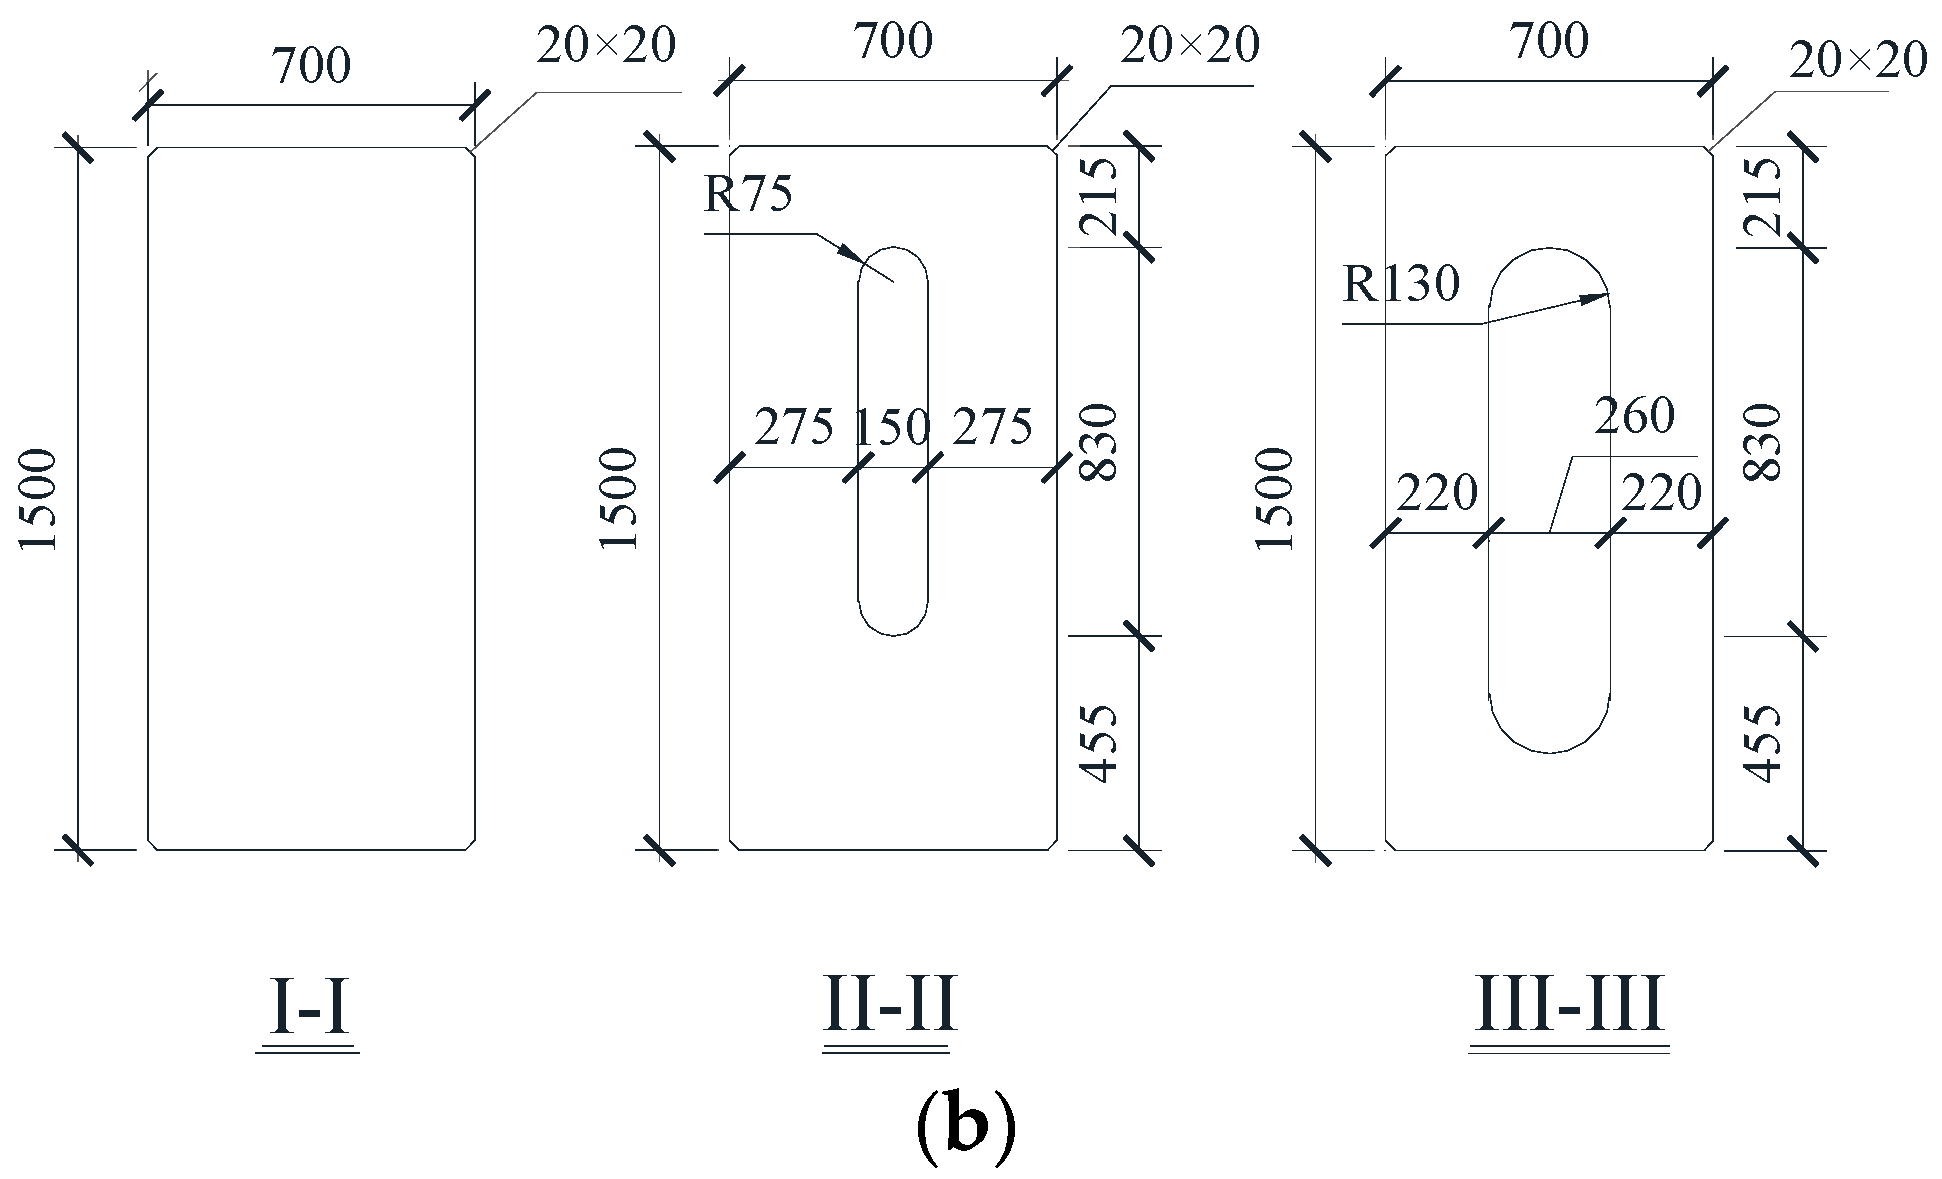
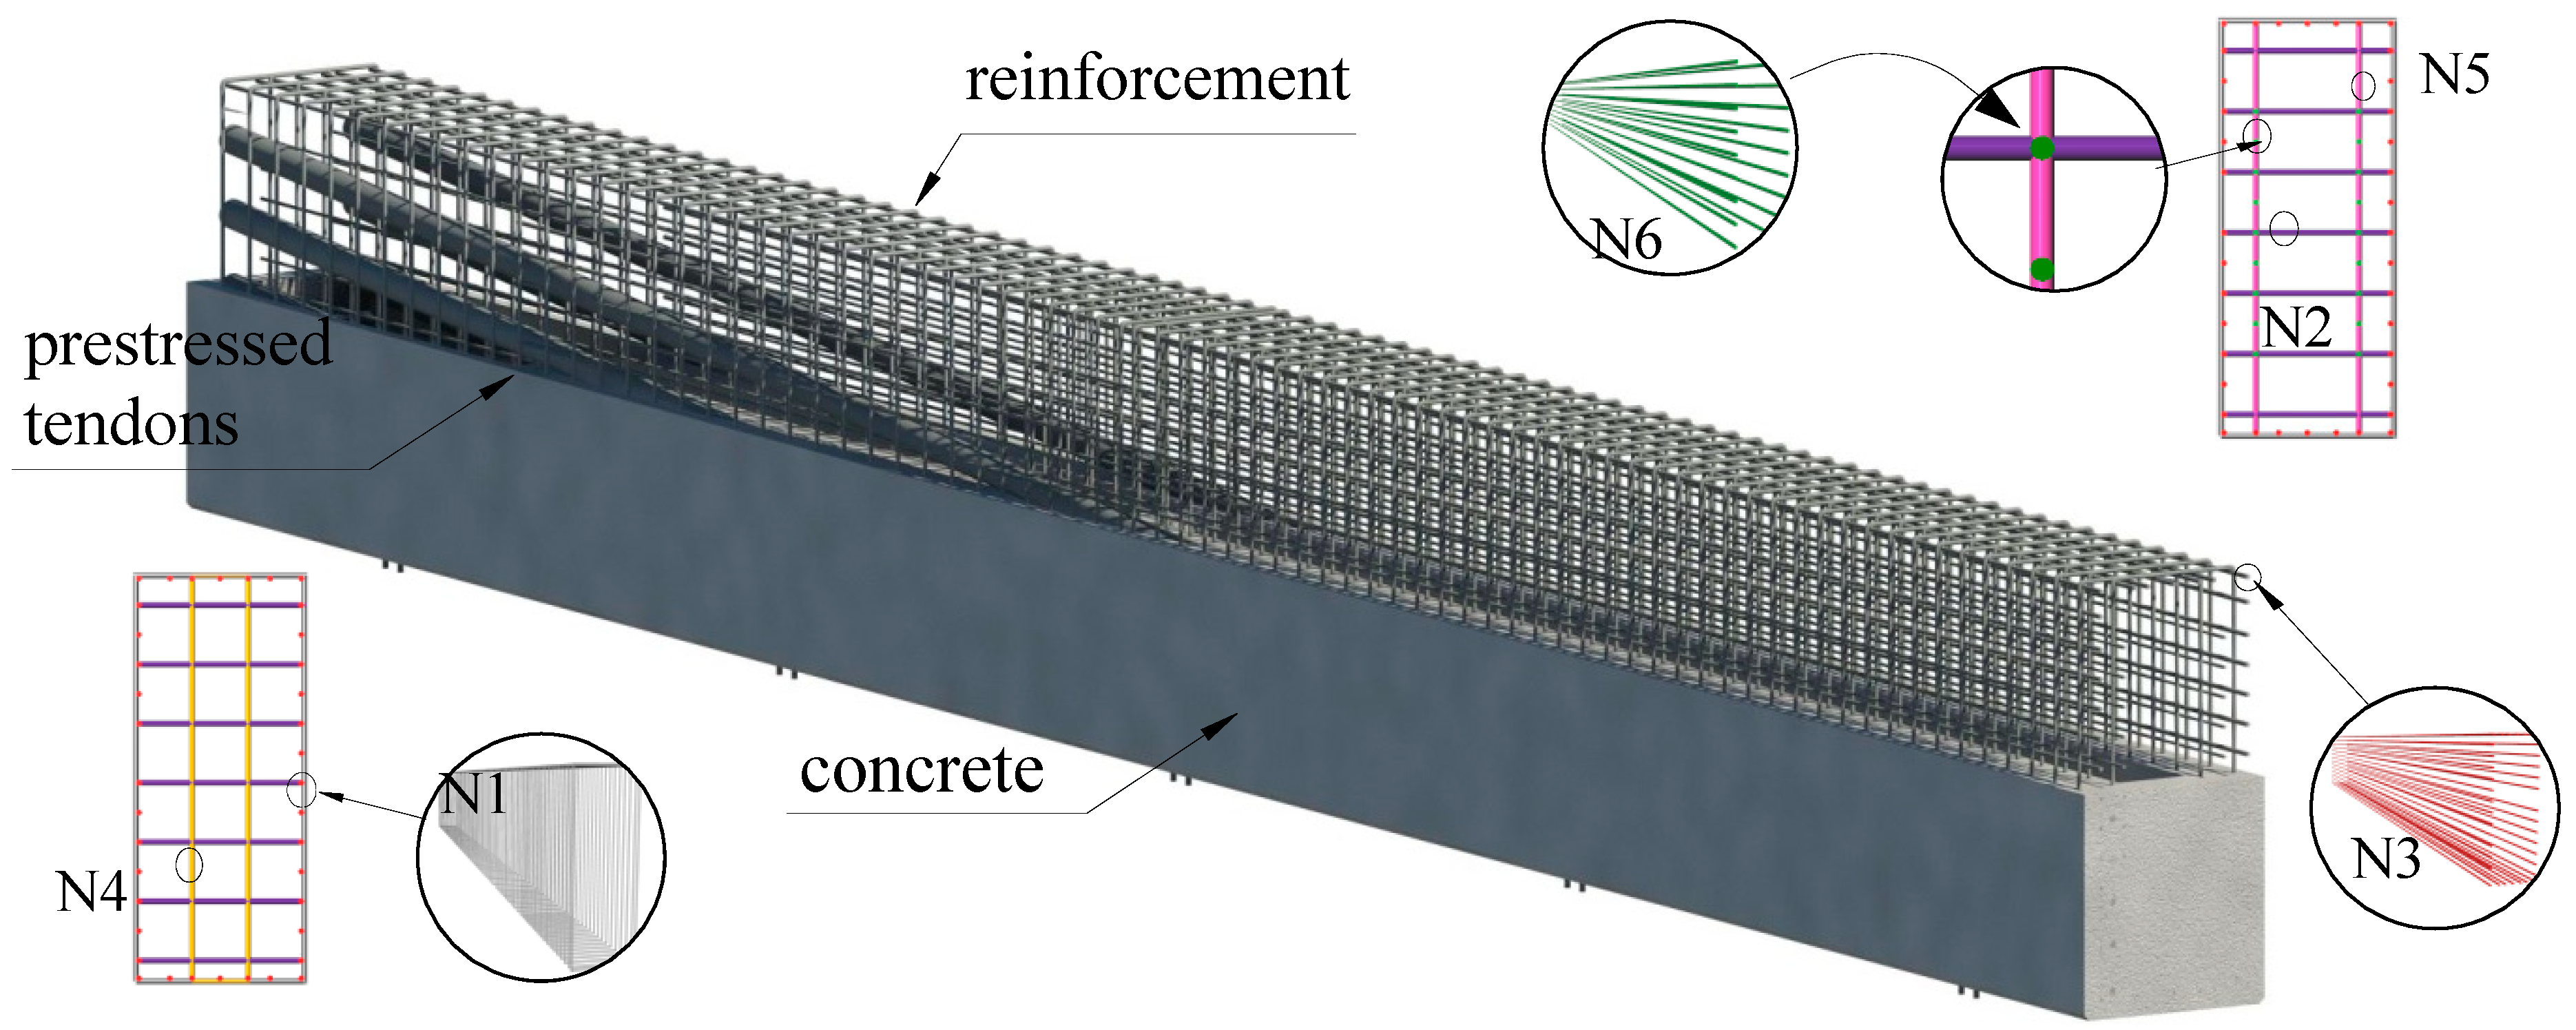
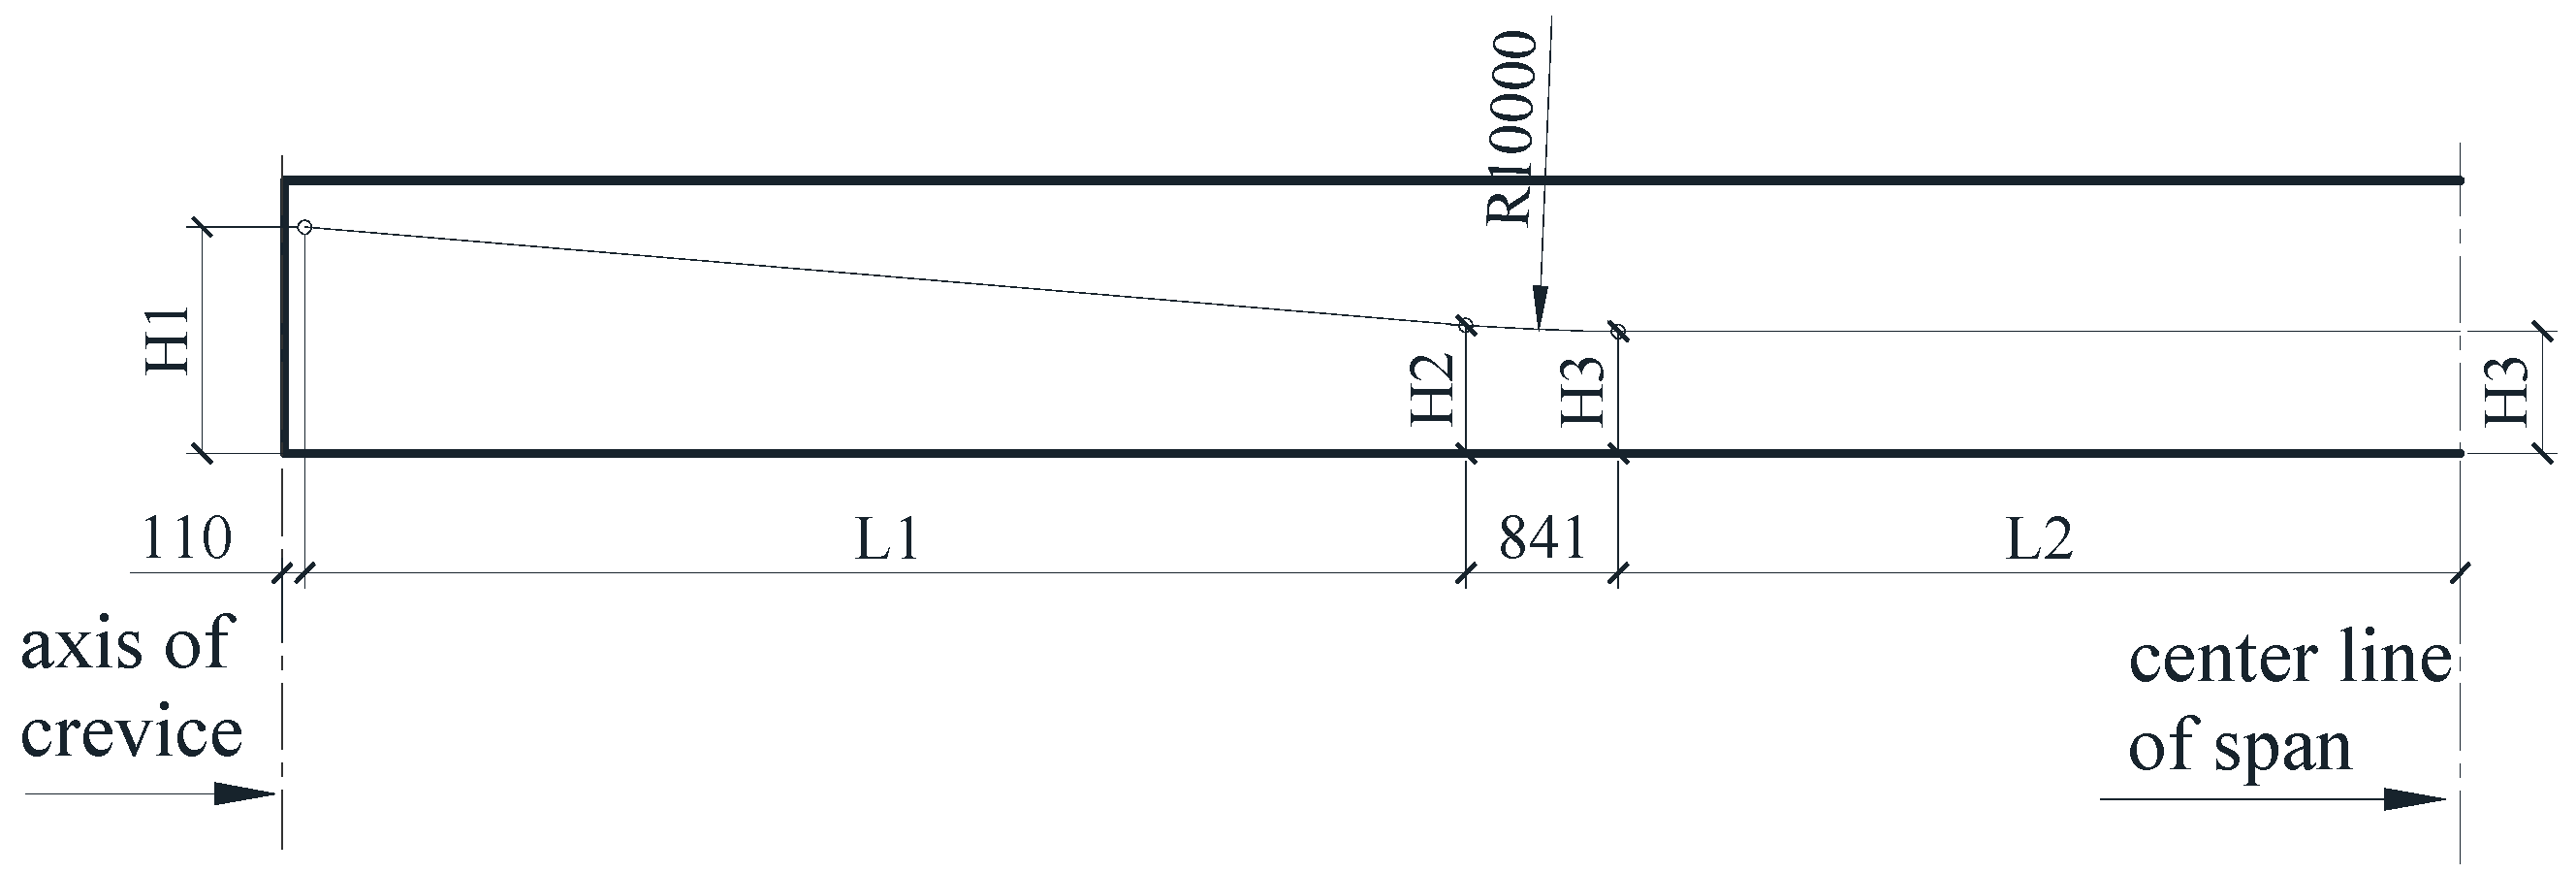
2.2. Test Models
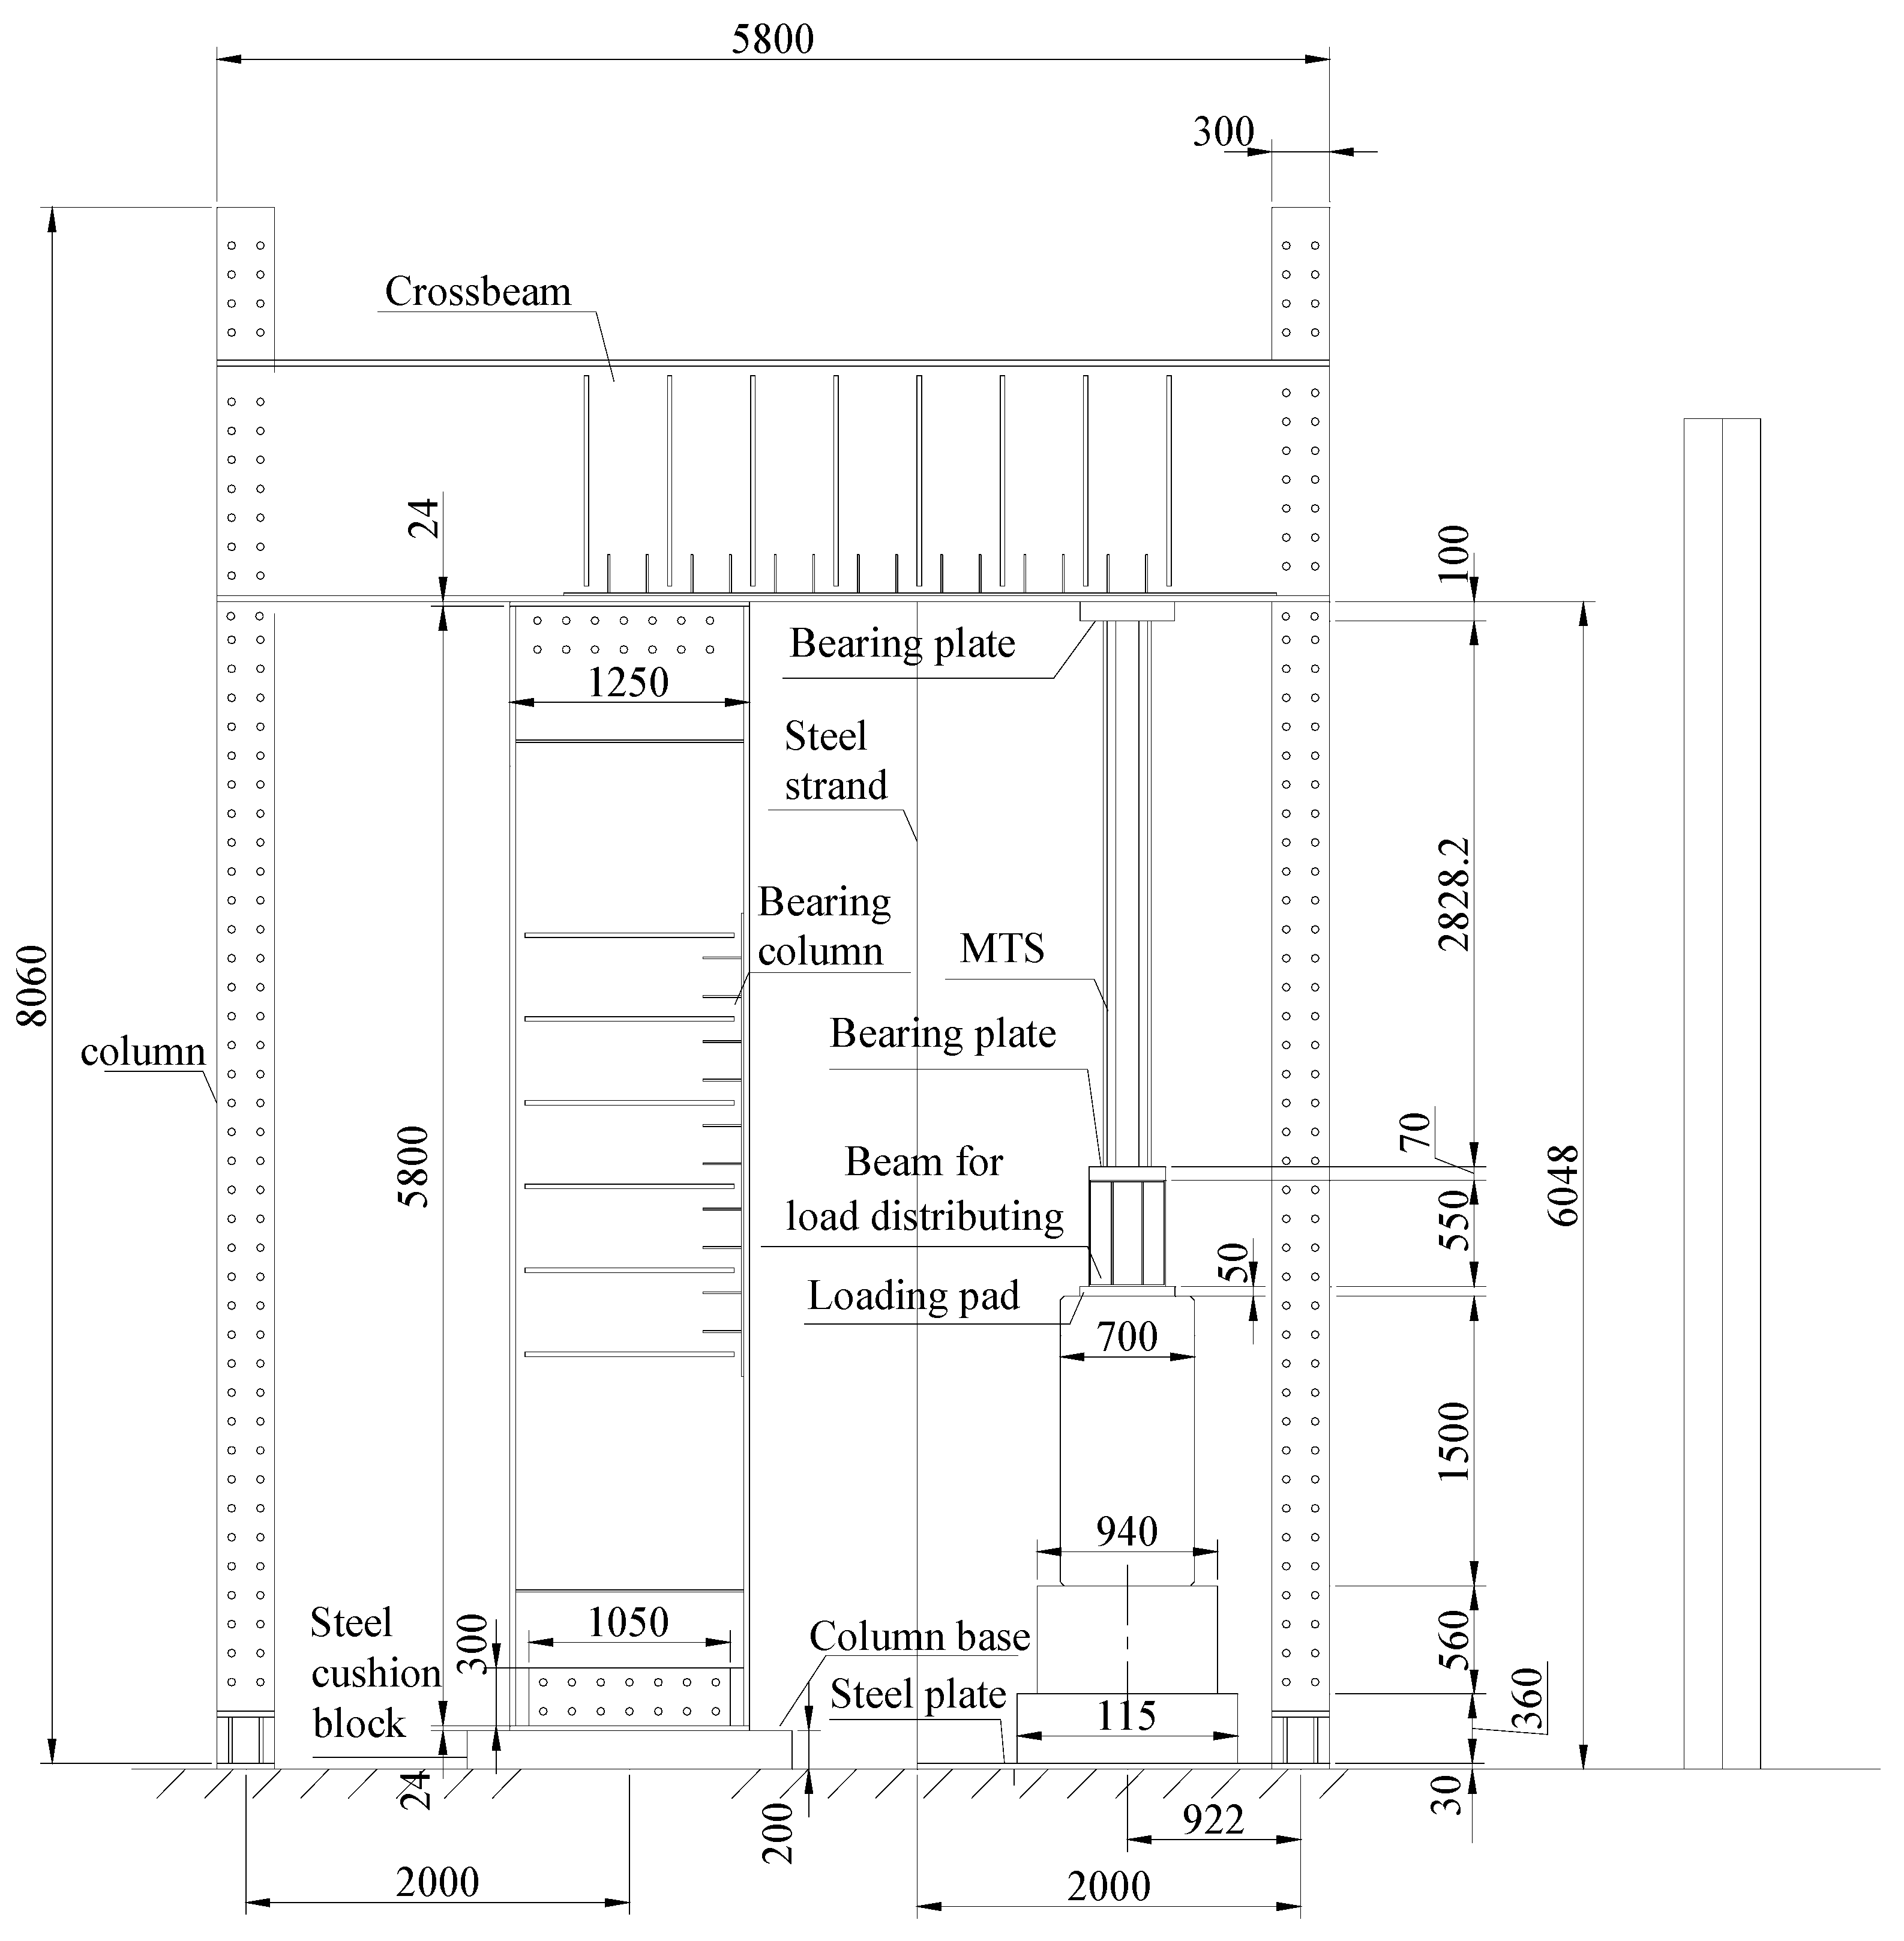
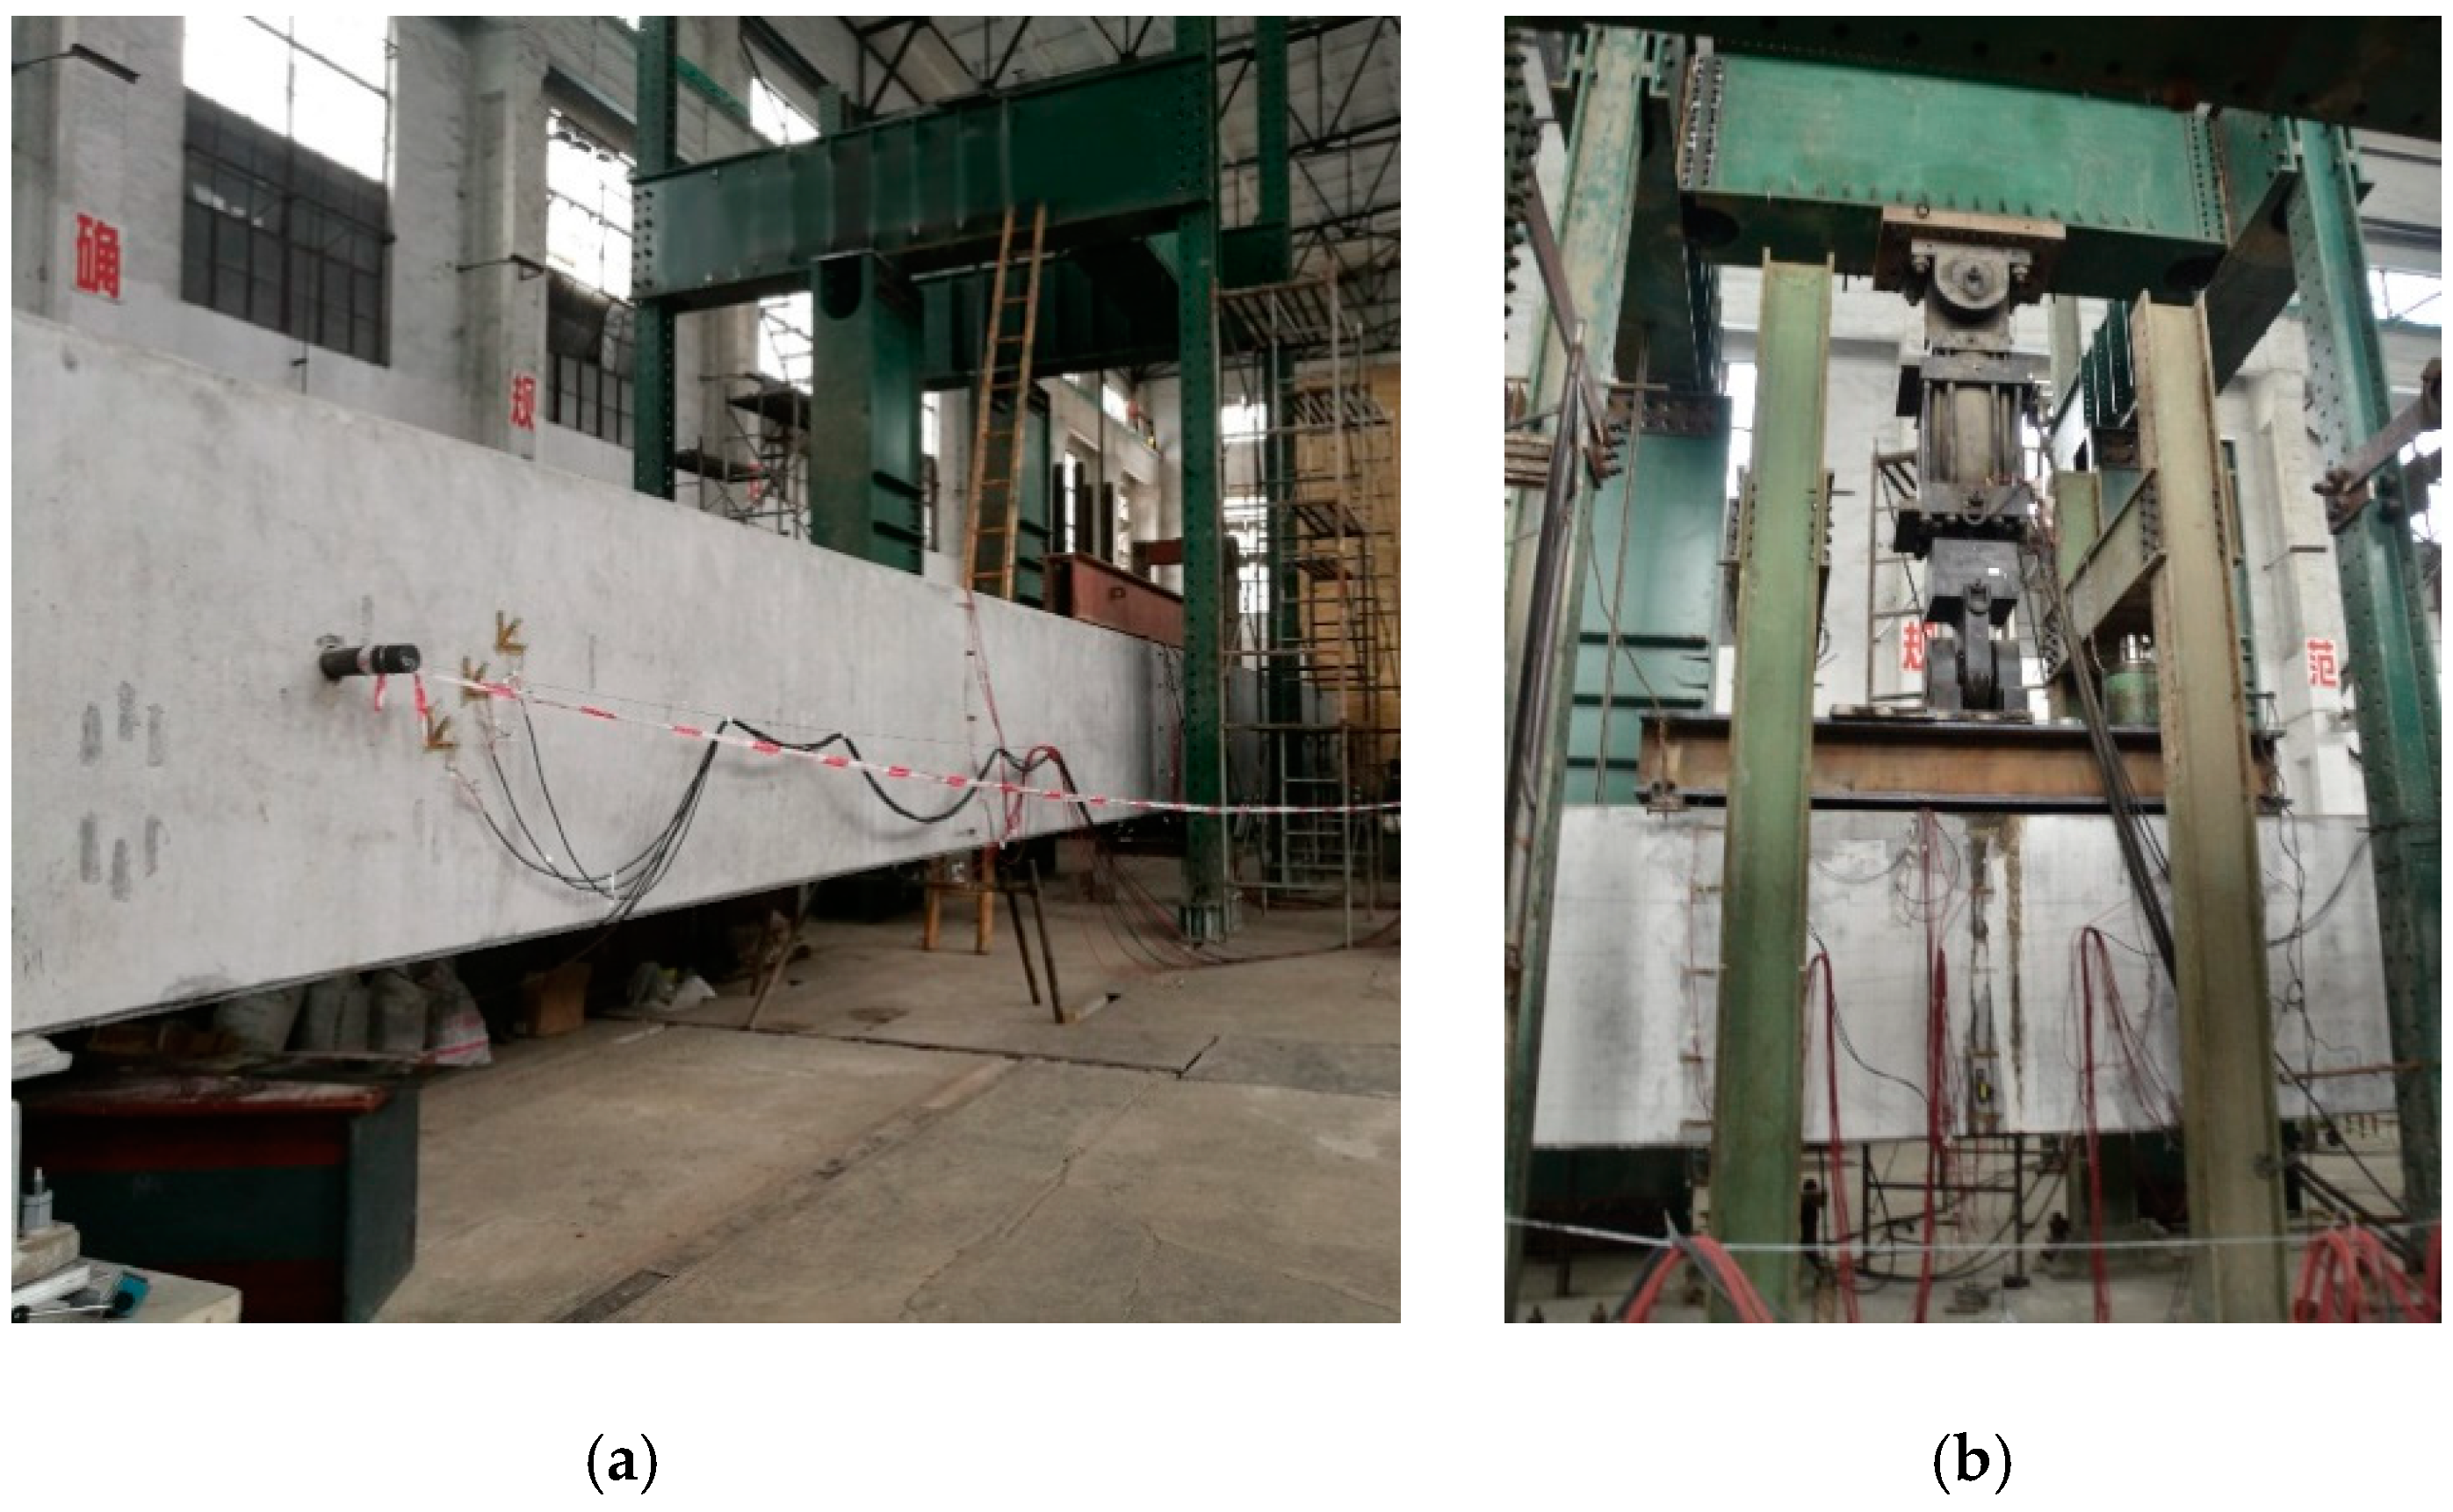
2.3. Test Setup
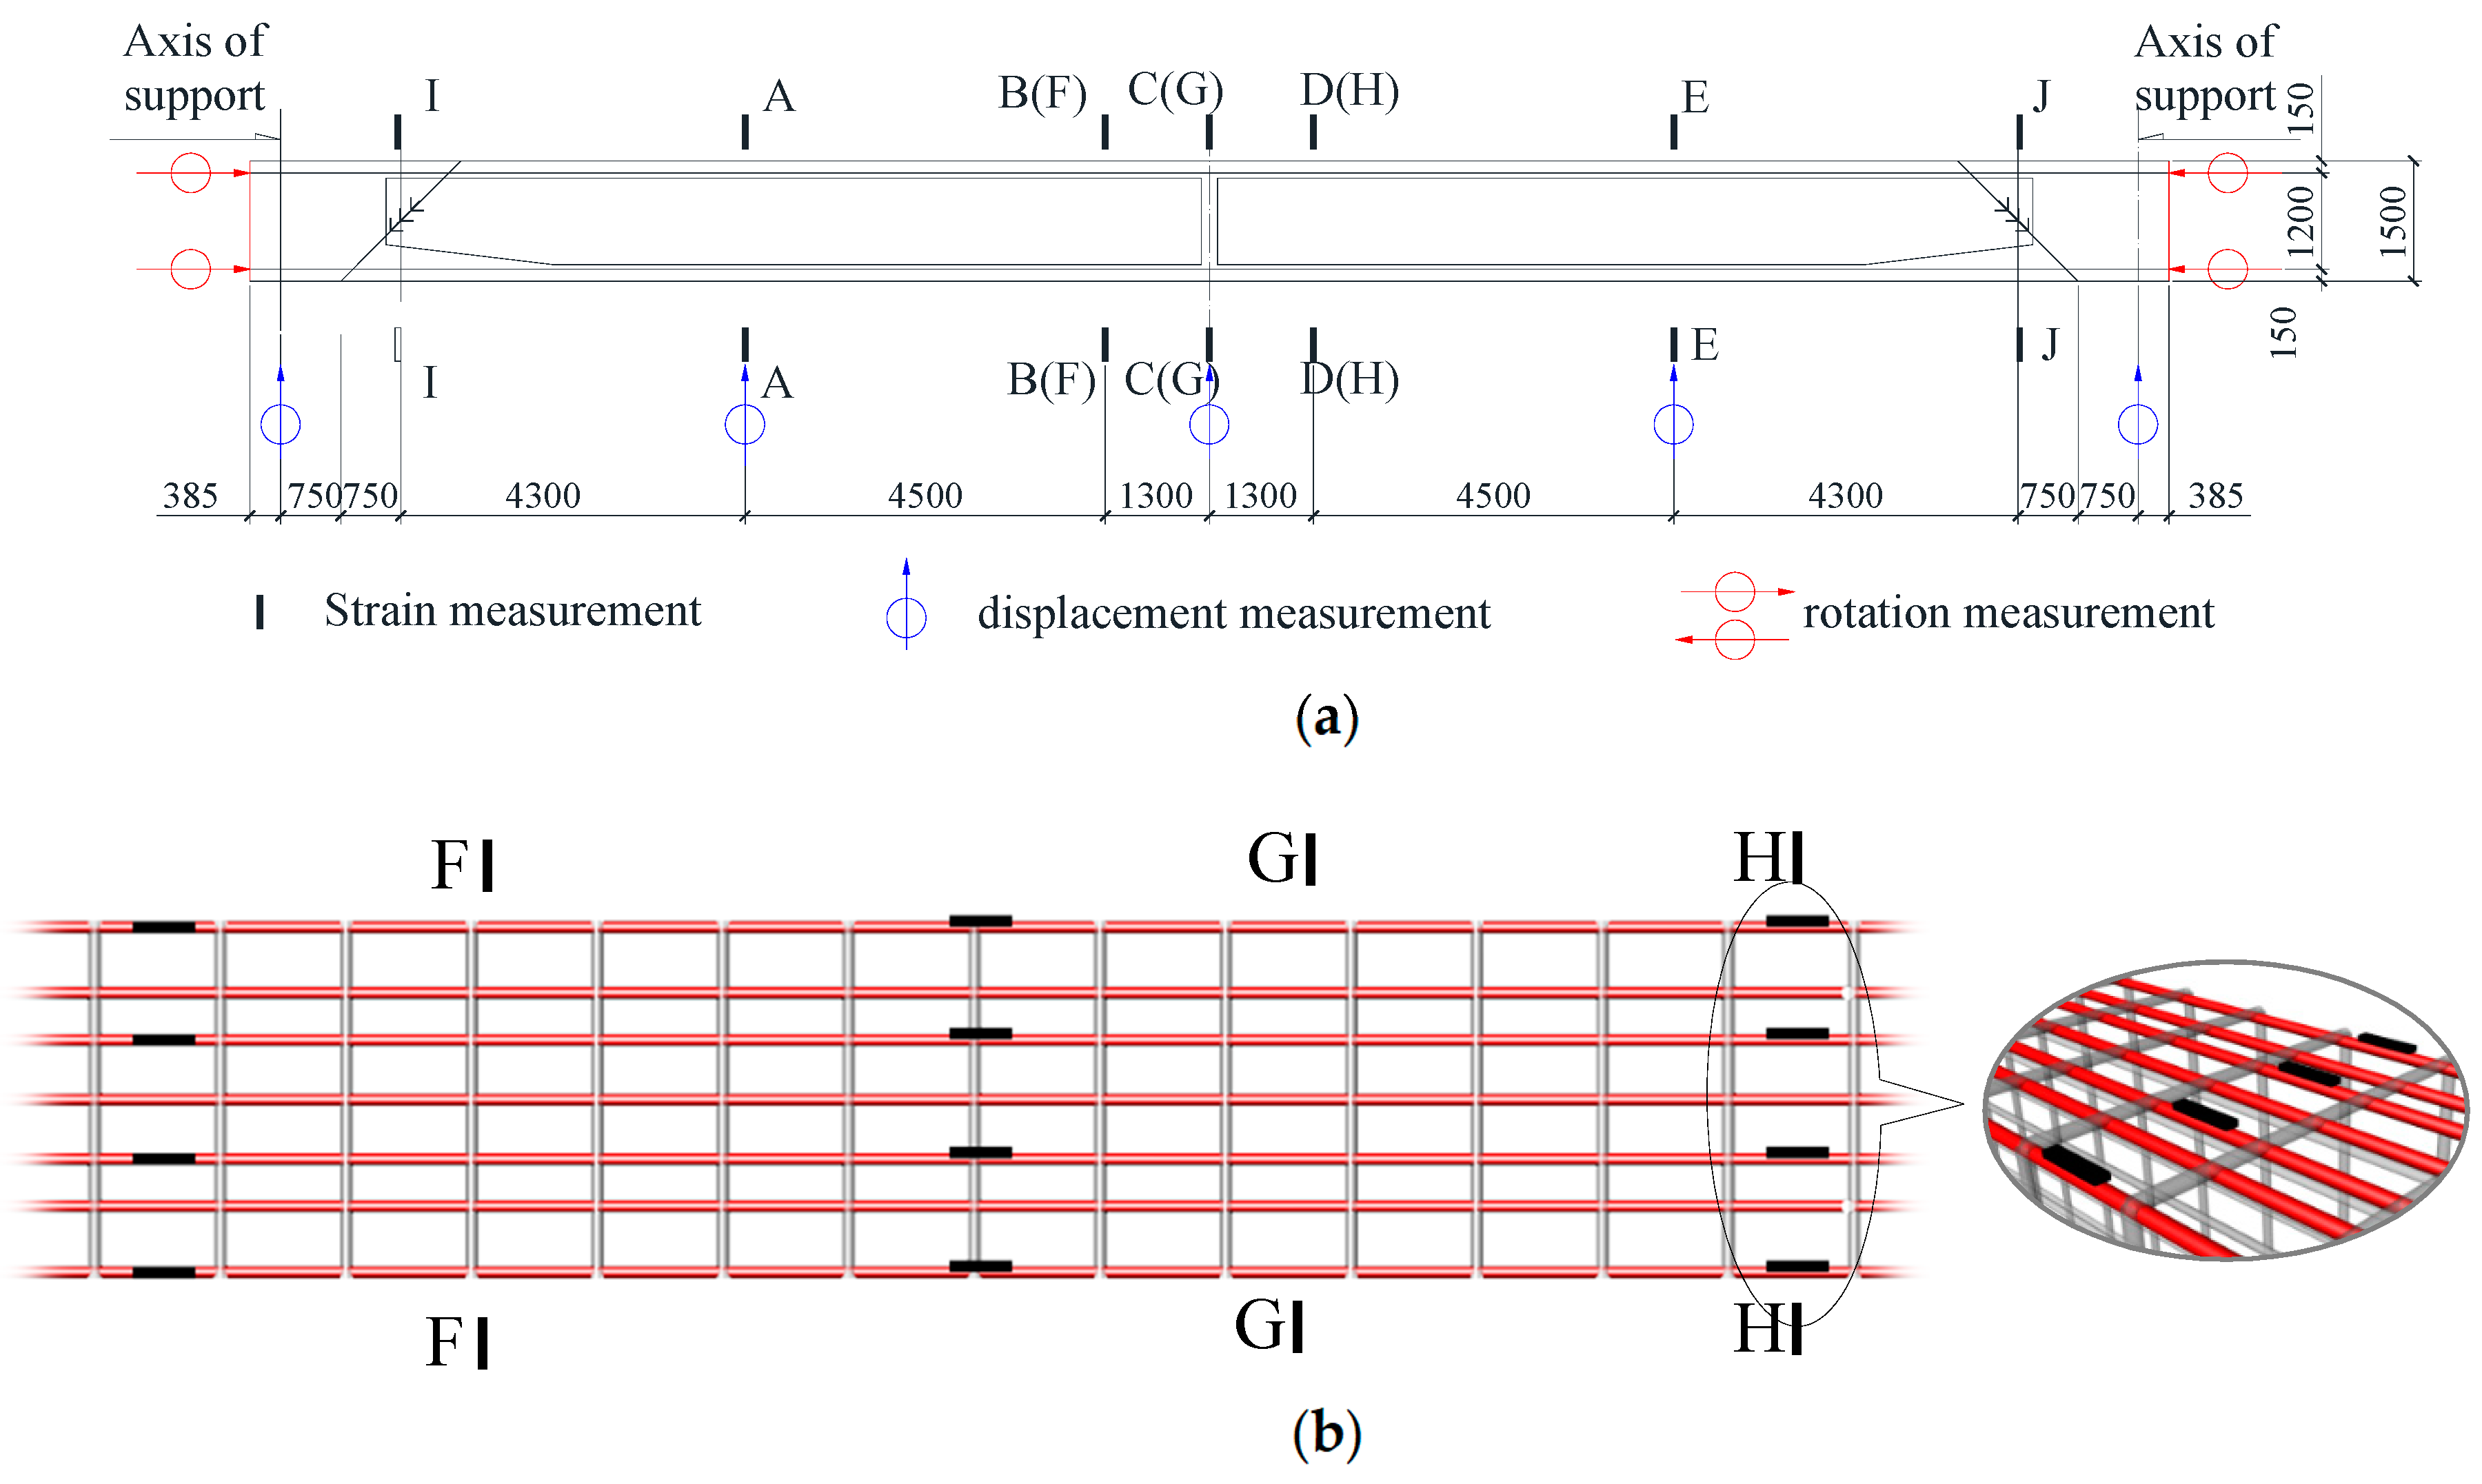
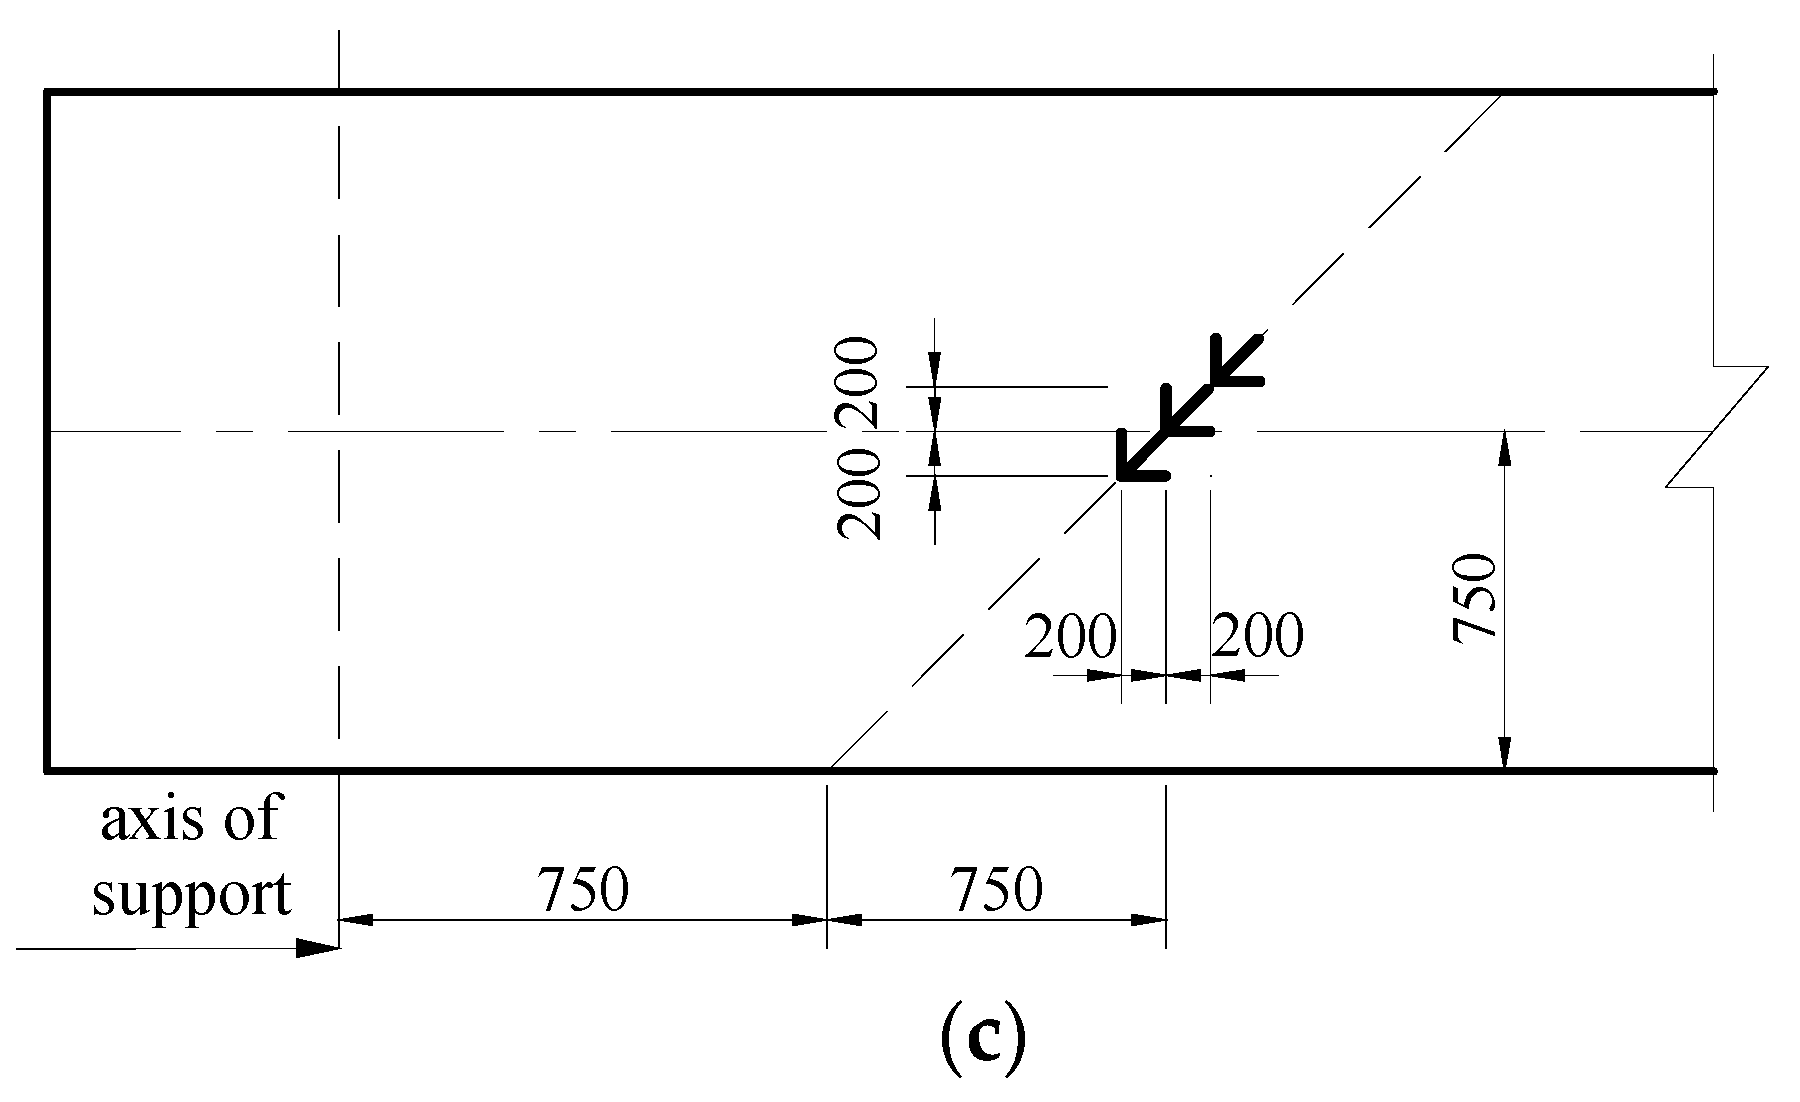
2.4. Instrumentation
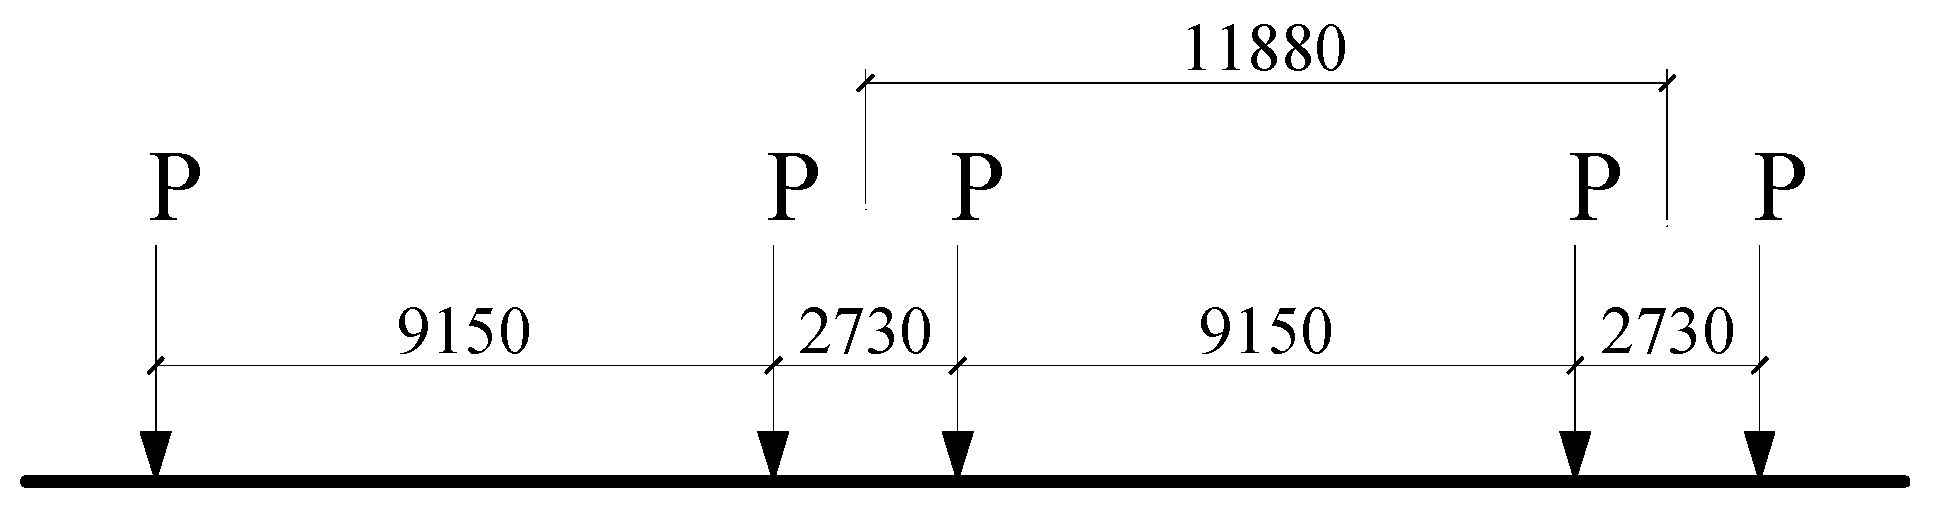
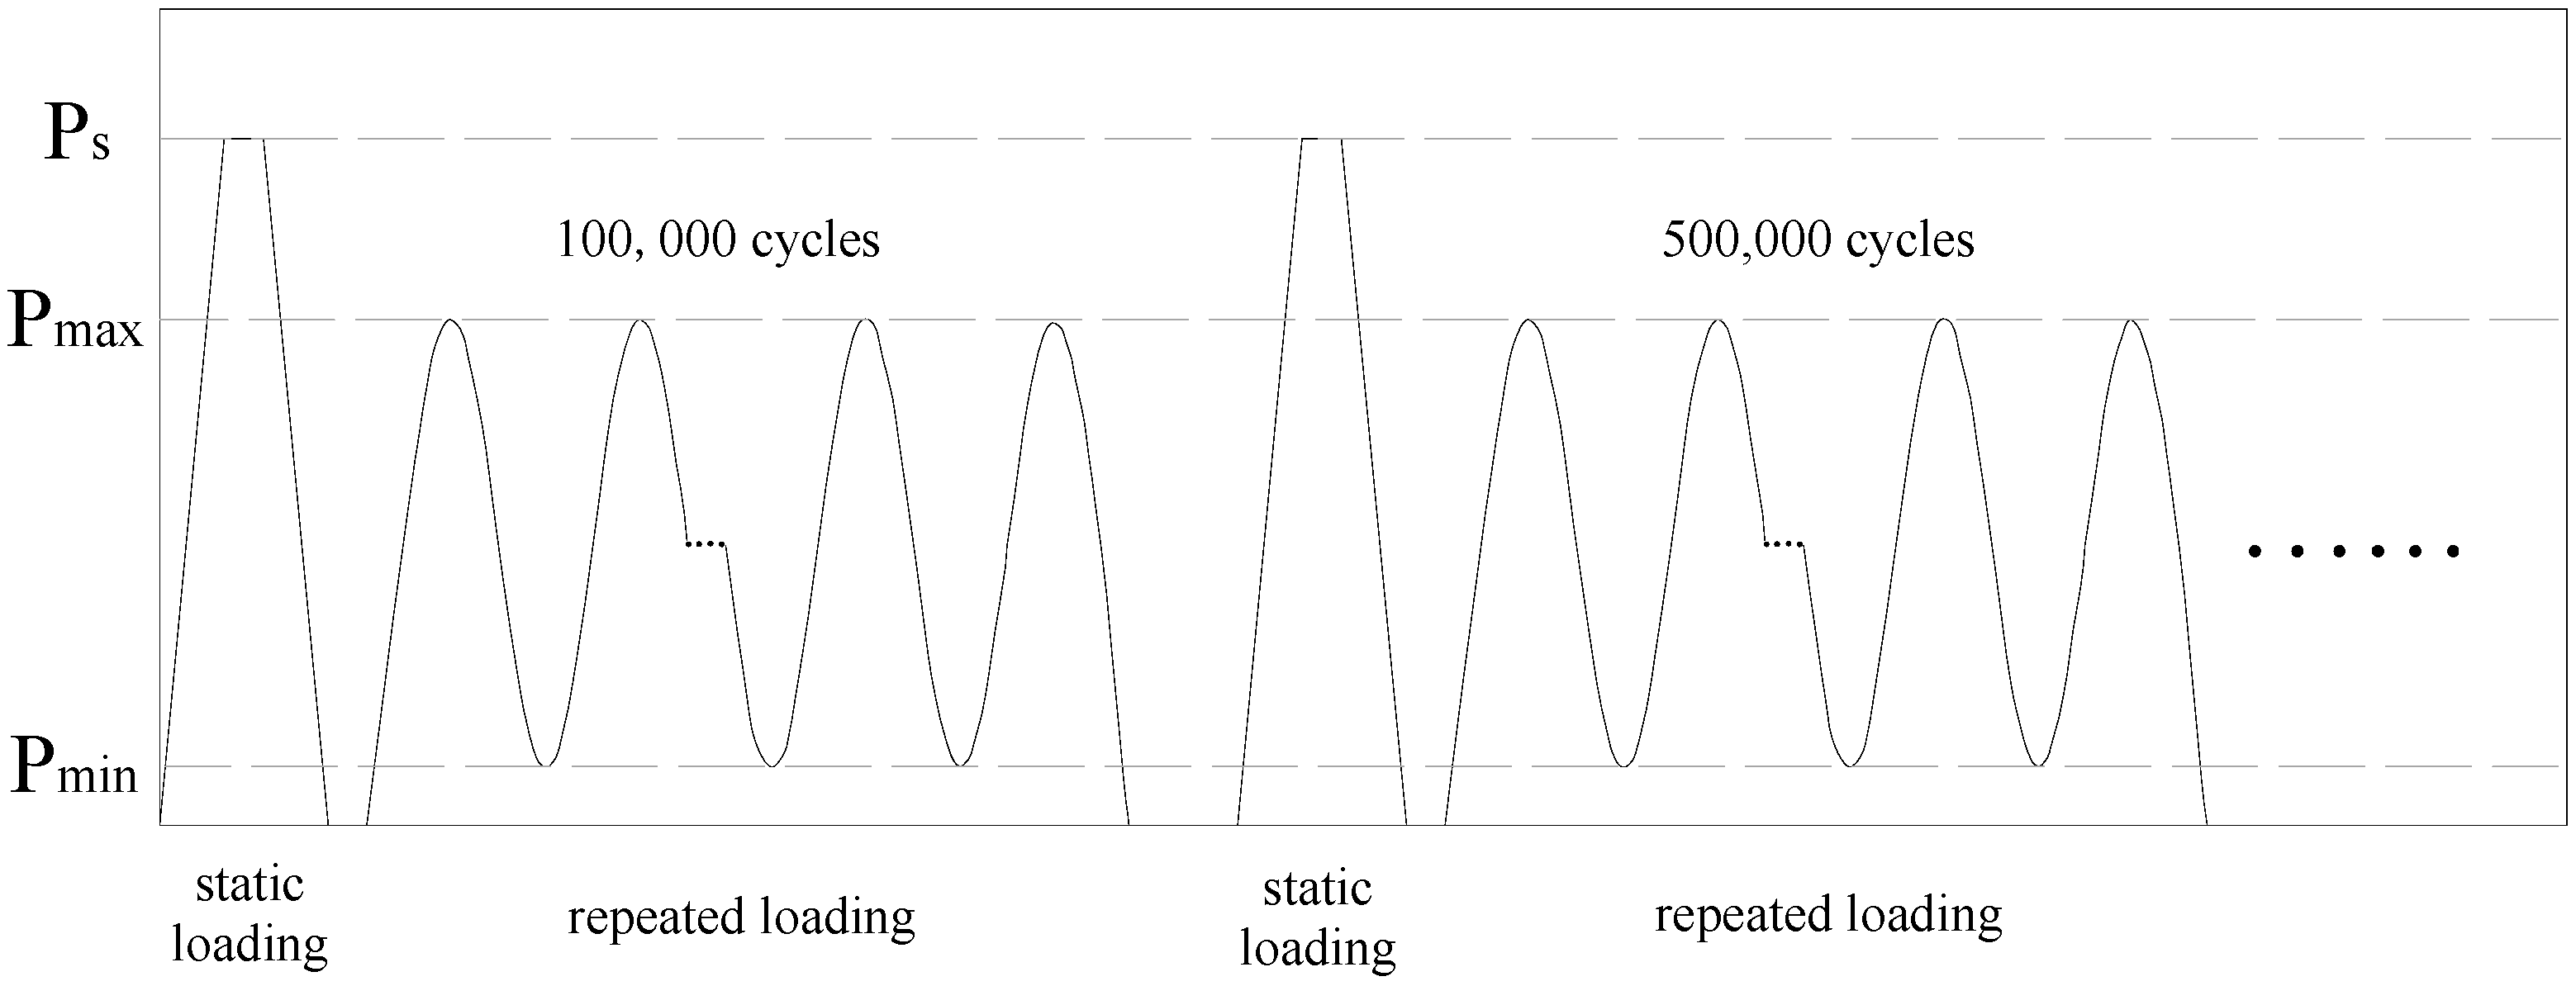
2.5. Loading Scheme
2.5.1. Fatigue Load
2.5.2. Post-Fatigue Static Load
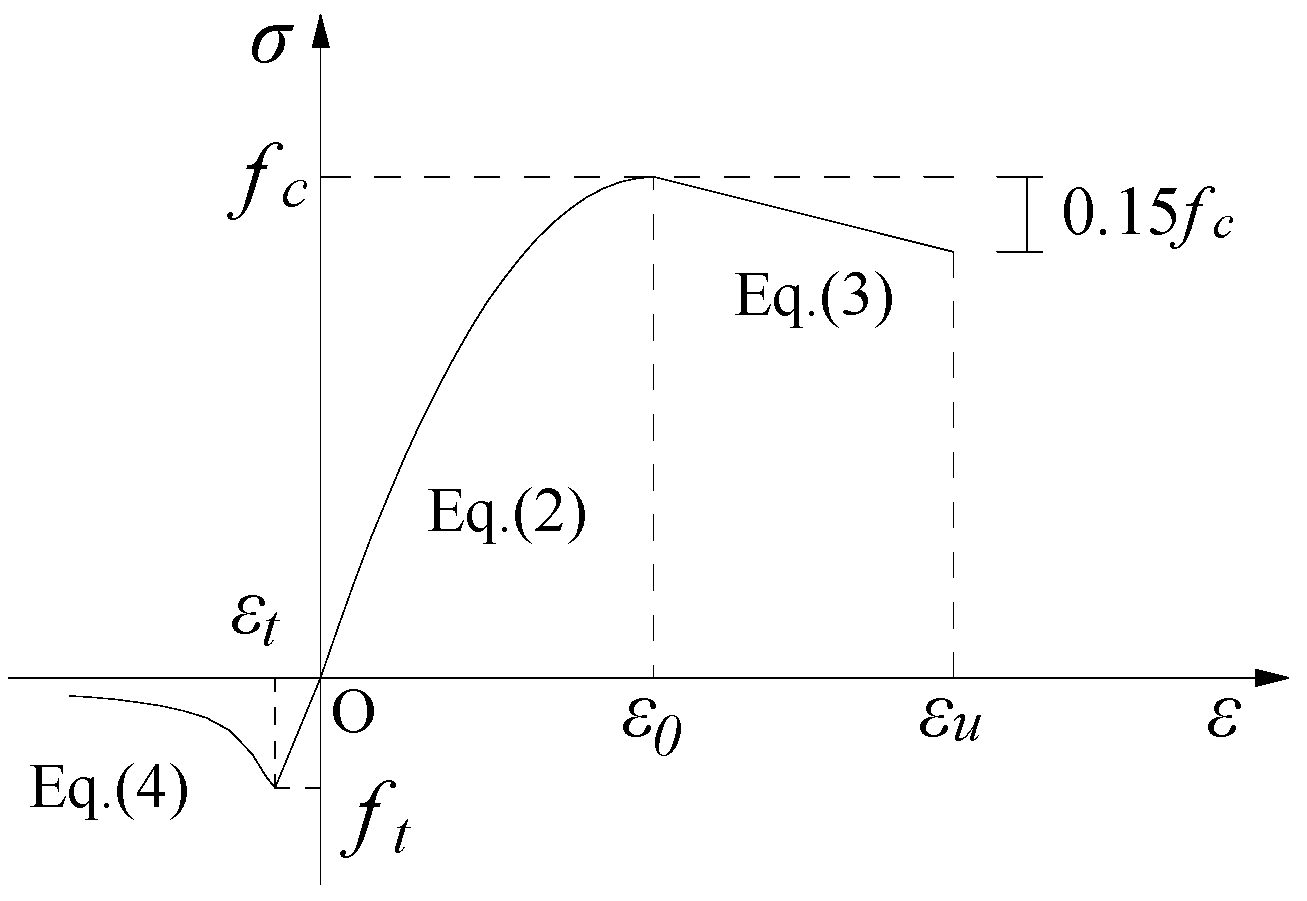
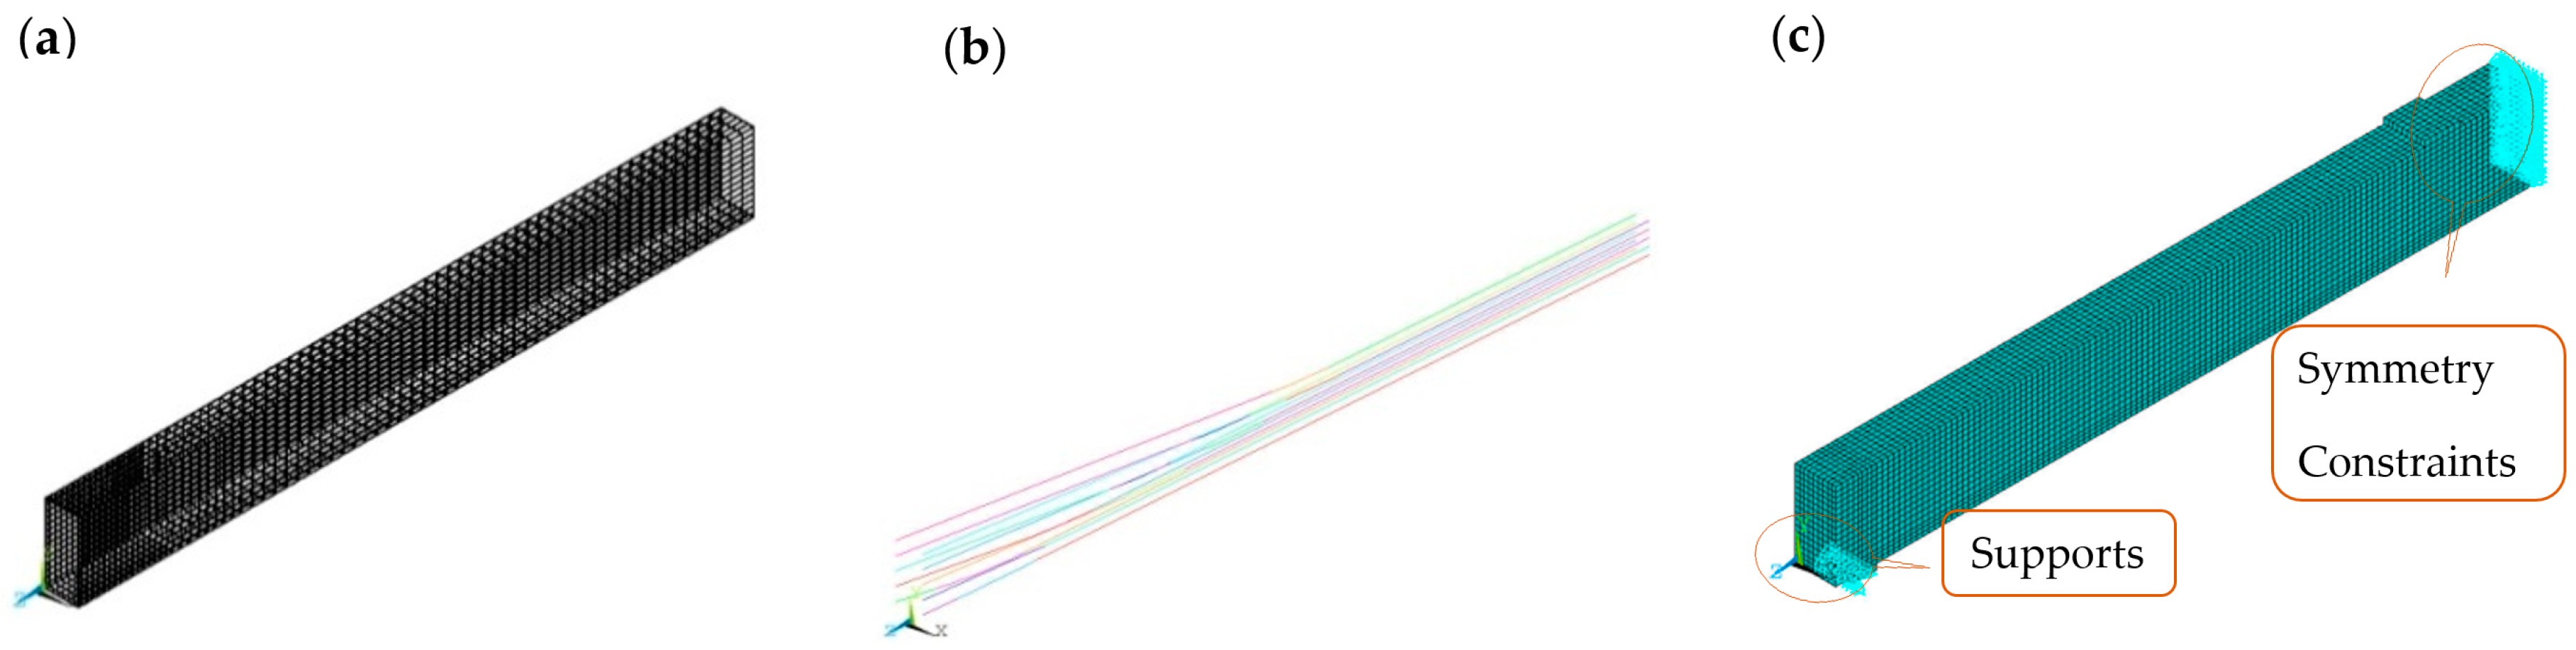
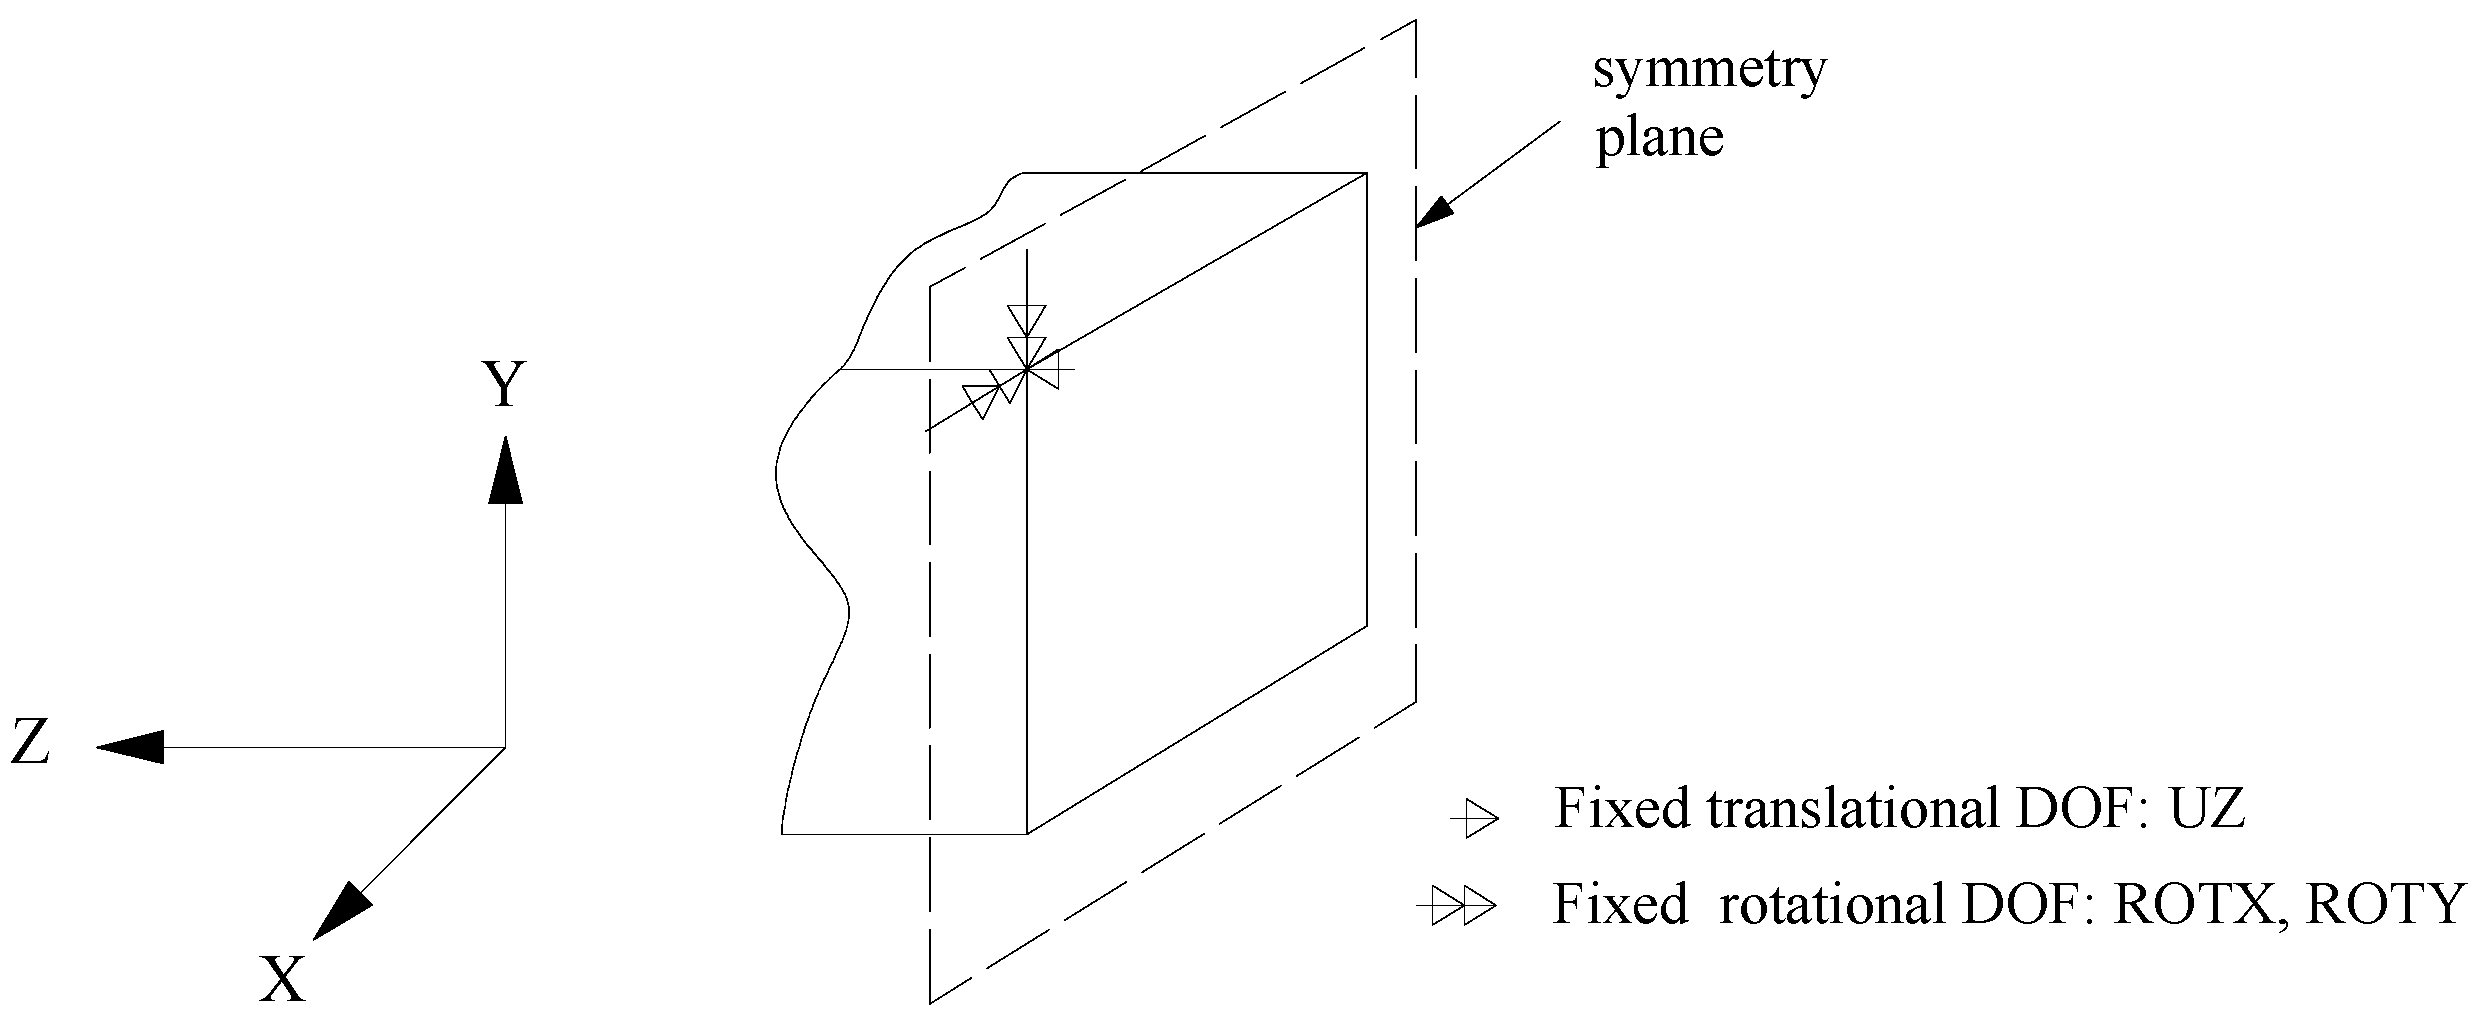
3. Finite Element Model
4. Results and Discussions
4.1. Displacement and Stiffness
4.2. Rotation
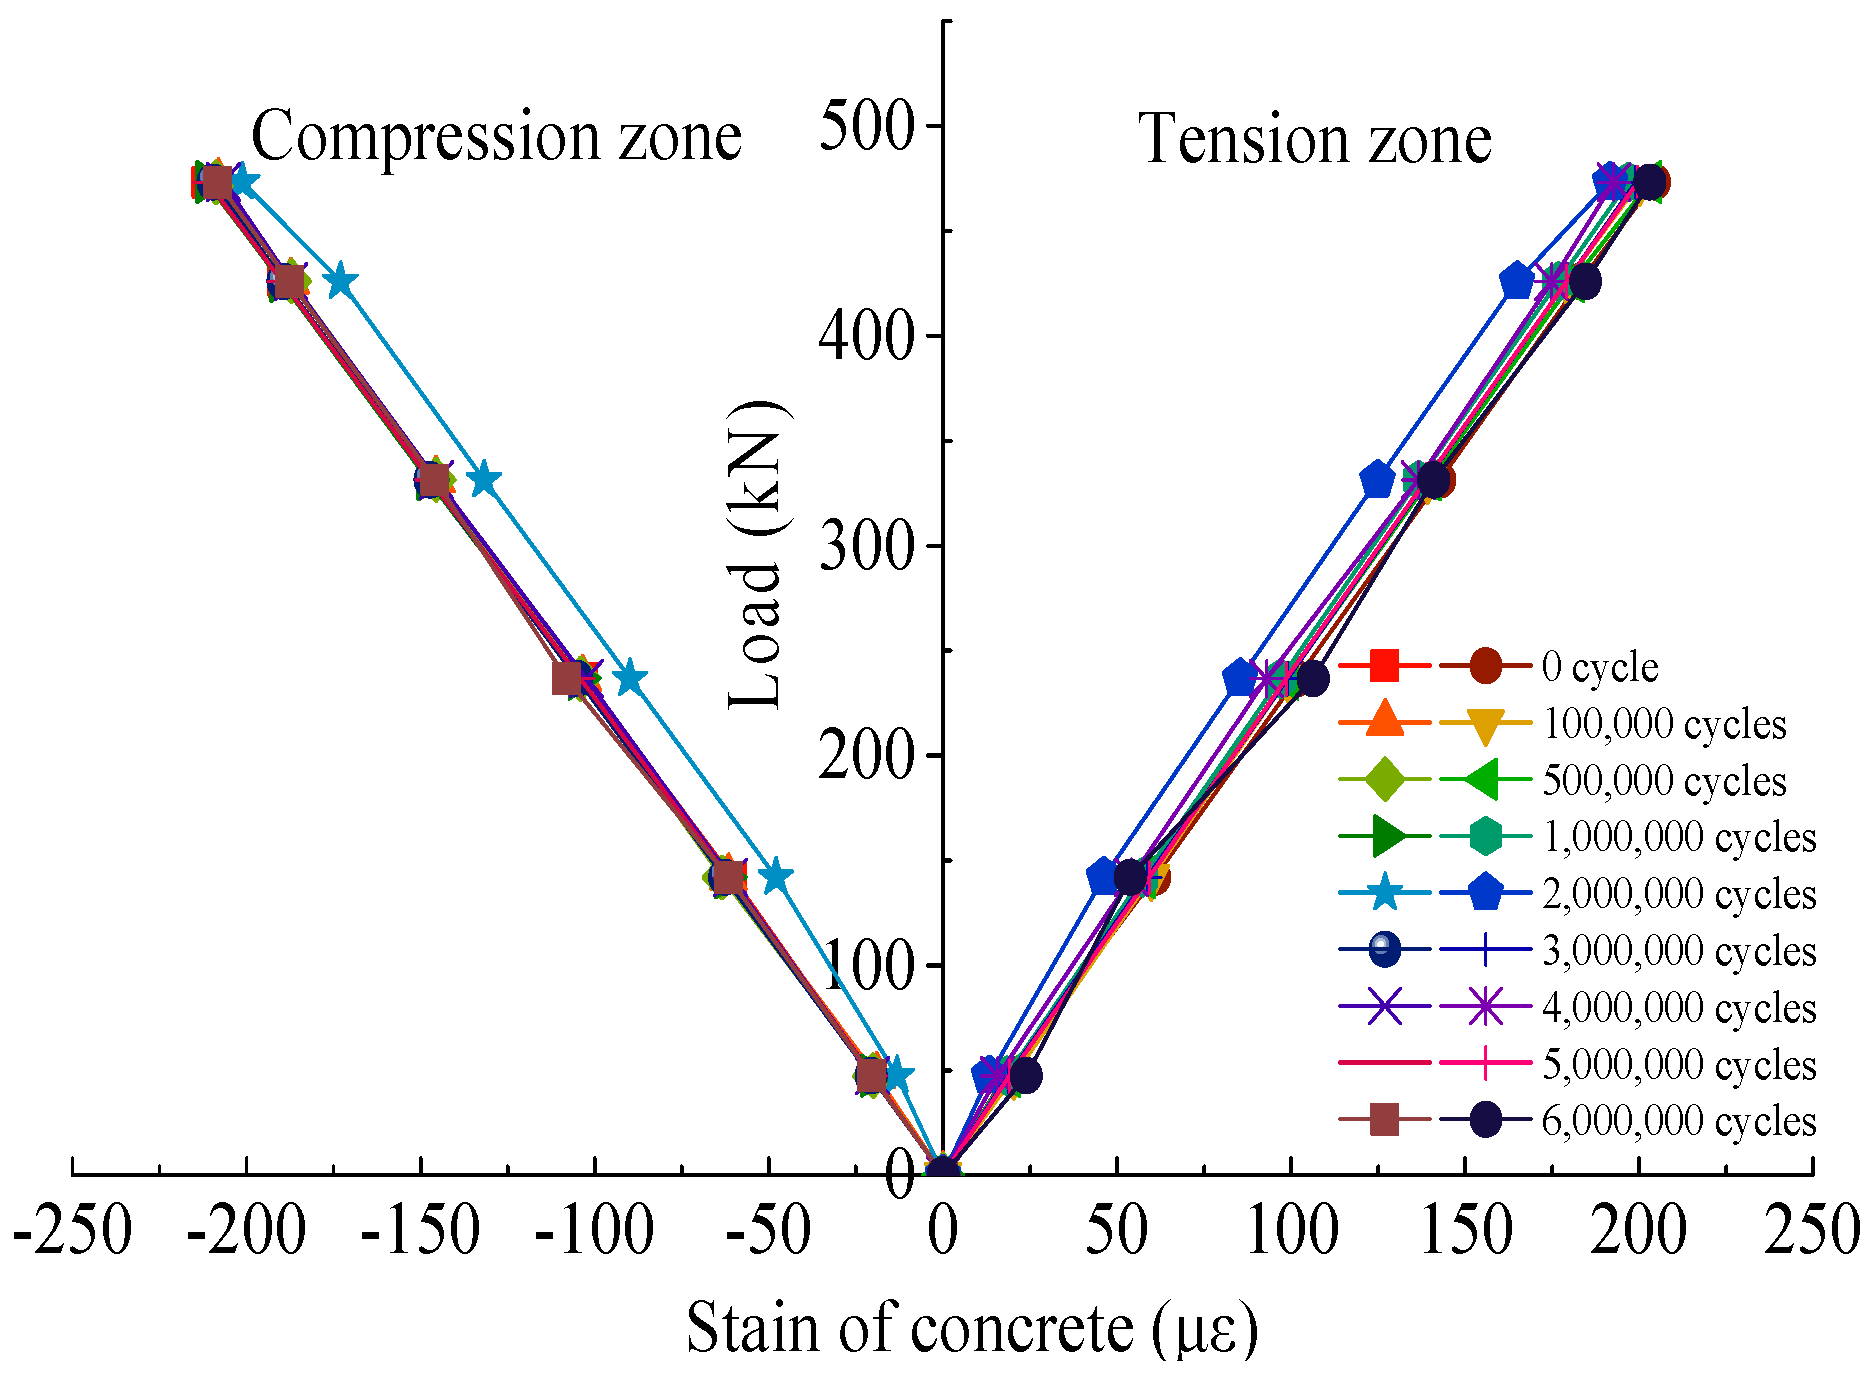
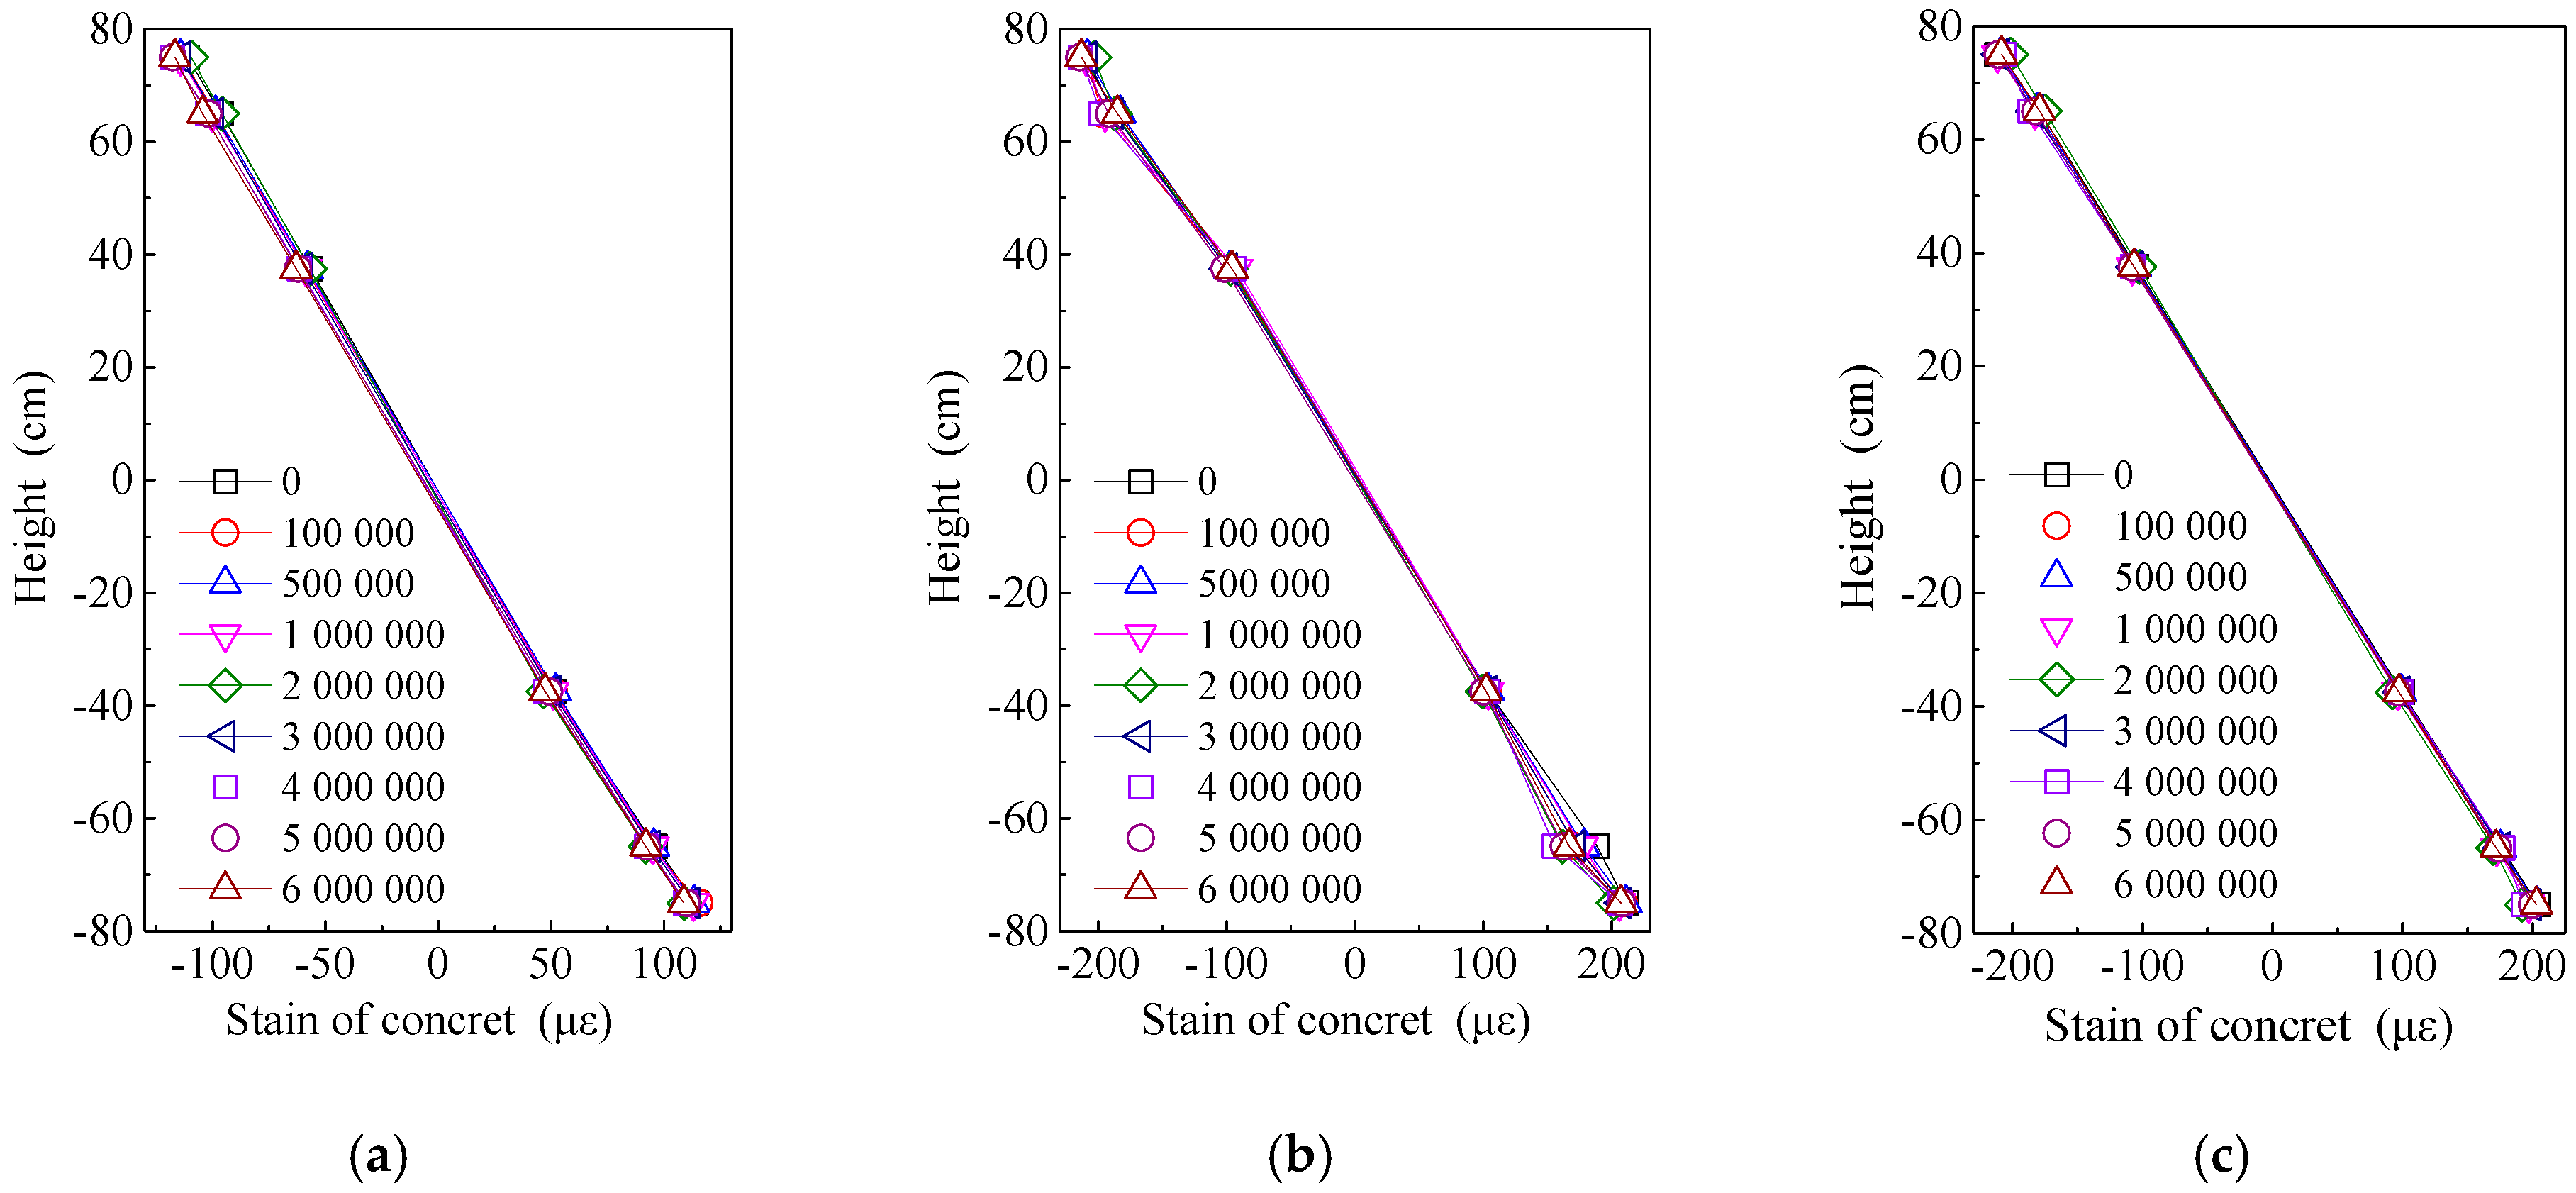
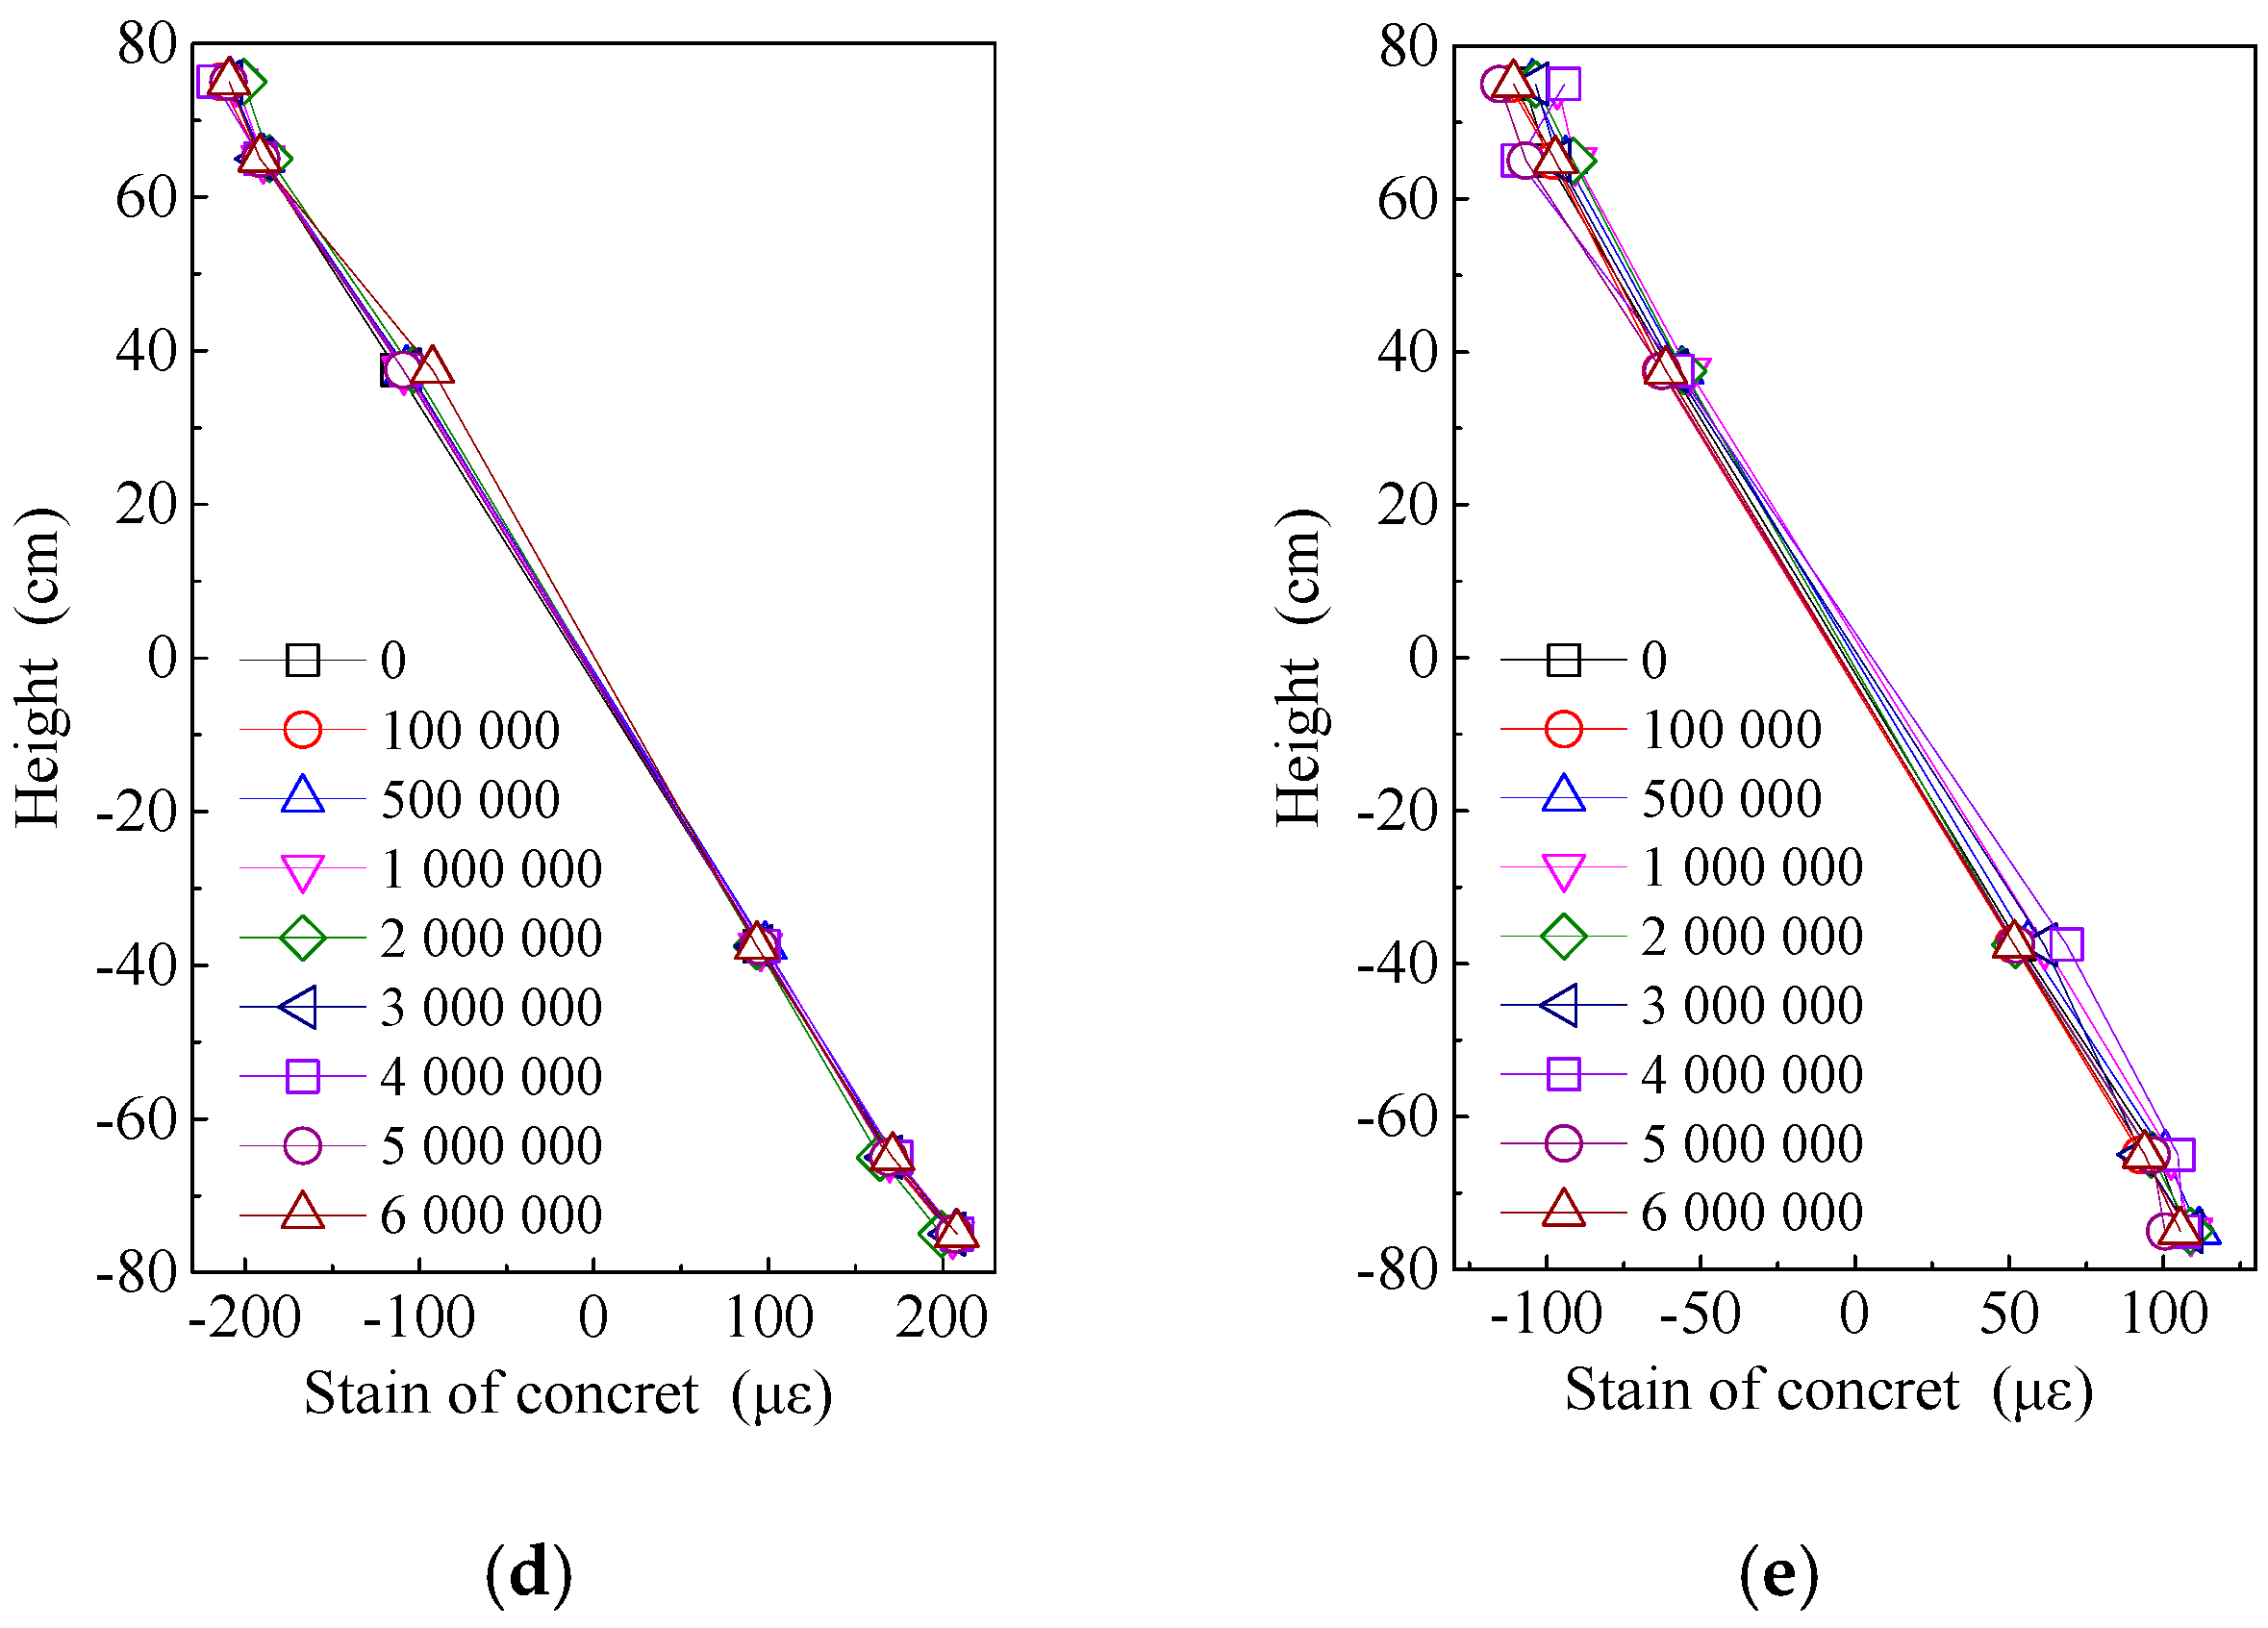
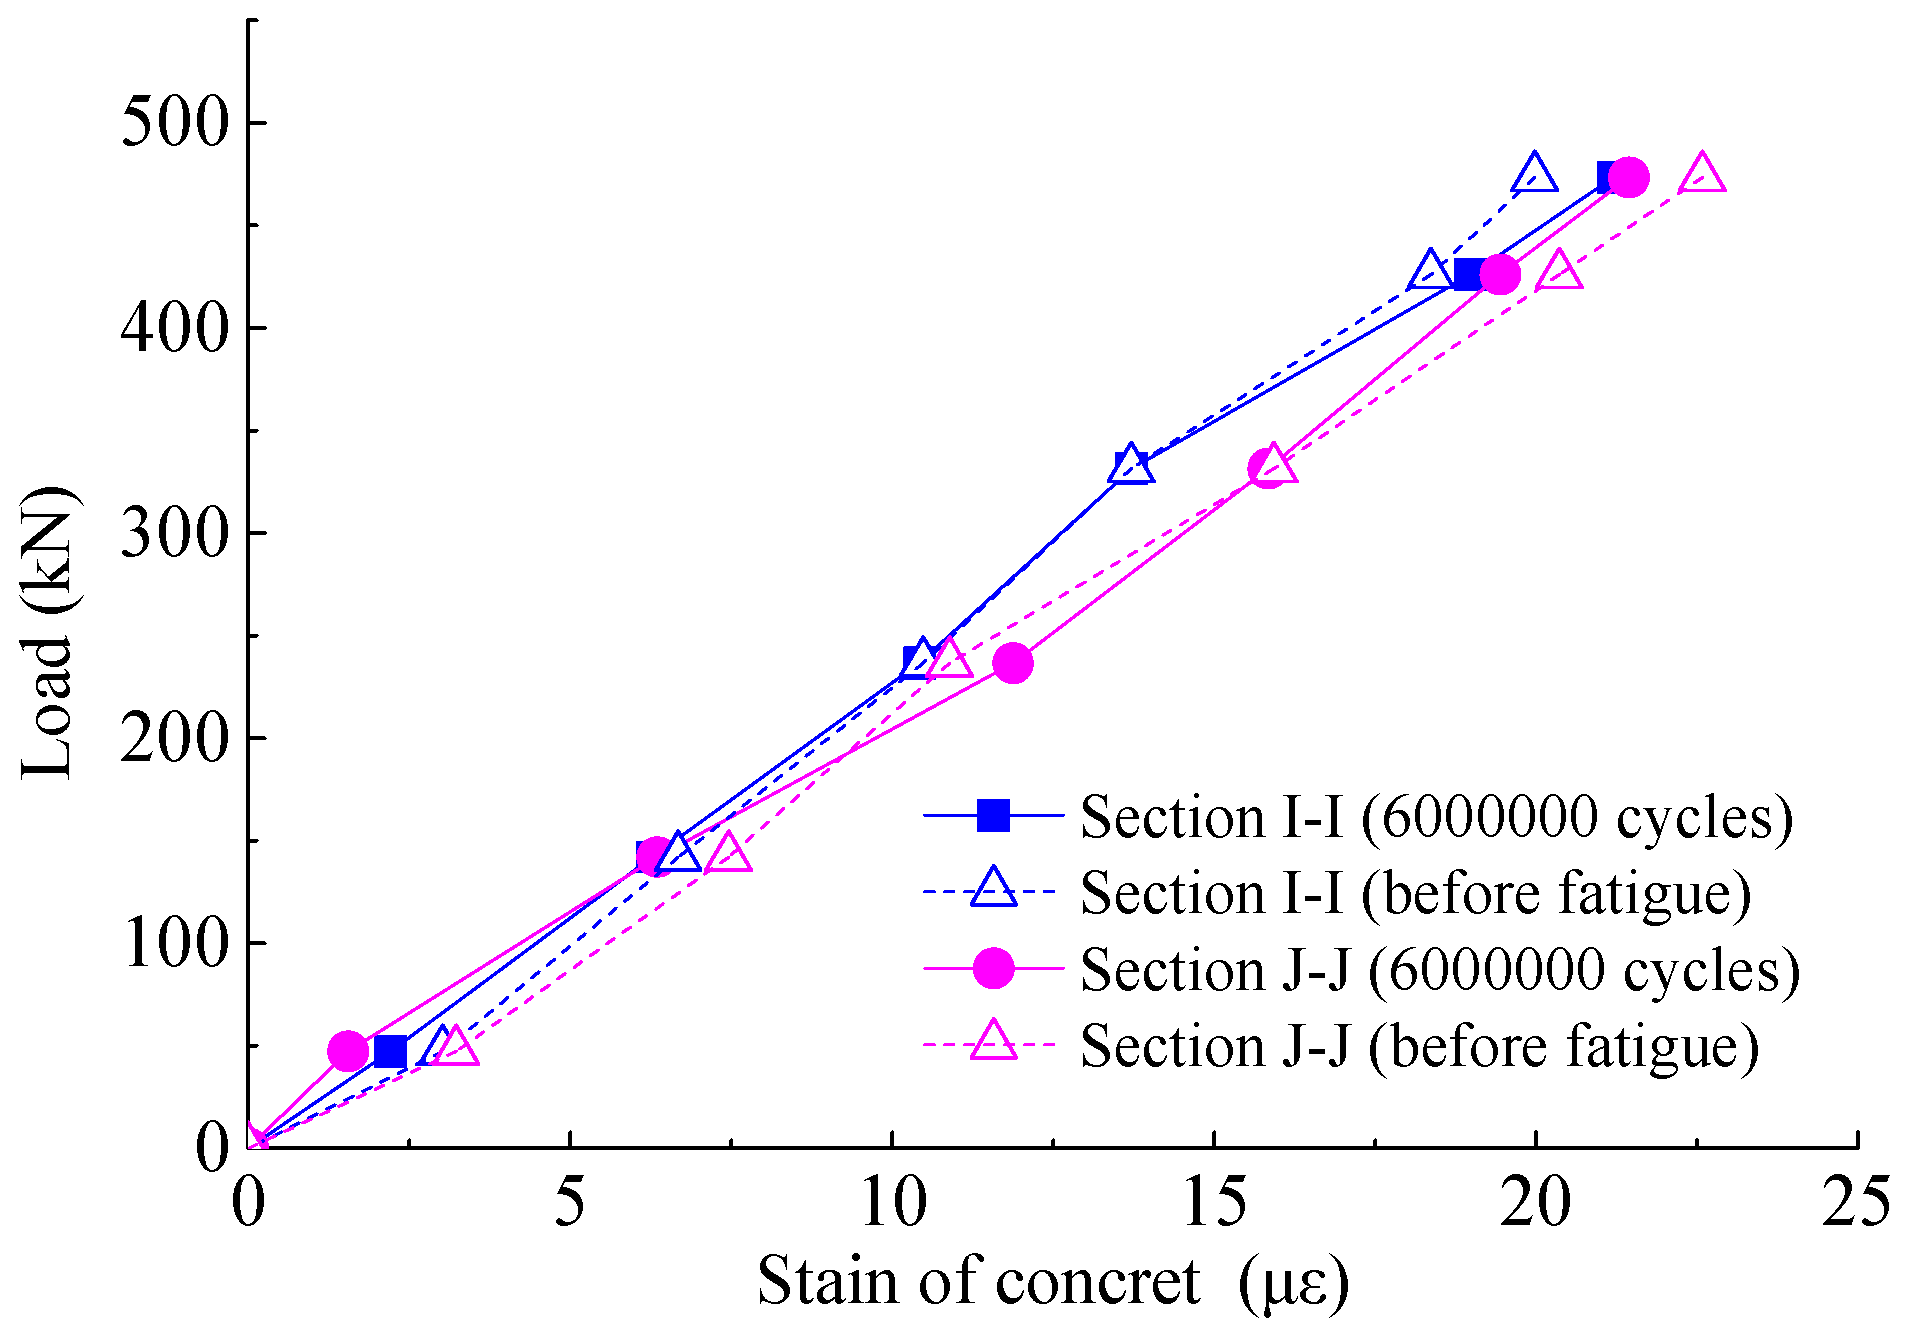
4.3. Strain of Concrete
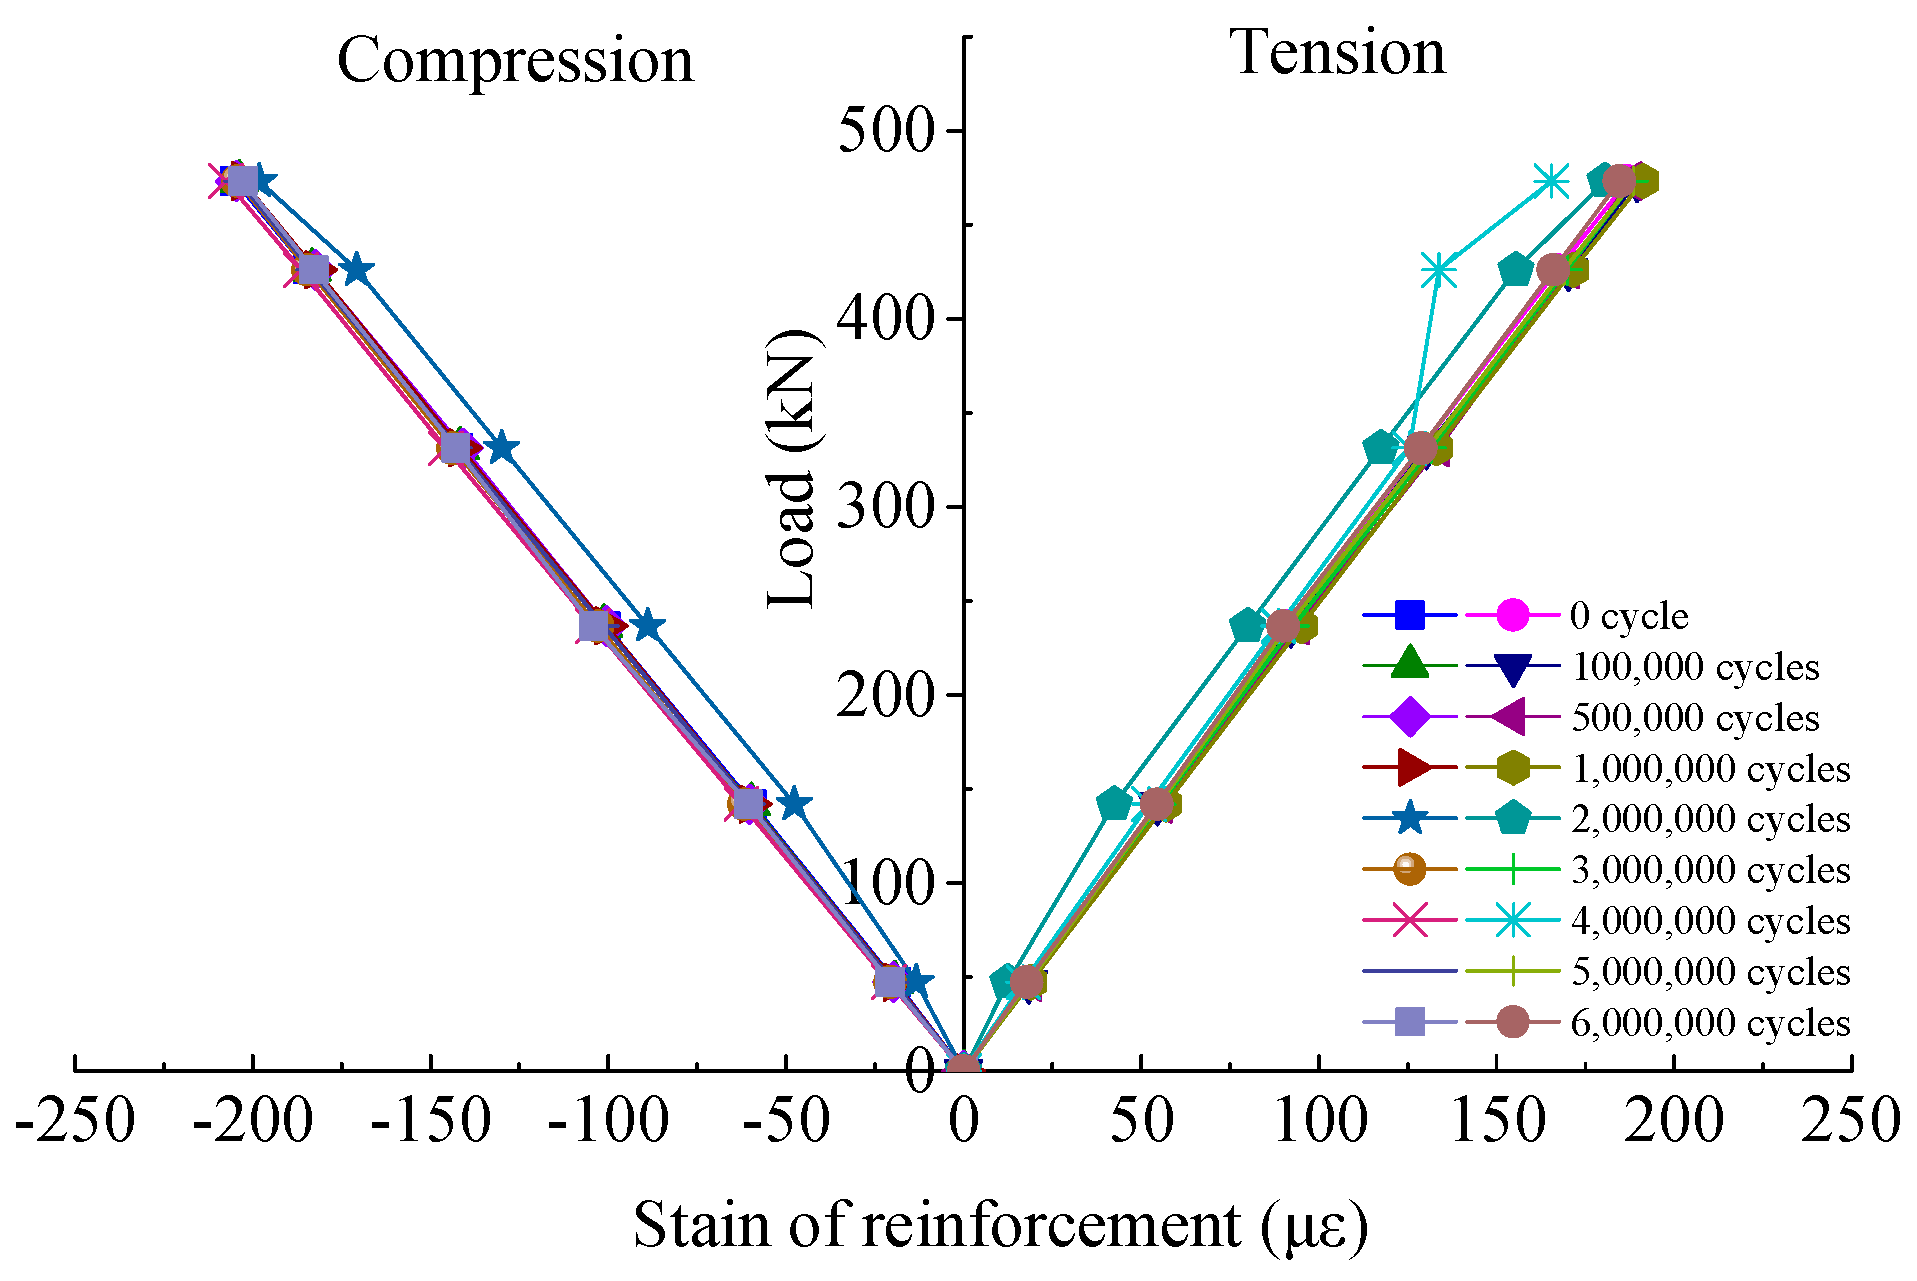
4.4. Strain of Reinforcement
4.5. Shear Strain of Shear-Bending Zone
5. Conclusions
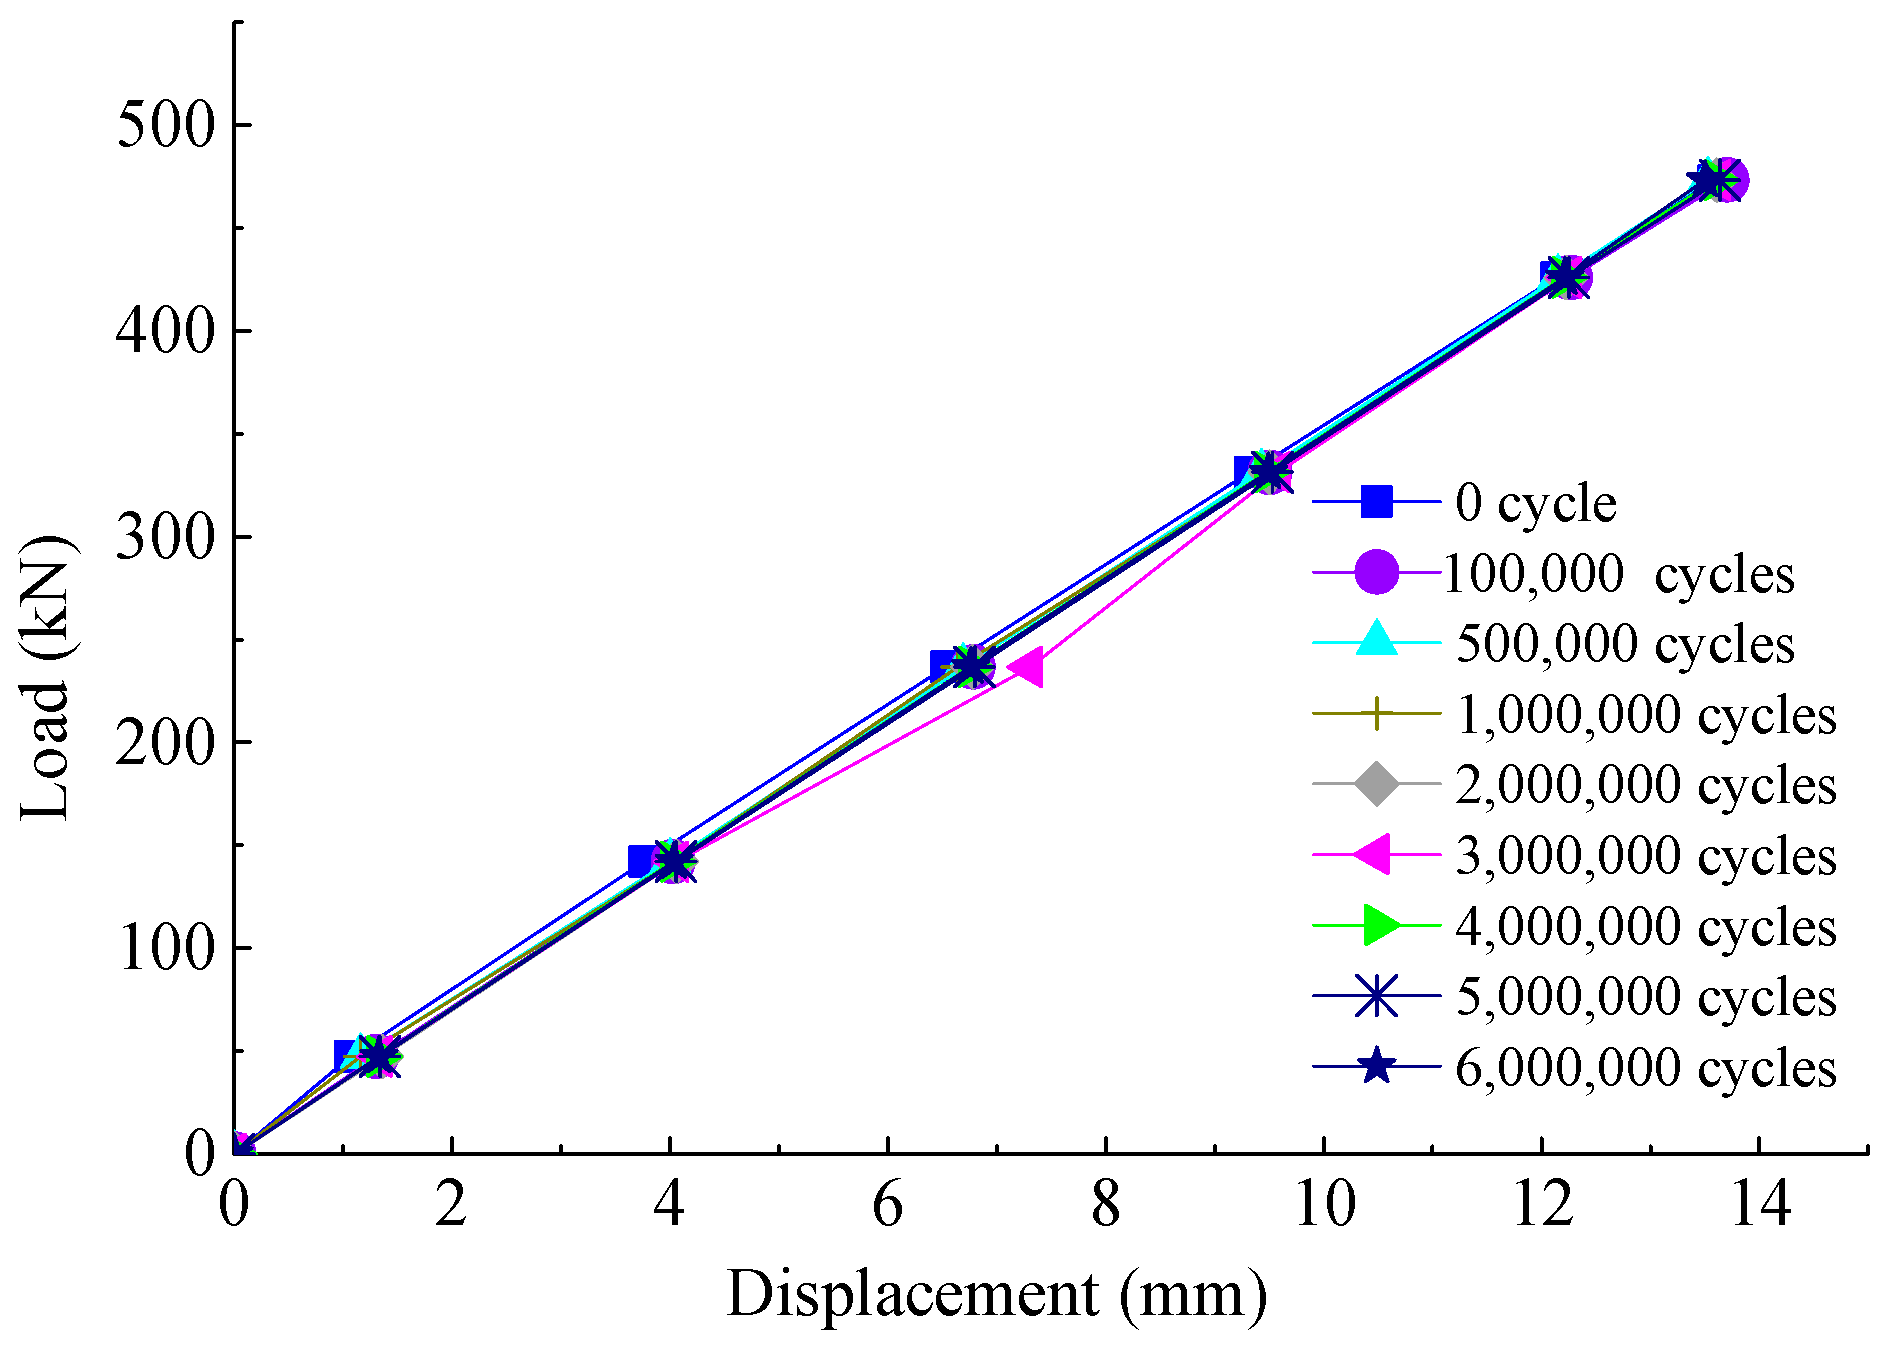
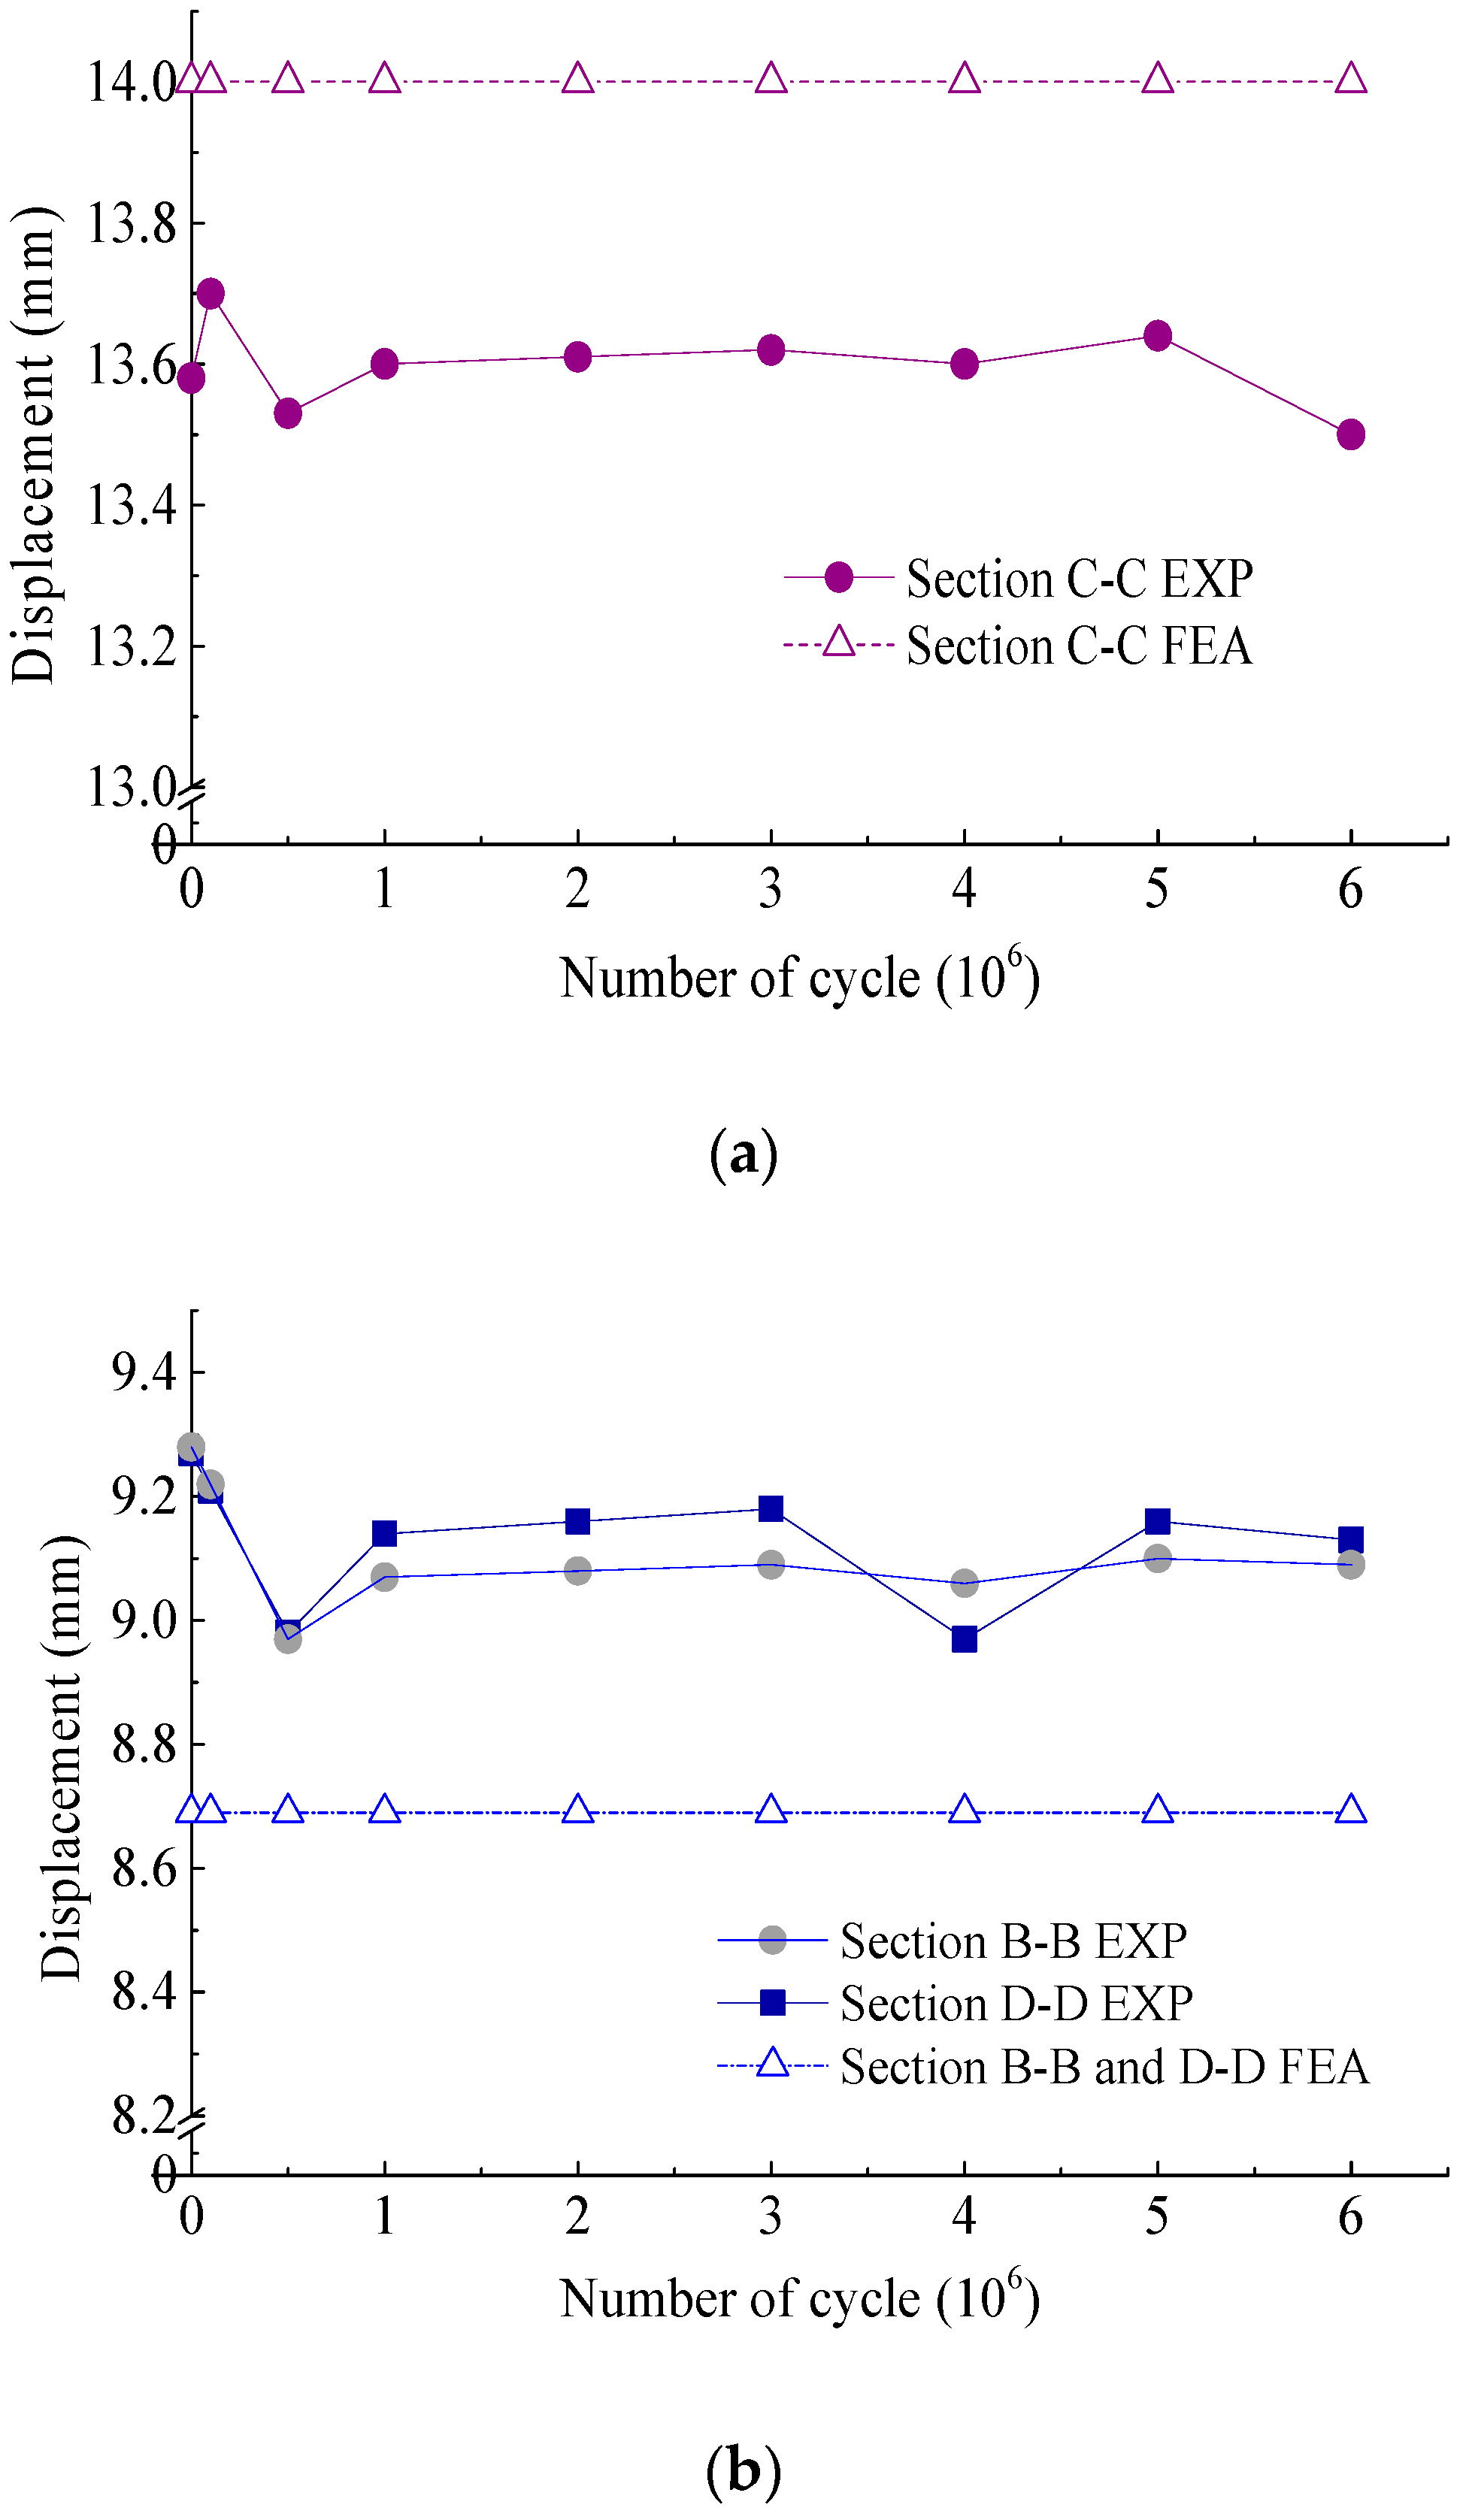
- The PC track beam for monorail behaved within the linear-elastic stage when subjected to repeated service loadings with the upper and lower limit of 39.97 kN and 348 kN, respectively. The displacement of midspan slightly fluctuates between 13.5 mm and 13.8 mm, indicating the good stiffness performance of the beam. The displacement predicted using the 3D finite element model which ignored the change of the stiffness is reasonably accurate compared with the measured results.
- No crack was observed throughout the test, even after 6,000,000 cycles of repeated loading, indicating the good crack resistance of the beam. As a fully PC beam, the specimen was conformed to the design intention and fabricated well.
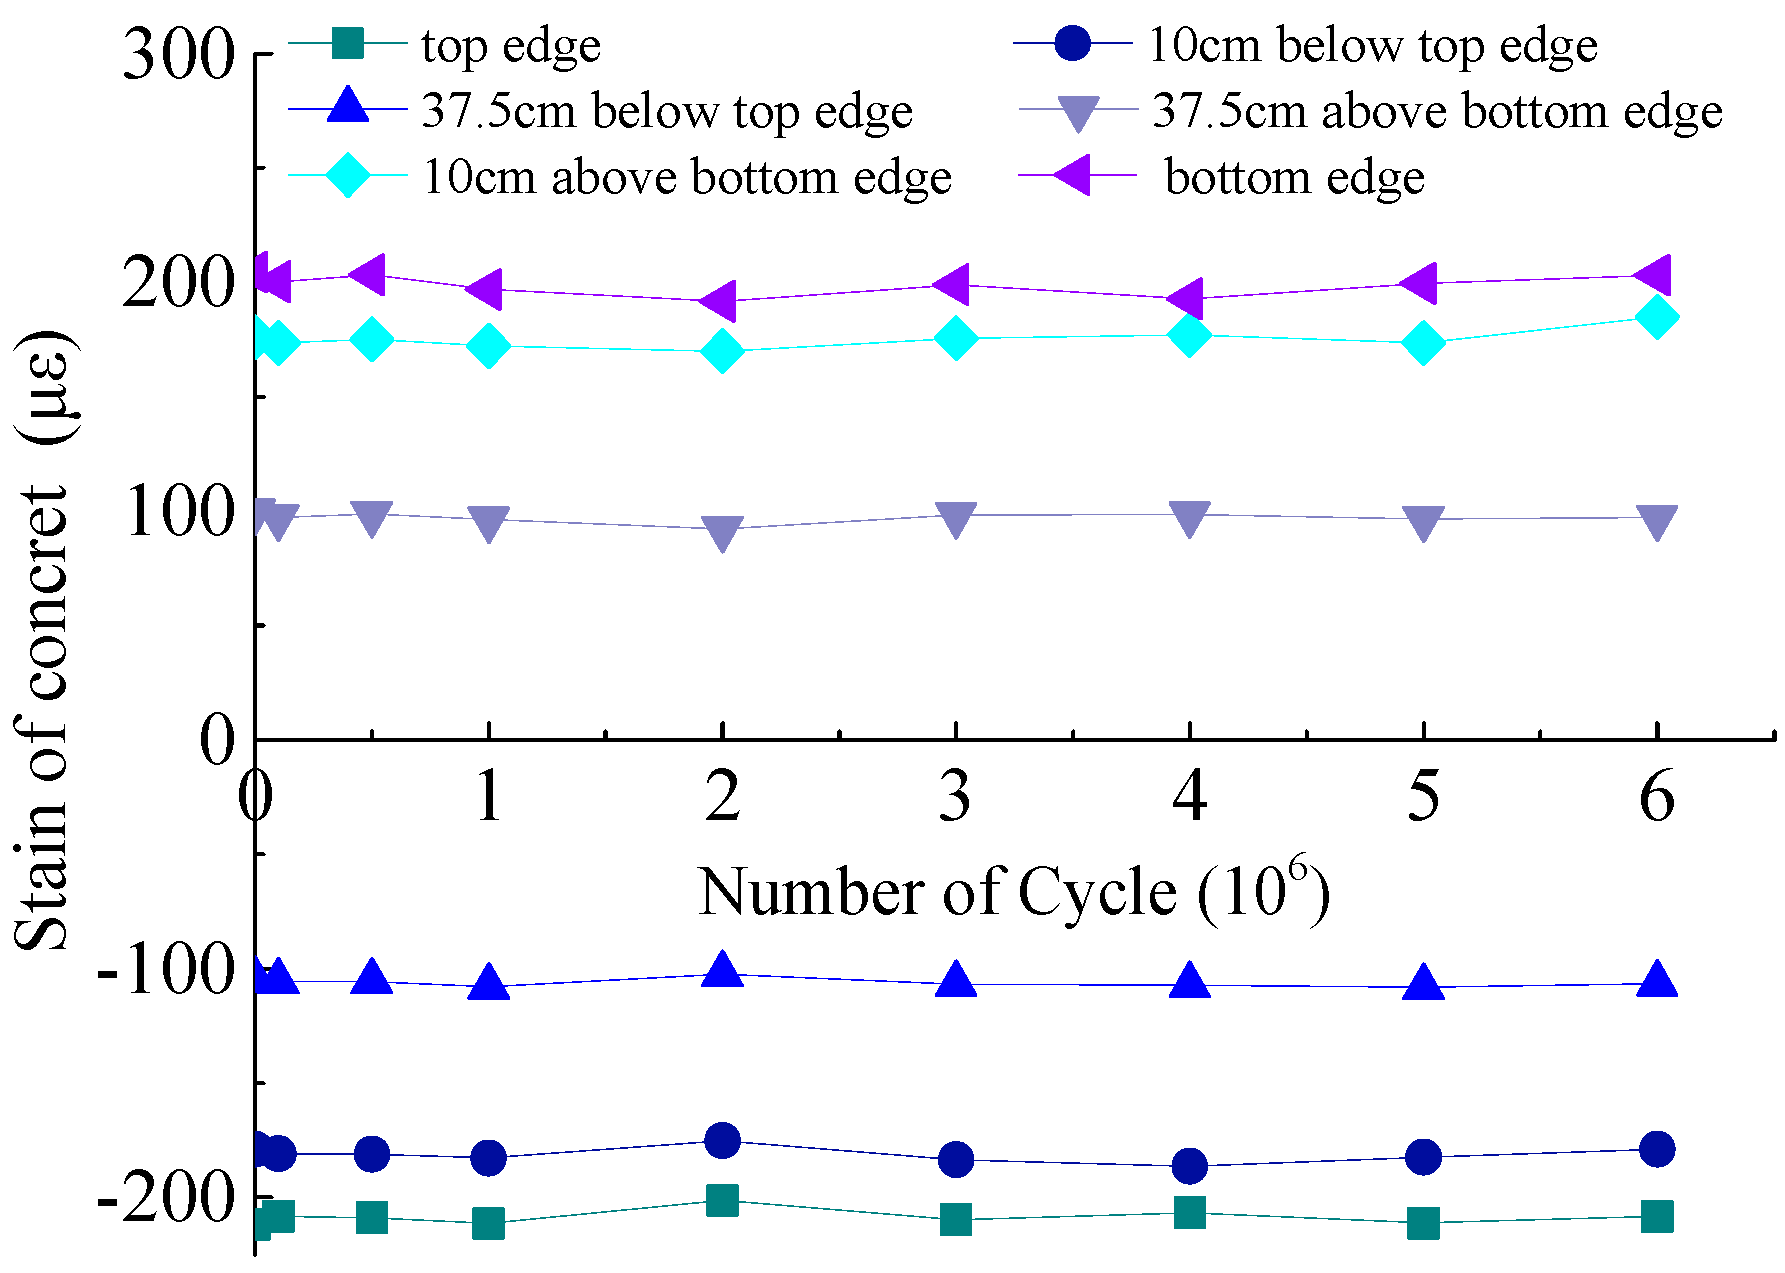
- The distribution of concrete strain remained linear during the whole process of the test, which is consistent with the assumption of plane section. The strain of reinforcement is a little different from that of concrete at the same height, and the ratio of the latter to the former ranges from 0.95 to 1.03, which indicates that the bond between concrete and reinforcement performed well throughout the test.
Author Contributions
Funding
Conflicts of Interest
References
- Wang, M.S. Development Orientation of Urban Transit in China. J. Railw. Eng. Soc. 2003, 3, 43–47. (In Chinese) [Google Scholar]
- Liu, X.; Liu, P.; Wang, Q.; Long, L. Feasibility Analysis on Application of Modified Concrete Contains Rubber Powder of Straddle Type Monorail Train Waste Tire. Procedia Environ. Sci. 2016, 31, 804–811. [Google Scholar] [CrossRef]
- Manoratna, D.A.; Kawata, K.; Yoshida, Y. Environmental Impact and Travel Time Savings of a New Monorail System in Colombo’s Commuting Traffic. Transp. Res. Part D Transp. Environ. 2017, 51, 122–128. [Google Scholar] [CrossRef]
- Kuwabara, T.; Hiraishi, M.; Goda, K.; Okamoto, S.; Ito, A.; Sugita, Y. New Solution for Urban Traffic: Small-type Monorail System. In Proceedings of the 10th International Conference on Automated People Movers, Orlando, FL, USA, 1–4 May 2005. [Google Scholar] [CrossRef]
- Yildiz, A.S.; Sivrioglu, S. Semi-Active Vibration Control of Lateral and Rolling Motions for a Straddle Type Monorail Vehicle. IFAC-Pap. Online 2016, 49, 279–284. [Google Scholar] [CrossRef]
- Zhong, M.L.; Zhu, E.Y. Development of Emergency Track Beam Alignment for Rapid Track Beam Replacement of Straddle Monorail Transit. J. Transp. Eng. 2013, 139, 416–423. [Google Scholar] [CrossRef]
- Song, A.; Wan, S.; Jiang, Z.; Xu, J. Residual Deflection Analysis in Negative Moment Regions of Steel-Concrete Composite Beams under Fatigue Loading. Constr. Build. Mater. 2018, 158, 50–60. [Google Scholar] [CrossRef]
- Hanson, J.M.; Hulsbos, C.L. Fatigue Tests of Two Prestressed Concrete I-Beams with Inclined Cracks. Highw. Res. Rec. 1965, 103, 14–30. [Google Scholar]
- Yuan, M.; Yan, D.; Zhong, H.; Liu, Y. Experimental Investigation of High-Cycle Fatigue Behavior for Prestressed Concrete Box-Girders. Constr. Build. Mater. 2017, 157, 424–437. [Google Scholar] [CrossRef]
- Muller, J.F.; Dux, P.F. Fatigue of Prestressed Concrete Beams with Inclined Strands. J. Struct. Eng. 1994, 120, 1122–1139. [Google Scholar] [CrossRef]
- Brenkus, N.R.; Wagner, D.J.; Hamilton, H.R. Experimental Evaluation of Flexural Static and Fatigue Strength of an Innovative Splice for Prestressed Precast Concrete Girders. J. Bridge Eng. 2016, 21, 04016017. [Google Scholar] [CrossRef]
- Rosenboom, O.; Rizkalla, S. Behavior of Prestressed Concrete Strengthened with Various CFRP Systems Subjected to Fatigue Loading. J. Compos. Constr. 2006, 10, 492–502. [Google Scholar] [CrossRef]
- Haraj1i, M.H.; Naaman, A.E. Static and Fatigue Tests on Partially Prestressed Beams. J. Struct. Eng. 1985, 111, 1602–1618. [Google Scholar] [CrossRef]
- Feng, X.; Song, Y.; Zhang, J.; Xiuhua, Q.U. Experimental Study on Stress Redistribution of Reinforcing Steel in Prestressed Concrete Beams under Fatigue Loading. J. Build. Struct. 2006, 27, 94–99. (In Chinese) [Google Scholar]
- Wollmann, G.P. Fretting Fatigue in Post-Tensioned Concrete Beams. Aci Struct. J. 1996, 93, 171. [Google Scholar]
- Li, J.Z.; Yu, Z.W.; Li, S. Stiffness degradation regularity of PC beam under fatigue repeated loading. J. Highw. Transp. Res. Dev. 2013, 30, 62–69. [Google Scholar]
- Naaman, A.E.; Founas, M. Partially prestressed beams under random-amplitude fatigue loading. J. Struct. Eng. 1991, 117, 3742–3761. [Google Scholar] [CrossRef]
- Saiedi, R.; Green, M.F.; Fam, A. Behavior of CFRP-Prestressed Concrete Beams under Sustained Load at Low Temperature. J. Cold Reg. Eng. 2013, 27, 1–15. [Google Scholar] [CrossRef]
- Saiedi, R.; Fam, A.; Green, M.F. Behavior of CFRP-Prestressed Concrete Beams under High-Cycle Fatigue at Low Temperature. J. Compos. Constr. 2011, 15, 482–489. [Google Scholar] [CrossRef]
- Huang, H.; Wang, W.W.; Dai, J.G.; Brigham, J.C. Fatigue behavior of reinforced concrete beams strengthened with externally bonded prestressed CFRP sheets. J. Compos. Constr. 2016, 21, 04016108. [Google Scholar] [CrossRef]
- Ye, H.W.; Li, C.J.; Pei, S.L.; Ummenhofer, T. Fatigue performance analysis of damaged steel beams strengthened with prestressed unbonded CFRP plates. J. Bridge Eng. 2018, 23, 04018040. [Google Scholar] [CrossRef]
- Gou, H.; Zhou, W.; Bao, Y.; Li, X.; Pu, Q. Experimental Study on Dynamic Effects of a Long-span Railway Continuous Beam Bridge. Appl. Sci. 2018, 8, 669. [Google Scholar] [CrossRef]
- Gou, H.; Zhou, W.; Yang, C.; Bao, Y.; Pu, Q. Dynamic response of long-span concrete-filled steel tube tied arch bridge and riding comfort of monorail trains. Appl. Sci. 2018, 8, 650. [Google Scholar] [CrossRef]
- Gou, H.Y.; He, Y.N.; Zhou, W.; Bao, Y.; Chen, G.D. Experimental and numerical investigations of the dynamic responses of an asymmetrical arch railway bridge. Proc. Inst. Mech. Eng. Part F J. Rail Rapid Transit 2018. [Google Scholar] [CrossRef]
- Gou, H.Y.; Zhou, W.; Chen, G.D.; Bao, Y.; Pu, Q.H. In-situ test and dynamic analysis of a double-deck tied-arch bridge. Steel Compos. Struct. 2018, 27, 161–175. [Google Scholar]
- Gou, H.Y.; Long, H.; Bao, Y.; Chen, G.D.; Pu, Q.H.; Kang, R. Experimental and numerical studies on stress distributions in girder-arch-pier connections of long-span continuous rigid frame arch railway bridge. J. Bridge Eng. 2018, 23, 04018039. [Google Scholar] [CrossRef]
- Gou, H.Y.; Wang, W.; Shi, X.Y.; Pu, Q.H.; Kang, R. Behavior of steel-concrete composite cable anchorage system. Steel Compos. Struct. 2018, 26, 115–123. [Google Scholar]
- Gou, H.Y.; Shi, X.Y.; Zhou, W.; Cui, K.; Pu, Q.H. Dynamic performance of continuous railway bridges: Numerical analyses and field tests. Proc. Inst. Mech. Eng. Part F J. Rail Rapid Transit 2018, 232, 936–955. [Google Scholar] [CrossRef]
- Cui, C.; Zhang, Q.; Luo, Y.; Hao, H.; Li, J. Fatigue reliability evaluation of deck-to-rib welded joints in osd considering stochastic traffic load and welding residual stress. Int. J. Fatigue 2018, 111, 151–160. [Google Scholar] [CrossRef]
- Zhang, Q.; Liu, Y.; Bao, Y.; Jia, D.; Bu, Y.; Li, Q. Fatigue performance of orthotropic steel-concrete composite deck with large-size longitudinal trough. Eng. Struct. 2017, 150, 864–874. [Google Scholar] [CrossRef]
- Chen, Z.; Cao, H.; Ye, K.; Zhu, H.; Li, S. Improved particle swarm optimization-based form-finding method for suspension bridge installation analysis. J. Comput. Civil. Eng. 2015, 9, 04014047. [Google Scholar] [CrossRef]
- Liu, F.; Zhou, J.; Yan, L. Study of stiffness and bearing capacity degradation of reinforced concrete beams under constant-amplitude fatigue. PLoS ONE 2018, 13, e0192797. [Google Scholar] [CrossRef] [PubMed]
- Hognestad, E. Study of Combined Bending and Axial Load in Reinforced Concrete Members; University of Illinois at Urbana Champaign: Champaign, IL, USA, 1951. [Google Scholar]
- Li, X.; Bao, Y.; Xue, N.; Chen, G. Bond strength of steel bars embedded in high-performance fiber-reinforced cementitious composite before and after exposure to elevated temperatures. Fire Saf. J. 2017, 92, 98–106. [Google Scholar] [CrossRef]
- Linares-Unamunzaga, A.; Gonzalo-Orden, H.; Minguela, J.; Pérez-Acebo, H. New Procedure for Compacting Prismatic Specimens of Cement-Treated Base Materials. Appl. Sci. 2018, 8, 970. [Google Scholar] [CrossRef]
- Neto, P.; Alfaiate, J.; Vinagre, J. Numerical modelling of concrete beams reinforced with pre-stressed CFRP. Key Eng. Mater. 2007, 348–349, 685–688. [Google Scholar] [CrossRef]
- Long, Y.Q. Structural Mechanics; Higher Education Press: Beijing, China, 2002. [Google Scholar]
- Fauchart, J.; Kavyrchine, M.; Trinh, J. Left bracket performance of prestressed and reinforced concrete joists under repeated loads right bracket. Ann. 1’ Inst. Tech. Batiment Trav. Publics 1975, 326, 21–31. [Google Scholar]
- Abeles, P.W.; Brown, E.L.; Hu, C.H. Behavior of under-reinforced prestressed concrete beams subjected to different stress ranges. ACI 1974, SP41-12, 237–277. [Google Scholar]
- Sun, W.W.; Wei, F. Numerical investigation of the effects of connection rotational stiffness on block shear capacity of coped beams with a welded end connection. Int. J. Steel Struct. 2011, 11, 325. [Google Scholar] [CrossRef]


| Identifier | N1 | N2 | N3 | N4 | N5 | N6 |
|---|---|---|---|---|---|---|
| Diameter (mm) | C16 | C16 | C16 | C12 | C12 | C12 |
| Length of Each (mm) | 4414 | 994 | 23,890 | 3674 | 3784 | 23,892 |
| Number | 142 | 516 | 40 | 58 | 82 | 18 |
| Tendon | Specification | Control Stress for Prestressing (MPa) | Elongation (mm) | Tensioning Arrangement | |
|---|---|---|---|---|---|
| Left | Right | ||||
| P1 | 7-7ϕ5 | 1361 | 78.8 | 78.8 | 4 |
| P2 | 7-7ϕ5 | 1361 | 78.7 | 78.7 | 2 |
| P3 | 7-7ϕ5 | 1361 | 78.5 | 78.5 | 5 |
| P4 | 4-7ϕ5 | 1361 | 78.2 | 78.2 | 1 |
| P5 | 3-7ϕ5 | 1361 | 78.0 | 78.0 | 3 |
| Tendon | H1 | H2 | H3 | L1 | L2 |
|---|---|---|---|---|---|
| P1 | 1245 | 705 | 670 | 6395 | 4639 |
| P2 | 995 | 595 | 530 | 5092 | 5943 |
| P3 | 745 | 425 | 390 | 3788 | 7246 |
| P4 | 495 | 285 | 250 | 2484 | 8550 |
| P5 | 245 | 145 | 110 | 1180 | 9854 |
| Test | Fatigue Load | Post-Fatigue Static Load | |||||||||
|---|---|---|---|---|---|---|---|---|---|---|---|
| grade | min | max | 1 | 2 | 3 | 4 | 5 | 6 | 7 | 8 | 9 |
| Load (kN) | 39.97 | 347.95 | 0 | 47.3 | 142.0 | 236.6 | 331.3 | 425.9 | 473.3 | 236.6 | 0 |
| Cycles (106) | 0 | 10 | 50 | 100 | 200 | 300 | 400 | 500 | 600 |
|---|---|---|---|---|---|---|---|---|---|
| Fixed (degrees) | 0.099 | 0.099 | 0.098 | 0.101 | 0.099 | 0.101 | 0.101 | 0.100 | 0.101 |
| Movable (degrees) | 0.095 | 0.100 | 0.100 | 0.100 | 0.099 | 0.099 | 0.097 | 0.101 | 0.101 |
| Cycles (106) | 0 | 10 | 50 | 100 | 200 | 300 | 400 | 500 | 600 |
|---|---|---|---|---|---|---|---|---|---|
| Bending Stiffness (106 kN m) | 17.69 | 17.53 | 17.75 | 17.66 | 17.65 | 17.63 | 17.66 | 17.61 | 17.79 |
| Rotational Stiffness (106 kN m/rad) | 2.82 | 2.75 | 2.76 | 2.72 | 2.76 | 2.73 | 2.76 | 2.72 | 2.71 |
| Section B-B | Section C-C | Section D-D | ||||
|---|---|---|---|---|---|---|
| cycle | 0 | 6,000,000 | 0 | 6,000,000 | 0 | 6,000,000 |
| () | 196.6 | 181.0 | 185.96 | 182.82 | 182.34 | 184.19 |
| 190.2 | 189.9 | 186.84 | 184.54 | 185.68 | 194.43 | |
| 1.03 | 0.95 | 0.99 | 0.99 | 0.98 | 0.95 | |
© 2018 by the authors. Licensee MDPI, Basel, Switzerland. This article is an open access article distributed under the terms and conditions of the Creative Commons Attribution (CC BY) license (http://creativecommons.org/licenses/by/4.0/).
Share and Cite
Pu, Q.; Wang, H.; Gou, H.; Bao, Y.; Yan, M. Fatigue Behavior of Prestressed Concrete Beam for Straddle-Type Monorail Tracks. Appl. Sci. 2018, 8, 1136. https://doi.org/10.3390/app8071136
Pu Q, Wang H, Gou H, Bao Y, Yan M. Fatigue Behavior of Prestressed Concrete Beam for Straddle-Type Monorail Tracks. Applied Sciences. 2018; 8(7):1136. https://doi.org/10.3390/app8071136
Chicago/Turabian StylePu, Qianhui, Hanyu Wang, Hongye Gou, Yi Bao, and Meng Yan. 2018. "Fatigue Behavior of Prestressed Concrete Beam for Straddle-Type Monorail Tracks" Applied Sciences 8, no. 7: 1136. https://doi.org/10.3390/app8071136
APA StylePu, Q., Wang, H., Gou, H., Bao, Y., & Yan, M. (2018). Fatigue Behavior of Prestressed Concrete Beam for Straddle-Type Monorail Tracks. Applied Sciences, 8(7), 1136. https://doi.org/10.3390/app8071136